Article

Multi-Level and Multiple Aspect Semantic Trajectory Model: Application to the Tourism Domain

1
L3i, Faculty of Science and Technology, La Rochelle University, 17000 La Rochelle, France
2
LIUPPA, E2S, STEE School, University of Pau and Pays Adour (UPPA), 64000 Pau, France
3
STEE School, University of Pau and Pays Adour (UPPA), 64000 Pau, France
*
Author to whom correspondence should be addressed.
ISPRS Int. J. Geo-Inf. 2021, 10(9), 592; https://doi.org/10.3390/ijgi10090592
Submission received: 29 June 2021 / Revised: 26 August 2021 / Accepted: 3 September 2021 / Published: 8 September 2021
(This article belongs to the Special Issue Spatio-Temporal Models and Geo-Technologies)

Abstract

:
Here we design a semantic trajectory model responding to specific needs expressed by tourism analyst experts. Thus, this model takes into account: (i) the description of sequences of imbricated semantic segments, (ii) the definition of enrichment data integrating spatial, temporal and thematic dimensions and (iii) the association of such data with positions or with trajectory segments. Each of these features is necessary for the processing and analysis of tourist mobility data, which we will detail. For validation purposes, we experiment our model on two outdoor mobility track scenarios computed in a processing chain. We also show that our model is generic and extensible thanks to two other scenarios on different datasets.

1. Introduction

The Nouvelle Aquitaine DA3T regional project (in English, Device for the Analysis of Digital Tracks for the Valuation of Touristic Territories) aims at improving the management and the valorization of the coastal tourist territories of Nouvelle Aquitaine by exploiting both indoor and outdoor touristic mobility tracks and contextual data. We have datasets from various sources describing touristic trips (e.g., mobility tracks in the city of La Rochelle or mobility tracks within the Bordeaux Wine City). In order to meet the project objective, geographers and computer scientists wish to devise methods and tools that will allow manual and automatic processing of mobility tracks. Our results will allow the extraction of knowledge that is useful to the actors of territorial planning.
In this paper, we use outdoor mobility tracks from volunteer tourists. They agreed to use Geoluciole, our mobile application for capturing spatio-temporal positions, during their visit in the city but also to participate in an oral interview conducted at the end of their stay in order to complete the raw mobility tracks. In our work, we need mobility representations of various granularities (e.g., sequences of positions, set of trajectory, sequences of trajectory segments, etc.). The representation of computed data (e.g., speed) or contextual data from external resources (e.g., weather) is also important to enrich the movement. This data will be associated with positions or trajectory segments. Thus, we describe a mobility track through different sequences of trajectory segments annotated with semantic features. These segments represent movement characteristics: (i) disjoint semantic segments (e.g., “the tourist walks in the street then goes to the museum”); (ii) imbricated semantic segments (e.g., “at the end of their visit, the tourist buys a book in the museum store”). The model we propose addresses two main challenges concerning the description of raw mobility data, on the one hand, and the description of associated semantic features, on the other hand. Therefore, a semantic trajectory is described as a sequence of disjoint or imbricated semantic segments. As these semantic segments can be imbricated, we speak of multi-level trajectory. Each segment has semantic features with spatial, temporal and thematic dimensions so any type of real-world phenomenon can be described to enrich trajectories. We speak of multiple aspect trajectory.
The article is organized as follows. Section 2 describes the work on mobility data by first stating some key definitions and then discussing the modeling of semantic trajectories in the literature. Section 3 outlines the motivating scenario of the DA3T project by describing the data manipulated (i.e., touristic mobility tracks as well as potential enrichment data) and then specifying the needs of geographers and planners in terms of semantic trajectory modeling. The research challenges are then presented. Section 4 presents our contribution: the DA3T model dedicated to the representation of semantic trajectories. 
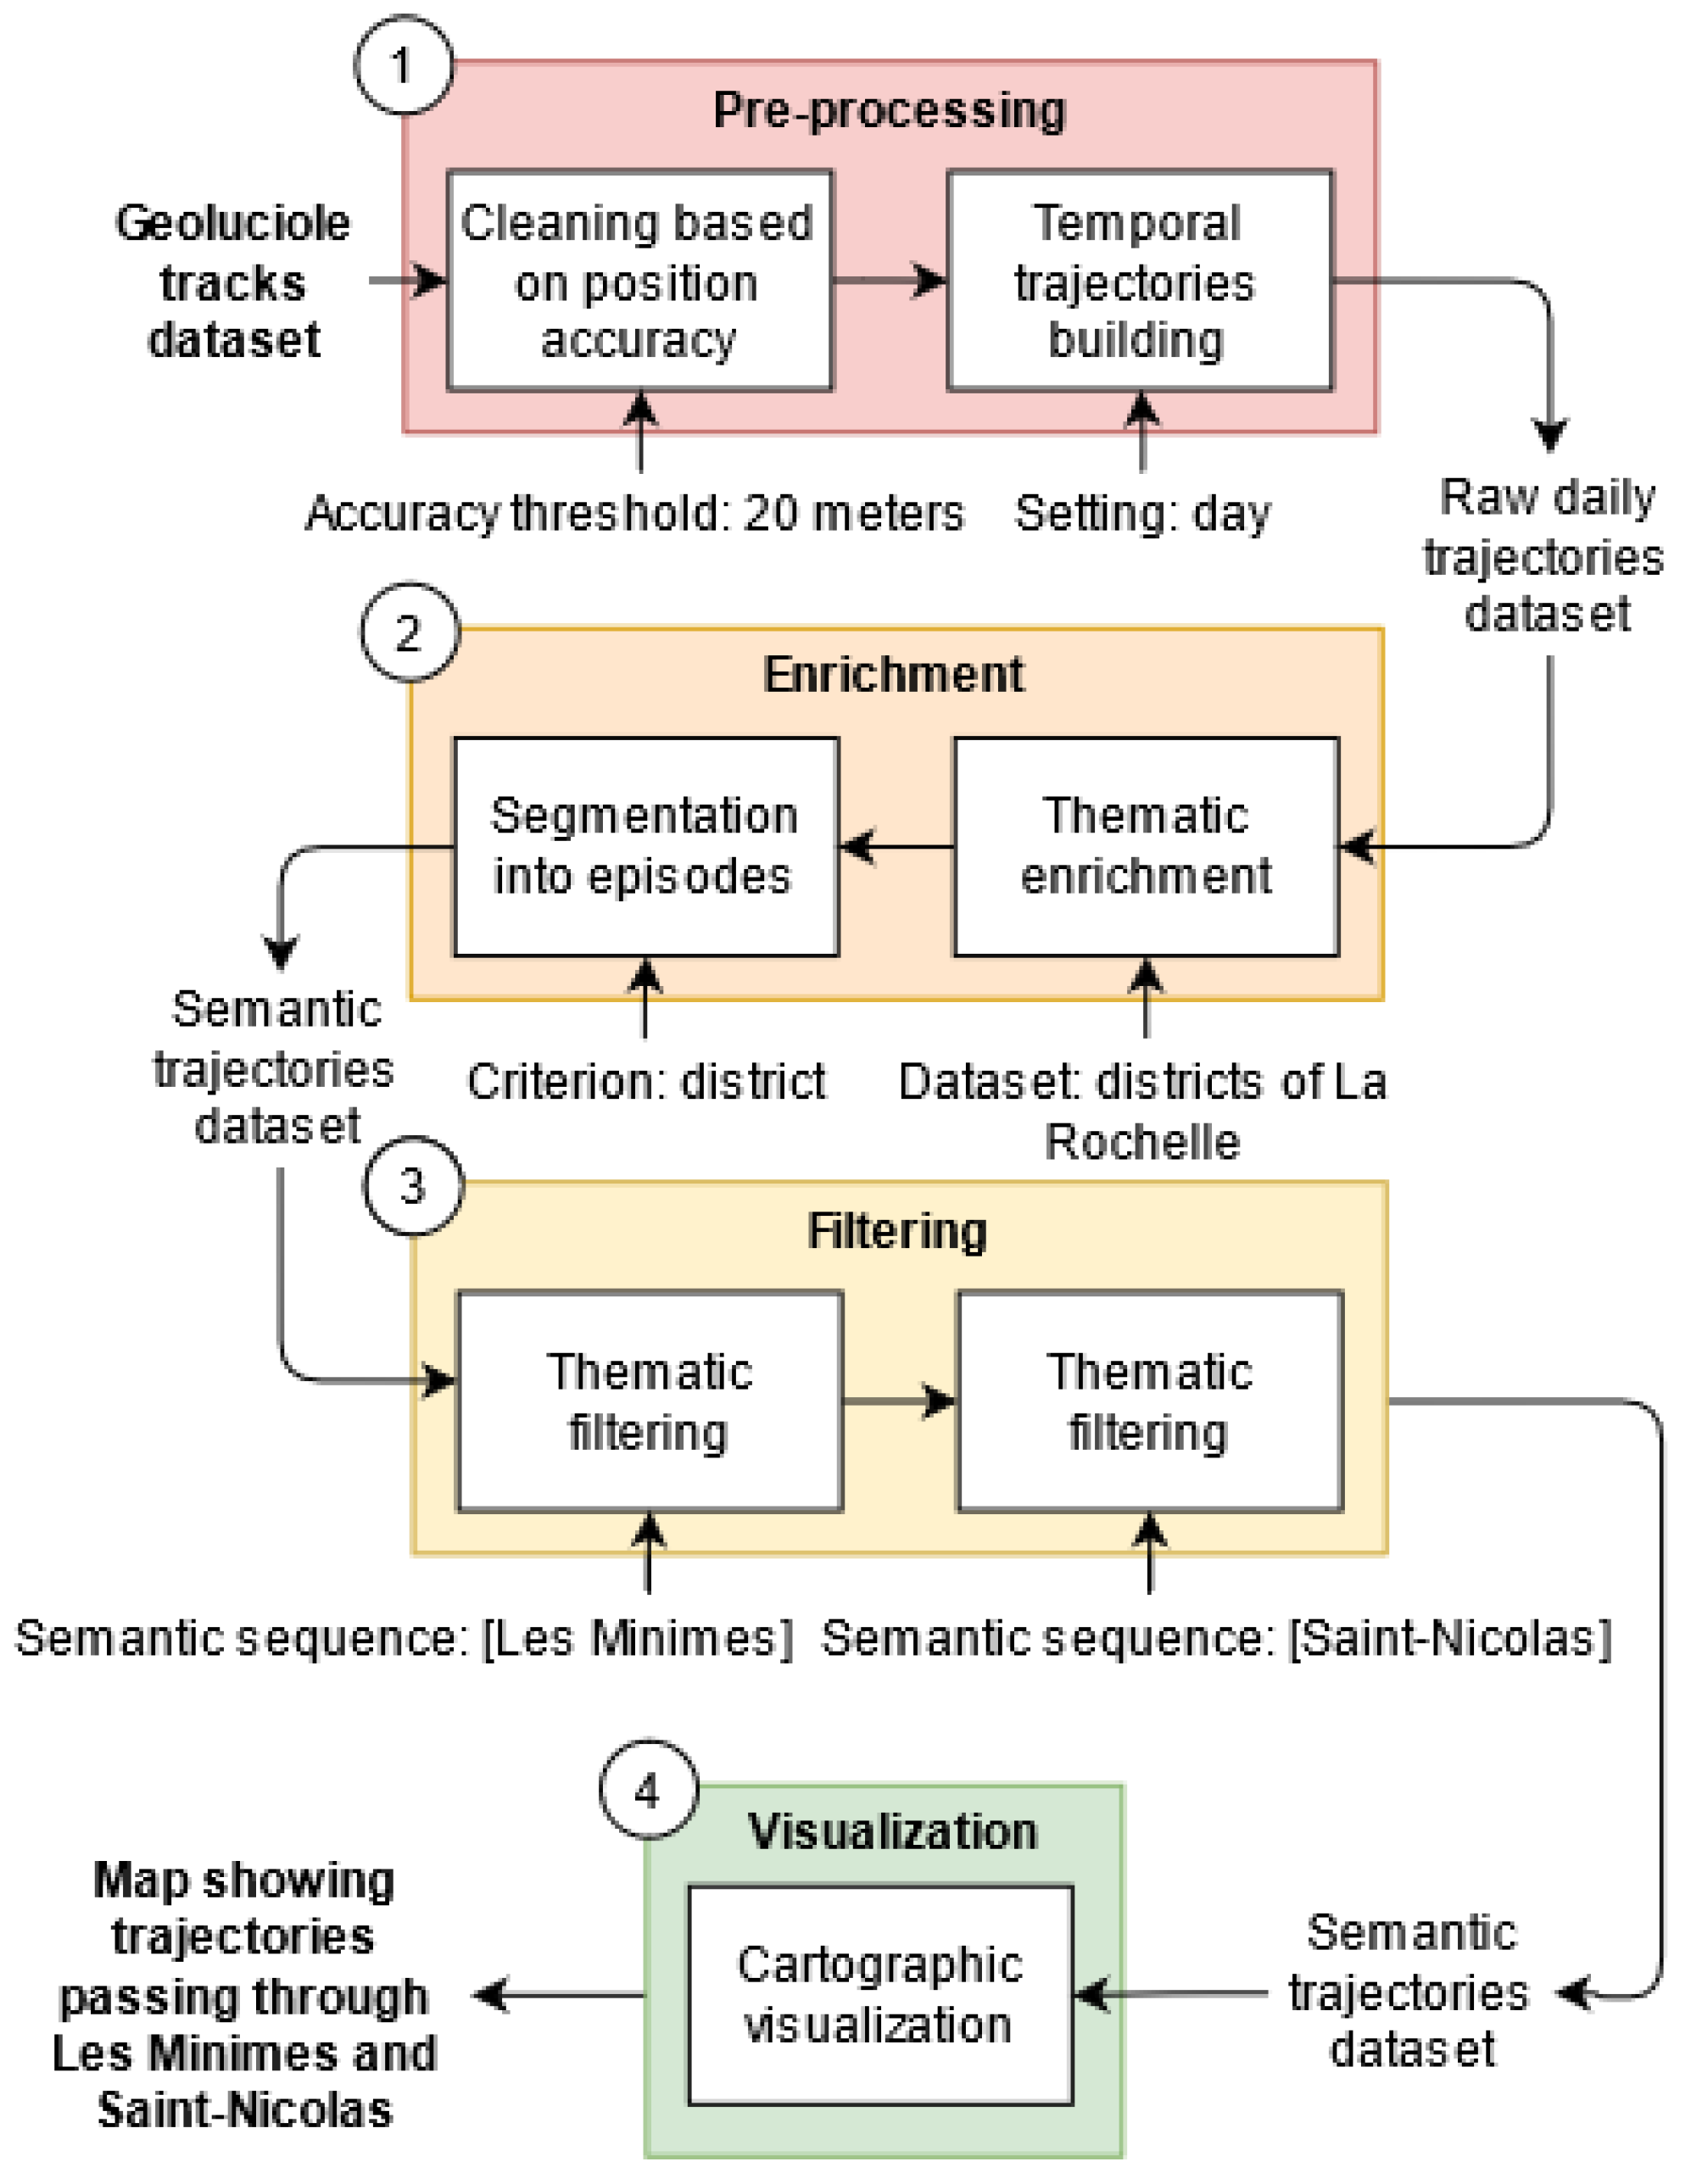
Section 5 tests the DA3T model through several experimentations: two experimentations, based on visit data from the city of La Rochelle, aim at validating the multi-level and multiple aspect dimensions of our model; two other experimentations, based on data from other application domains, test the genericity of the model. Finally, Section 6 concludes and presents the future work perspectives.

2. Related Work

2.1. Some Definitions

Movement is a continuous phenomenon by nature that can be observed everywhere in our physical environment. To facilitate the capture and storage of a movement, it is discretized; i.e., it is represented as a sequence of geolocalized and time-stamped positions, called mobility track. Thus, a position p of a moving object o at a time t is defined as a tuple p = ( o , x , y , t , D ) with x and y the spatial coordinates (whether geographic or plane), t the time of the capture, and D a set of complementary data captured along with the position (e.g., velocity, accuracy, etc.).
According to [1], the raw trajectory of a moving object is a part of the mobility track that is of interest to a given application. In our context—tourists from the city of La Rochelle—raw trajectories can be defined from mobility tracks on a temporal criterion (e.g., one trajectory per day) or on a spatial criterion (e.g., a trajectory composed only of positions included in the spatial polygon corresponding to the city of La Rochelle).
The raw trajectory is generally not complete enough to understand all the issues of a movement. This observation led to the creation of the concept of semantic trajectory [1] which proposes to link semantic data either to the trajectory, to a segment of the trajectory (i.e., a sequence of consecutive positions), or to a position of the trajectory. Semantic data is simple or complex. A simple semantic datum describes a real-world object in the form of a textual annotation (e.g., the St. Nicolas Tower can be described by its name). A complex semantic datum, on the other hand, describes a real-world object in the form of an aggregate of features (i.e., a set of data of different types). In the latter case, we speak of semantic aspect (e.g., a point of interest can be described by its name, its location, its opening hours, etc.). A segment of the trajectory whose positions are associated with the same semantic data is commonly called an episode [2].
To go from a raw trajectory to a semantic trajectory, several enrichment processes can be implemented. For example, the segmentation is the process of dividing the trajectory into semantic episodes according to one or more specific criteria. The annotation (manual or automatic) is the process of associating semantic data with the trajectory, a trajectory segment or a trajectory position. These two processes can be confused; it is possible to annotate and then segment a trajectory into episodes with the same criterion. A trajectory interpretation is a sequence of episodes obtained after segmentation of the trajectory [3].
In the following, we present semantic trajectory models that can be used in the domain of tourism.

2.2. Semantic Trajectory Models

We have identified three categories of semantic trajectory models. (i) The first one is dedicated to the segmentation of trajectory into a sequence of stops and moves. (ii) The second one aims at segmenting trajectory into a sequence of semantic episodes. (iii) The third one models real world phenomena for enrichment purposes but independently of any trajectory and trajectory segmentation.
Regarding the first category (i), [4] introduces a model based on stops and moves that segments the trajectory into stop and move episodes. This model enriches each segment with textual annotations (simple semantic data). Note that the episodes thus manipulated are always limited to annotated stops and moves. It has been used in many other works [5,6,7].
The second category (ii) aims at segmenting a trajectory into a sequence of semantic episodes. Episode segmentation can be based on previous enrichment (e.g., it may be relevant to perform an enrichment and a segmentation of the trajectory based on touristic activities). For example, the Baquara 2 ontology [8] and the STEP ontology [9] rely on the notion of semantic episode to build semantic trajectories. Regardless of category, Refs. [8,9] also incorporate a hierarchy between episodes in which they can be decomposed into sub-episodes.
Finally, the third category (iii) models real-world phenomena for enrichment purposes but independently of any trajectory and trajectory segmentation. The annotation of one or several trajectories or positions is done a posteriori. In 2019, the MASTER model [10] presents a new approach based on the enrichment of the complete trajectory or individual positions with complex semantic data. These enriched trajectories are called multiple aspect trajectories. Thus, a trajectory is enriched with real-world objects that are relevant to the analysis, called aspects. An aspect can be attached to one or more trajectories or to one or more trajectory positions. Note that an aspect can have an existence without being attached to trajectories or positions (e.g., the “Lantern Tower” aspect is first described independently of any trajectory but can then be attached to trajectories or positions). In the MASTER model aspects have attributes that have textual values only.

3. Motivation Scenario

The motivation scenario from the DA3T project is divided into three parts. The first part describes the characteristics of the data manipulated in the framework of the project. The second part expresses the requirements of geographers and planners in terms of representation and processing of these data. Lastly, the third part highlights the corresponding scientific challenges.

3.1. Tourist Mobility Tracks and Enrichment Data

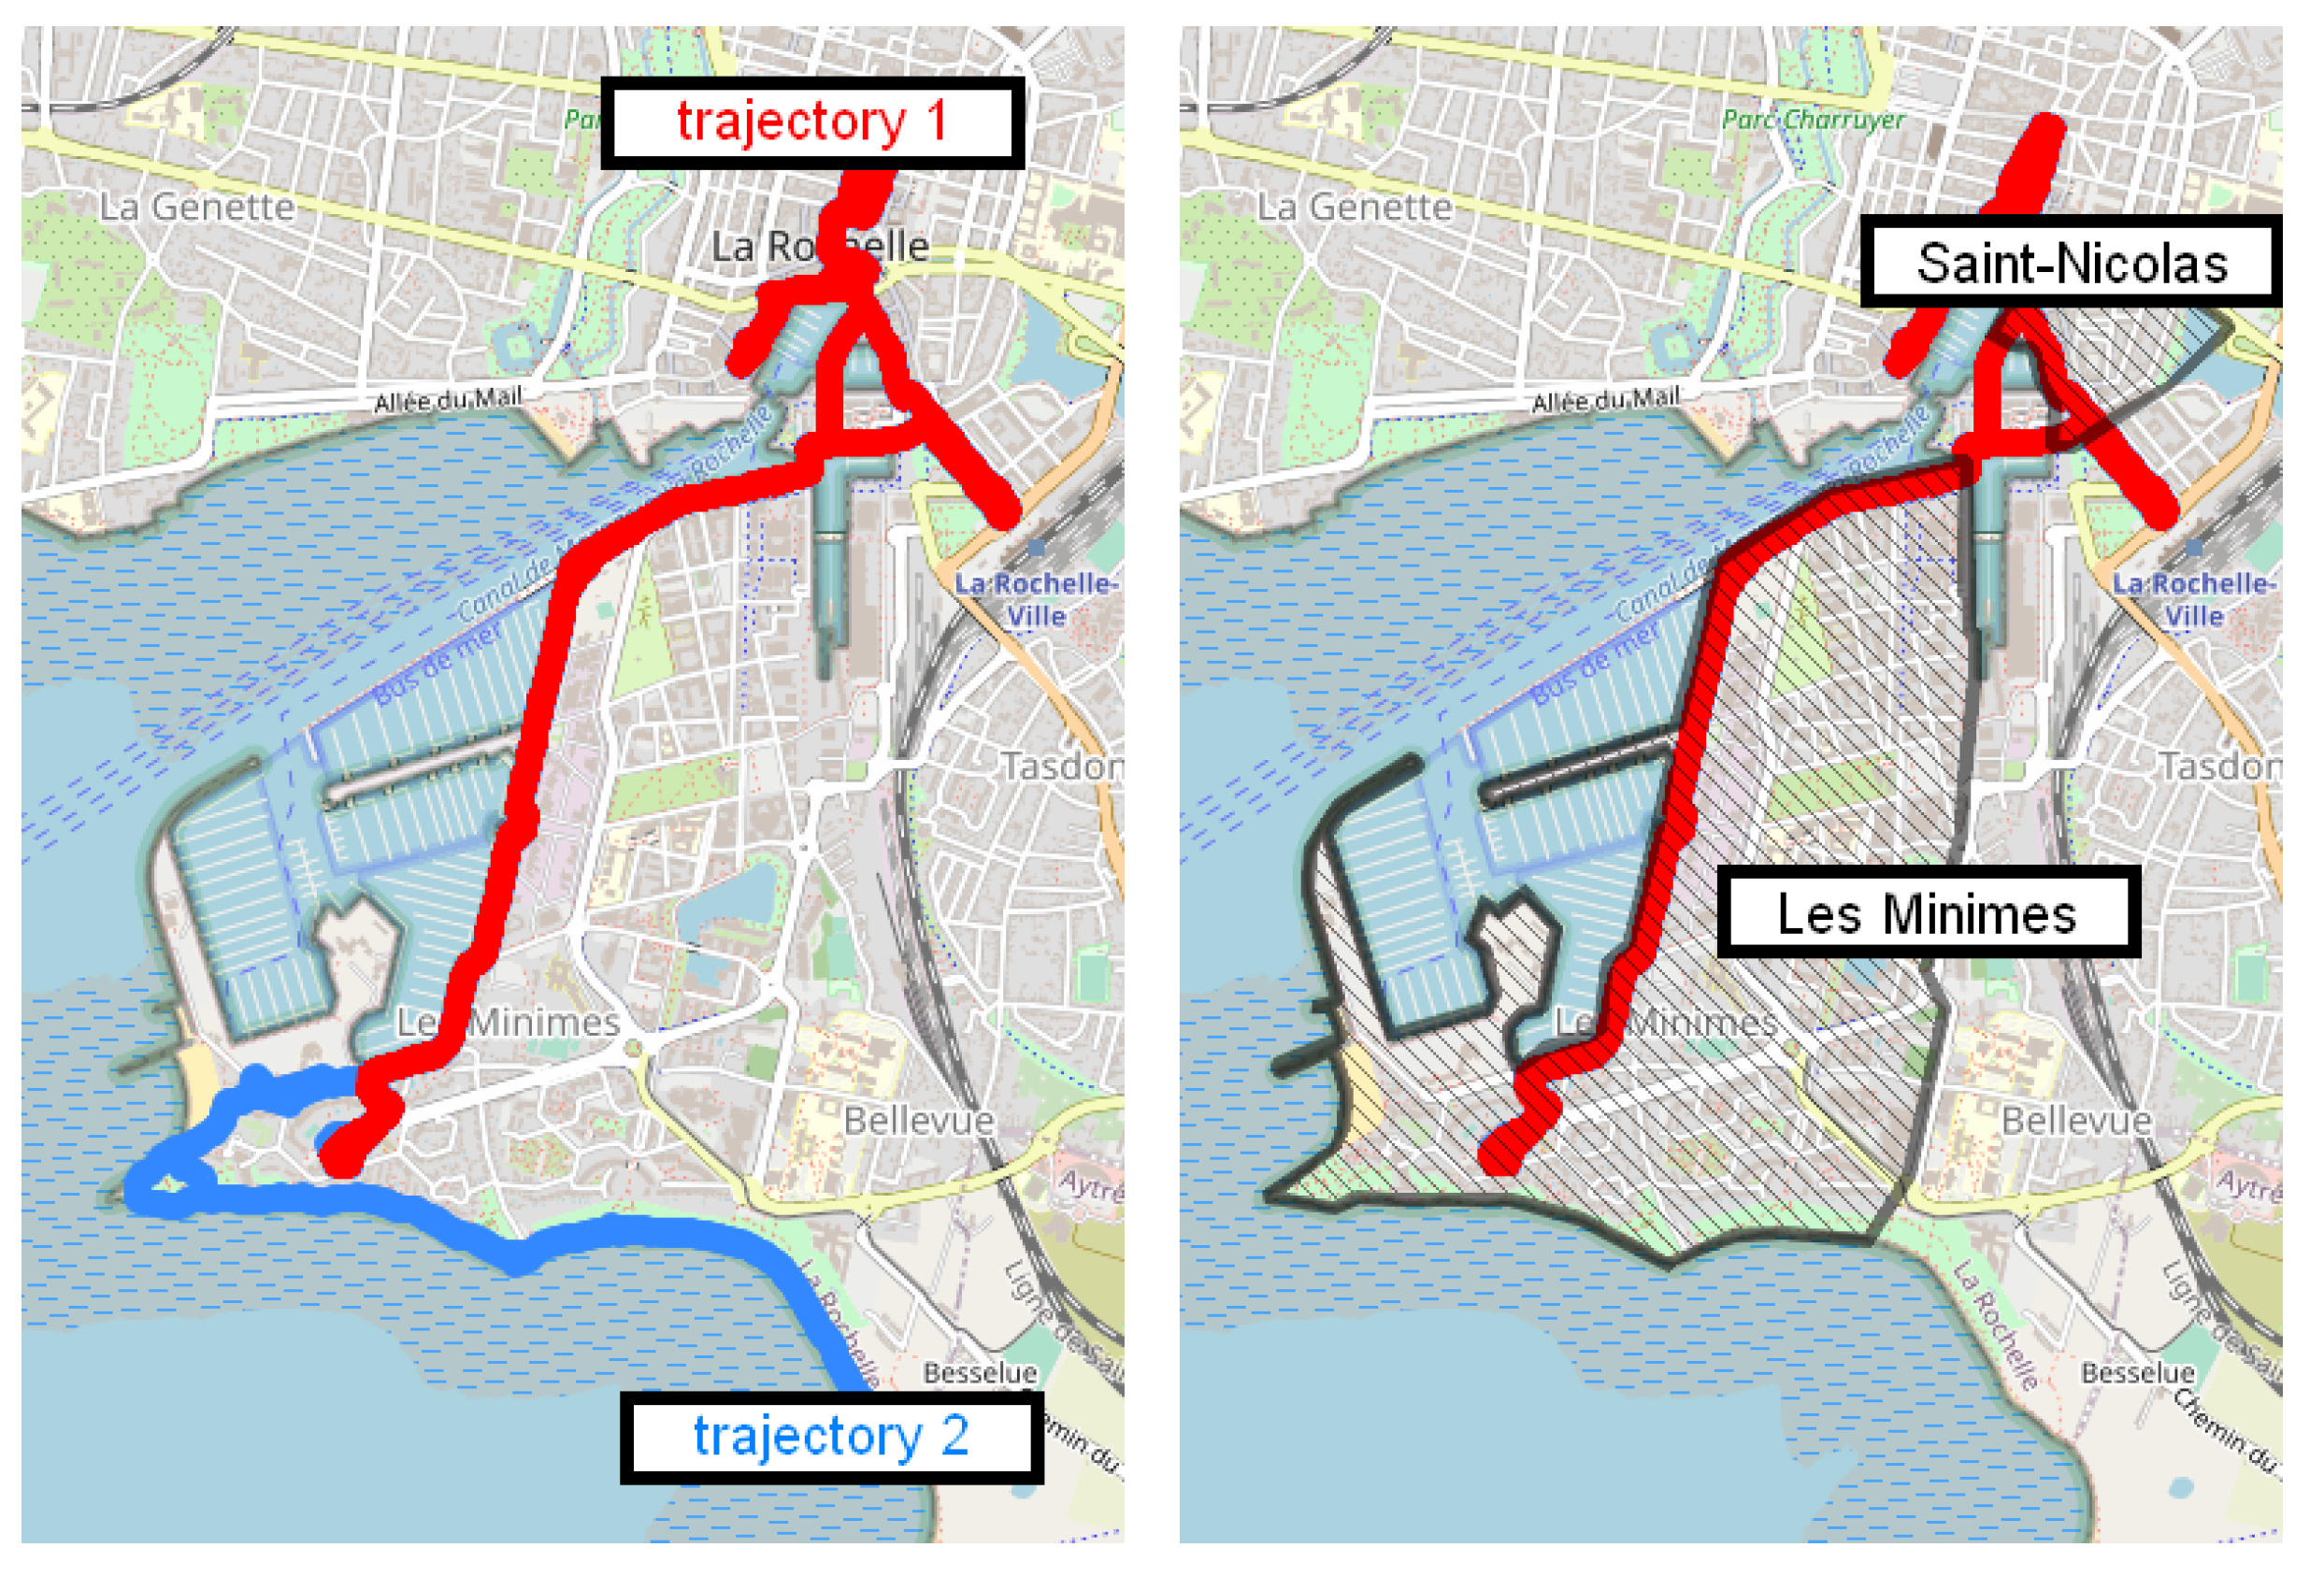
We collected data from three distinct source categories: (i) mobility tracks of tourists to the city of La Rochelle from a mobile application, (ii) interview transcripts of all or part of these same tourists, and (iii) contextual data allowing the enrichment of this dataset (e.g., weather, division of the city into districts, events, points of interest, etc.) collected/extracted from Open Data.
Our data collection process went through several steps: (1) promotion of our project to tourists in the tourist offices of La Rochelle, (2) collection of mobility tracks of volunteer tourists thanks to the mobile application Geoluciole which, at regular time intervals, captures the position of the phone (i.e., of its bearer), (3) realization, a posteriori, of semi-directive interviews with these same tourists to ask for precisions and explanations on their movements and, finally, (4) research, in the Open Data, of contextual data in connection with the city. At the end of the process, we had a set of raw mobility tracks, collected through Geoluciole, interviews and various contextual data.
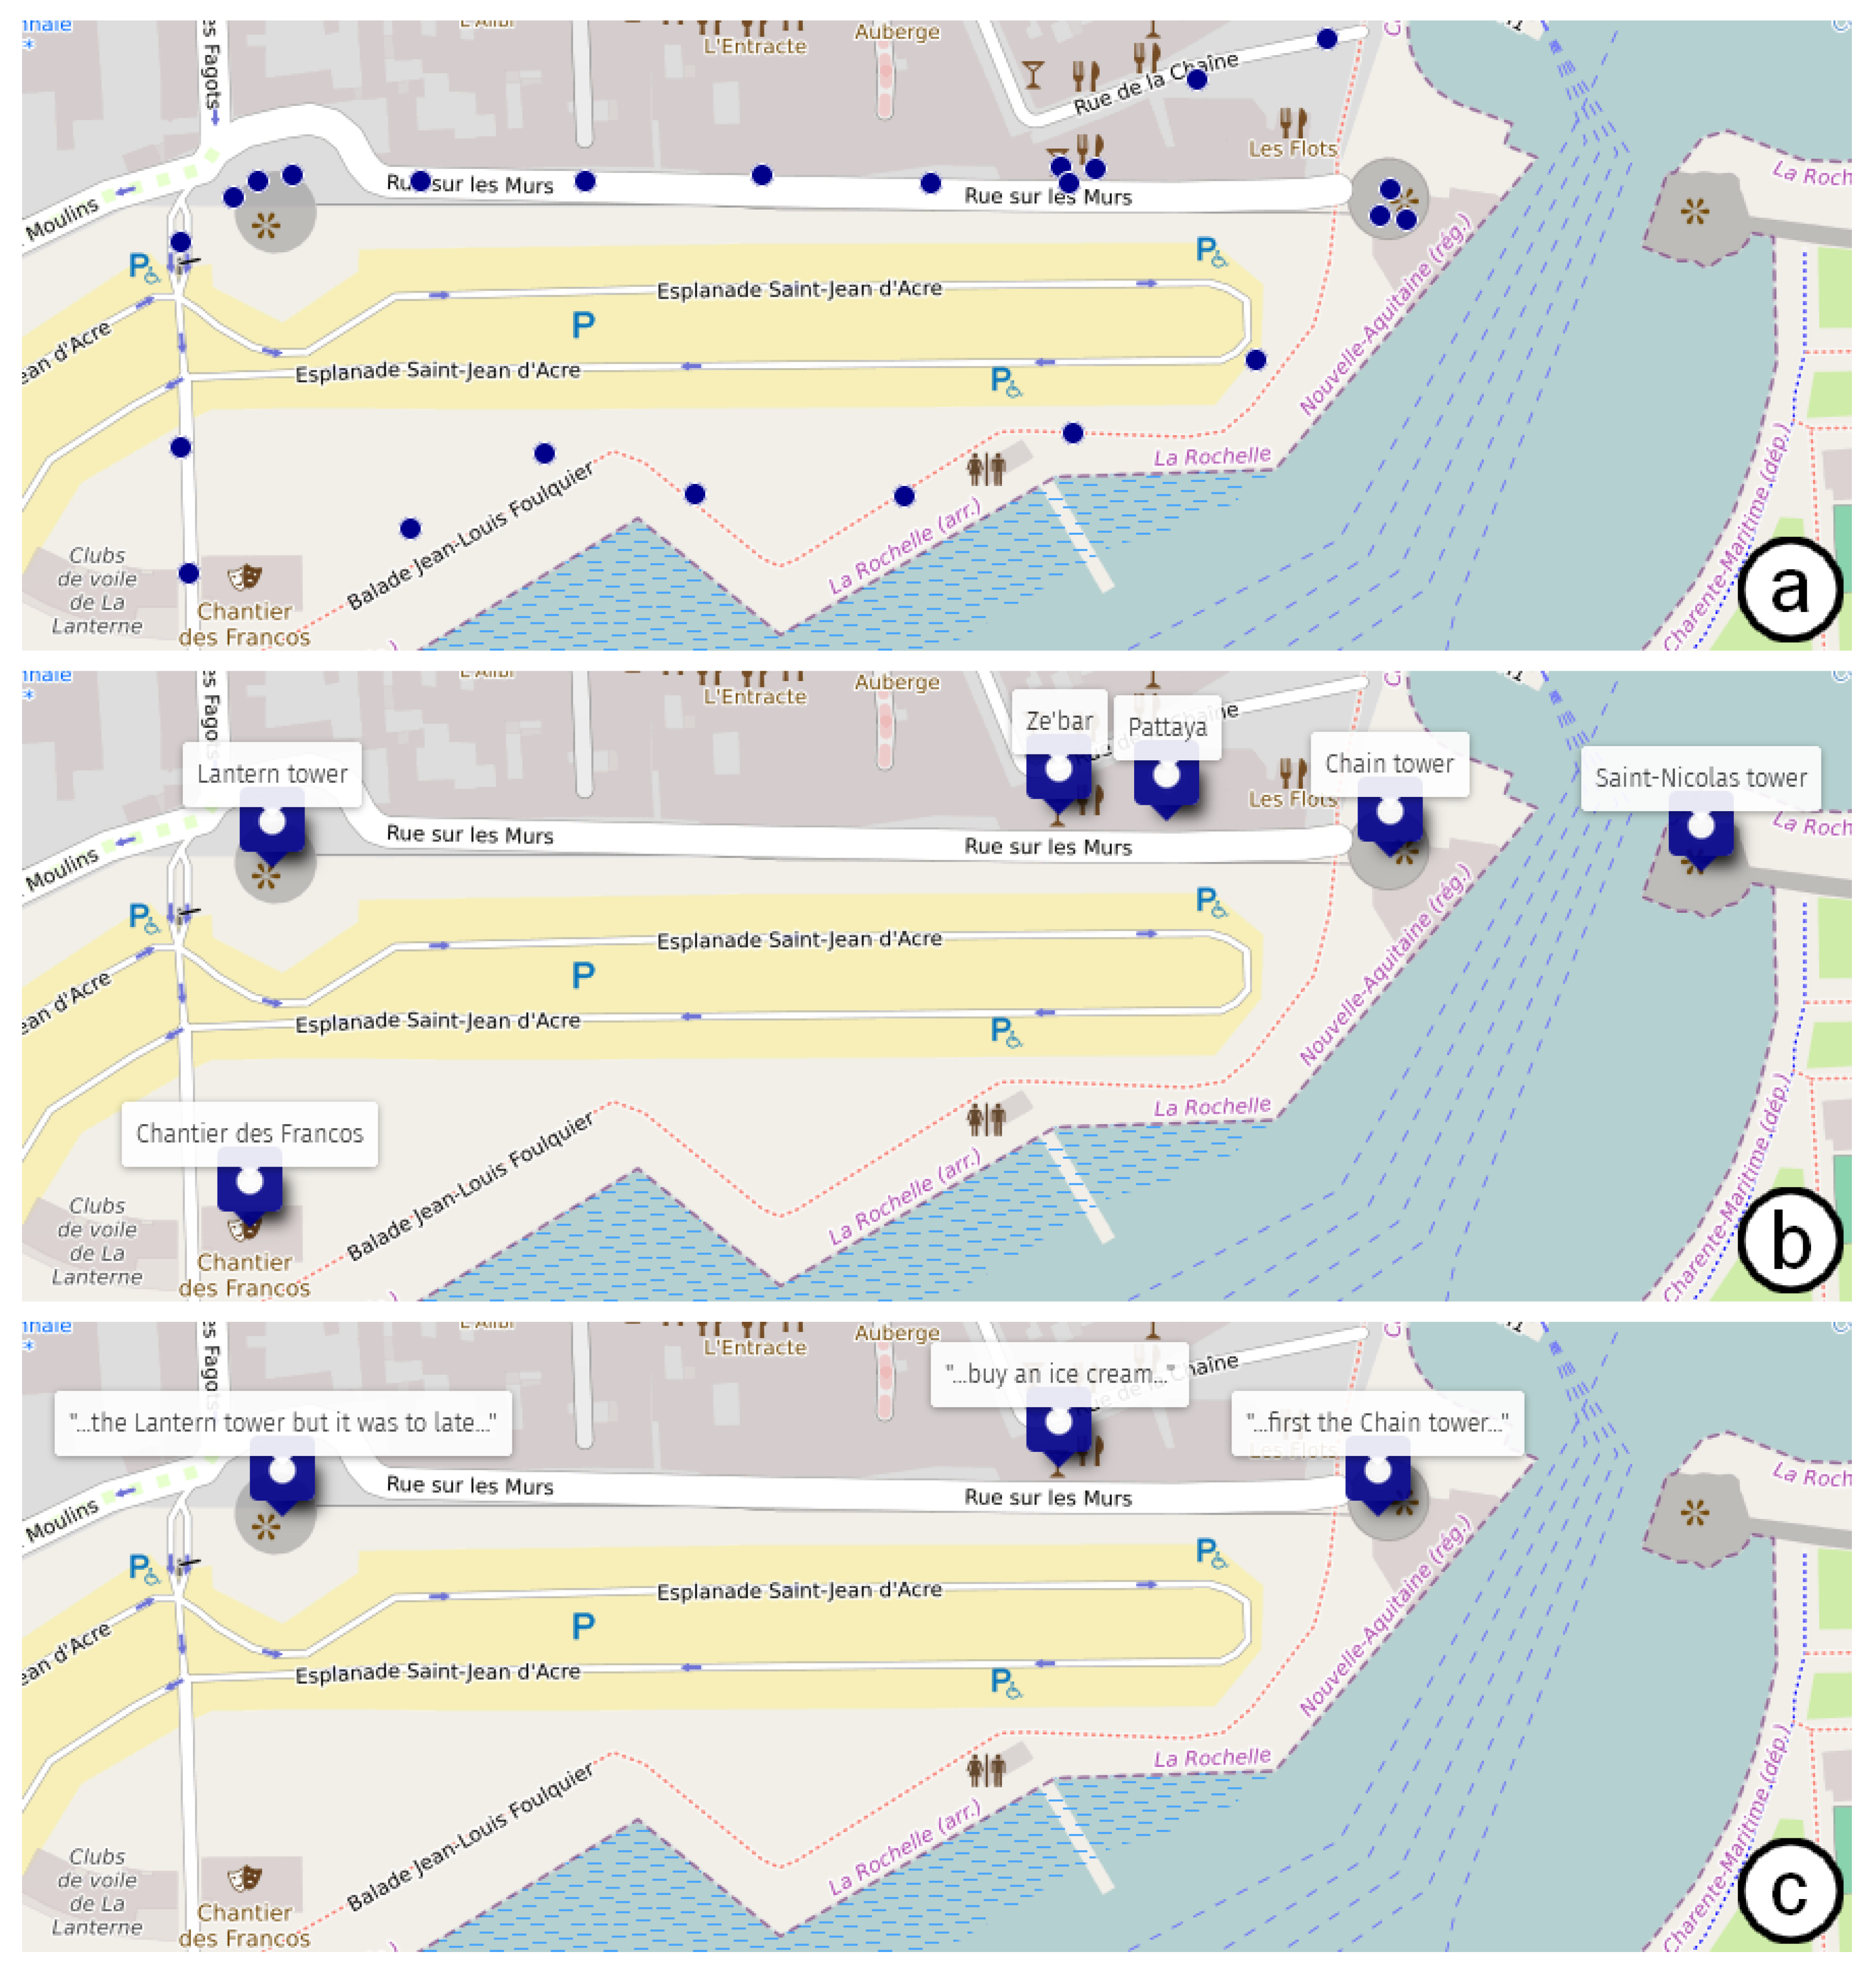
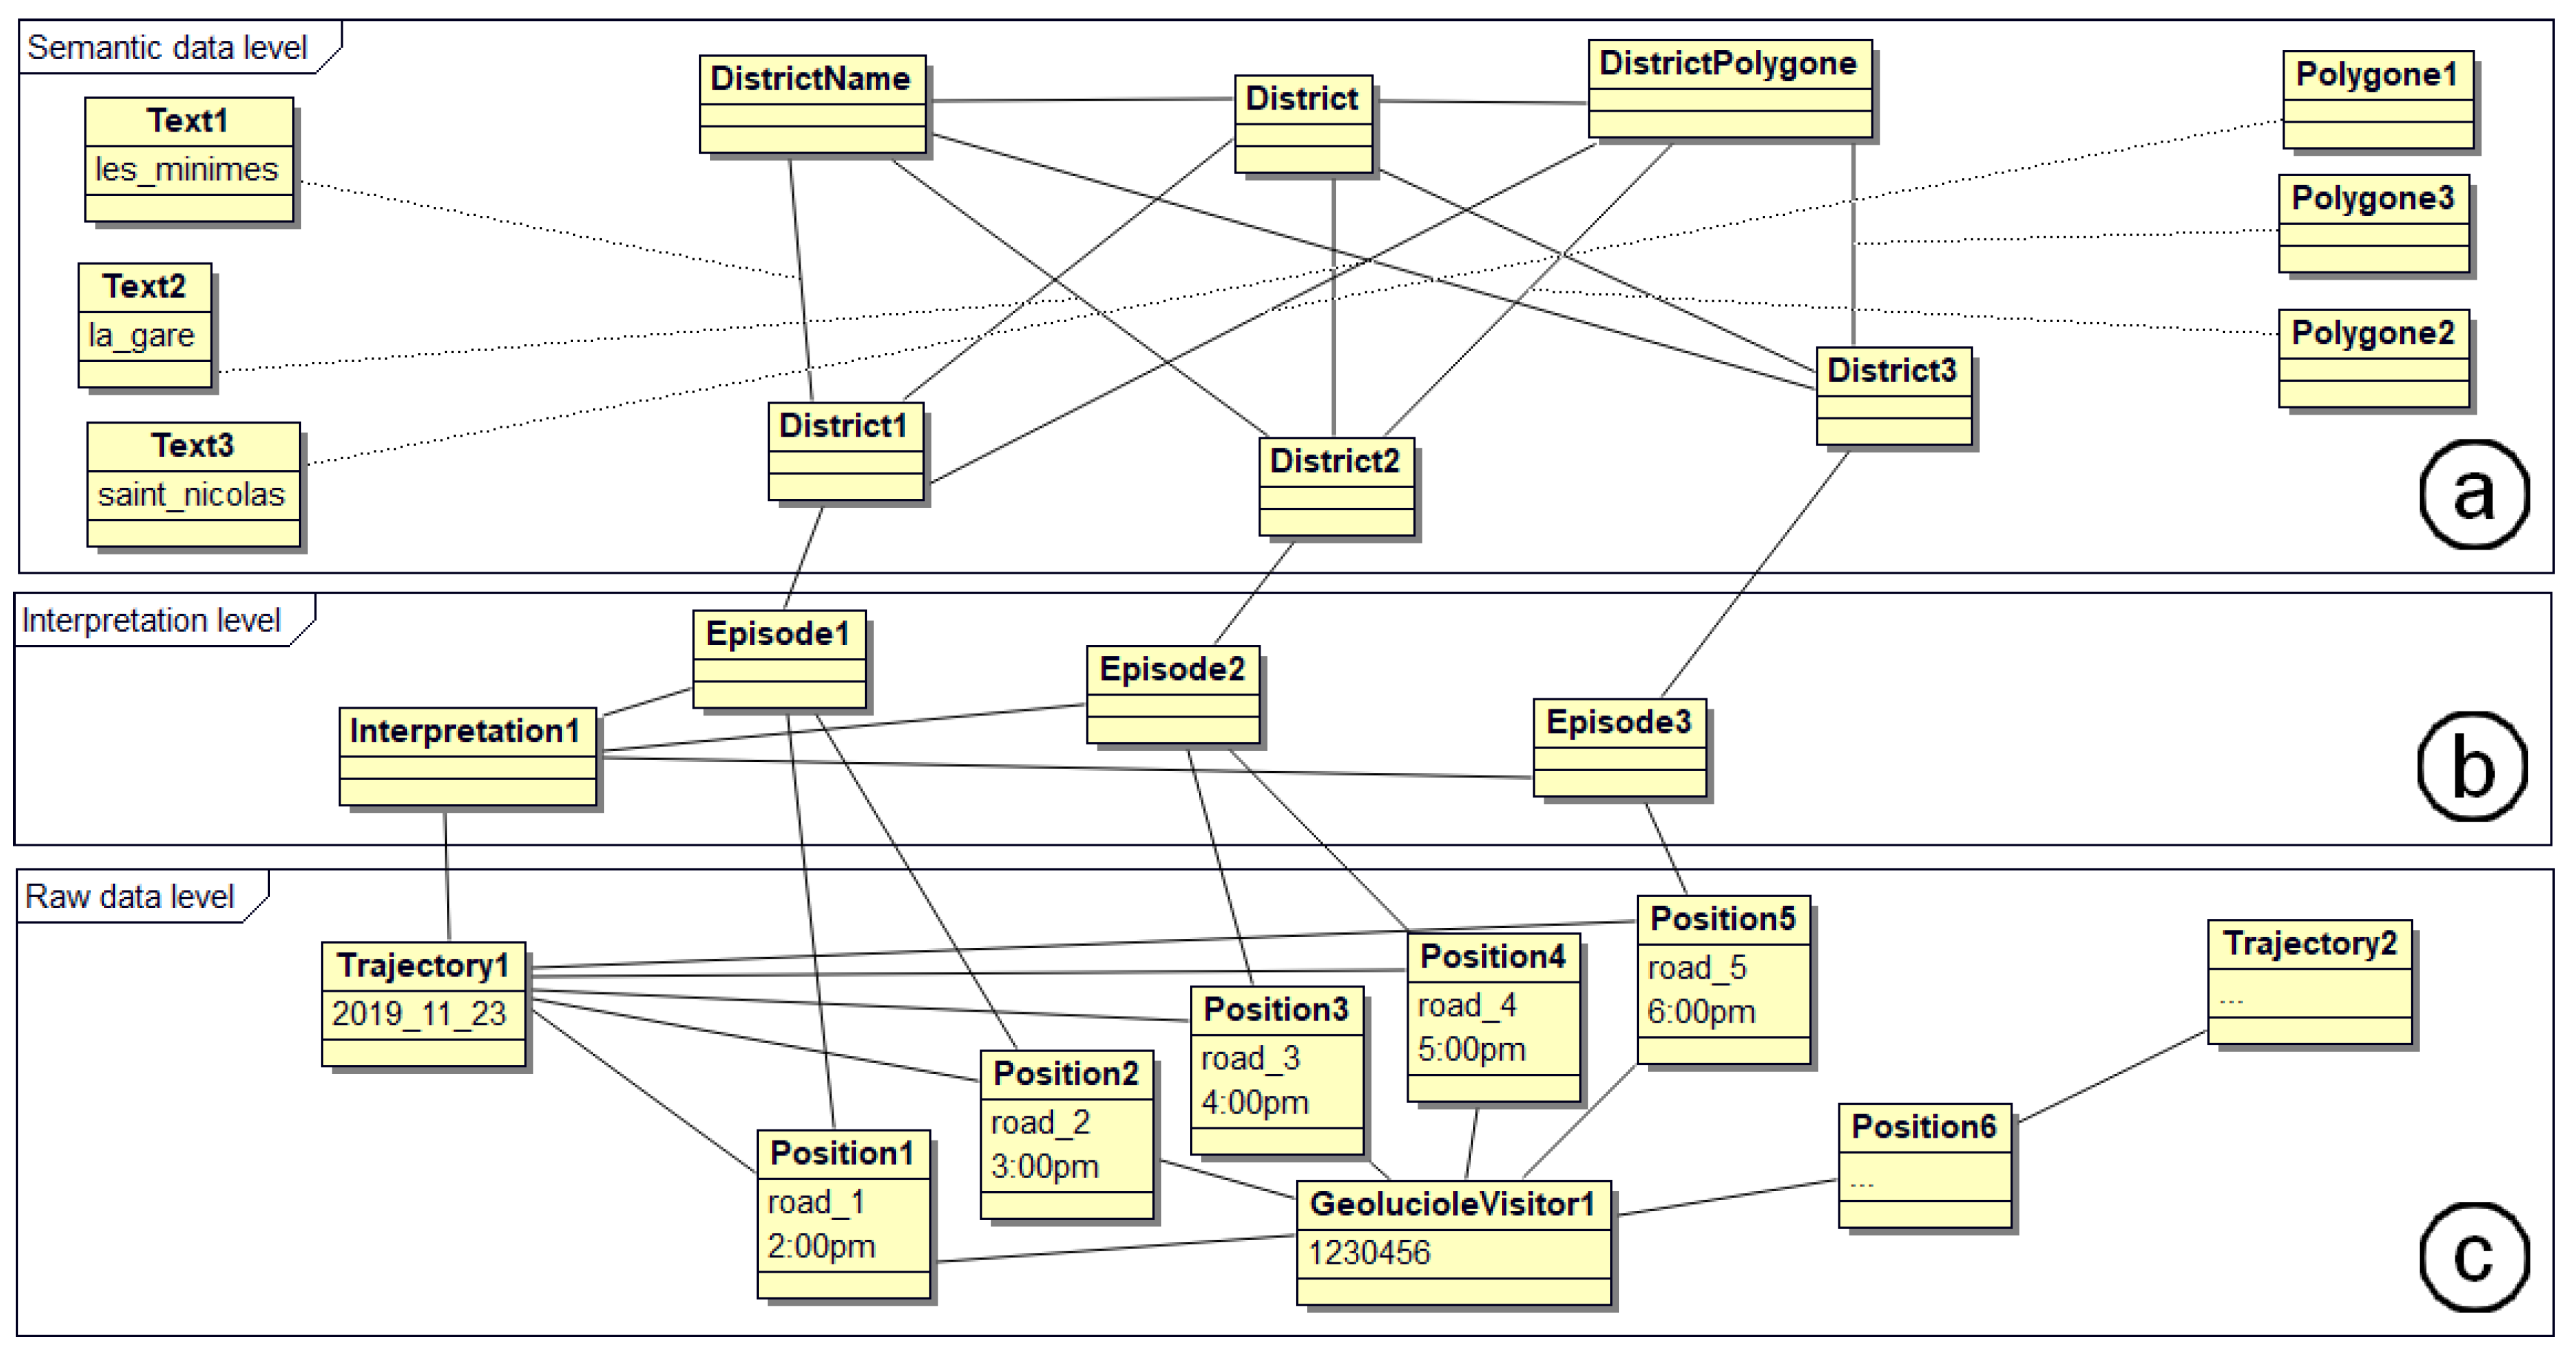
Figure 1 shows that the track (c.f. Figure 1, block a), completed by contextual data such as nearby points of interest (c.f. Figure 1, block b) allowed a first interpretation such as “they must have visited the Lantern Tower and the Chain Tower”. The interview extract that corresponded to this track was: “On 28/07, visit of the towers: first the Chain tower, then we wanted to go to the Lantern tower but it was too late so we turned back and went to buy an ice cream across the street.”. This interview (c.f. Figure 1, block c) made it possible to confirm certain interpretations (e.g., “visit to the Chain tower”) or to correct others (e.g., “we wanted to go to the Lantern tower but it was too late”). It also allowed one to discover other activities (e.g., “buy an ice cream”). Thus, aggregating these data, from three distinct source categories, allowed us to be more precise in our analyses. In short, an interview could complement the silences of the corresponding mobility track and vice versa.

3.2. Definition of Geographers’ Requirements

The DA3T project is a multidisciplinary project in which geographers and planners use tourist mobility data, associated with interview data and contextual data, according to the representations we have illustrated in Figure 1. These enrichment data are an important added value for geographers and planners because they permit to give meaning to the tourist’s movement in order to facilitate its understanding.
In order to highlight the requirements of geographers, let us first use Figure 1. A track could be associated with enrichment data from Open Data or interviews. Each enrichment data corresponds to a subset of the track’s positions. On the one hand, data from Open Data enriched the track of Figure 1 with different points of interest crossed by the tourist (e.g., the sequence <“Chain tower”, “Lantern tower”, “Ze’bar”>). On the other hand, interview data permitted enriching the track of Figure 1 with points of interest that were actually visited (e.g., <“Chain tower”, “Ze’bar”>) or with touristic activities (e.g., “eat an ice cream”). These two different enrichments could each complete or correct the semantics associated with the track.
It should also be noted that spatial, temporal and thematic triptychs were mobilized for the description of enrichment data (e.g., the “Francofolies” event could be described by a location, a duration and a name). Hence, we understood that it was interesting to associate such data with a subpart of the track based on these dimensions.
Finally, a sequence of enrichment data enriching a track could be recursively decomposed into sub-levels. For example, a touristic activity “discovery” mentioned in the interview could be decomposed into two new touristic activities with a more precise meaning like “visit” and “restauration”.

3.3. From Touristic Mobility Track to Semantic Trajectory: Locks and Working Hypotheses

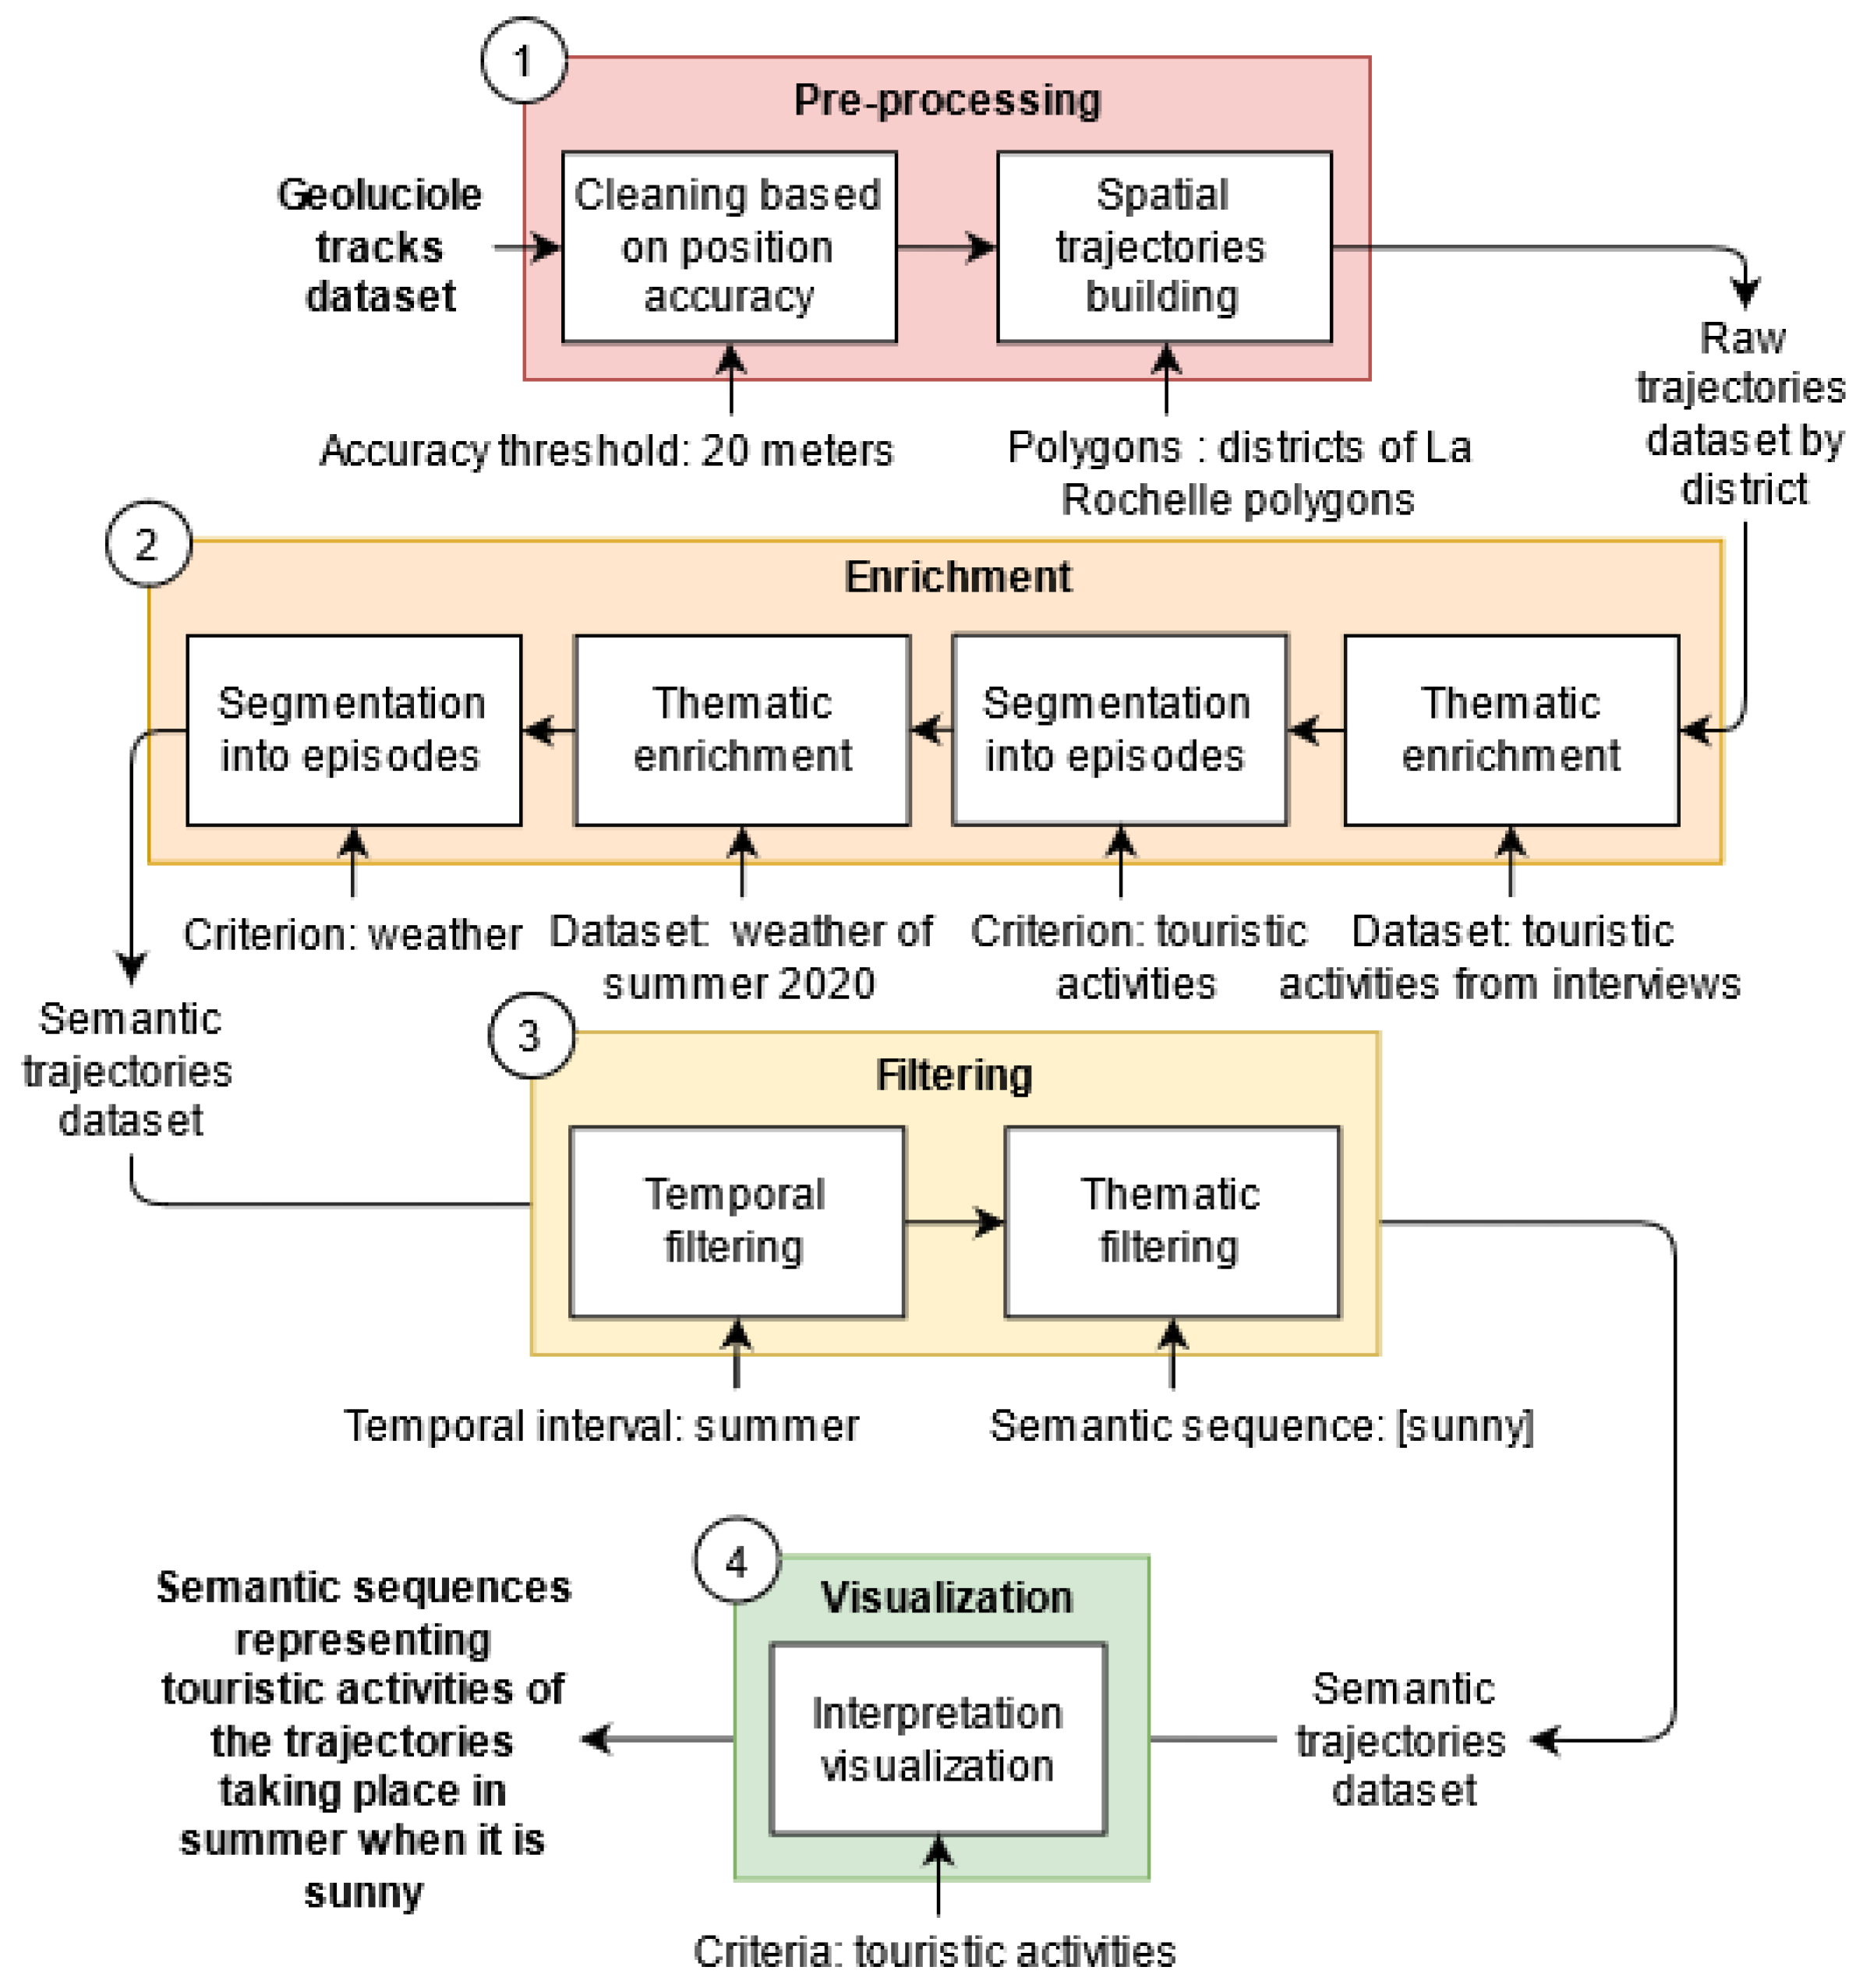
The characteristics of tourist mobility data and the specific expectations of the geographers and planners who use them highlight specific modeling requirements. We must, in the same model, be able to describe raw mobility tracks, raw trajectories and semantic trajectories, integrating the characteristics described in Section 3.2. Thus, after processing a mobility track (i.e., pre-processing, enrichment, filtering, etc.), we obtained one or more raw trajectories (i.e., segments of the mobility track that were of interest for a given application) or semantic trajectories (i.e., raw trajectories enriched with one or more specific interpretations based on contextual data from various sources). Semantic trajectory enrichment data were derived from interviews or from contextual data extracted from external resources.
The challenges lay in (i) the modeling of semantic trajectories with enrichment data associated with positions or trajectory segments (potentially structured in sub-segments); (ii) the generic definition of enrichment data integrating spatial, temporal and thematic dimensions; (iii) the structuring of such enrichment data according to a hierarchical organization. We hypothesized that the notions of multi-level episodes [8,9] be reused and extented in order to remove the lock (i) and multiple aspect [10], whose aspect description enhanced the description of aspects with spatial, temporal and thematic dimensions, in order to remove the two other locks (ii) and (iii). To our knowledge, there is no semantic trajectory model that integrates these different notions simultaneously.

4. DA3T Semantic Trajectory Model

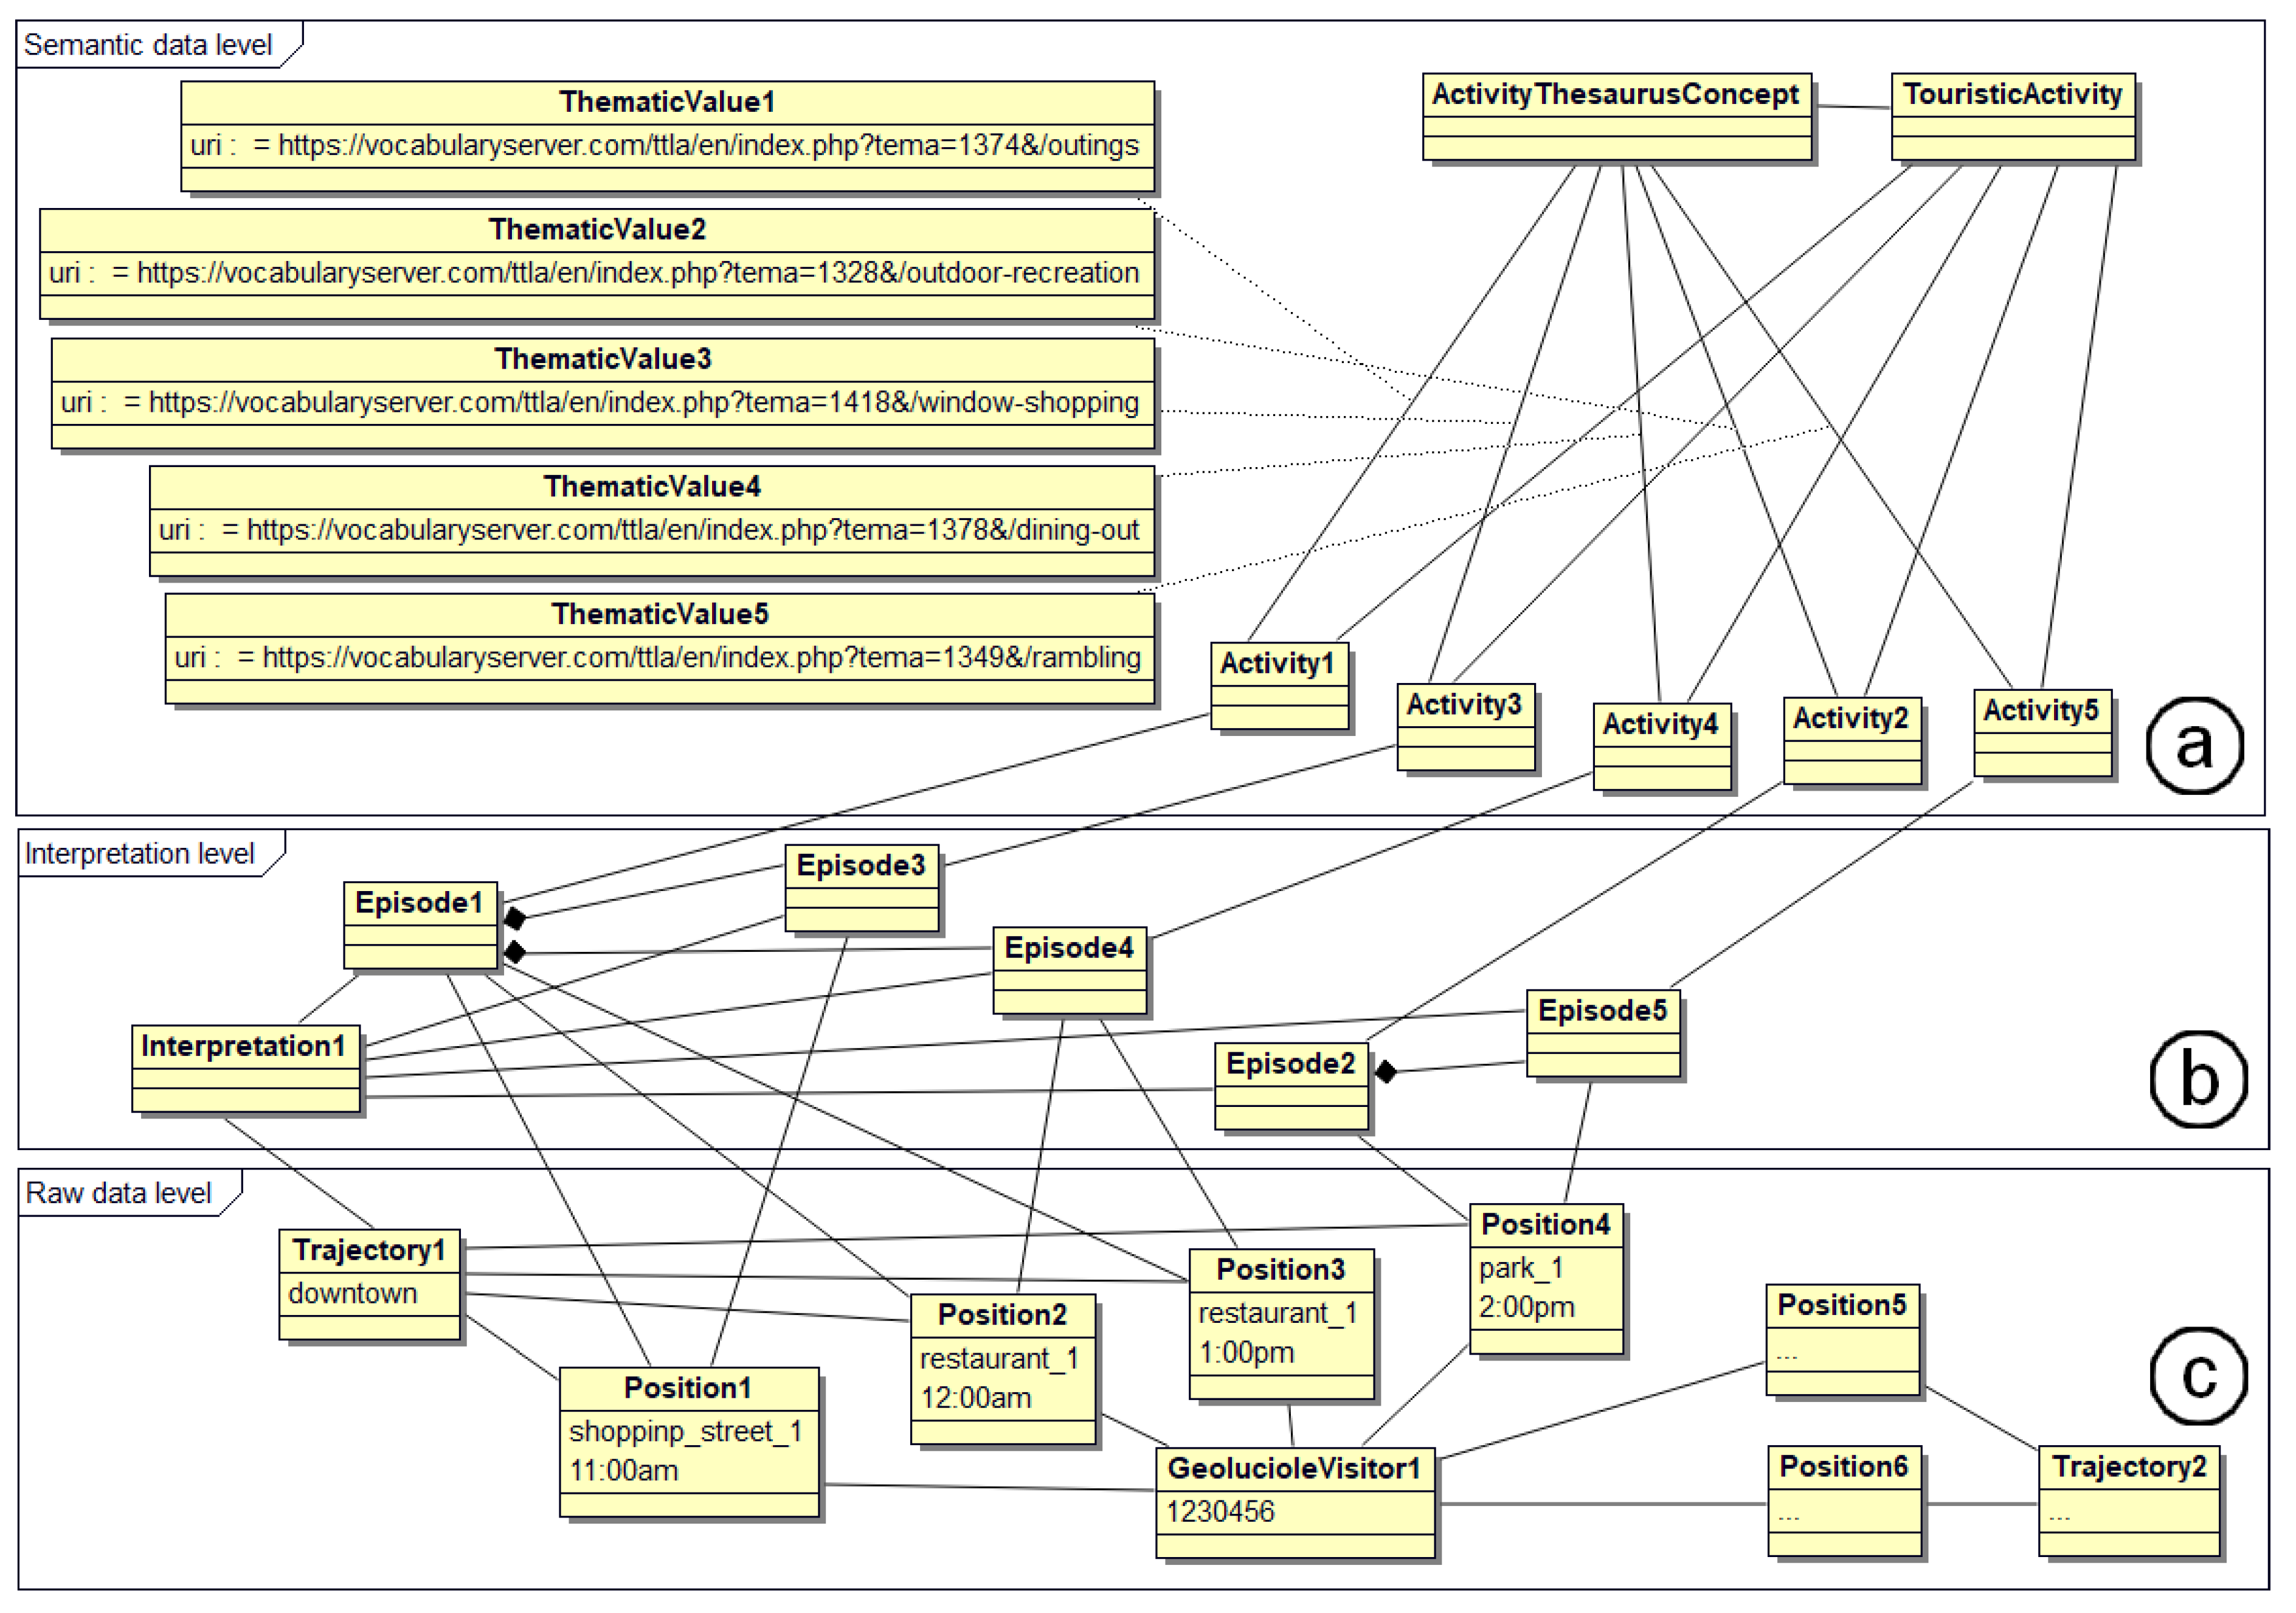
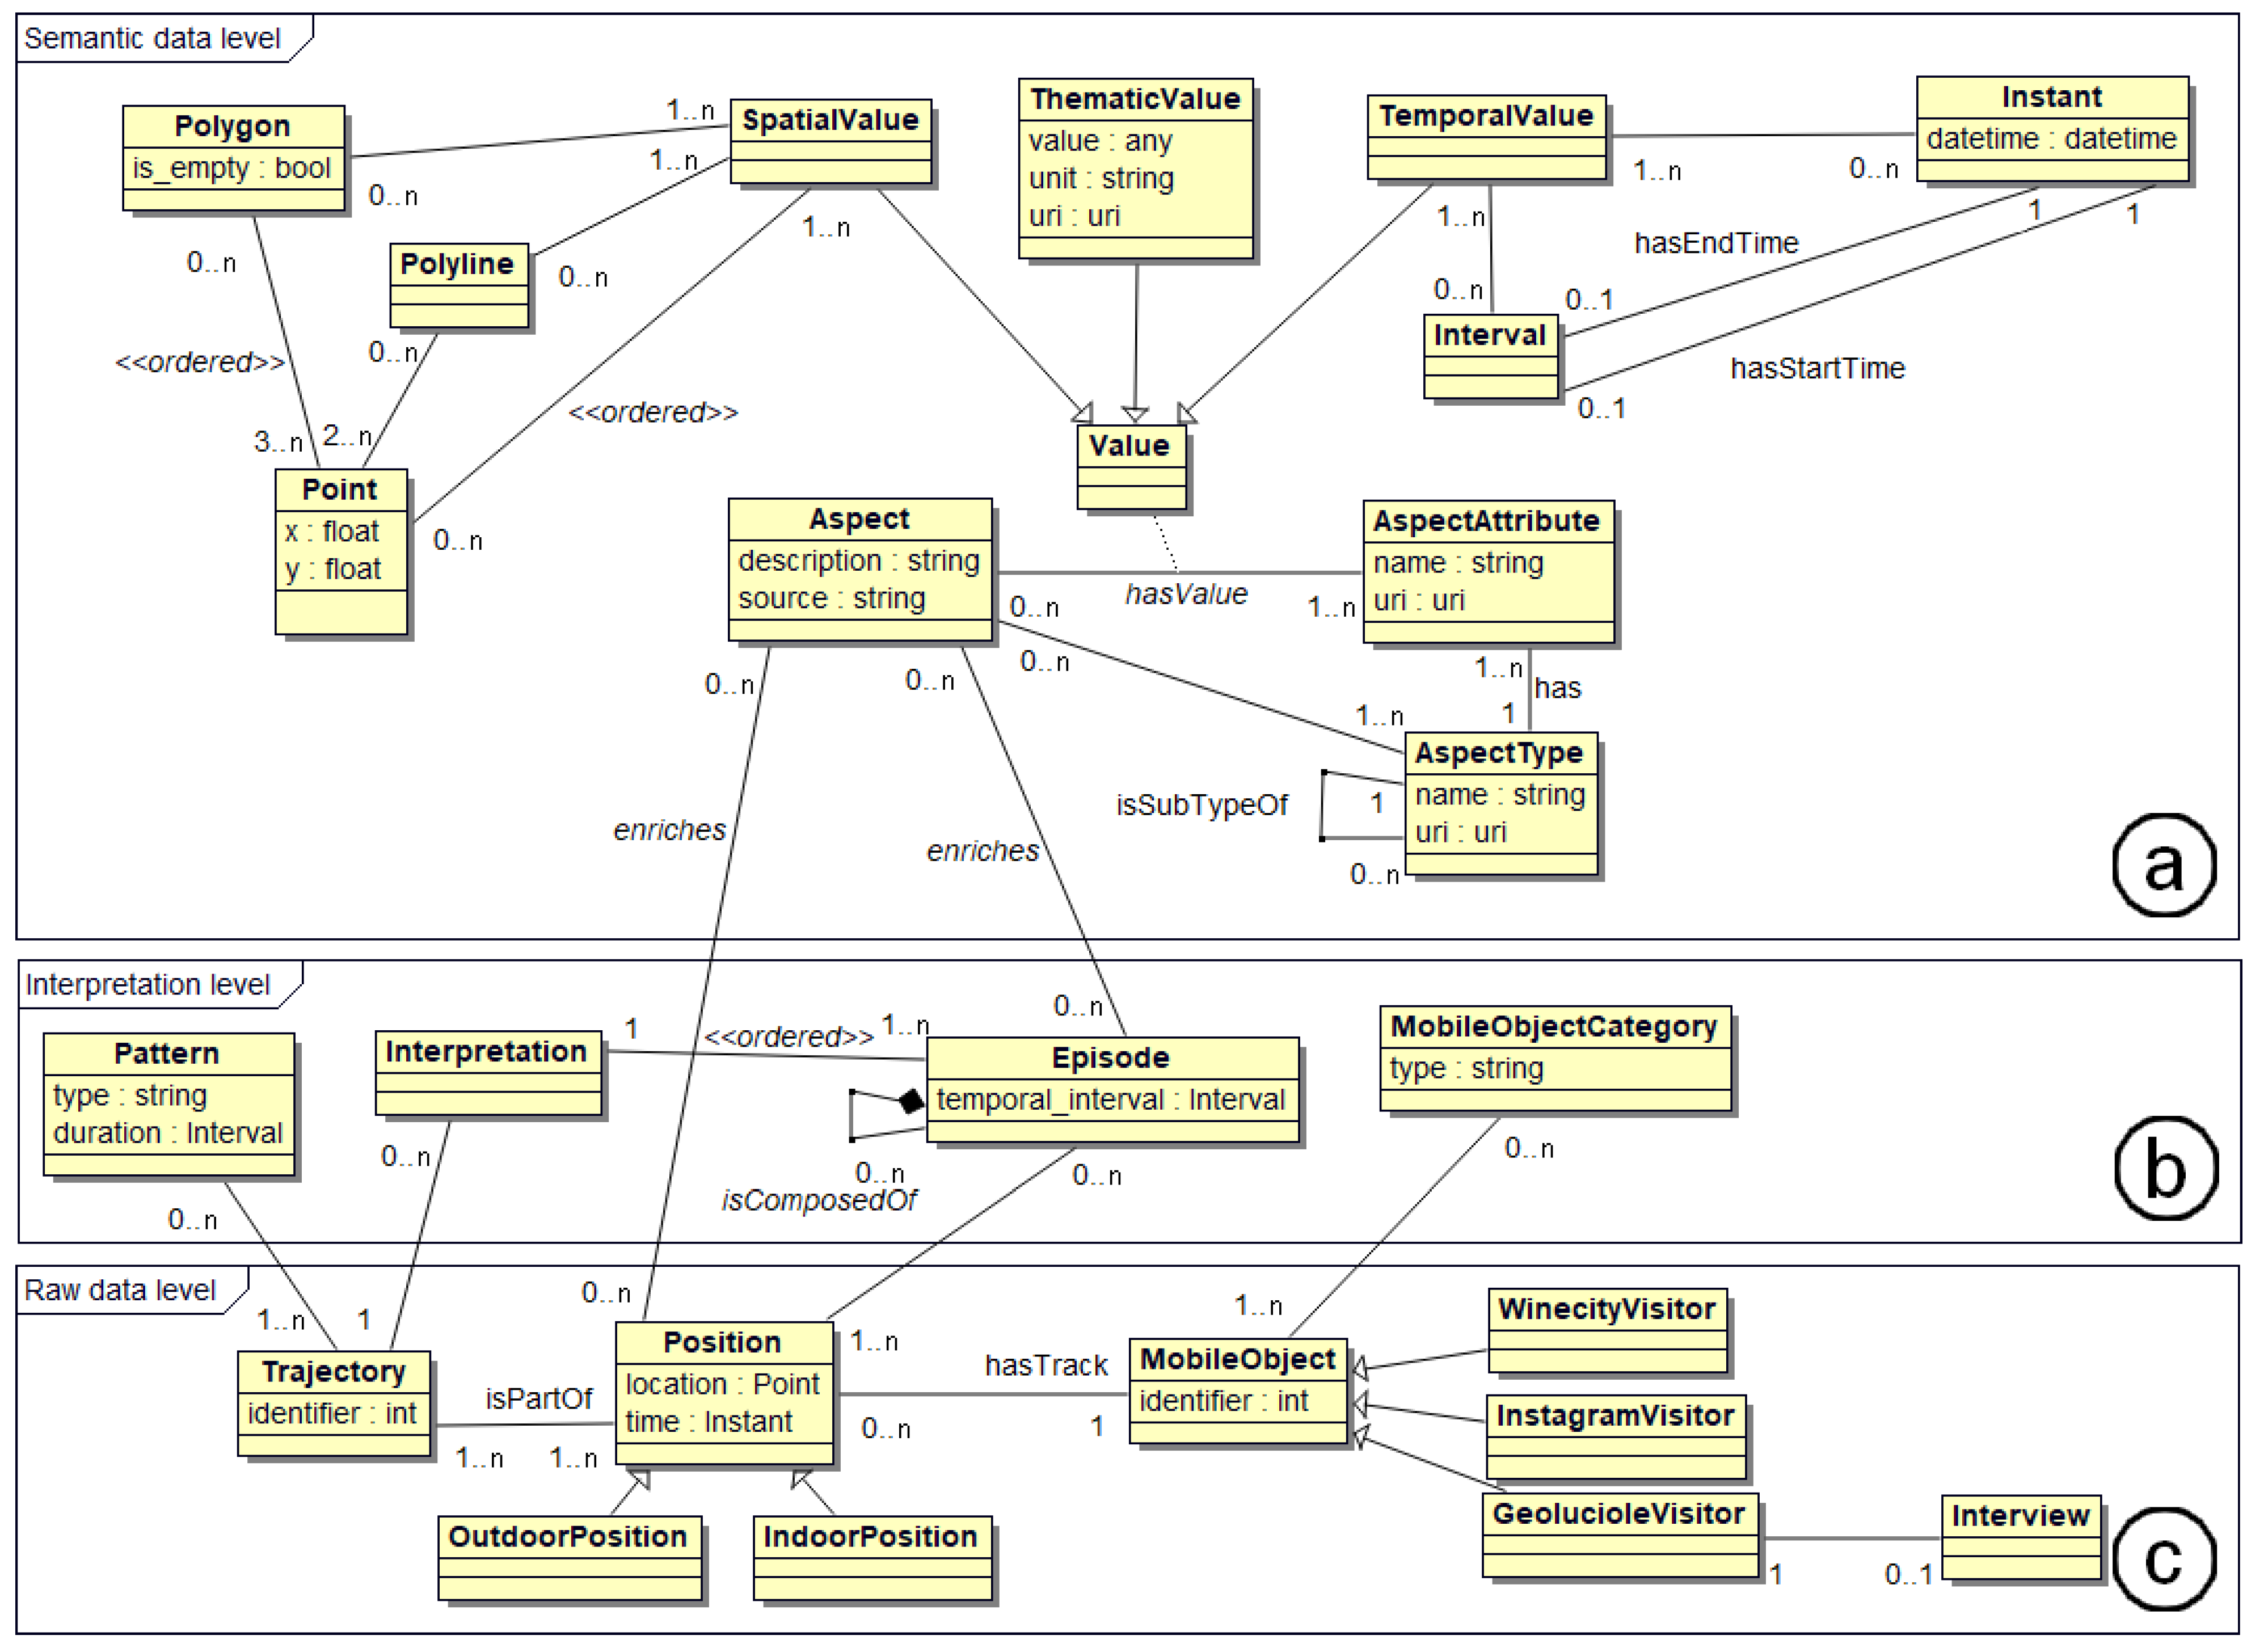
Figure 2 shows our model of semantic trajectories, which is broken down into three distinct parts:
The raw data level part (c.f. Figure 2, block c) gathered the classes representing the collected raw data. General data related to mobile objects were in the MobileObject class and more specific data related to a particular category of mobile objects (e.g., the volunteer tourists of our project) were in the corresponding classes that inherited from it (e.g., the GeolucioleVisitor class). A moving object had a sequence of positions Position that described the entire captured movement, i.e., its mobility track. There may be several types of positions (e.g., in our project, IndoorPosition for visitor positions in museums and OutdoorPosition for positions collected with Geoluciole) that had different attributes, but all inherited from the generic Position class. A trajectory Trajectory was a sub-part of this mobility track that was of interest for the application. It could be constructed on temporal, spatial or spatio-temporal criteria (e.g., from a mobility track describing a tourist’s 1-week stay, one may construct a set of trajectories of one-day duration). This model was generic and extensible according to the application context. The parts that could be extended were the MobileObject class, to which child classes representing new types of mobile objects could be added (e.g., a mobile object class Vehicle inheriting from MobileObject), and the Position class, to which child classes representing new types of positions could be added (e.g., a position class GPSPosition inheriting from Position).
The semantic data level part (c.f. Figure 2, block a) comprised the classes describing the enrichment data. As in the MASTER model [10], we wished to represent semantic data in the form of semantic aspects. Our model was therefore called a multiple aspect model. Four main classes represented these aspects (Aspect, AspectType, AspectAttribute and Value). The aspect type represented the category of the enrichment data (e.g., “touristic activity” for a “swimming” aspect, “point of interest” for a “central place” aspect, etc.) and had specific attributes (e.g., aspects of “points of interest” type were each characterized by a name, a location, a type, etc.). When an aspect was created, at least one aspect type was associated with it, and each attribute associated with that type was instantiated through the association class Value (e.g., the “Lantern tower” aspect was a point of interest that had name: Lantern Tower, for location: [46.1558333, −1.1569444], for type: tower, etc.). Finally, we note that the AspectType class included an 
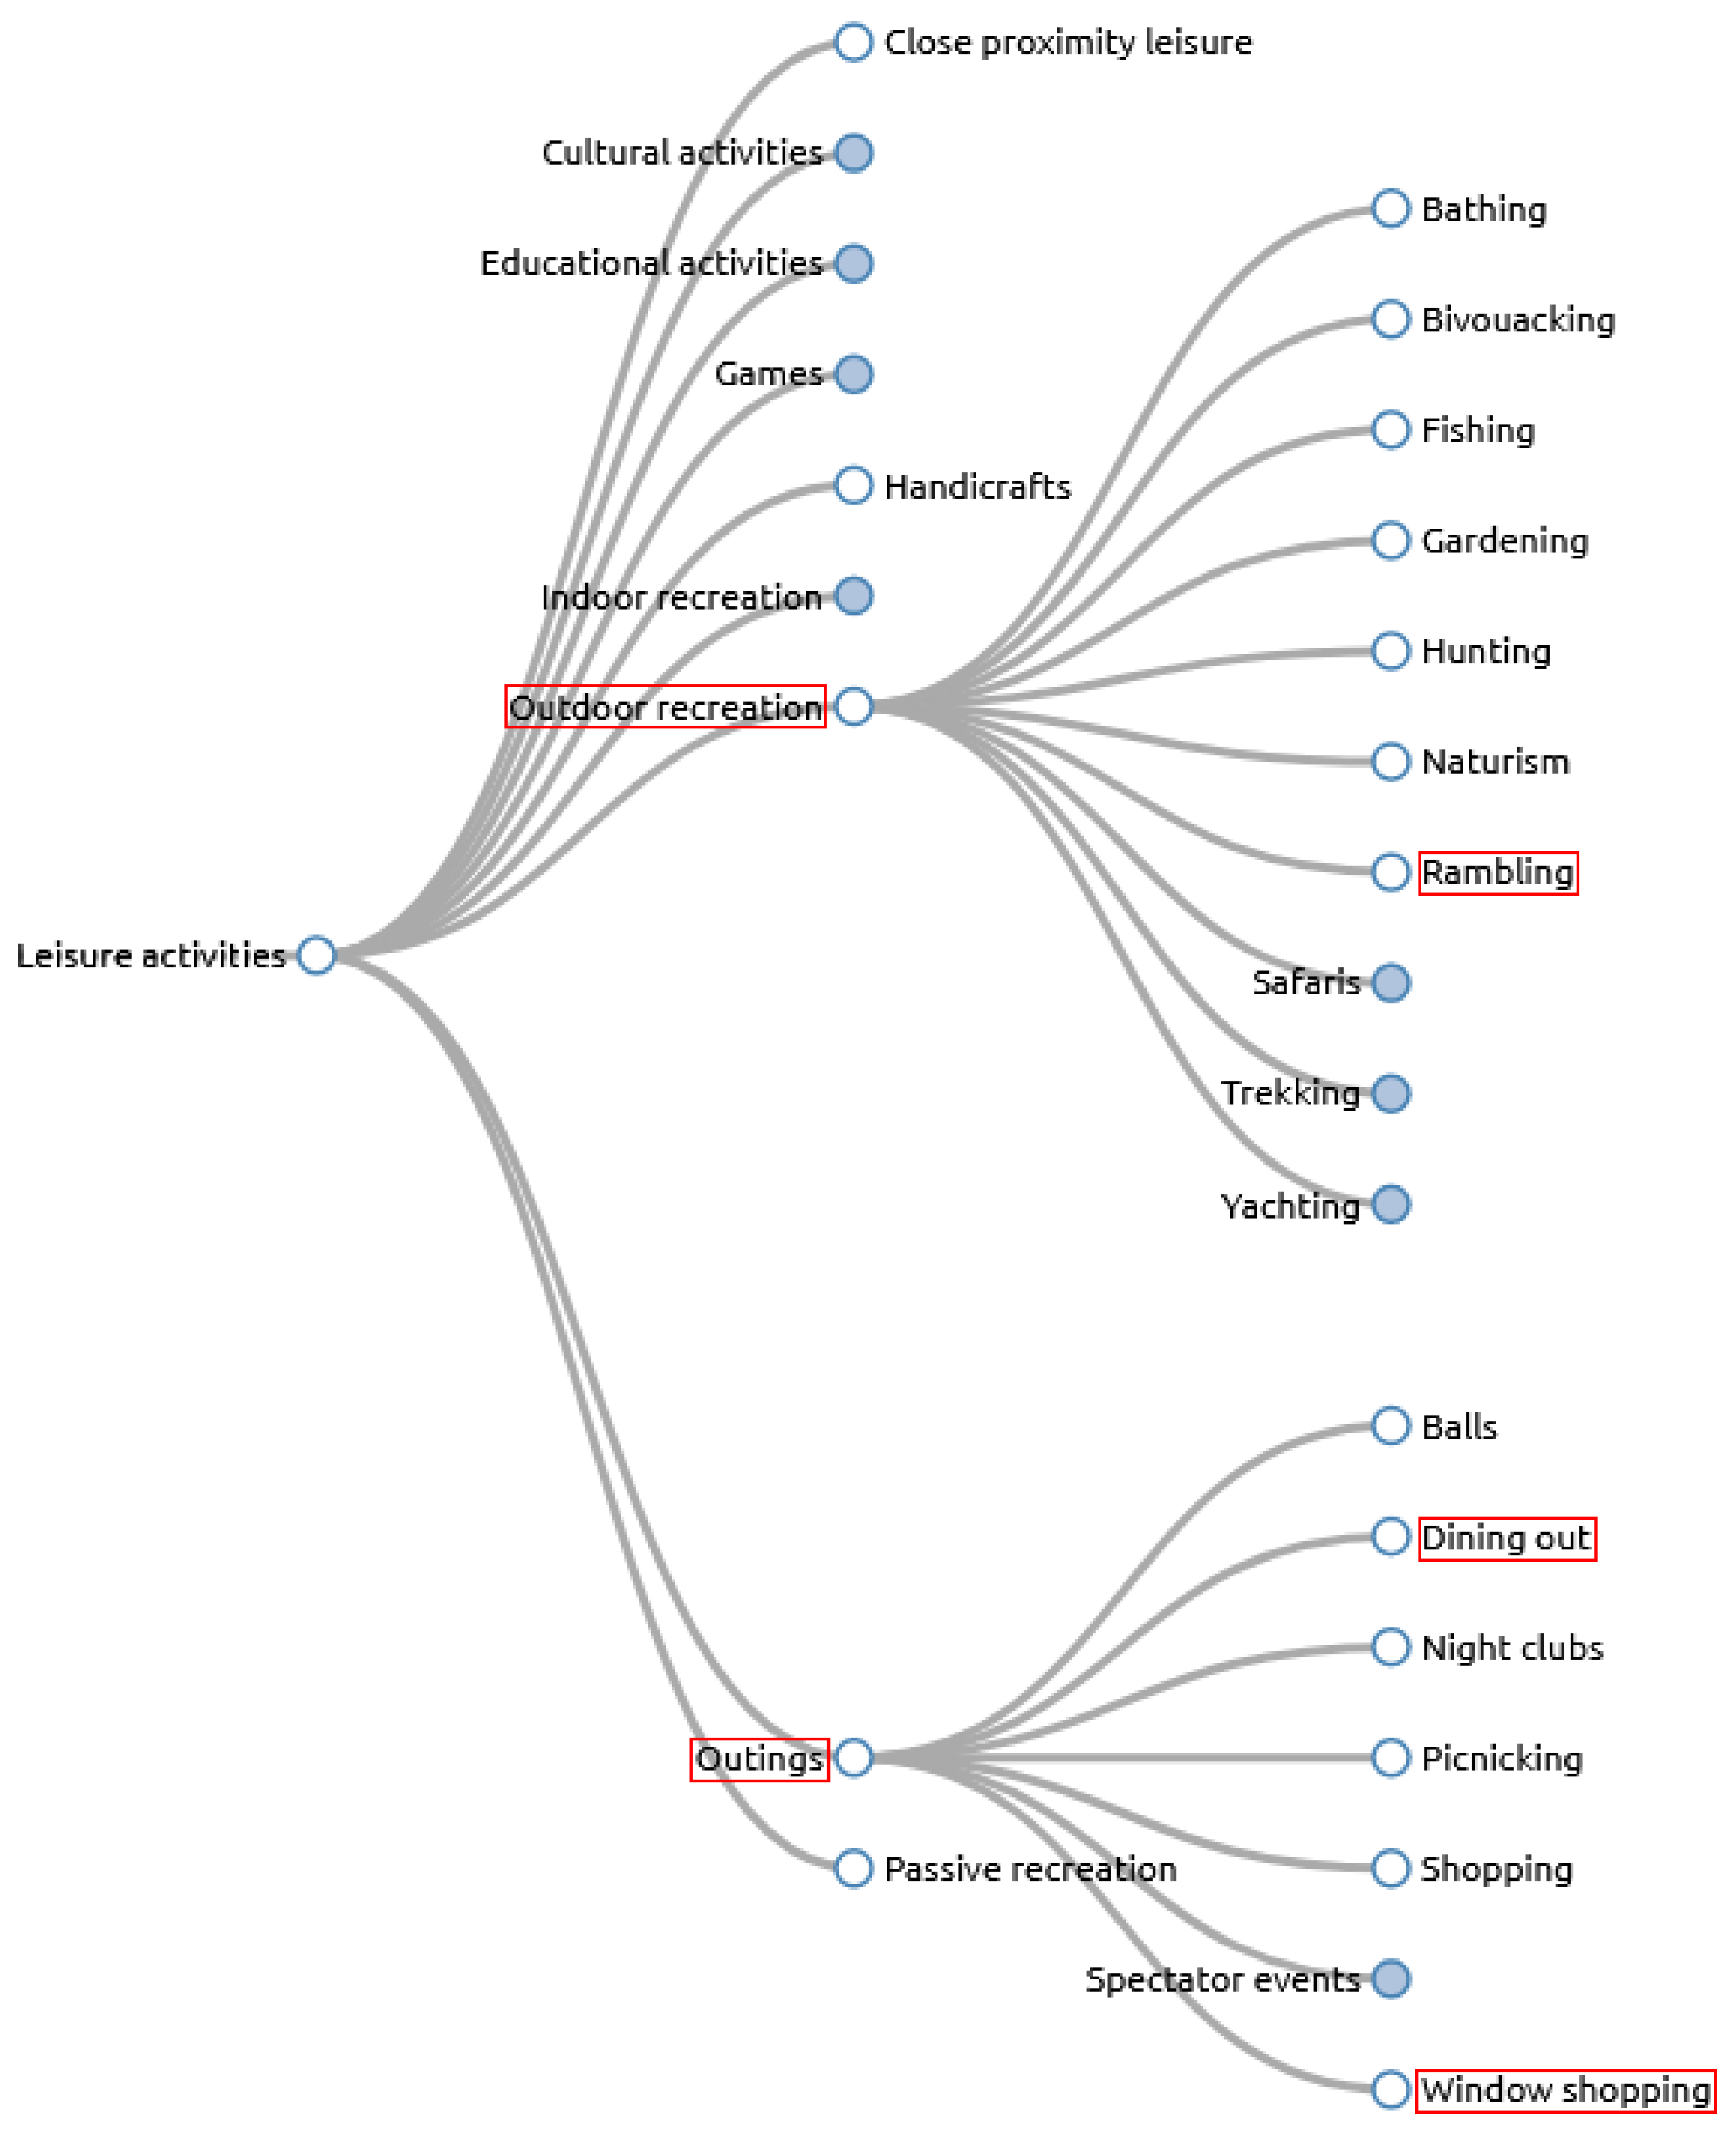
isSubTypeOf relationship that allowed enrichment data to be structured hierarchically. Thus, for example, touristic activities could be defined iteratively at different levels of detail, as outlined in the requirements. In the MASTER model, attributes were always instantiated as strings. In our model, we specified the classes TemporalValue, SpatialValue and ThematicValue to distinguish between temporal, spatial and thematic attributes. Moreover, at instantiation, some instances of the model could be linked to concepts coming from external ontologies thanks to an attribute uri (e.g., to describe aspects of “point of interest” type, we could rely on external ontologies such as DataTourism: https://framagit.org/datatourisme/ontology, accessed on 6 June 2021). Thus, a URI could either describe an aspect type, or an aspect attribute, or a particular value of an aspect attribute.
The interpretation level part (c.f. Figure 2, block b) served as a link between the raw data and the semantic data. An enrichment datum (i.e., an aspect in this model) could be directly linked to a particular position Position. The link between a position and an aspect could be based on the attributes of the aspect having spatial (e.g., the spatial footprint of a district), temporal (e.g., the temporal interval of a holiday), or spatio-temporal (e.g., the spatial footprint and temporal interval of an event) dimensions. This link could also be computed for some aspects (e.g., the mode of locomotion could be computed using the speed of travel and knowledge of the road or pedestrian network) or manually defined (e.g., the touristic activities specified by the tourist during the interview). A set of positions enriched with the same enrichment data could result in the creation of a particular episode Episode (i.e., a sequence of consecutive positions related to the same aspect). It was possible to express the granularity of episodes through the recursive compositional linkage isComposedOf meaning that an episode could be specified by other episodes. Thus, our model was referred to as a multi-level model [
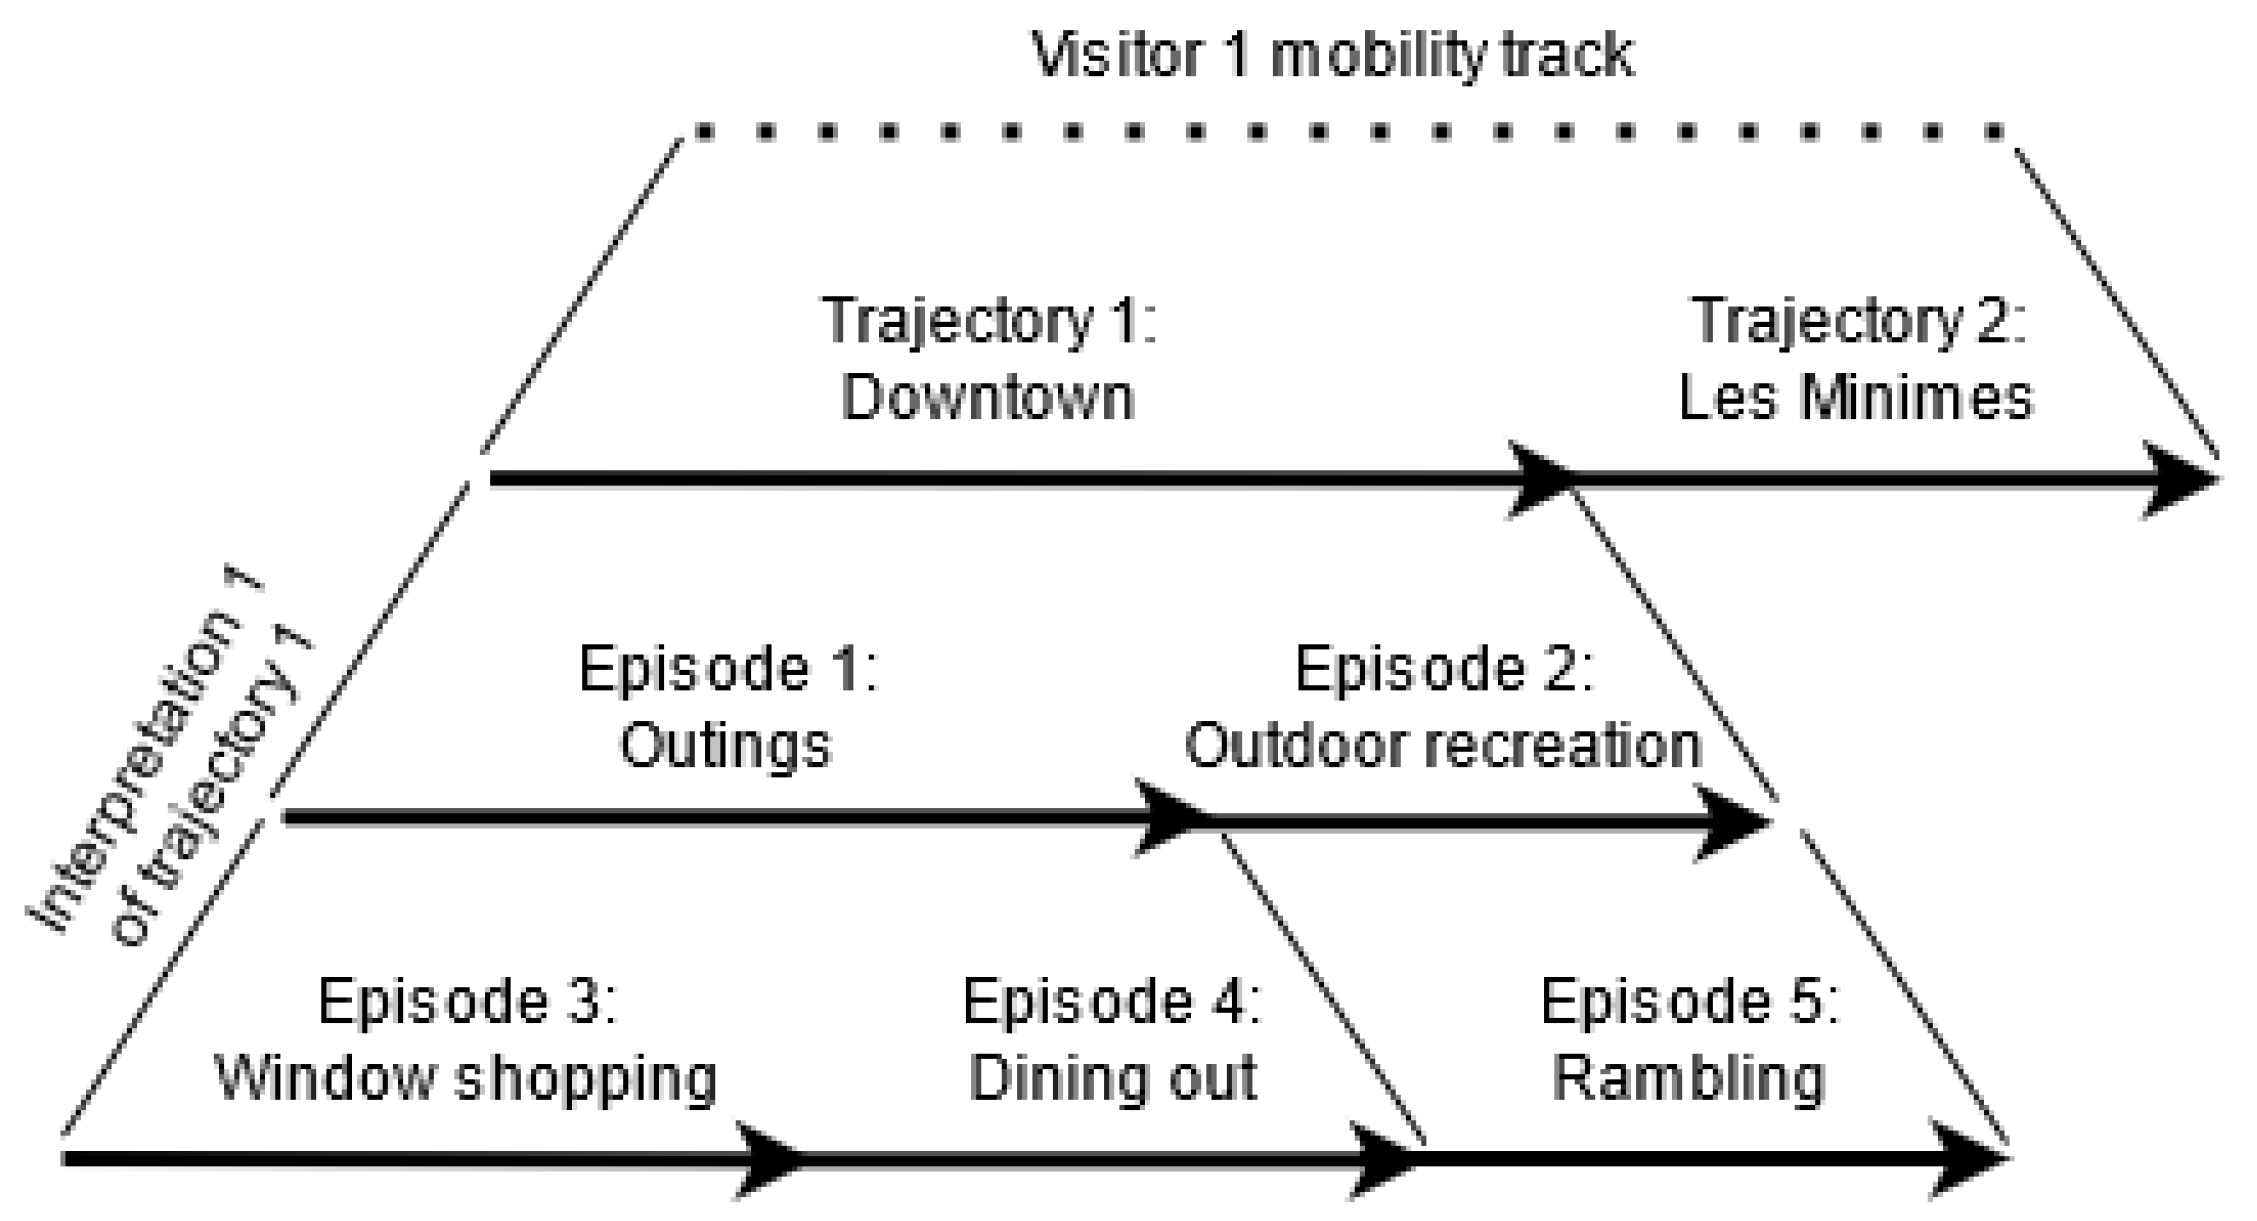
8]. A specific trajectory could be linked to one or more interpretations of the Interpretation class. An interpretation was a particular sequence of episodes (e.g., a tourist’s trajectory may have had one interpretation to describe the weather during travel, another interpretation to describe touristic activity, etc.) [3]. The Pattern class allowed for groups of trajectories that shared spatial, temporal, or semantic characteristics (e.g., trajectories that corresponded to the same activities, trajectories that passed through the same districts, etc.). Finally, the MobileObjectCategory class allowed one to classify mobile objects into particular categories according to their behaviors (e.g., tourists, residents, etc.).
We have presented a multiple aspect, multi-level model that is generic and extensible. Let us test it now on real scenarios.

5. Experimentation of the DA3T Model

The goal of this part is to present the implementation of our semantic trajectory model. The data processing was performed using the DA3T modular platform [11]. This platform builds customized processing chains using services dedicated to the processing of mobility data, any input and output data of a service being an instance of the model. Each service is a software component that performs a specific processing and belongs to a category that groups together services with similar goals (i.e., Pre-processing, Filtering, Enrichment, Editing, Aggregation, and Viewing). A processing chain is a sequence of services that answers a specific question about a dataset. In a first step, we briefly present the implementation of the platform and the instantiation of the model through two scenarios related to the data collected in the context of the DA3T project aiming at the analysis of touristic activities in La Rochelle. In a second step, we test the genericity of our model with mobility data from other application domains. Finally, in a third step, we make a synthesis of the experimentations.

5.1. Experimentation on the Tourism Dataset in the City of La Rochelle

In this part, we present in detail the tourism dataset collected in the city of La Rochelle. Then, we test our model on two scenarios.

5.1.1. Dataset Description

For the following two scenarios, we used Geoluciole data from two collection periods conducted in the summers of 2019 and 2020. This dataset gathered the GPS tracks of 92 tourists of La Rochelle with a total of 118,951 spatio-temporal positions.
For 15 of the volunteer tourists, we also conducted semi-structured interviews once their stays were over in order to enrich their tracks and to fill in any gaps in these tracks (due to GPS cuts, white zones, etc.). We had their textual transcriptions. Thus, an interview allowed us to recover data on the touristic activities of a tourist during their visit (e.g., restaurant outing, swimming, etc.).
We were also interested in contextual data to enrich these tracks, such as weather, tides, points of interest, administrative division of the city into districts, etc. Some of these datasets were collected and stored in a project database, others are directly queried on the Open Data through APIs. For the two scenarios presented below, we used data corresponding to the administrative division of the city into districts and the weather. These two datasets were stored on a PostgreSQL database of the project. The division into districts of La Rochelle came from the city’s Open Data and consisted of 23 districts, each represented by a name and a polygon. As for the weather data, they were collected on the Open Data via an API. These data described the weather of La Rochelle hour by hour over 357 days (i.e., 8463 weather records).

5.1.2. Scenario 1: Study of Two Districts in La Rochelle

Figure 3 shows an example of a processing chain that made it possible to answer question (1): what were the mobility tracks that passed through the district Les Minimes and through the district Saint-Nicolas in the same day?
This processing chain (Figure 3) took as input raw mobility tracks and displayed as output a map with all trajectories answering question (1). To do so, it chained services from four different categories.
To begin with, in the Pre-processing category (c.f. Figure 3, category 1), touristic mobility tracks were cleaned with the cleaning based on position accuracy service based on capture accuracy. This service relies on the accuracy value recorded at the time of position capture and indicates, in meters, the radius of uncertainty around the position. The following service temporal trajectories building constructs raw trajectories from the cleaned mobility tracks. The question stirred our interest in the trajectories of tourists at the temporal scale of the day. Thus, the setting day indicates that the service constructed a trajectory per day and per person. Figure 4, left, trajectories 1 and 2, resulting from this treatment, correspond to two distinct days of visit, respectively.
The Enrichment category (c.f. Figure 3, category 2) grouped together services that transformed a raw trajectory into a semantic trajectory. The service thematic enrichment linked semantic aspects to the trajectory positions. Here, each trajectory position was linked to the aspect representing the district of La Rochelle in which it was located. The following service segmentation into episodes constructed, for each trajectory, an interpretation based on the enrichment performed previously, i.e., a sequence of episodes composed of the different districts of La Rochelle that were covered. The result of this service was a set of semantic trajectories.
The category Filtering (c.f. Figure 3, category 3) grouped together services that filtered trajectories according to specific criteria. Here, the thematic filtering service filtered the trajectories and returned as a result those which presented a certain semantic sequence in their corresponding sequence of episodes. Here, the thematic filtering service filtered the trajectories and returned those whose episode sequence matched the semantic sequence. Notice that the service was called twice: the first time, it retained the trajectories that passed through the Minimes district and the second time, those that passed through the Saint Nicolas district.
Finally, the category Visualization (c.f. Figure 3, category 4) grouped together services that allow the visualization of results. The service Cartographic visualization represented input data on a map. Here, only the previously filtered trajectories appeared on the map, as shown in Figure 4, on the right. In brief, only trajectory 1 corresponded to the daily movement of a tourist who passed through both the Minimes and Saint Nicolas districts (see initial question (1)).
We now used the processing chain shown in Figure 3 to illustrate an example of instantiation of the model. Inputs and outputs of each service were instances of the model: mobility tracks, raw or semantic trajectories. Figure 5 shows the corresponding instantiation of the model just before filtering (c.f. Figure 3, category 3).
The raw data level part (c.f. Figure 5, block c) shows the raw data collected for the Geoluciole tourist GeolucioleVisitor1. In this instantiation example, the track was composed of five spatio-temporal positions. Two trajectories resulted from the temporal construction service for a two-day track. Here, we were interested in the trajectory Trajectory1 of 23 November 2019.
The semantic data level part (c.f. Figure 5, block a) shows the aspects District1, District2 and District3 (instances of class Aspect) which each represented a different district. They were of District type (instance of class AspectType) and had as attributes a name DistrictName and a spatial footprint DistrictPolygon (instances of class AspectAttribute). Each relation between a district and an attribute was instantiated with the corresponding value shown as dotted links on the figure.
The interpretation level part (c.f. Figure 5, block b) shows what resulted from the segmentation service that created the interpretation and the episodes based on the enrichment of the positions. This step in the chain created the links between the episodes and districts and the corresponding interpretation. We could see three episodes attached to the instance Interpretation1 because the track passed through three districts at different times during the trip (i.e., Les Minimes, La Gare et Saint-Nicolas).
Later, after filtering, trajectory 1 appeared in the output because it passed through the two districts specified in question (1). For the sake of readability, the figure represents the mobility track of a single Geoluciole tourist.

5.1.3. Scenario 2: Study of Touristic Activities in Sunny Weather

We will now be answering question (2): what are tourist activities when the weather is sunny in summer in the different districts of La Rochelle?
Figure 6 shows the processing chain to answer this question.
First, we started from tourists’ mobility tracks, which entered a pre-processing phase (c.f. Figure 6, category 1). We were interested in the touristic activities in the different districts, therefore the construction of the trajectories was based on spatial criteria and used the zones describing the districts of La Rochelle.
The set of trajectories then entered the enrichment phase (c.f. Figure 6, category 2) which linked to each position aspect describing the touristic activities and the weather that was potentially associated with them, and then built for each trajectory an interpretation based on the enrichment with the touristic activities and another based on the weather enrichment.
The next phase (c.f. Figure 6, category 3) chained a temporal filtering that filtered only the trajectories that took place in summer based on the date of the positions and then a thematic filtering that filtered the trajectories that presented a sunshine episode in the interpretation created previously.
Finally, the visualization phase (c.f. Figure 6, category 4) allowed one to visualize the result of the previous treatments in the form of interpretations describing touristic activities. We obtained, for each trajectory, a sequence of touristic activity episodes carried out in a certain district of La Rochelle during the summer in sunny weather (c.f. initial question (2)).
Following the segmentation based on the enrichment with touristic activities (c.f. Figure 6, category 2), we obtained an interpretation based on this criterion for each trajectory. At this stage of the project, this enrichment was done manually from data collected through interviews with tourists. Figure 7 shows the different levels of data after this first segmentation. Following the pre-processing phase, we obtained, for tourist 1, two trajectories: one took place in the district Downtown, the other in the district Les Minimes. We show only the interpretation for the downtown trajectory in Figure 7. Thus, interpretation 1 was composed of five episodes describing the touristic activities carried out by the tourist at these times. Note that episodes 3 and 4 were imbricated in episode 1 and episode 5 was imbricated in episode 2.
Figure 8 shows the instantiation of the model just after the thematic enrichment with data related to touristic activities.
The raw data level part (c.f. Figure 8, block c) shows the collected raw data belonging to a specific Geoluciole tourist GeolucioleVisitor1 (i.e., Figure 7, visitor 1). In this instantiation example, the track was composed of six spatio-temporal positions. Two trajectories resulted from the spatial construction service because the track traversed two districts. In this instantiation example, we were interested in the downtown trajectory.
The semantic data level part (c.f. Figure 8, block a) shows the aspects Activity1, Activity2, Activity3, Activity4 and Activity5 (instances of class Aspect) each of which represented a different touristic activities. They were of type TouristicActivity (instance of class AspectType) and had as attribute a touristic activity concept ActivityThesaurusConcept (instance of class AspectAttribute). Each relation between an activity and an attribute was instantiated with the corresponding value, i.e., a concept of a thesaurus describing touristic activities that we used in the project (link to tourism and leisure thesaurus: https://vocabularyserver.com/ttla/en/index.php, accessed on 30 June 2021) (aspects Outings, Outdoor recreation, Window shopping, Dining out and Rambling). The part of the thesaurus that related to touristic activities is represented in Figure 9 and the concepts that we used in our scenario are framed in red.
The interpretation level part (c.f. Figure 8, block b) shows what resulted from the first segmentation service that created the interpretation and episodes based on previous enrichment. This step of the chain created links between positions and touristic activities and the corresponding interpretation. We could see five episodes linked to the instance Interpretation1, which were five touristic activities mentioned in the interview with the tourist (c.f. Figure 7, visitor 1). Episode 1 corresponded to the aspect Outlings (i.e., “outling” activity) and episode 2 corresponded to Outdoor recreation. Episodes 3 and 4 made up episode 1 and corresponded to Window shopping and Dining out respectively, and episode 5 made up episode 2 and corresponded to Rambling.
This part permitted us to demonstrate the interest of the model through two real scenarios. The model supported data from each service of a processing chain designed to answer a question asked by a geographer or a planner. In particular, we were able to see that the model supported the description of sequences of episodes supporting a hierarchy between episodes (i.e., touristic activities represented in multi-level sequences of episodes).

5.2. Genericity of the DA3T Model and Services

In order to ensure the generecity of our model and services in other contexts of track analysis, we tested it on two other datasets.

5.2.1. Experimentation on the Foursquare Dataset

Dataset Description

We used a real-world dataset containing trajectories of Foursquare users enriched with semantic aspects, presented in [12]. This data came from the social network Foursquare which allows its users to check in on points of interest (POI). There were 67,000 GPS positions for 193 Foursquare users whose check-ins were collected over 14 weeks in a row in New York in 2012 and 2013. For each check-in in the user trajectory, we had some features: latitude, longitude, time of the day, day of the week, etc.

Foursquare Data Processing

We wanted to answer question (3): What are the eating habits of a Foursquare user over the 14 weekends?
We set up the processing chain presented in Figure 10. The extraction service (c.f. Figure 10, category 1) allowed us to import source data in CSV format and to convert them to the format of our DA3T model. The following service buildt raw trajectories from mobility tracks. The question kindled our interest in the trajectories of users at the temporal scale of the day. Thus, the setting day indicated that the service built a trajectory per day and per person. Then, the filtering services (c.f. Figure 10, category 3) allowed one to retain a given user (i.e., the user with identifier 123456), their weekend mobility tracks, and the check-ins related to POI of type Food only. Finally, the chain ended with two visualization services (c.f. Figure 10, category 4) in a spatio-temporal cube: in order to analyze all the activities done by the user on all the weekends, on the one hand, and what they did in terms of catering these same weekends, on the other hand.

Foursquare Data Analysis

Figure 11, on the left, shows a 3-dimensional global view of the weekend check-ins of a Foursquare user over a 14-week period. We saw that this user stayed in the same geographical area. Figure 11, on the right, shows only Food check-ins. We saw distinctly two spatial corridors of recurrent activities. This user favored two districts (blocks) in New York for their food activities. For each of the spatial corridors, we could notice that the user consistently frequented the same set of establishments.

5.2.2. Experimentation on the Pelican Dataset

Dataset Description

We used actual pelican mobility tracks collected by Juliet Lamb as part of her Gulf of Mexico brown pelican activities observation [13]. There were a total of 170,000 GPS positions corresponding to the movements of 81 pelicans between 2013 and 2016: that is one capture per pelican every 90 min, daily. For each pelican, we had, among others, the following characteristics: latitude, longitude, timestamp, individual local identifier, tag local identifier, colony of belonging, etc.

Pelican Data Processing

We wanted to answer question (4): What is the behavior of a set of pelican colonies during the wintering period (i.e., February to March) and at the end of the breeding season (i.e., August)?
To this end, we implemented the processing chain described in Figure 12. The extraction service (c.f. Figure 12, category 1) imported the pelican tracks, source data in CSV format, and converted them to the format of our DA3T model. The following service buildt raw trajectories from the mobility tracks. The question pushed us to focus on pelican trajectories at the temporal scale of the day. Thus, the setting day indicates that the service constructed one trajectory per day and per pelican. Then, the filtering services (c.f. Figure 12, category 3) collected the tracks corresponding to the wintering period and the breeding period, respectively. Finally, for each of the two periods, the 3D Cube visualization service (c.f. Figure 12, category 4) presented the movement tracks of the pelicans concerned.

Pelican Data Analysis

We studied the trajectories of the 81 pelicans over two remarkable periods: the wintering season (i.e., mid-February to mid-March 2014) and the end of the breeding season (i.e., August 2014). We could compare pelican behaviors during the same year (i.e., 2014) over these two time periods (c.f. Figure 13). We found that during the wintering period (c.f. Figure 13, on the left), each colony’s breeding area remained occupied throughout the day (c.f. vertical tubes). By flying over GPS positions of a particular latitude, we could see that pelicans were moving but remained broadly within the same perimeter. In contrast, at the end of the breeding season (c.f. Figure 13, on the right), we could notice two types of behavior: migrating pelicans (c.f. non-straight tracks) to other geographic areas and resident pelicans (c.f. straight tracks). Each line in the cube corresponded to the daily movement of a pelican.

5.3. Experimentation Summary

These experimentations conducted on datasets from very different application domains have shown the generecity and robustness of the model and the DA3T platform. We have summarized those in Table 1. Thus, question 1 (c.f. Table 1, Q1) illustrates the multiple aspect of the proposed model through a classical example of mobility tracks processing. Question 2 (c.f. Table 1, Q2) focuses more on the multi-level dimension of the model, in this case, touristic activities illustrated through external descriptions (i.e., URI of resources). These activities are observed in the form of episodes with different levels of granularity. Question 3 (c.f. Table 1, Q3) demonstrates that the model and the platform work with data from social networks that are less accurate than GPS data. Finally, question 4 (c.f. Table 1, Q4) applies to a large dataset of 170,000 positions.

6. Conclusions and Perspectives

The DA3T project aims to propose models, methods and tools dedicated to the processing of tourist mobility data for the development and enhancement of the French Atlantic coast touristic territories. It is based on a mixed methodological approach of collecting tourist mobility data. These data are both heterogeneous and multidimensional (space, time and theme): digital tracks by GPS tracking, information on mobility and touristic activities from interviews and completed by the collection of contextual data from Open Data. The linking of these data requires the design of a multiple aspect and multi-level trajectory model. Therefore, the main contribution of this paper is to present the DA3T semantic trajectory model that integrates multi-level and multiple aspect features as well as its exploitation in processing chains. Multiple aspect models propose to link semantic aspects directly to points of the trajectory or to the whole trajectory. In our model, we propose (1) to link aspects to episodes of the trajectory. Moreover, our model illustrates what geographers are used to doing manually to analyze trajectories, that is, analyzing the trajectory under different semantic axes in order to draw a global conclusion about the movement of an individual. In our model, these semantic axes (i.e., Interpretation class) are represented by interpretations associated with a trajectory. Our model also integrates (2) the notion of ordered episodes (i.e., Episode class), an episode itself can be composed of other ones (multi-level approach). Each episode, disjoint or imbricated, is enriched with (3) semantic aspects (i.e., Aspect class) that allow one to represent real-world objects using attributes of spatial, temporal and thematic dimensions (i.e., SpatialValue, ThematicValue and TemporalValue classes).
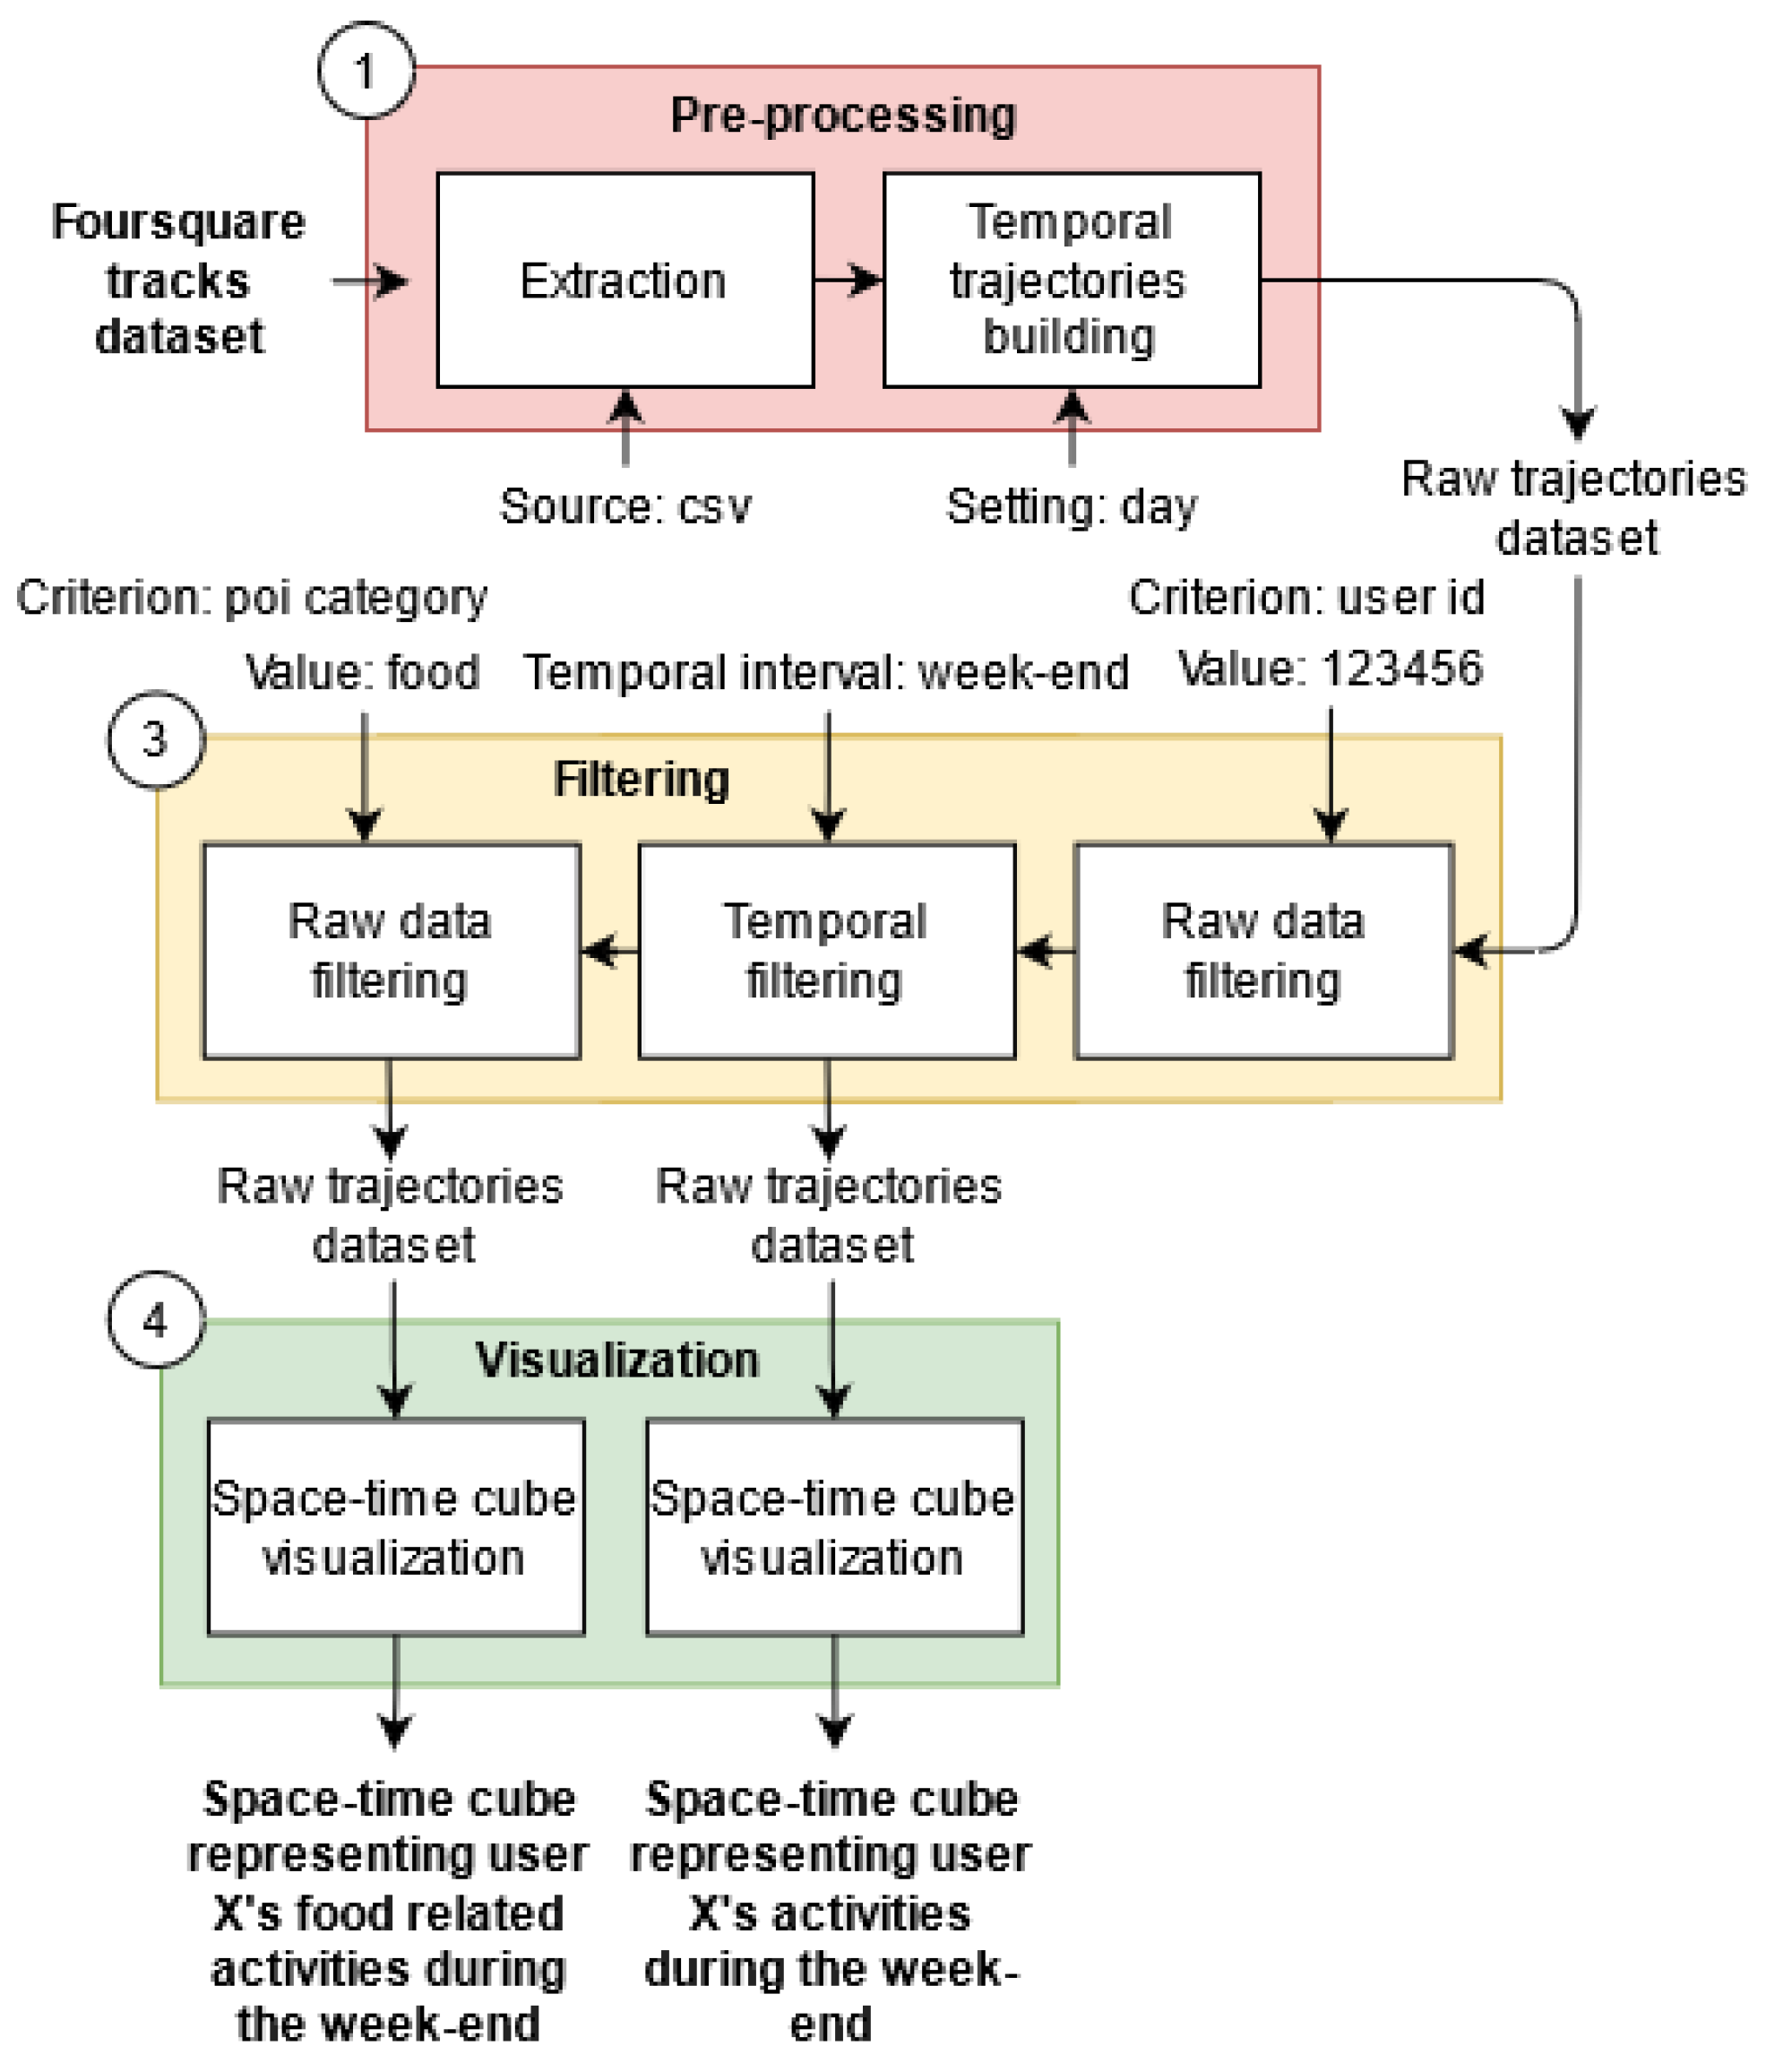
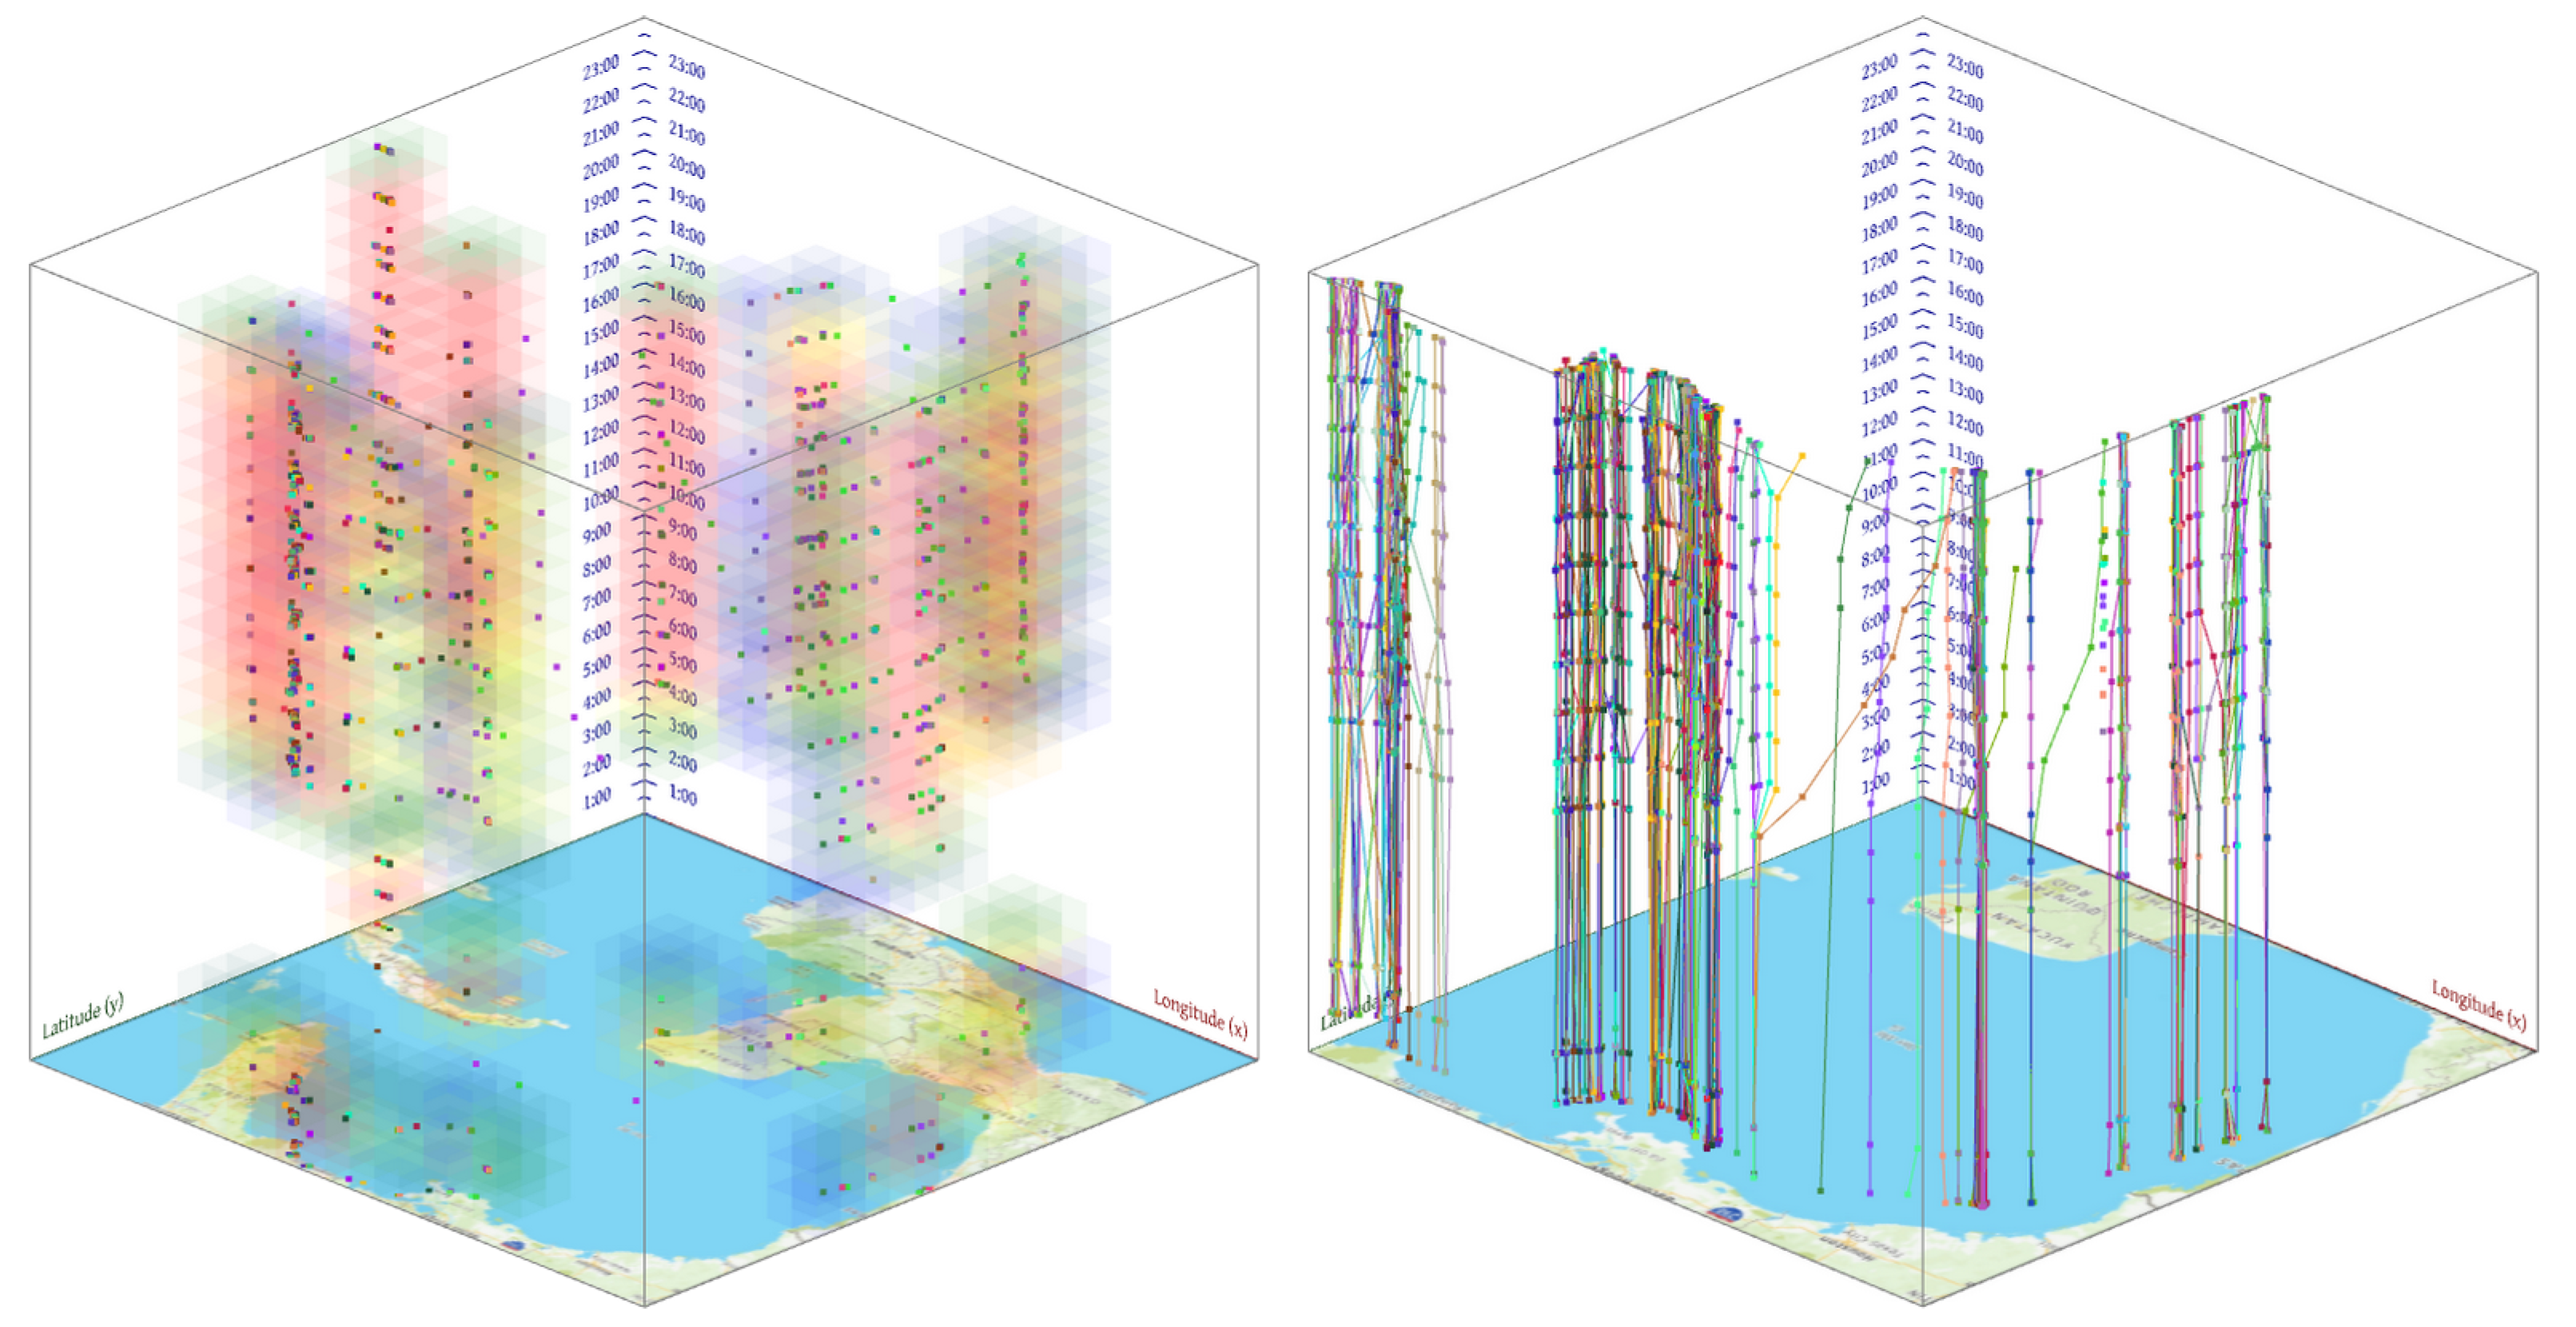
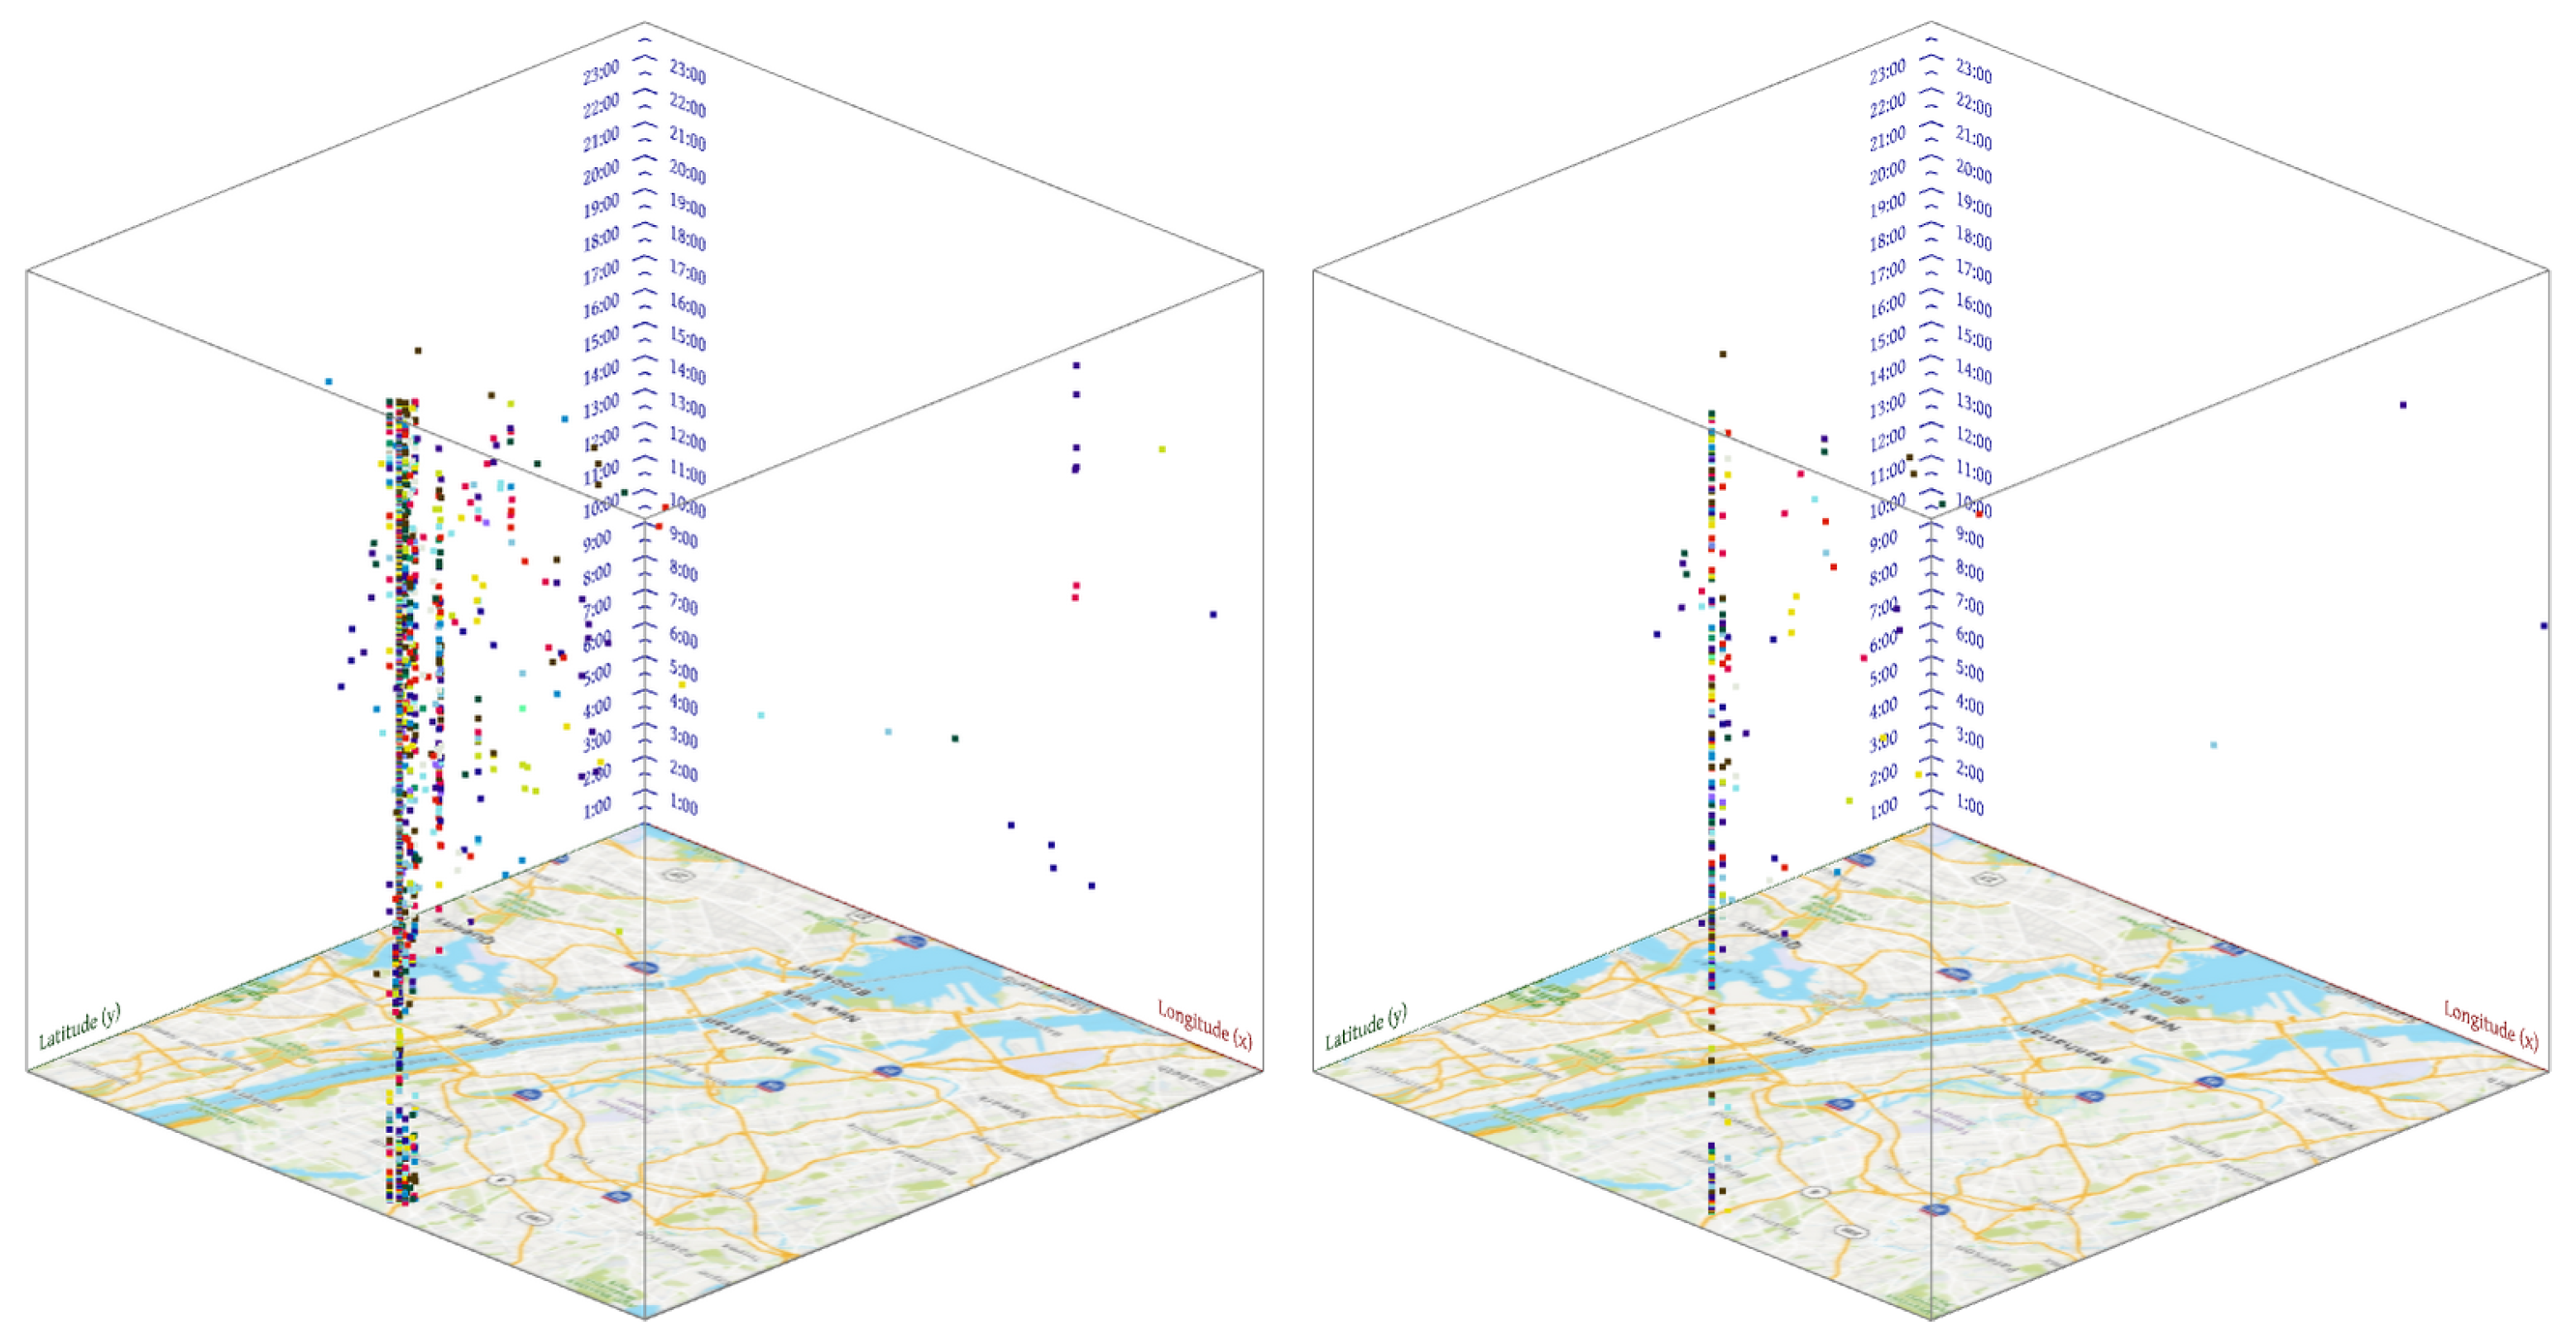
Through four scenarios, we explained these characteristics but also the generecity of our model by confronting it with mobility data from other application domains (i.e., Foursquare data and migratory birds data). These various experimentations allowed us to validate our approach and to show the capacity of implementing different processing chains facilitating the processing, analysis and visualization of heterogeneous mobility data. For the semantic, we mobilized several types of resources: ontologies concerning, for example, touristic activities, Open Data for meteorology, points of interest or city districts can be integrated.
The model is already implemented in the customized DA3T processing platform where the input and output data of each service are instances of the model. For now, we have tested and validated it on outdoor mobility data. We now want to implement it on indoor mobility data corresponding to museum visits. Moreover, we are experimenting with trajectory and tourist aggregation services with semantic similarities (Pattern and MobileObjectCategory classes). Finally, we are working on services exploiting tourists’ interviews to enrich their trajectories. In the longer term, the goal is to develop a platform that can be fully customized by non-computer end-users.

Author Contributions

Writing—original draft preparation, Cécile Cayèré, Christian Sallaberry, Marie-Noëlle Bessagnet, Maxime Masson; writing—review and editing, Cécile Cayèré, Christian Sallaberry, Philippe Roose, Marie-Noëlle Bessagnet, Cyril Faucher, Jérémy Richard. All authors have read and agreed to the published version of the manuscript.

Funding

This research was funded by the Nouvelle Aquitaine region grant number 2018-1R40225.

Conflicts of Interest

The authors declare no conflict of interest. The funders had no role in the design of the study; in the collection, analyses, or interpretation of data; in the writing of the manuscript, or in the decision to publish the results.

References

  1. Parent, C.; Spaccapietra, S.; Renso, C.; Andrienko, G.L.; Andrienko, N.V.; Bogorny, V.; Damiani, M.L.; Gkoulalas-Divanis, A.; Macêdo, J.A.F.; Pelekis, N.; et al. Semantic trajectories modeling and analysis. ACM Comput. Surv. 2013, 45, 42:1–42:32. [Google Scholar] [CrossRef]
  2. Yan, Z.; Parent, C.; Spaccapietra, S.; Chakraborty, D. A Hybrid Model and Computing Platform for Spatio-semantic Trajectories. In The Semantic Web: Research and Applications; Lecture Notes in Computer Science; Springer: Berlin/Heidelberg, Germany, 2010; pp. 60–75. [Google Scholar]
  3. Yan, Z.; Chakraborty, D.; Parent, C.; Spaccapietra, S.; Aberer, K. SeMiTri: A Framework for Semantic Annotation of Heterogeneous Trajectories. In Proceedings of the 14th International Conference on Extending Database Technology (EDBT 2011), Uppsala, Sweden, 21–24 March 2011. [Google Scholar]
  4. Spaccapietra, S.; Parent, C.; Damiani, M.L.; de Macedo, J.A.; Porto, F.; Vangenot, C. A conceptual view on trajectories. Data Knowl. Eng. 2008, 65, 126–146. [Google Scholar] [CrossRef] [Green Version]
  5. Baglioni, M.; Macedo, J.; Renso, C.; Wachowicz, M. An Ontology-Based Approach for the Semantic Modelling and Reasoning on Trajectories. In Advances in Conceptual Modeling—Challenges and Opportunities; Lecture Notes in Computer Science; Springer: Berlin/Heidelberg, Germany, 2008; pp. 344–353. [Google Scholar]
  6. Yan, Z.; Macêdo, J.; Parent, C.; Spaccapietra, S. Trajectory Ontologies and Queries. Trans. GIS 2008, 12, 75–91. [Google Scholar] [CrossRef]
  7. Frihida, A.; Zheni, D.; Ghezala, H.B.; Claramunt, C. Modeling Trajectories: A Spatio-Temporal Data Type Approach. In Proceedings of the 20th International Workshop on Database and Expert Systems Application, Linz, Austria, 31 August–4 September 2009; pp. 447–451. [Google Scholar]
  8. Fileto, R.; May, C.; Renso, C.; Pelekis, N.; Klein, D.; Theodoridis, Y. The Baquara2 knowledge-based framework for semantic enrichment and analysis of movement data. Data Knowl. Eng. 2015, 98, 104–122. [Google Scholar] [CrossRef]
  9. Nogueira, T.P.; Braga, R.B.; de Oliveira, C.T.; Martin, H. FrameSTEP: A framework for annotating semantic trajectories based on episodes. Expert Syst. Appl. 2018, 92, 533–545. [Google Scholar] [CrossRef]
  10. Mello, R.D.; Bogorny, V.; Alvares, L.O.; Santana, L.H.Z.; Ferrero, C.A.; Frozza, A.A.; Schreiner, G.A.; Renso, C. MASTER: A multiple aspect view on trajectories. Trans. GIS 2019, 23, 805–822. [Google Scholar] [CrossRef] [Green Version]
  11. Cayèré, C.; Faucher, C.; Sallaberry, C.; Bessagnet, M.N.; Roose, P. Tools for processing digital trajectories of tourists. In Proceedings of the 21st IEEE International Conference on Mobile Data Management (MDM), Versailles, France, 30 June–3 July 2020; pp. 232–233. [Google Scholar]
  12. Varlamis, I.; Sardianos, C.; Bogorny, V.; Alvares, L.O.; Carvalho, J.T.; Renso, C.; Perego, R.; Violos, J. A novel similarity measure for multiple aspect trajectory clustering. In Proceedings of the SAC’21: The 36th ACM/SIGAPP Symposium on Applied Computing, Virtual Event, 22–26 March 2021; ACM: New York, NY, USA; pp. 551–558. [Google Scholar] [CrossRef]
  13. Lamb, J.S.; Satgé, Y.G.; Jodice, P.G.R. Influence of density-dependent competition on foraging and migratory behavior of a subtropical colonial seabird. Ecol. Evol. 2017, 7, 6469–6481. [Google Scholar] [CrossRef] [PubMed] [Green Version]
Figure 1. (a) Extract of a mobility track from the Geoluciole application, each point corresponds to a spatio-temporal position of a tourist visiting La Rochelle; (b) points of interest of the city from Open Data; (c) extracts of the interview corresponding to the track.
Ijgi 10 00592 g001
Figure 2. Semantic trajectory model: (a) semantic data level, (b) interpretation level, (c) raw data level.
Ijgi 10 00592 g002
Figure 3. Customized processing chain to answer question (1).
Ijgi 10 00592 g003
Figure 4. On the (left), result after the service temporal trajectories building, on the (right), result after the service thematic filtering.
Ijgi 10 00592 g004
Figure 5. Instantiation of the model just before the filtering process to answer question (1).
Ijgi 10 00592 g005
Figure 6. Customized processing chain to answer question (2).
Ijgi 10 00592 g006
Figure 7. Example of a trajectory interpretation.
Ijgi 10 00592 g007
Figure 8. Instantiation of the model just after the thematic enrichment with touristic activities to answer question (2).
Ijgi 10 00592 g008
Figure 9. Concept Leisure activities of the tourism and leisure thesaurus.
Ijgi 10 00592 g009
Figure 10. Customized processing chain to answer question (3).
Ijgi 10 00592 g010
Figure 11. Foursquare check-ins for user 123456: on the (left), all activities; on the (right), restaurant activities.
Ijgi 10 00592 g011
Figure 12. Customized processing chain to answer question (4).
Ijgi 10 00592 g012
Figure 13. Pelican trajectories: on the (left), wintering; on the (right), breeding.
Ijgi 10 00592 g013
Table 1. Summary of experimentations.
QuestionDatasetCollection Period(s) and Location(s)Lock Lifted
Q1: What are the mobility tracks that passed through the district Les Minimes and through the district Saint-Nicolas in the same day?GPS tracks of 92 visitors with a total of 118,951 spatio-temporal positionsSummer 2019 and 2020, La Rochelle, FranceMultiple aspect dimension of the model
Q2: What are the touristic activities of tourists when the weather is sunny in summer in the different districts of La Rochelle?GPS tracks of 92 visitors with a total of 118,951 spatio-temporal positionsSummer 2019 and 2020, La Rochelle, FranceMulti-level dimension of the model
Q3: What are the eating habits of a Foursquare user over the 14 weekends?GPS tracks of 193 Foursquare users with a total of 67,000 spatio-temporal positions (check-ins)14 weeks in a row in 2012 and 2013, New York, United-StatesGenericity of the model and the platform
Q4: What is the behavior of a set of pelican colonies during the wintering period (i.e., February to March) and at the end of the breeding season (i.e., August)?GPS tracks of 81 pelicans with a total of 170,000 spatio-temporal positionsBetween 2013 and 2016, Gulf of MexicoGenericity of the model, robustness of the platform
Publisher’s Note: MDPI stays neutral with regard to jurisdictional claims in published maps and institutional affiliations.

