3.1. Results on Cognitive Mapping
The participants’ drawing order was recorded on video. We found that 68.8% of the participants drew metro routes first before drawing specific points (e.g., stations, transfer stations, or terminal stations) and annotated station names before extending other routes from a transfer station. Notably, all the participants drew the horizontally oriented Blue line first, the vertically oriented Red line next, and then other routes. The first station drawn by 46.9% of the participants was Taipei Main Station where the Blue line and Red line intersect (
Table 1). Taipei Main Station was annotated by 30 of the 32 participants. In fact, according to metro statistics, the Blue line and Red line are the routes in the Taipei Metro with the highest and the second highest ridership, respectively. Thus, Taipei Main Station, being located at the center of the route map and with the highest ridership, was prominently placed in the participants’ drawing order. This indicated that for the participants in this cognitive mapping, the location where the horizontal and vertical lines intersected, at Taipei Main Station, was their most familiar and definite knowledge point regarding the route map.
Overall, 71.9% of the participants opted to use rounded corners to depict the turning points of the metro lines. This finding corresponds with that of Nagao et al. [
9] who indicated that rounded corners at route turning points are critical for representing route continuation. This finding indicated that rounded corners on a route map facilitated the representation of route extensions; these rounded corners could also be turned into large rounded corners and even curves to represent route orientations to support a person’s cognitive memory. Three types of compositions were identified based on participants’ drawing of lines and turning points on a route map: straight lines and corners (SCs), straight lines and rounded corners (SRs), and curved and rounded corners (CRs). Most participants used CRs for representations on the cognitive map. Among the participants using SCs, SRs, and CRs, a significant difference was observed between drawing points first and drawing lines first (
p = 0.015 [<0.05]). Those using SCs all drew lines first and points next; a third of those using SRs drew lines first and points next; half of those using CRs drew lines first and points next (
Table 2).
The following elements used by the participants when drawing a cognitive route map were assessed: use of color, use of transfer stations, use of terminal stations, and use of graphics; these elements were used to facilitate memorization when representing information on the drawing. The results are summarized in
Table 3.
In drawing the cognitive route map, 90.6% of the participants used colors to facilitate memorization; 68.8% of these participants used the five correct colors to draw the five main routes. The number of women using colors was significantly higher than that of men using colors (
p = 0.003 [<0.05]), indicating that color was among the factors related to participants’ memory of the route map. We found that among the elements used by the participants, transfer stations, terminal stations, and features of route forms were widely used. Overall, 96.9% of the participants drew transfer stations, and 93.8% drew terminal stations. The percentage of those who drew transfer stations was significantly correlated with the participants’ metro usage experience (
p = 0.0016 [<0.05]) (
Table 3). Participants taking the metro more frequently drew more transfer stations, and those who drew more transfer stations also drew more terminal stations (r = 0.74 **, strong correlation). The participants who drew lines first and points next annotated more transfer stations than did those who drew points first and lines next (
p = 0.0418).
This finding indicated that transfer and terminal stations were crucial elements in the cognitive route maps in the participants’ minds, in the drawing process. Most participants tended to annotate a transfer station before adding details on the cognitive route map of an area. Regarding participants’ rate of drawing transfer stations, we found that it was the highest for Taipei Main Station and then tended to decrease with distance from this main transit station (
Table 4).
Participants’ cognitive memory of terminal stations was relatively similar. The results revealed that most participants were influenced by the distribution and locations of these stations on the map drawing. For example, Tamsui metro station, which was located on the top of the vertical orientation, and Taipei Nangang Exhibition Center metro station, which was located at the far right of the drawing and had memorization graphics, were the most frequently drawn terminal stations (
Table 5).
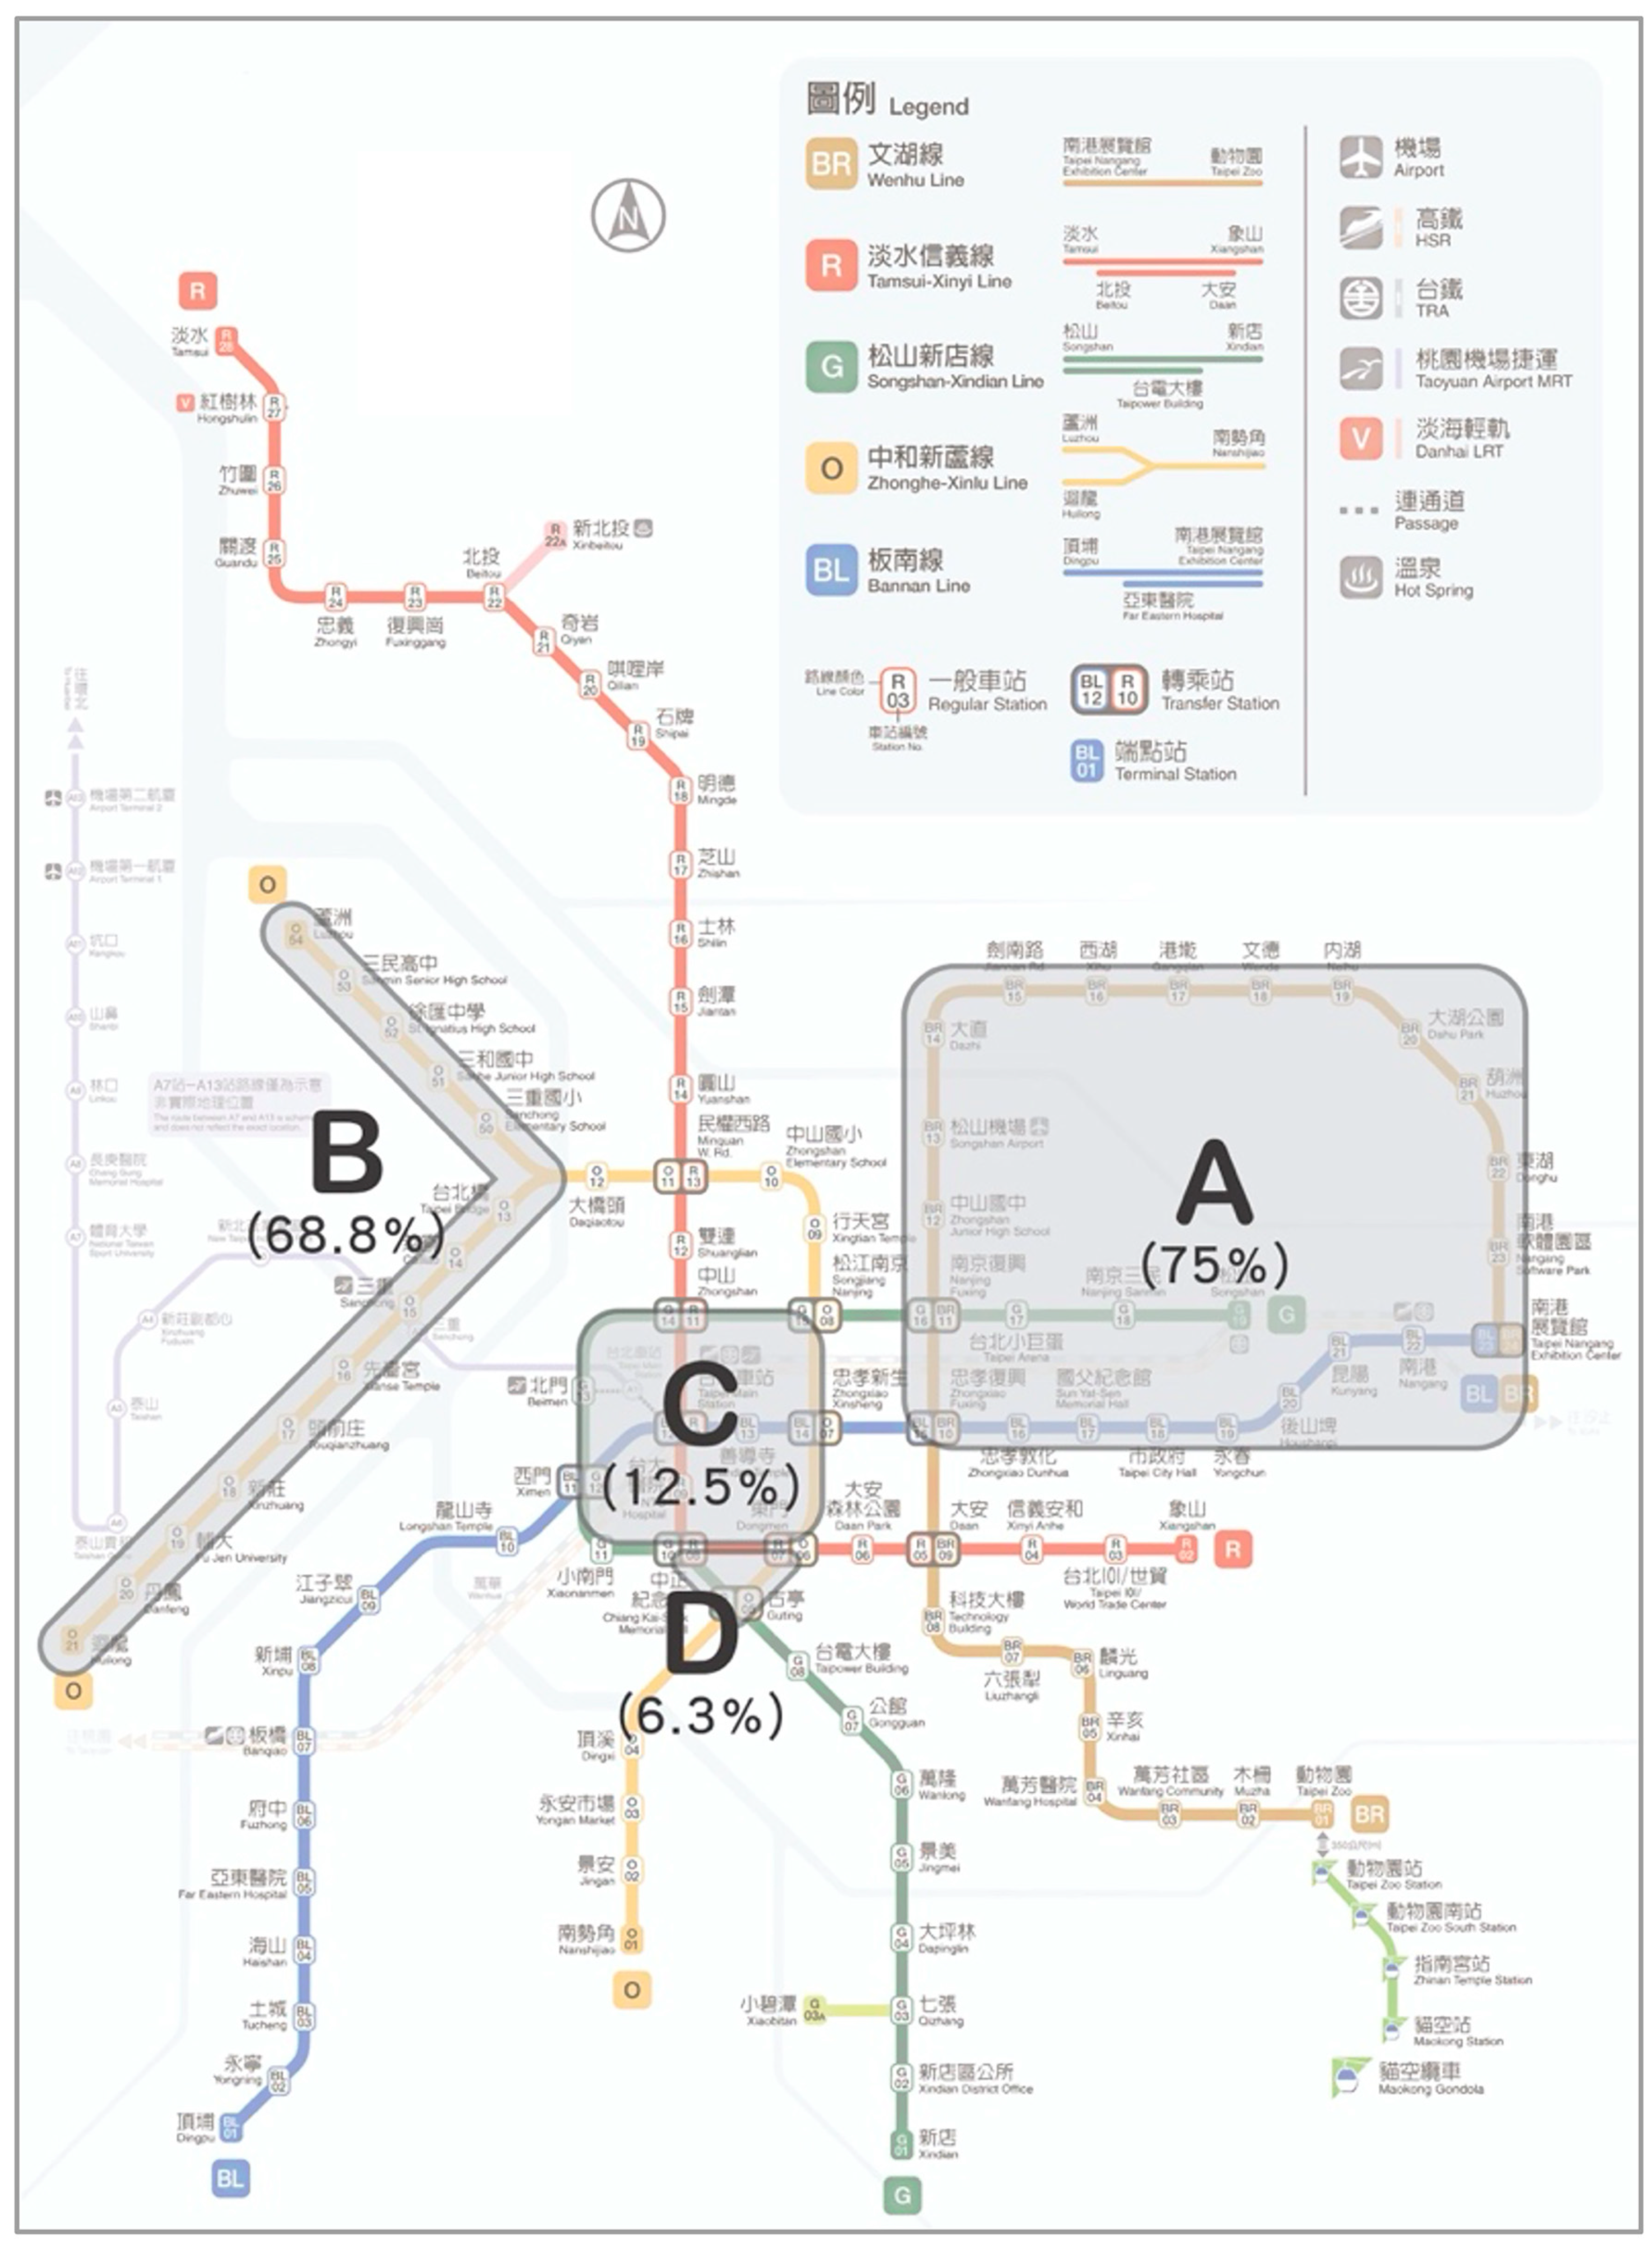
In total, 90.6% of the participants used at least one type of graphic to facilitate memory as they drew the routes. Most participants stated that they could memorize clearly the graphics formed by the routes on the map, such as the square shape formed by the Brown line in the upper right and the forked shape of the route to the left of the drawing, which ended in two terminal stations. The results revealed that 75% of the participants drew an obvious square shape (A) in figure X in the upper right of the drawing, and 68.8% of the participants drew a forked shape (B) in figure X to the left of the drawing. A few participants drew the shape of the central part (C) in figure X and a triangular shape (D), accounting for 12.5% and 6.3% of all drawings, respectively (
Figure 4).
As the participants were drawing the cognitive route map, we found that the participants were often uncertain about whether the routes involved turning points, as indicated by observations such as “in my memory, this route leads to the lower left corner,” “this should be straight,” and “I remember there was a turning point here.” Some participants stated that they particularly remembered the turning points of routes or intersections involving transfer stations.
In summary, we found that most of the participants first drew routes and then stations, and almost all the participants designated routes using various colors. In the participants’ cognitive mapping, they employed three types of route composition, namely SCs, SRs, or CRs, to represent the graphic features of the routes, and they annotated transfer stations and terminal stations. Regarding the participants’ route map drawing order, they drew graphics of routes and areas first, followed by annotation of transfer stations at route intersections as well as the start and terminal stations of the routes (
Table 6). Although they were not statistically significant, we will be comparing the subsequent three map proposals in particular.
A metro route map was gradually constructed with points, lines, and areas. Greater metro usage experience enabled participants to draw more transfer and terminal stations. Taipei Main Station was not only the station most frequently annotated but also the station typically annotated first. At route turning points, 68.8% of the participants opted to use rounded corners to represent the turning, revealing that the rounded corners on the route map facilitated route representation and supported the participants’ cognitive memorization (
Figure 4).
3.2. Results on Route Tasks
We referenced the basic elements of route map composition proposed by Nagao et al. [
15]; thus, stations, routes, and transfer station served as the items for classification. Based on the model of route description and analysis of Brosset [
20], we coded the elements of composition to facilitate the conversion of the routes planned by the participants into a visualized route planning model. We employed two types of route tasks: (1) route planning with designated start and end stations and (2) route planning with designated start and end stations with the requirement of passing three designated stations on the way. Each type of route task involved three subtasks; the participants were instructed to plan the route that they considered the fastest (routes with the fewest transfers or stops). We want to understand how users base their route planning on distance, travel time, or the number of transfers between different distances’ start and end station.
- (1)
Route planning task with designated start and end stations
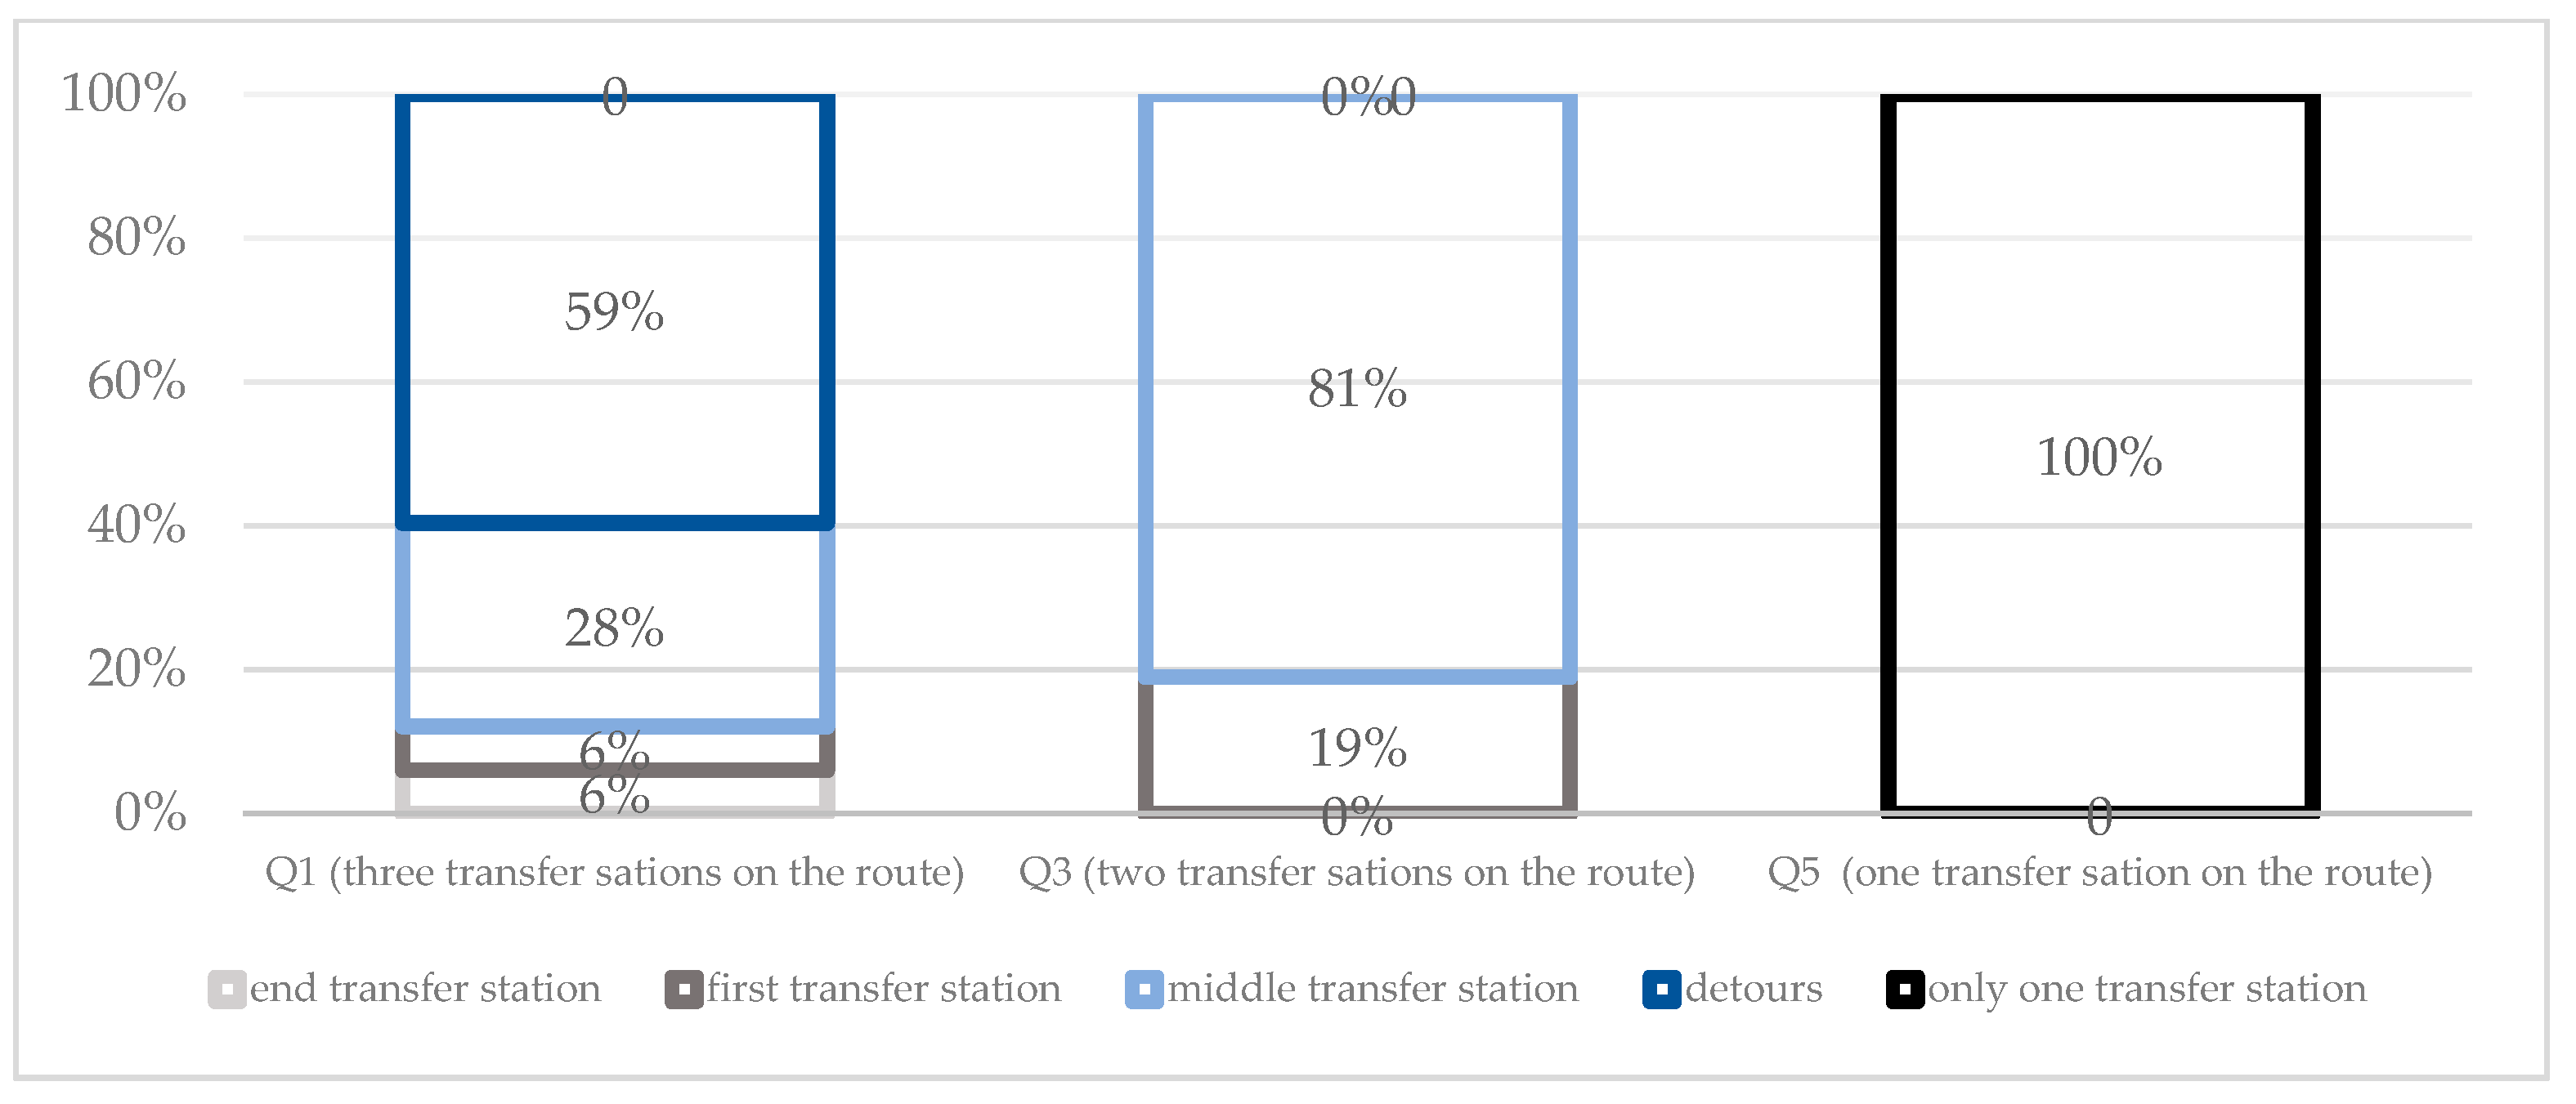
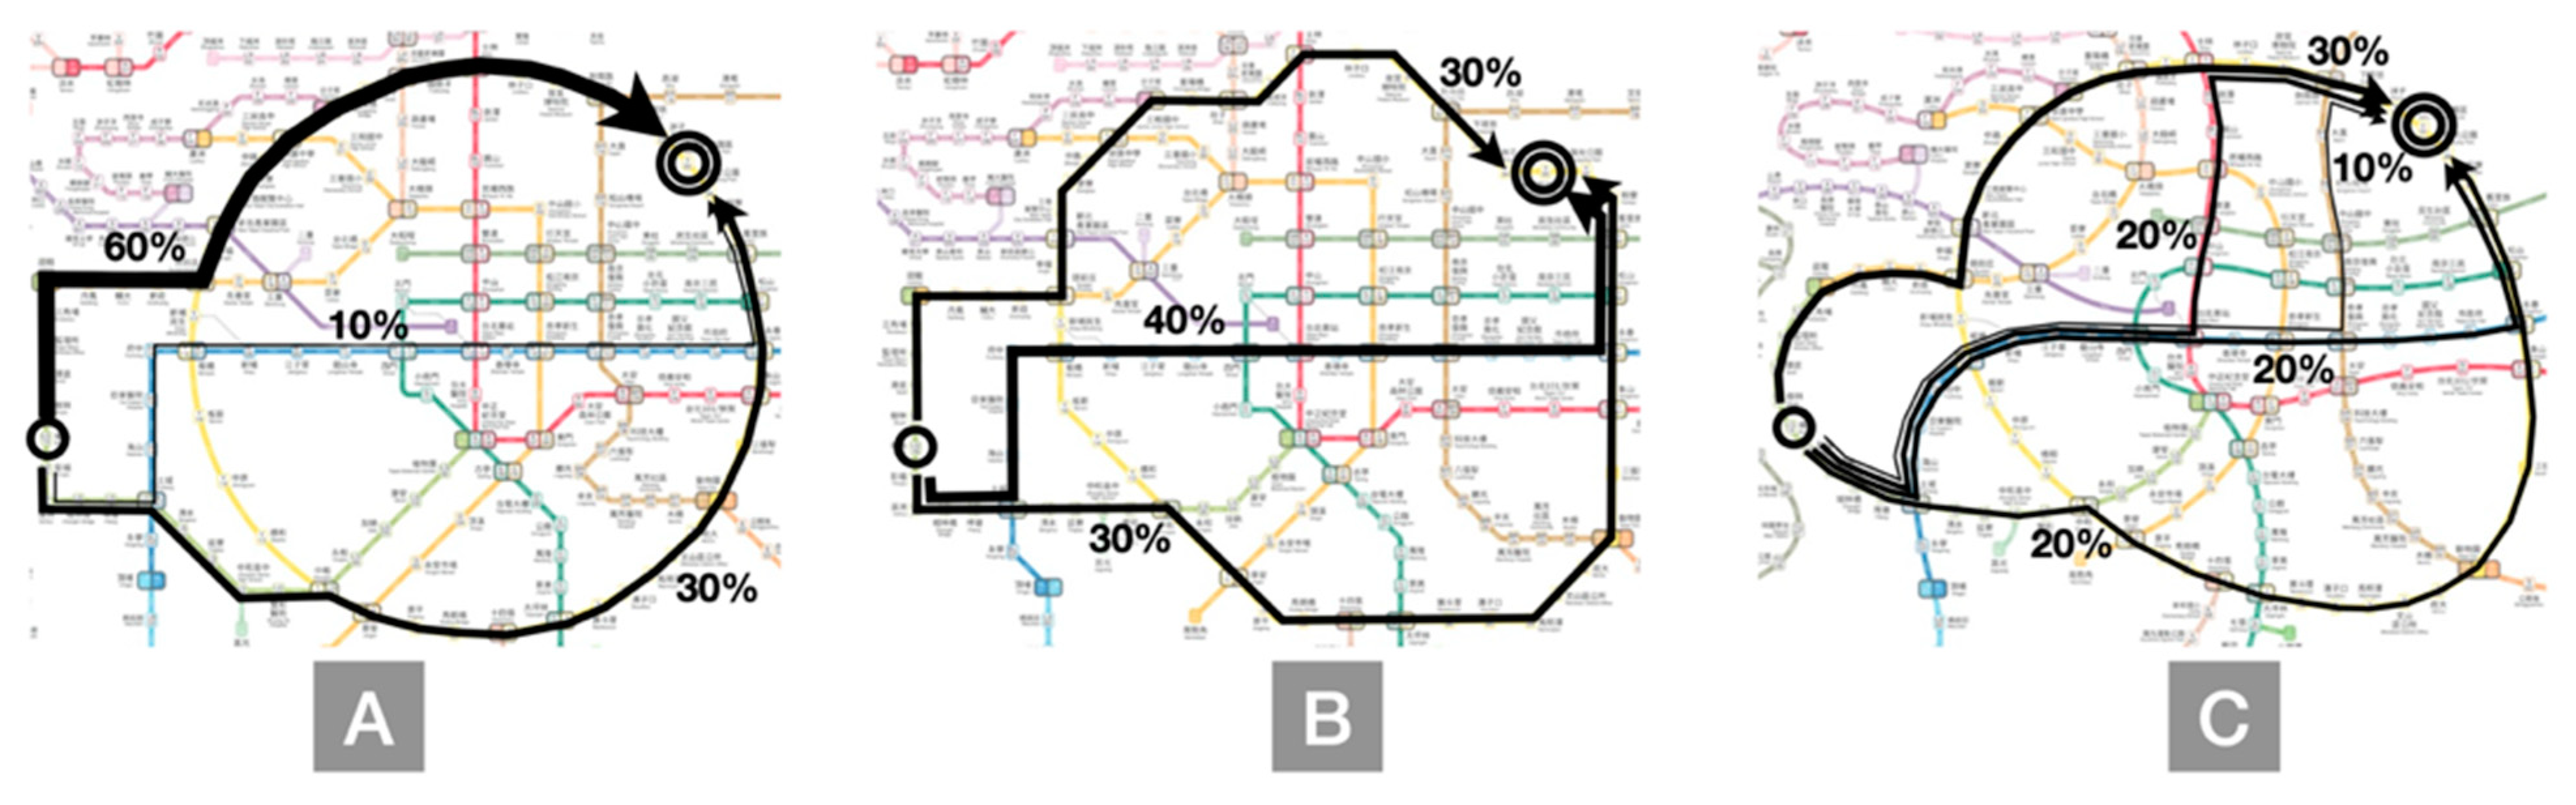
In Tasks Q1, Q3, and Q5, the participants were instructed to plan routes with designated start and end stations. Task Q1 required two transfers; for the first transfer, three transfer stations were available for selection, and for the second transfer, only one transfer station was available. Task Q3 required one transfer, and two transfer stations were available for selection. Task Q5 required one transfer, and only one transfer station was available. The experimental results indicated that in more complex tasks, the participants spent more time on planning. Although all the participants planned routes with the fewest transfers in Tasks Q1, Q3, and Q5, only in Task Q5, with the simplest route, did all the participants plan routes with the fewest stops. In Task Q3, 81.25% of the participants used routes with the fewest stops, whereas in Task Q1, only 34.38% of the participants employed this approach; notably, some participants exhibited large deviations from the average. This indicated that a larger number of necessary transfers and transfer station options resulted in a lower percentage of the participants being capable of planning routes with the fewest stops. In the current route map, using multiple transfers was challenging. Regarding transfer station options, the last available transfer station tended to be selected for transfer (56% of the participants in Task Q1; 81% of the participants in Task Q3). The participants tended to select transfer stations closer to the end station (
Figure 5).
- (2)
Route planning tasks with designated start and end stations and the requirement of passing three designated stations (Q2, Q4, and Q6)
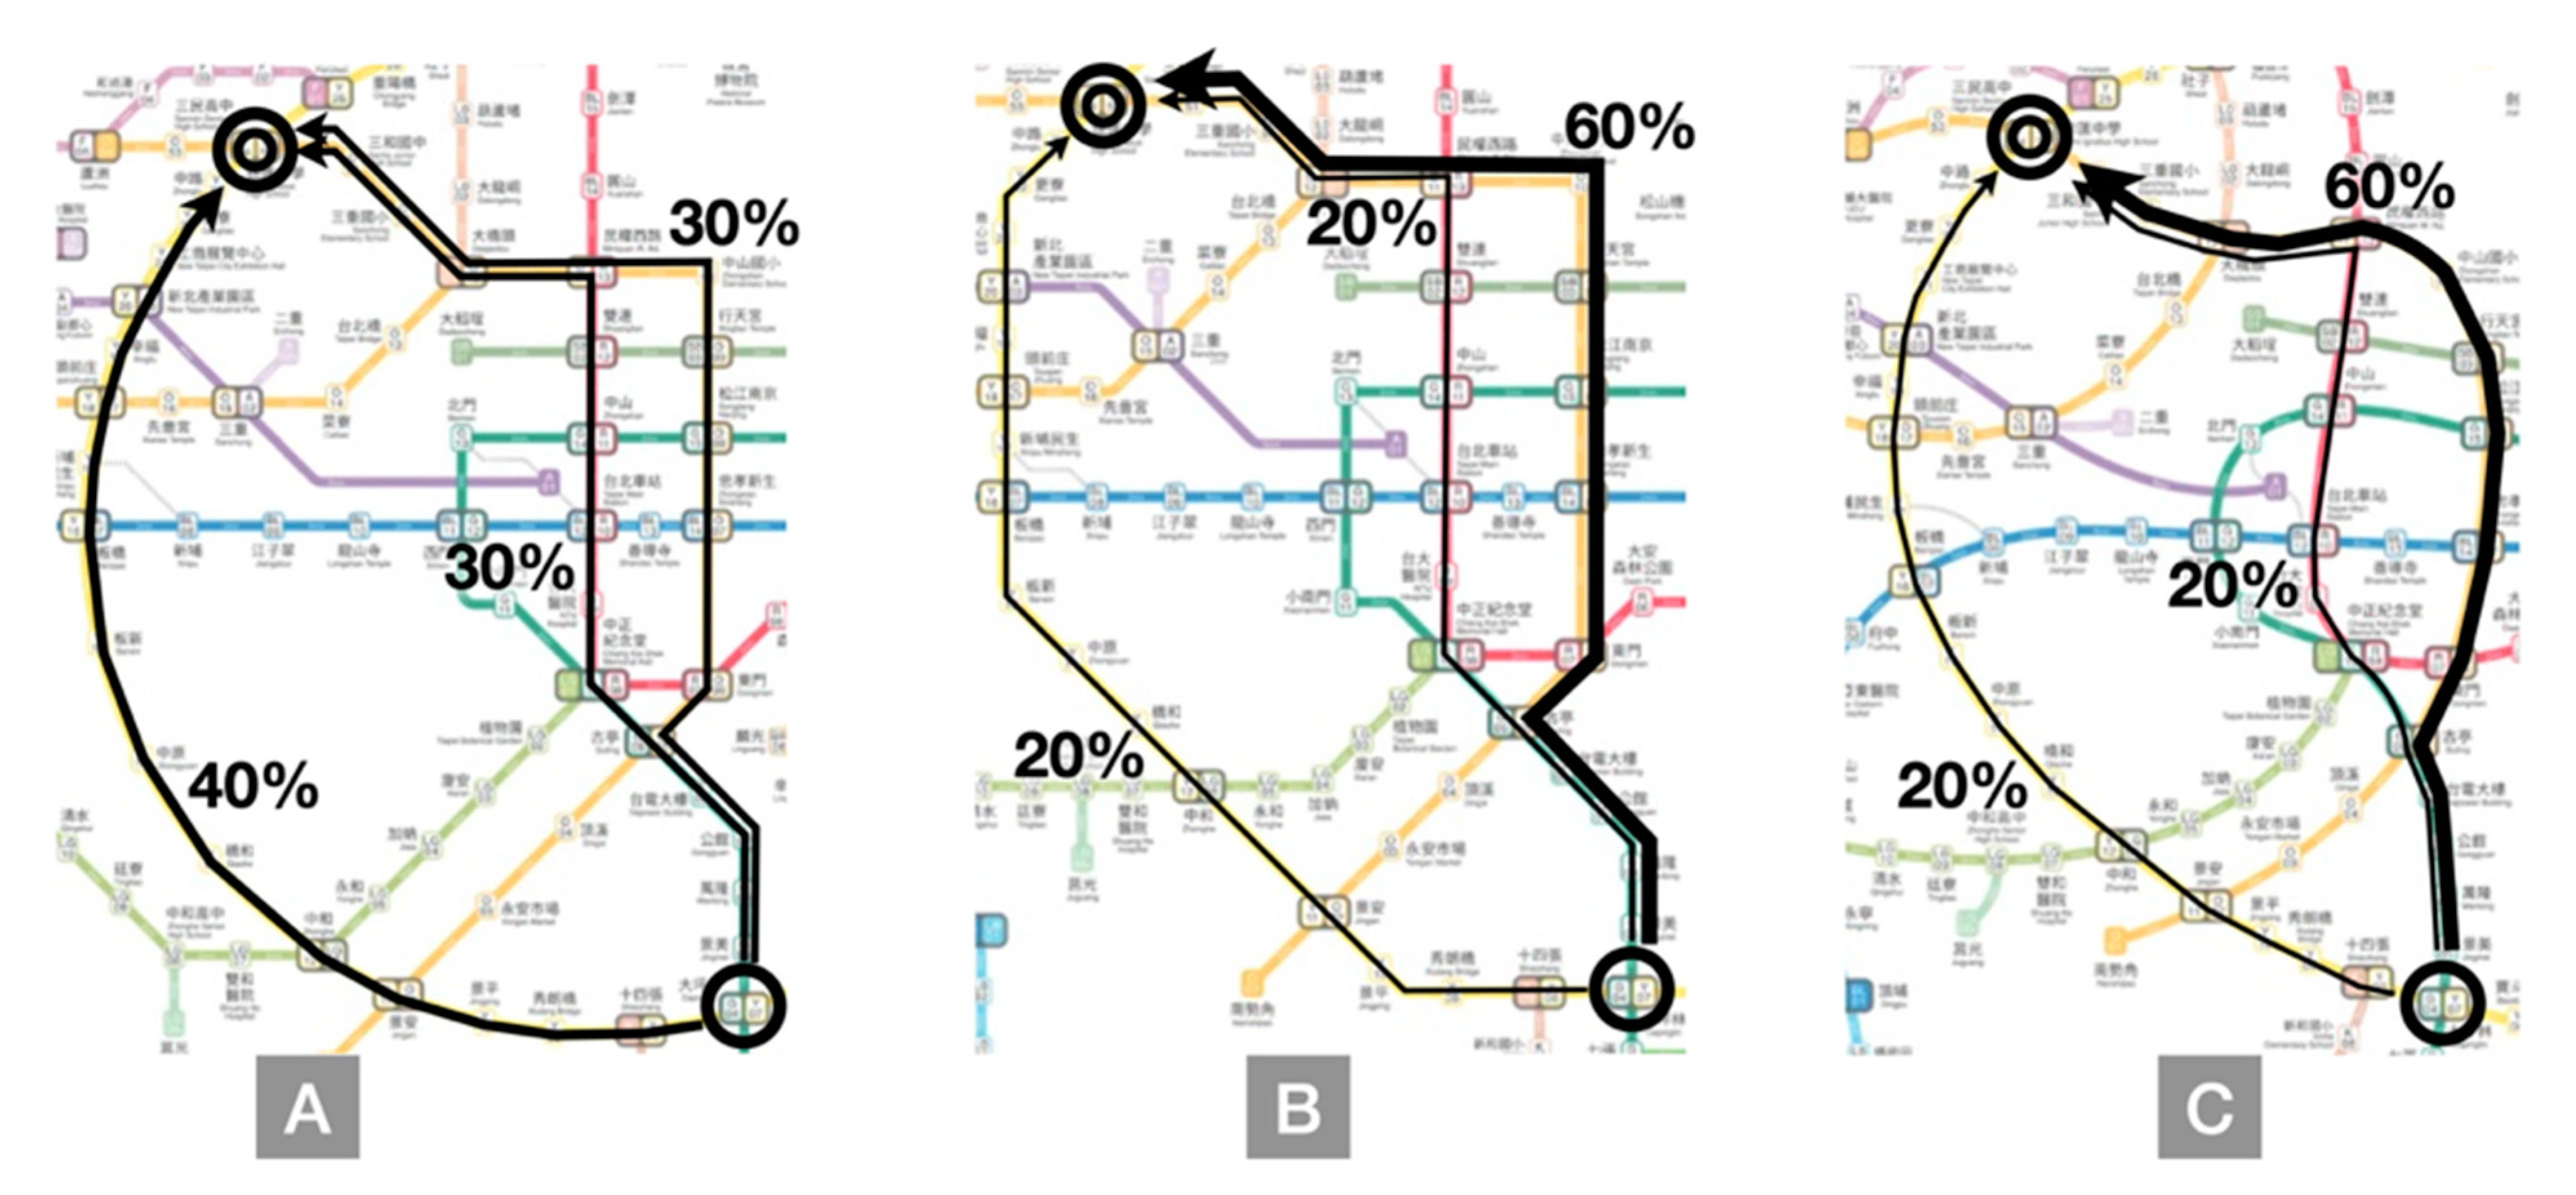
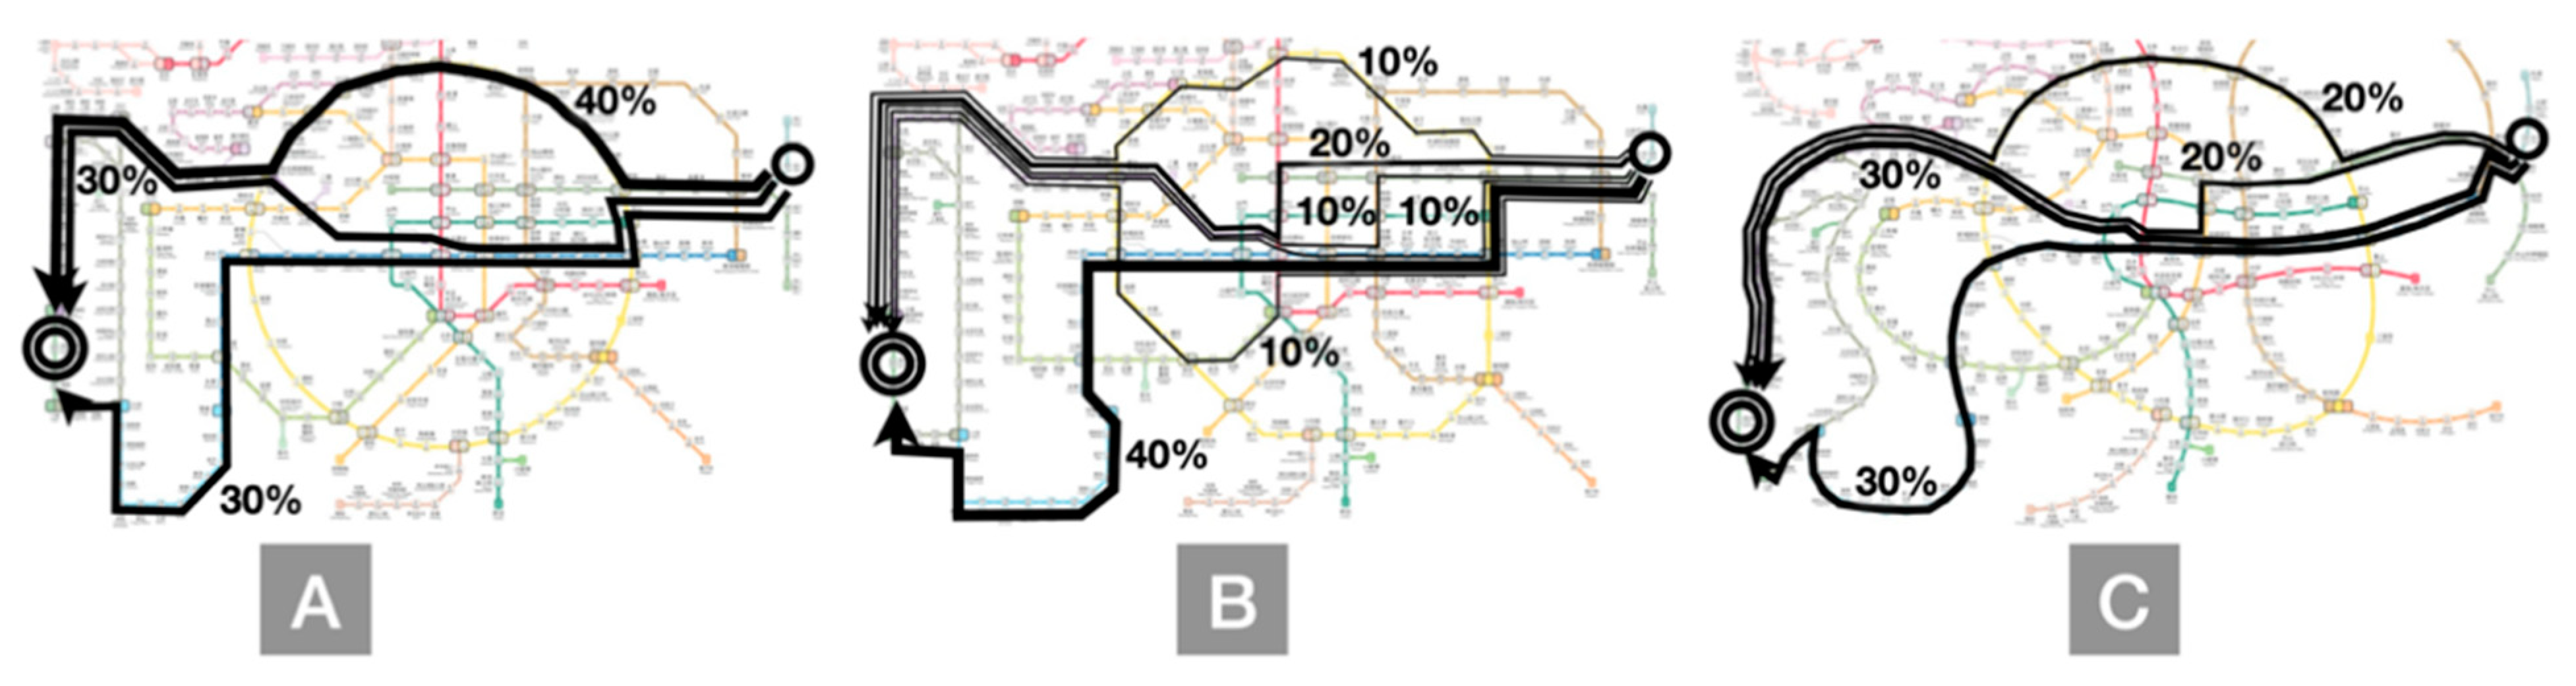
In Tasks Q2, Q4, and Q6, the participants could decide the order in which they pass the three required stations. Thus, in addition to considering the start and end stations, the route planning involved simultaneously considering the locations of five stations. The starting point in Task Q2 was the southernmost of all tasks. Among the five stations, the distance between the southernmost and northernmost stations was much longer than that between the easternmost and westernmost stations. Therefore, the participants had to focus on vertical routes. The results indicated that 53% of the participants chose the southernmost station as their start station and moved northward before returning to the end station in the center. The starting point in Task Q4 was the westernmost. The distance between the easternmost and westernmost stations was much longer than that between the southernmost and the northernmost stations. Thus, the journey involved more horizontal routes. The results indicated that 72% of the participants opted to start from the westernmost station and move toward stations to the east before returning to the end station in the center. In Task Q6, the distance between the easternmost and westernmost stations was only slightly longer than that between the southernmost and northernmost stations. The results revealed that 50% of the participants opted to start from the easternmost station and move westward. Because the participants planned routes according to the locations of the given five stations, most of them planned their routes according to the distances of these locations to avoid detours. In this manner, more efficient routes were planned, the number of stops passed generally decreased, and the time required was shorter.
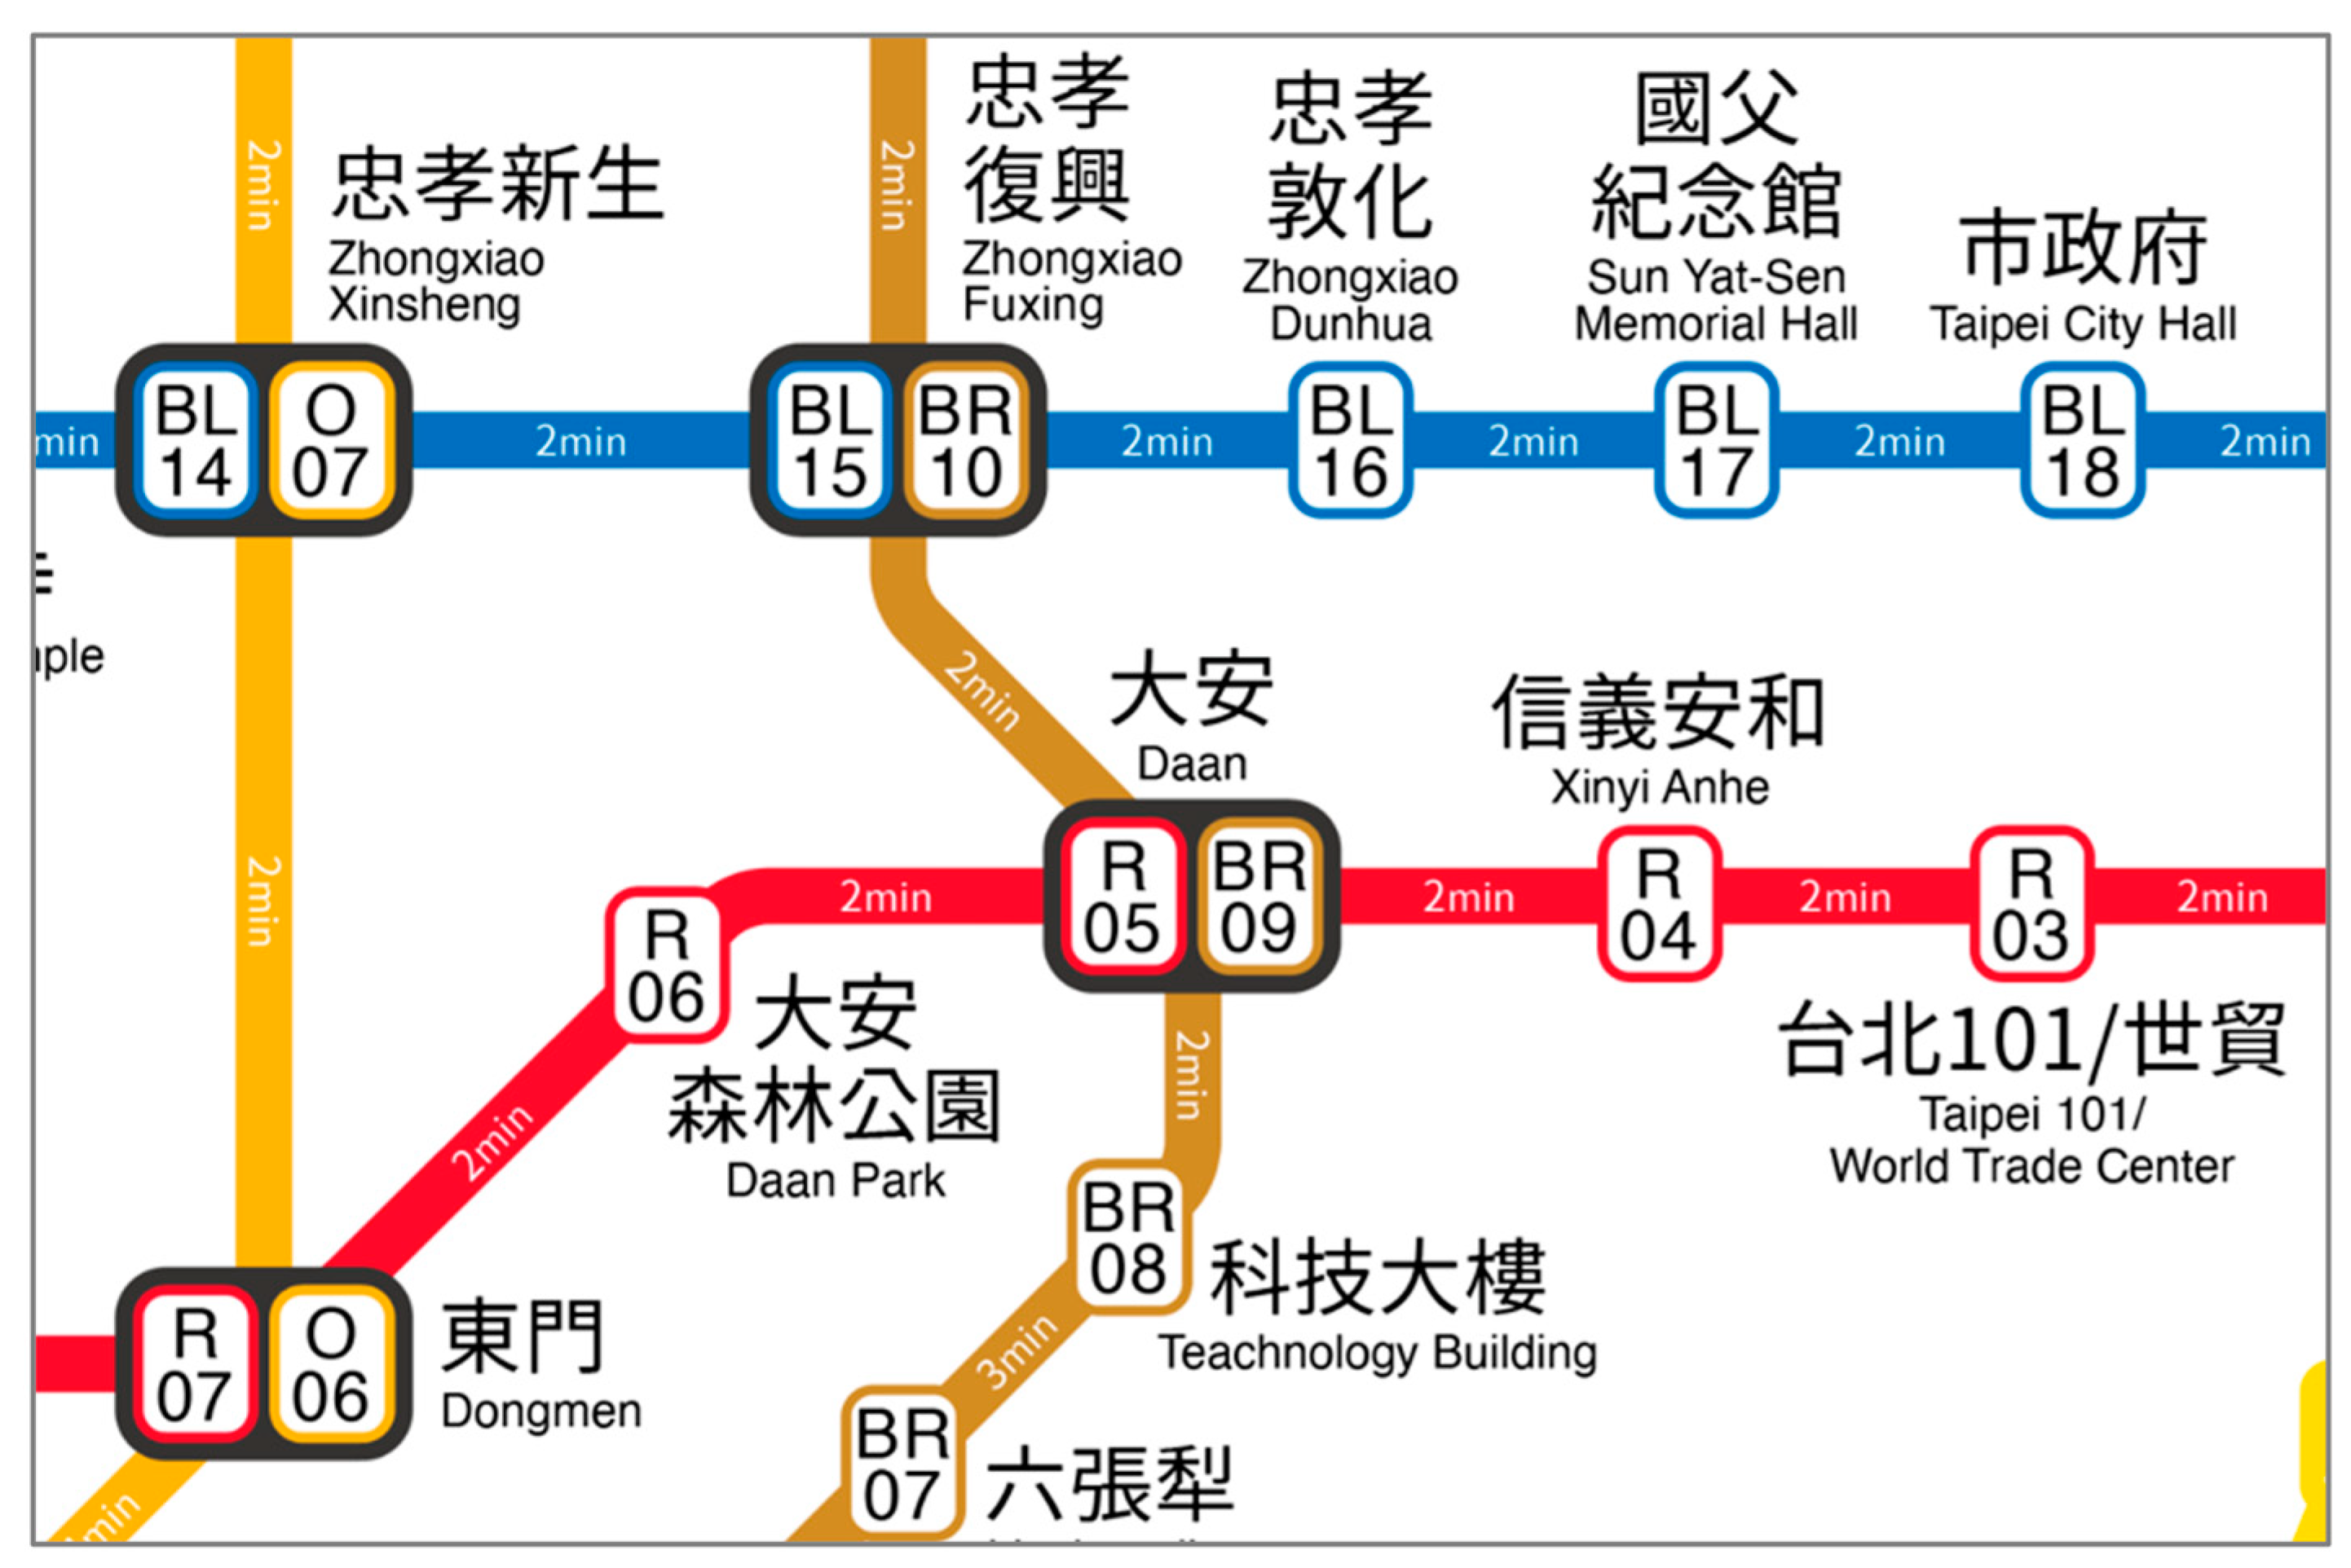
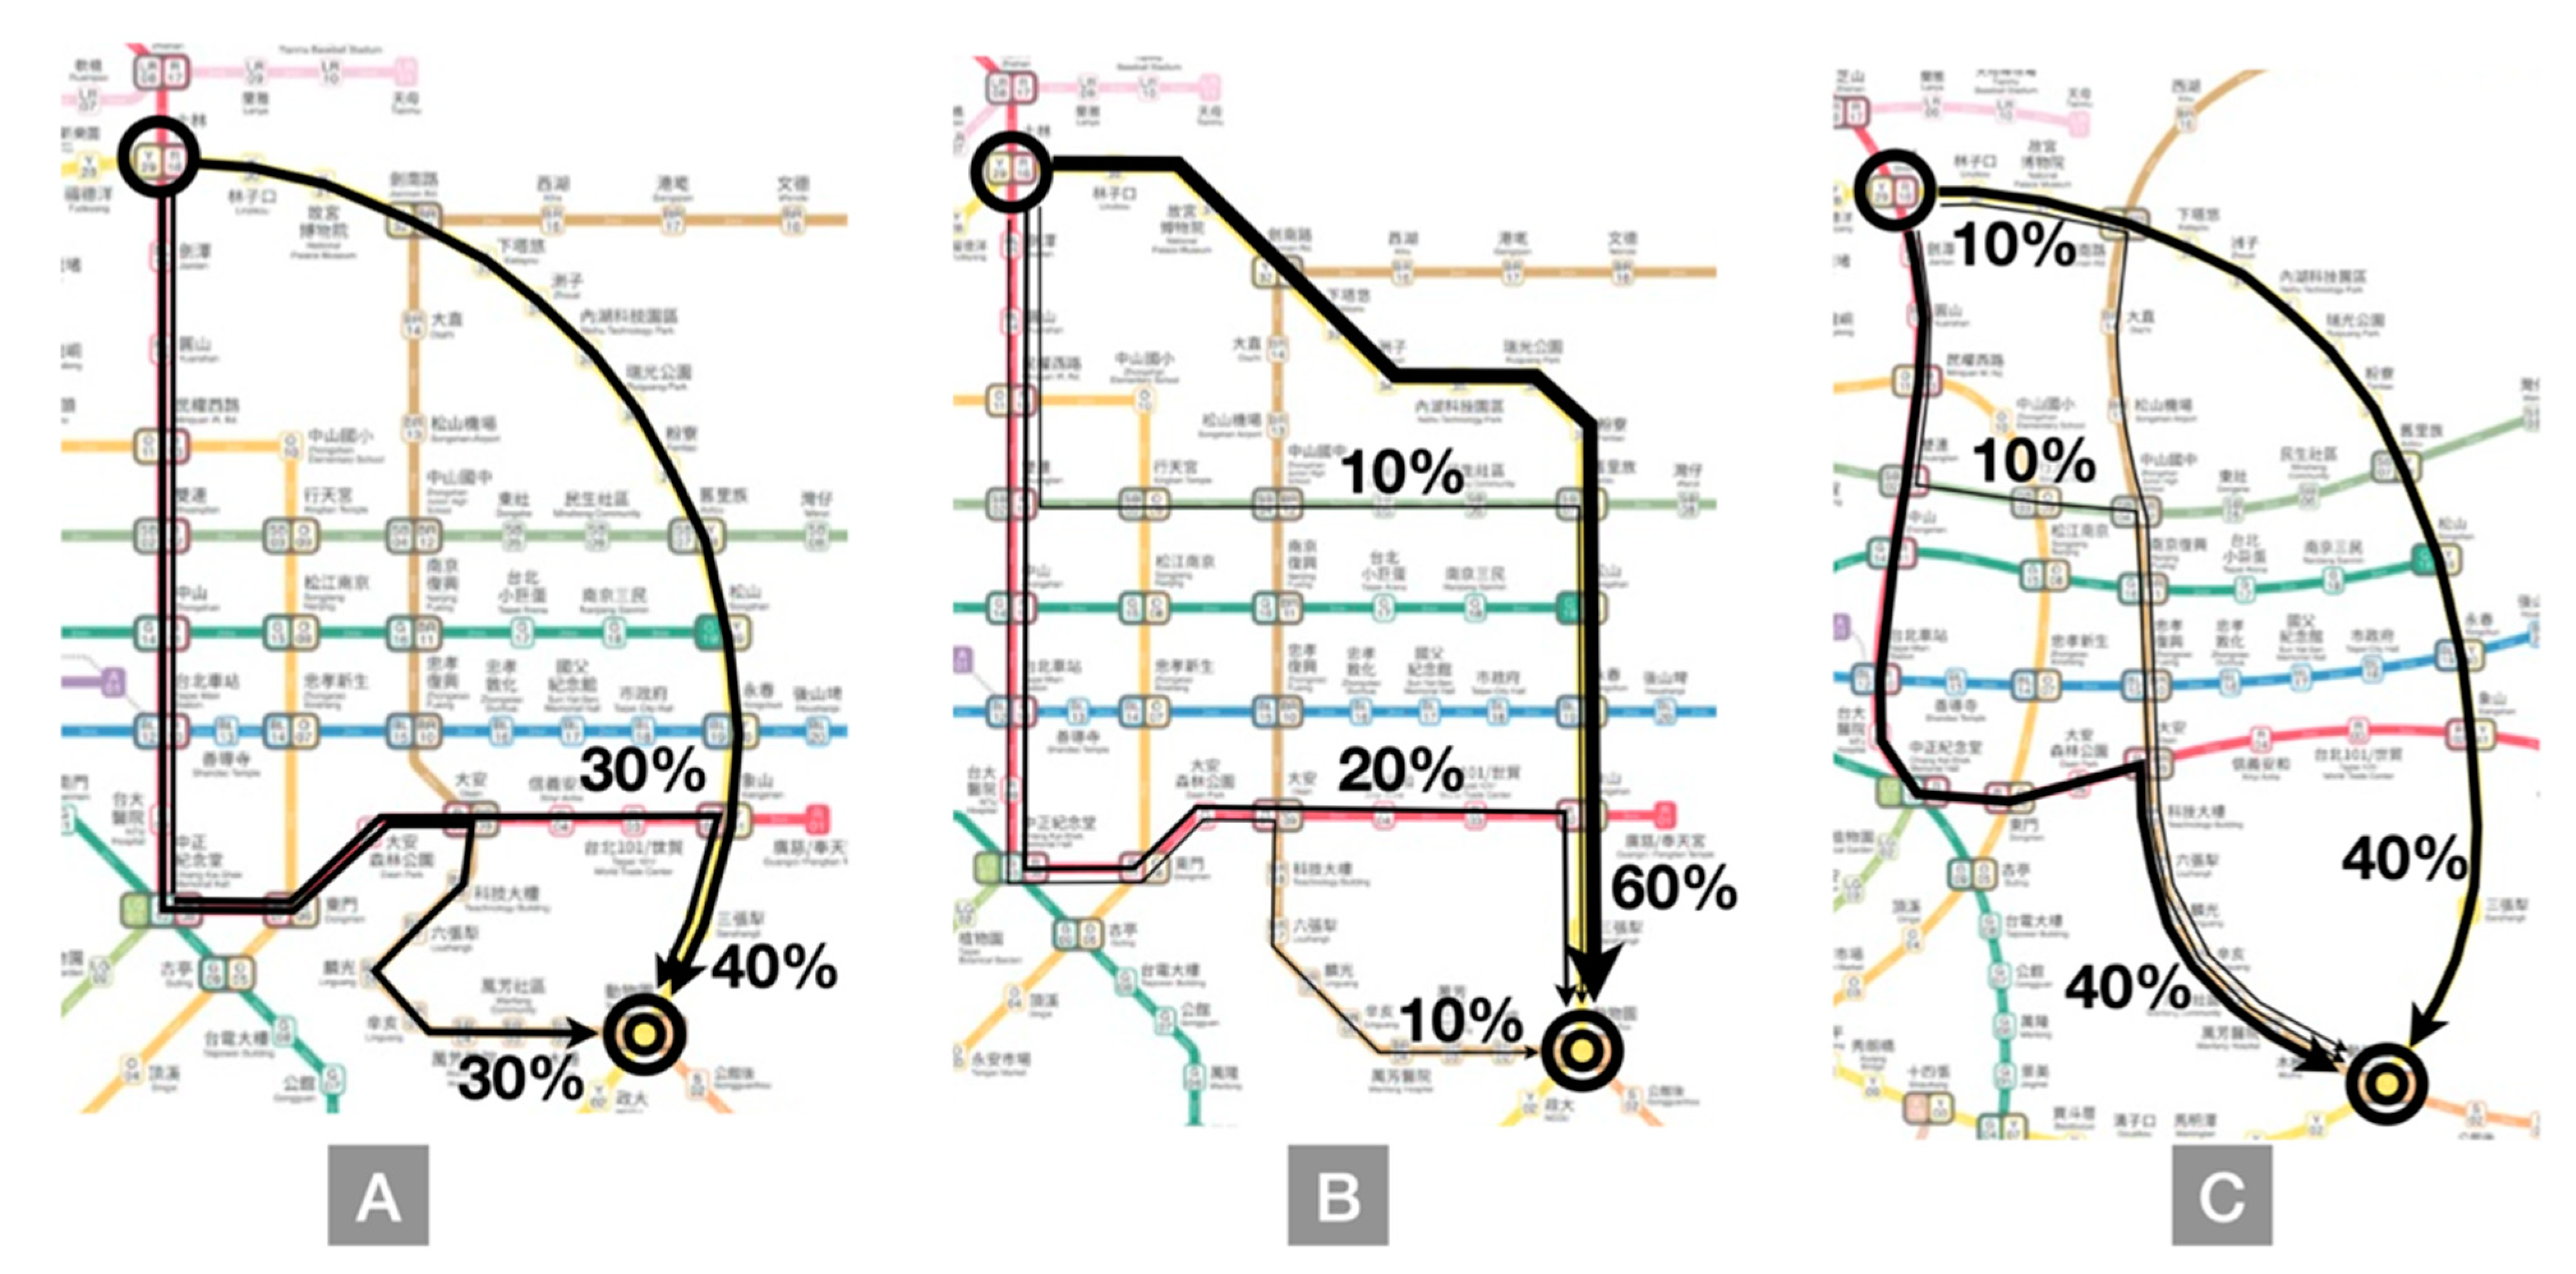
In addition to avoiding detours, another factor in planning was the number of transfers. For example, in Task Q4 between the Nanjing Fuxing and Taipei Nangang Exhibition Center stations (
Figure 6), one additional transfer was required when 60% of the participants opted to detour downward; 40% of the participants chose to detour upward, requiring no transfer, but they had to pass four additional stations. Convenient transfer was the greatest consideration for the few participants with less experience of using the metro who rather detoured; this finding indicated that route planning that reduces detours and the number of transfers was important for route map readers (
Table 7). Although route maps based on topology mainly represented relationships between stations and routes, geographic locations were not depicted accurately. Route maps were not to scale, but the location of each station marked on them remains the basis for map readers in determining to detour or not.
The responses to Q1 to Q6 revealed that in planning routes, the participants attempted to minimize as much as possible the estimated time required by their route of choice. Visualization analysis conducted based on a route planning model revealed the following patterns in the participants’ route selections:
Avoiding station that involves a change of traveling direction in the selected route.
Decreasing the number of transfers along the selected route.
Selecting transfer stations closer to the end station.
Selecting movement directions from the top to the bottom or from the left to the right in the drawing and avoiding the complex central area.
Since the Taipei MRT route map has been widely used, the 32 participants in Experiment 1 were divided into four groups according to their metro usage experience and frequency using cluster analysis: low experience and infrequent use, low experience and frequent use, high experience and infrequent use, and high experience and frequent use. The findings revealed that as the participants’ experience of taking the metro decreased, the time spent on route search and planning increased. As the level of experience increased, although the speed of route search and planning increased, the participants easily misidentified stations and consequently gave wrong answers. Analysis of the results for “total time for answering,” “accuracy rate of search task,” and “error in estimated travel time” indicated no significant correlations among the four groups (
Table 7).
3.2.1. Experiment 1 Revealed the following Similarities in Most Participants’ Cognitive Memory Regarding Route Map Structure:
Users tended to take Taipei Main Station as the fixed cognitive center. Using the reference structure of cognitive maps proposed by Hart (1979), we noted that most users tended to take Taipei Main Station as the fixed center of their spatial cognition memory when reading the current Metro Taipei Route Map. In a structure emphasizing the intersections of the horizontal Blue line and the vertical Red line, users further completed cognitive mapping for the route map by egocentrically referring to their experience regarding transfer and terminal stations.
Routes in the form of gestalt facilitated cognitive memory. Among the elements for drawing a cognitive route map, in addition to basic colors, transfer stations, and terminal stations, graphic memory formed through route shapes and bifurcations of routes on the route map helped to enhance users’ cognitive memory.
Users planned routes with consideration of the number of stations they must pass, and the transfers required. Based on the destination, the participants made plans that avoided detours; they typically planned their routes from near to far or from far to near the starting point before considering the number of transfers to modify the route choice. Even though route maps are not to scale, map readers still make plans according to the locations of stations on a route map (
Figure 7).
The usability of the current octilinear route map was rated as D. The UMUX evaluation score references a formula proposed by Berkman and Karahoca (2016) and converts the score into one similar to the System Usability Scale score for verification. The study revealed that most users rated the usability of the current route map as low, with a score of 69.7, indicating that they were barely satisfied with this route map and thought that space remained for improvement.
Users held a positive and supportive attitude toward integrating travel time information. According to the interview questionnaire results, 78.1% of the participants agreed with the notion of integrating travel time information. The participants stated that they required such time information when using a route map and believed that annotating travel time information would have a positive effect on route planning.
Although studies indicate that the temporal distance is not the best way of performance [
21], it is necessary to add time to the map according to users’ opinions. In certain situations, such as when people want to go to another spot before they catch a plane, a time-marked map may help them keep track of their time. People who commute every day may have less need for a time-marked map. We posit that route maps composed of curves may enhance the outcomes of users’ cognitive memory while also increasing the possibility of graphic memory use. The cognitive memory–related performance of CRs and SRs in the drawing approach indicated that the use of curves to replace nodes generated by turns along conventional octilinear routes may reduce the number of nodes and might effectively reduce the load on users’ memory.
3.2.2. Experiment 2: Comparison and Evaluation of New Route Map Designs
Roberts et al. [
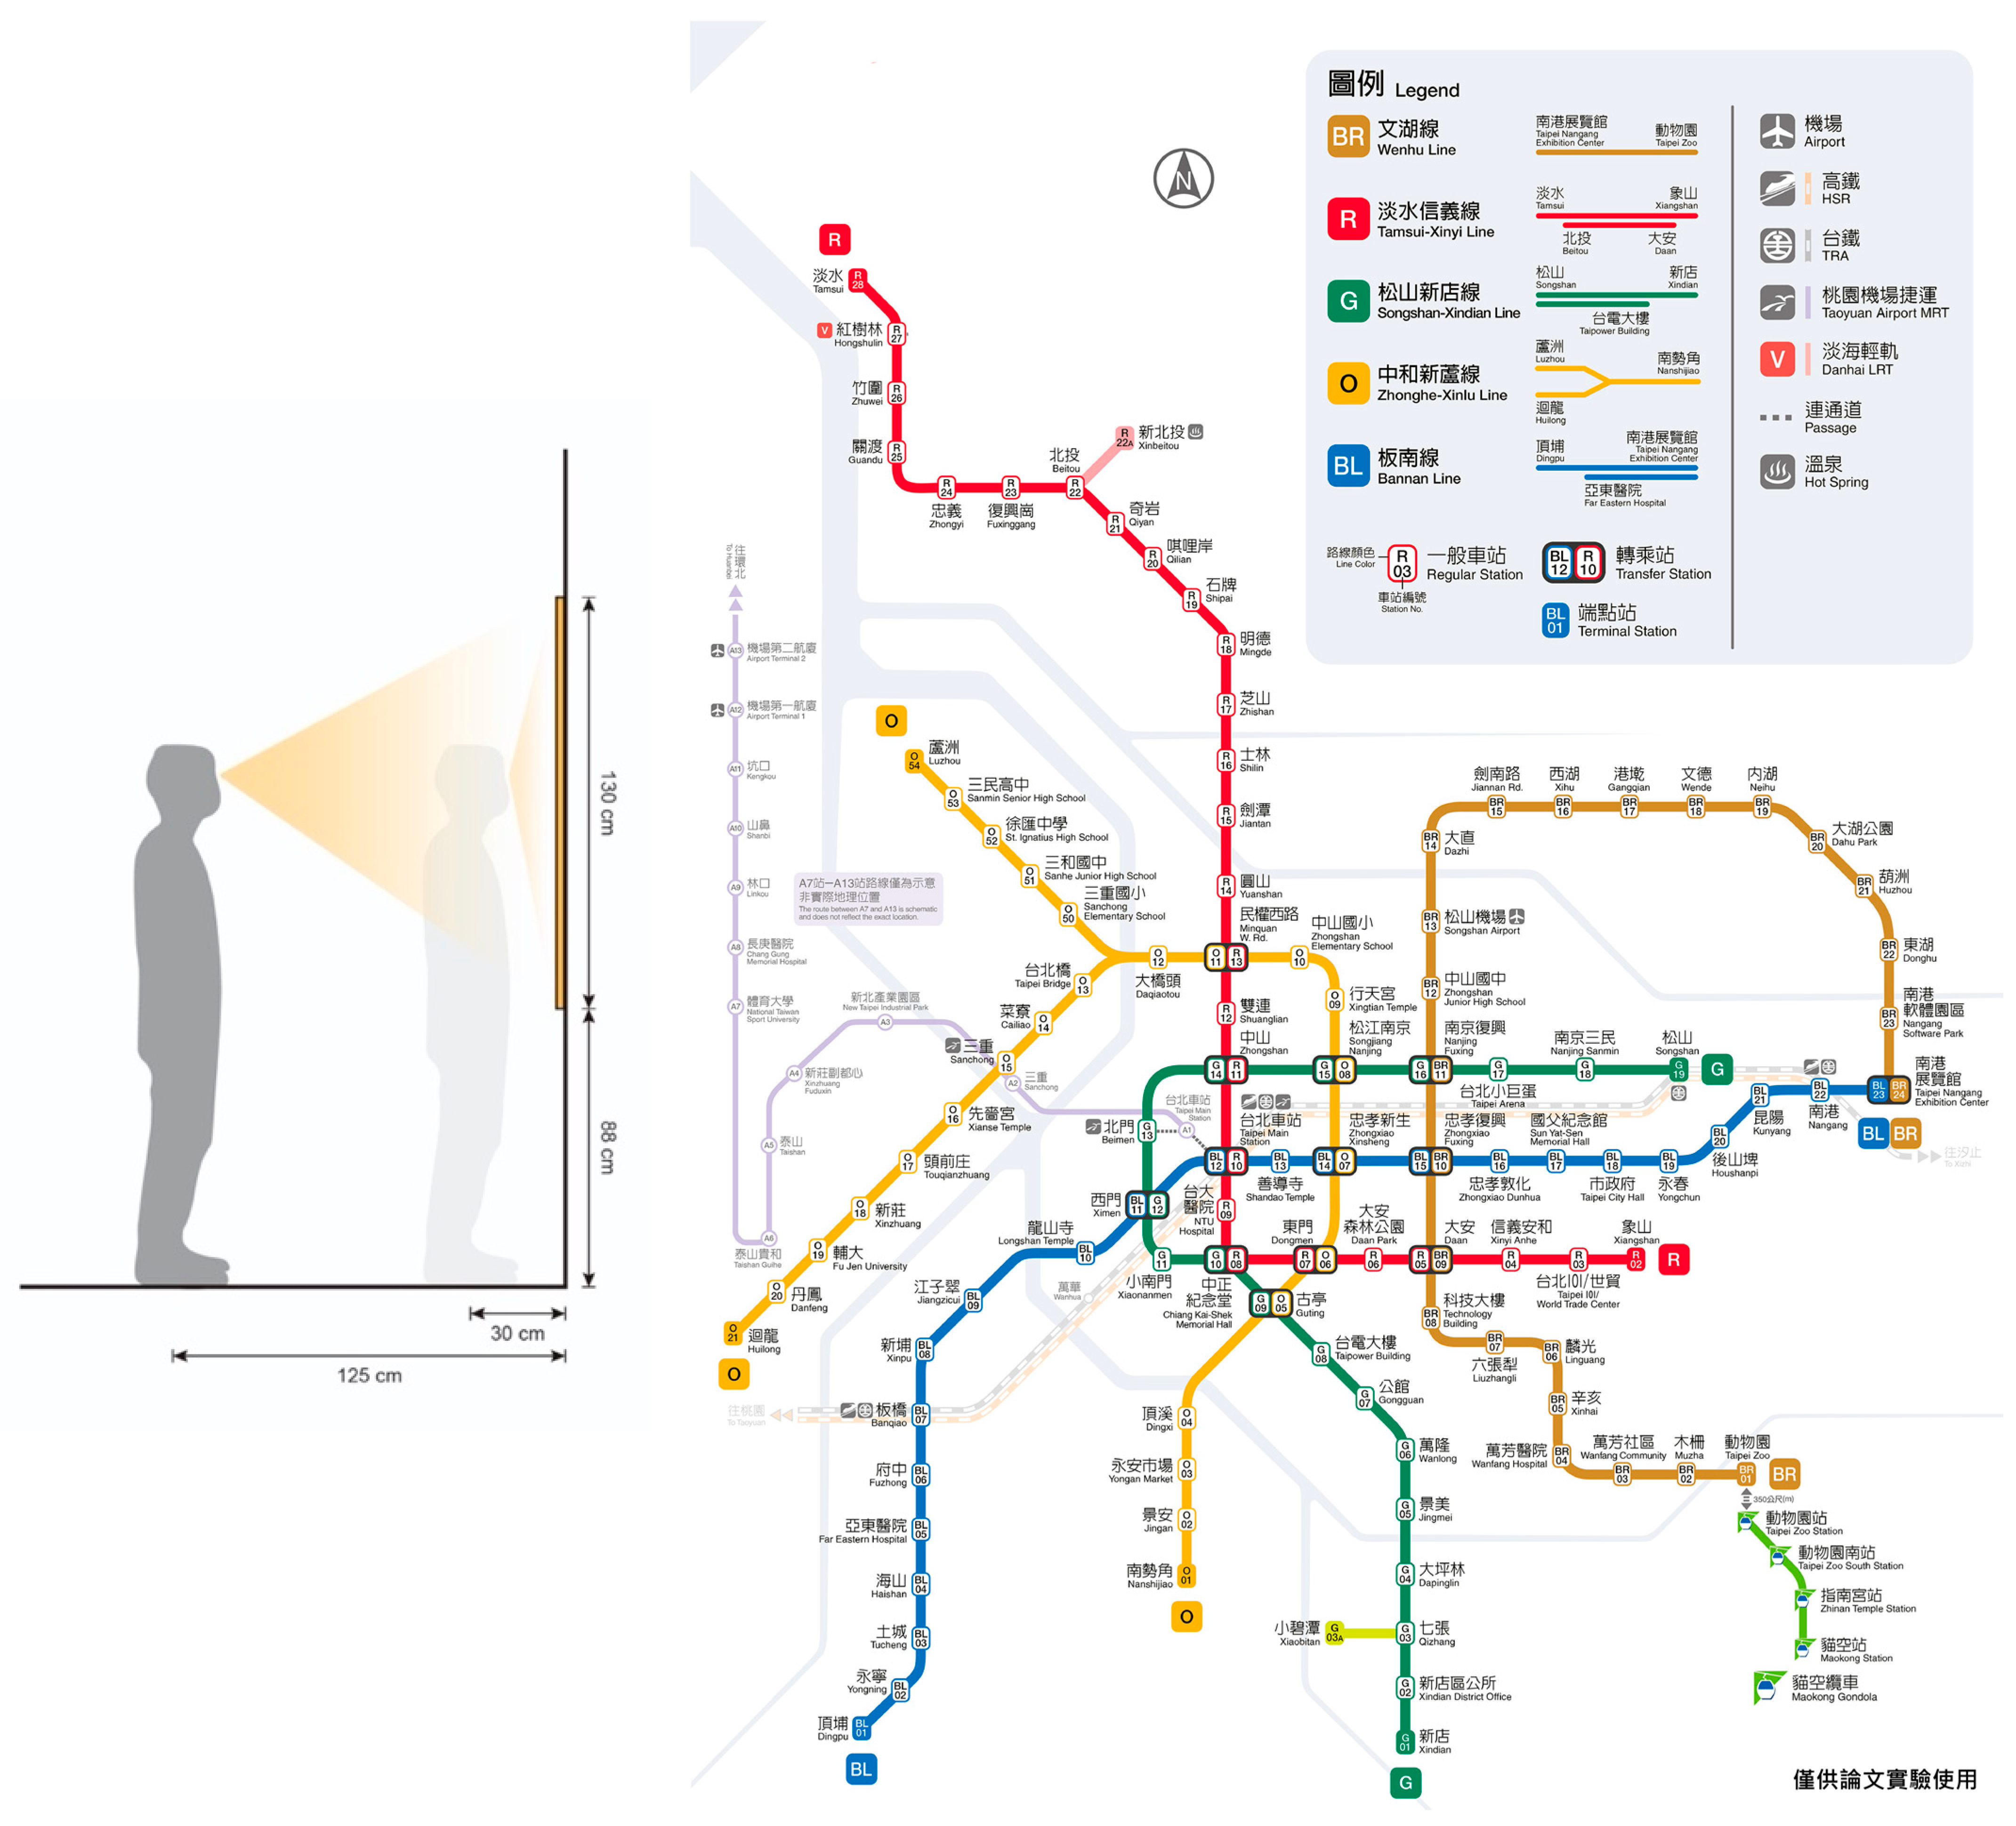
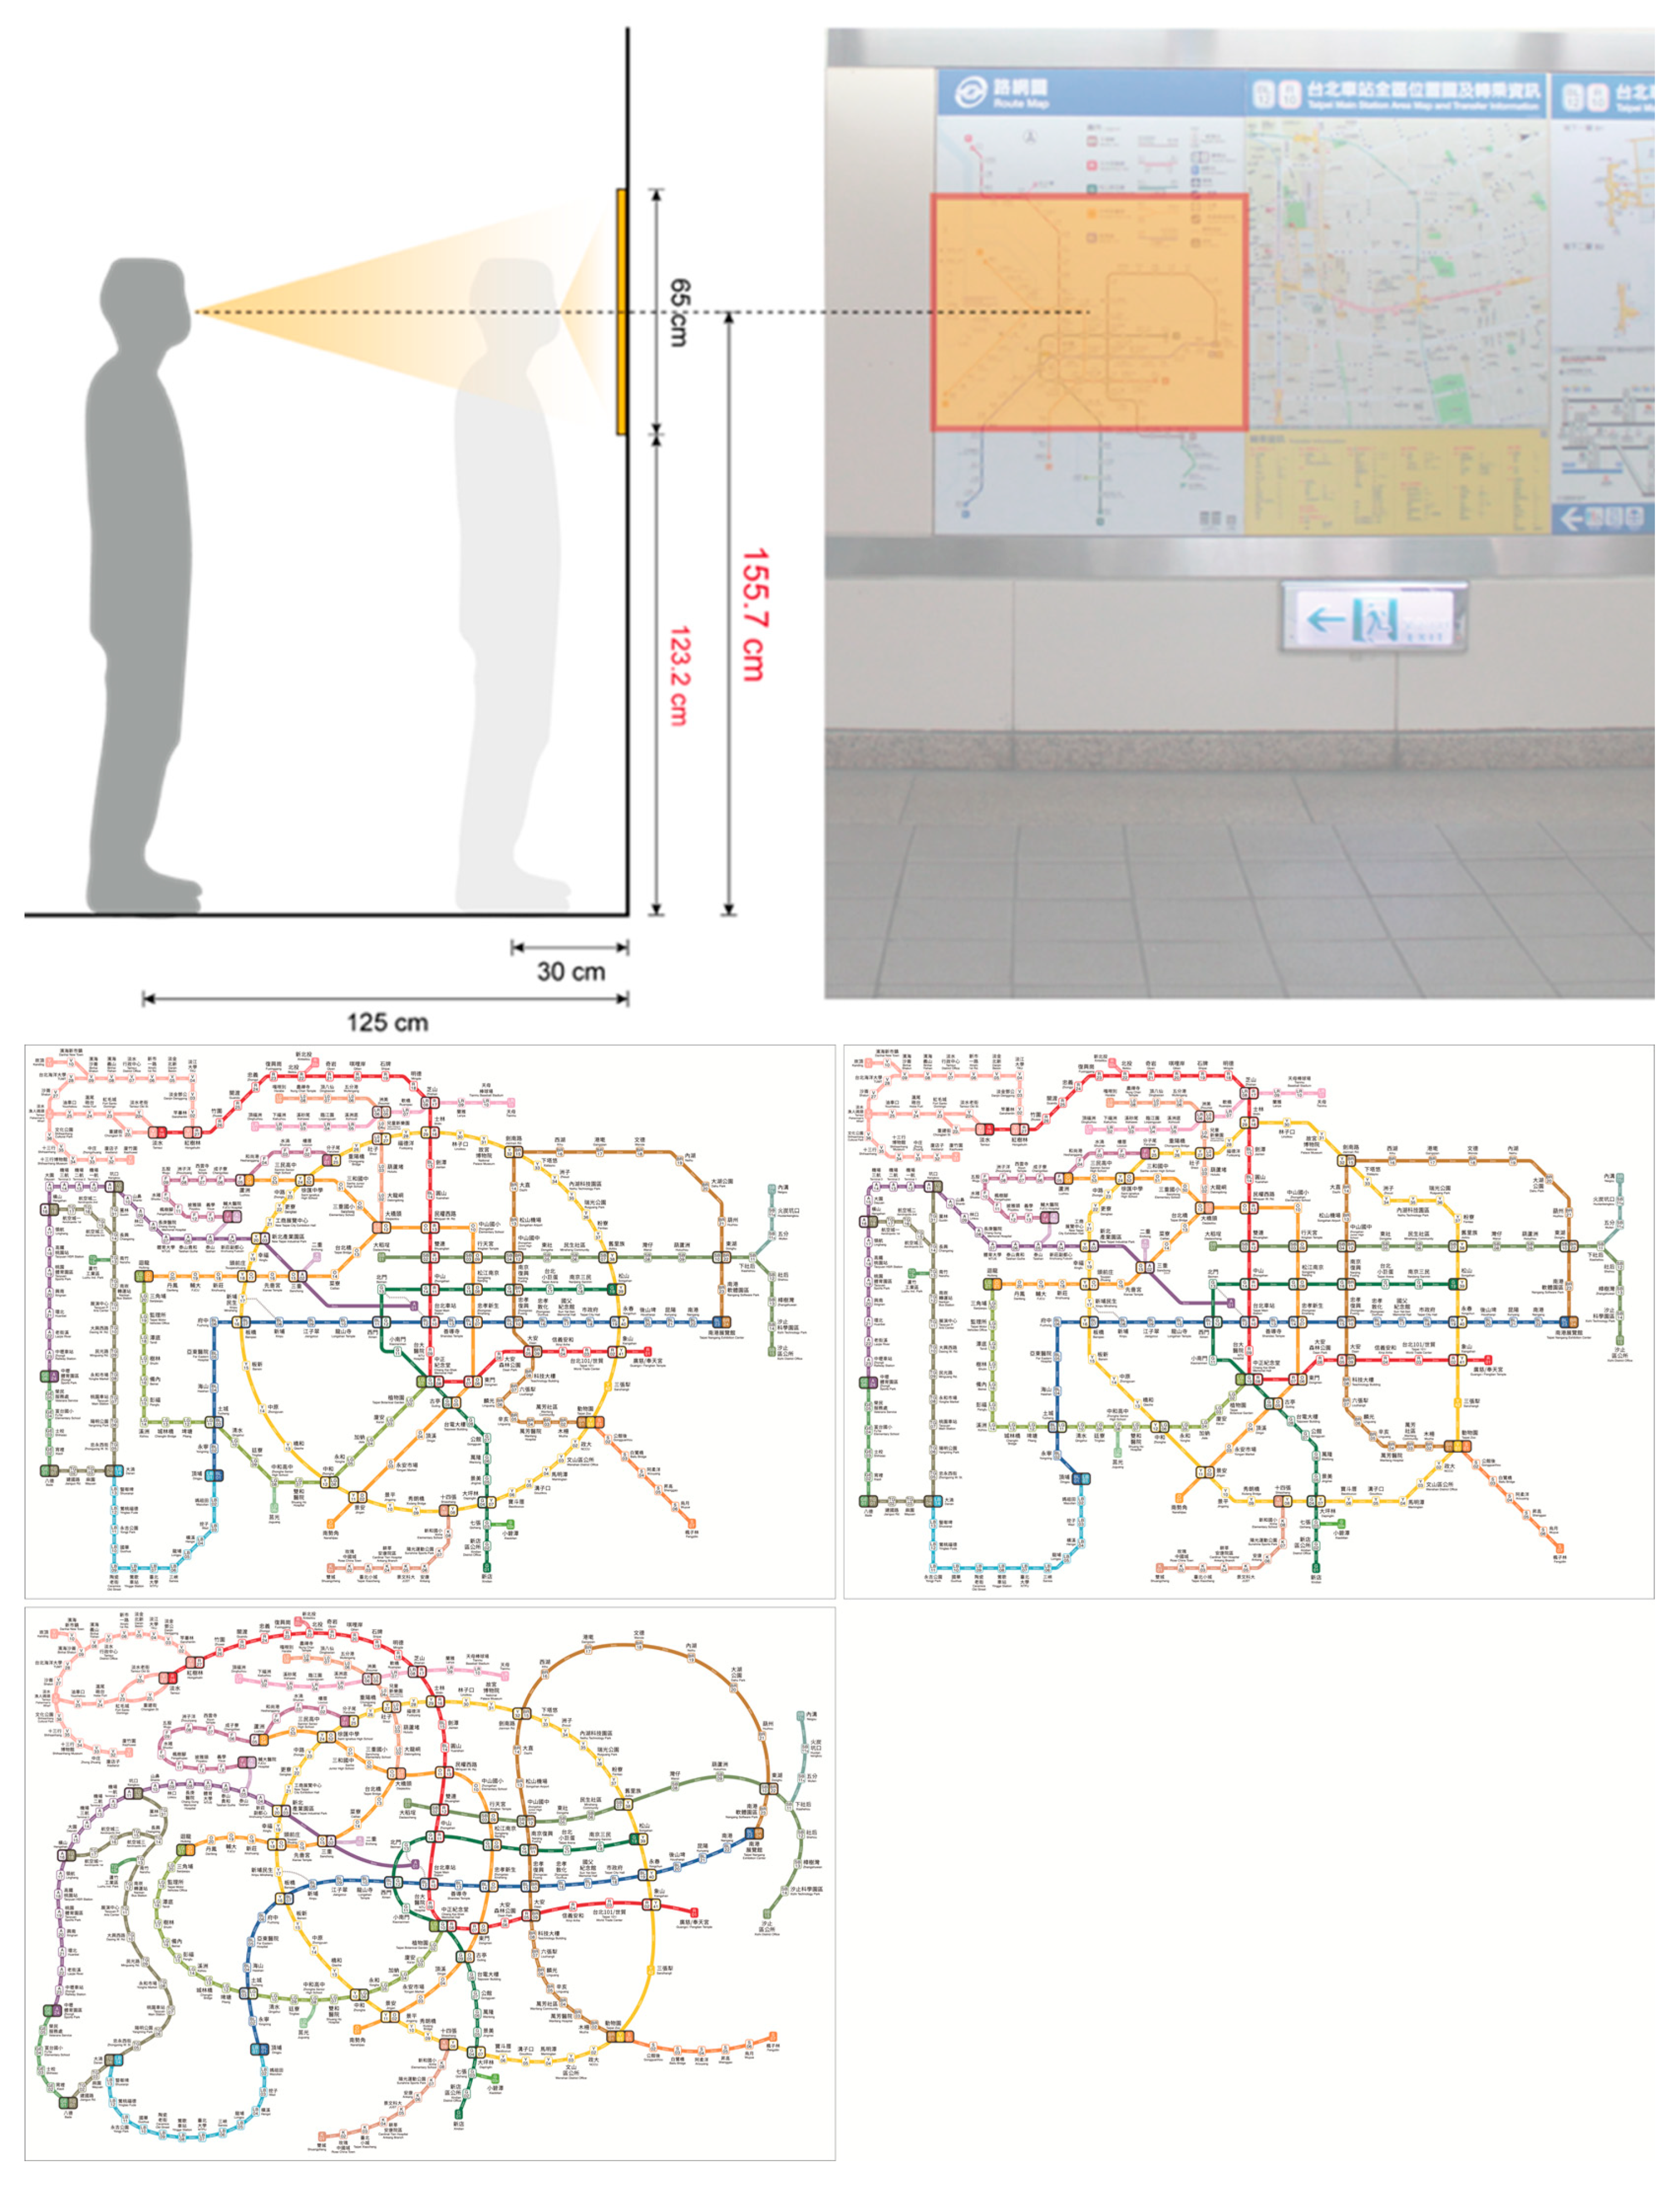
14] refuted the view that the conventional octilinear system was the absolute gold standard for route maps. This study considered future plans for building new metro lines and proposed three route map designs that employ distinct compositions. The horizontal layout was used to ensure that new routes could be incorporated in the future; its length was set as 95.3 cm and its width as 65 cm, and the maps were made to scale. To ensure that route composition was not affected by other variables, all three design proposals included time annotation.
Route map A (Proposal A): Route map A was based on a hybrid system. It was an integration of the conventional octilinear and the curve drawing approaches; the Circular line (indicated in yellow) served as the main connecting framework for all the routes. Taipei Main Station was the central point of the drawing, and the Circular line was in a perfect circle. The form of the original route map was preserved in the layouts of other routes, and the distance between two transfer stations were evenly spaced (
Figure 8).
Route map B (Proposal B): For route map B, the conventional octilinear system was employed. The horizontal Blue line and the vertical Red line served as the primary framework for connections, and the stations were distributed along each route as evenly as possible. To equally distribute the stations to the left and right of Taipei Main Station, the composition of the Circular line (indicated in yellow) was revised into a layout whose center was to the middle right (
Figure 9).
Route map C (Proposal C): Route map C employed an all-curve system. This map was generated based on the route layouts of Proposals A and B; the straight lines in the octilinear design were entirely replaced by curves. We used the Bézier curve function in imaging software to transform each route into a smooth state with the fewest anchor points. Despite the use of curves to draw the route map, the relative positions of the stations were preserved (
Figure 10).
In Experiment 2, the usability of the three proposed route map designs (that employ the aforementioned three compositions) were compared through usage experience, cognitive mapping, route tasks, a route planning model, and an evaluation scale. The four route planning tasks with designated start and end stations on different route maps were as follows (
Table 8):
Q1: Long-distance route planning with the start and end points diagonally located on the drawing.
Q2: Short-distance route planning with the start and end points diagonally located on the drawing.
Q3: Route planning where the distance between the start and end points was the longest.
Q4: Route planning where the distance between the start and end points was short and the end station was located on the Circular line.


