A Methodological Proposal for the Analysis of Lighting the House Building Façades
Abstract
:1. Introduction
- In this context, and based on the new possibilities allowed by advances in GIS, the main objective of this article is to develop a methodology that integrates 2D and 3D data based on remote sensing techniques, in order to obtain an accurate estimation of sunlight reception for all façades of a series of buildings, considering the surroundings and topography as potential obstacles. Other objectives under consideration are:
- Sub-objective 1: to determine the procedure for analyzing the extrusion process of 3D buildings based on freely available data sources in Spain.
- Sub-objective 2: to create of a methodology that allows to quantify the hours of direct light that a façade receives, by means of panels equivalent to each floor of the building (3-m length).
- Sub-objective 3: to measure and analyze the differences in luminosity between nearby buildings with similar urban characteristics.
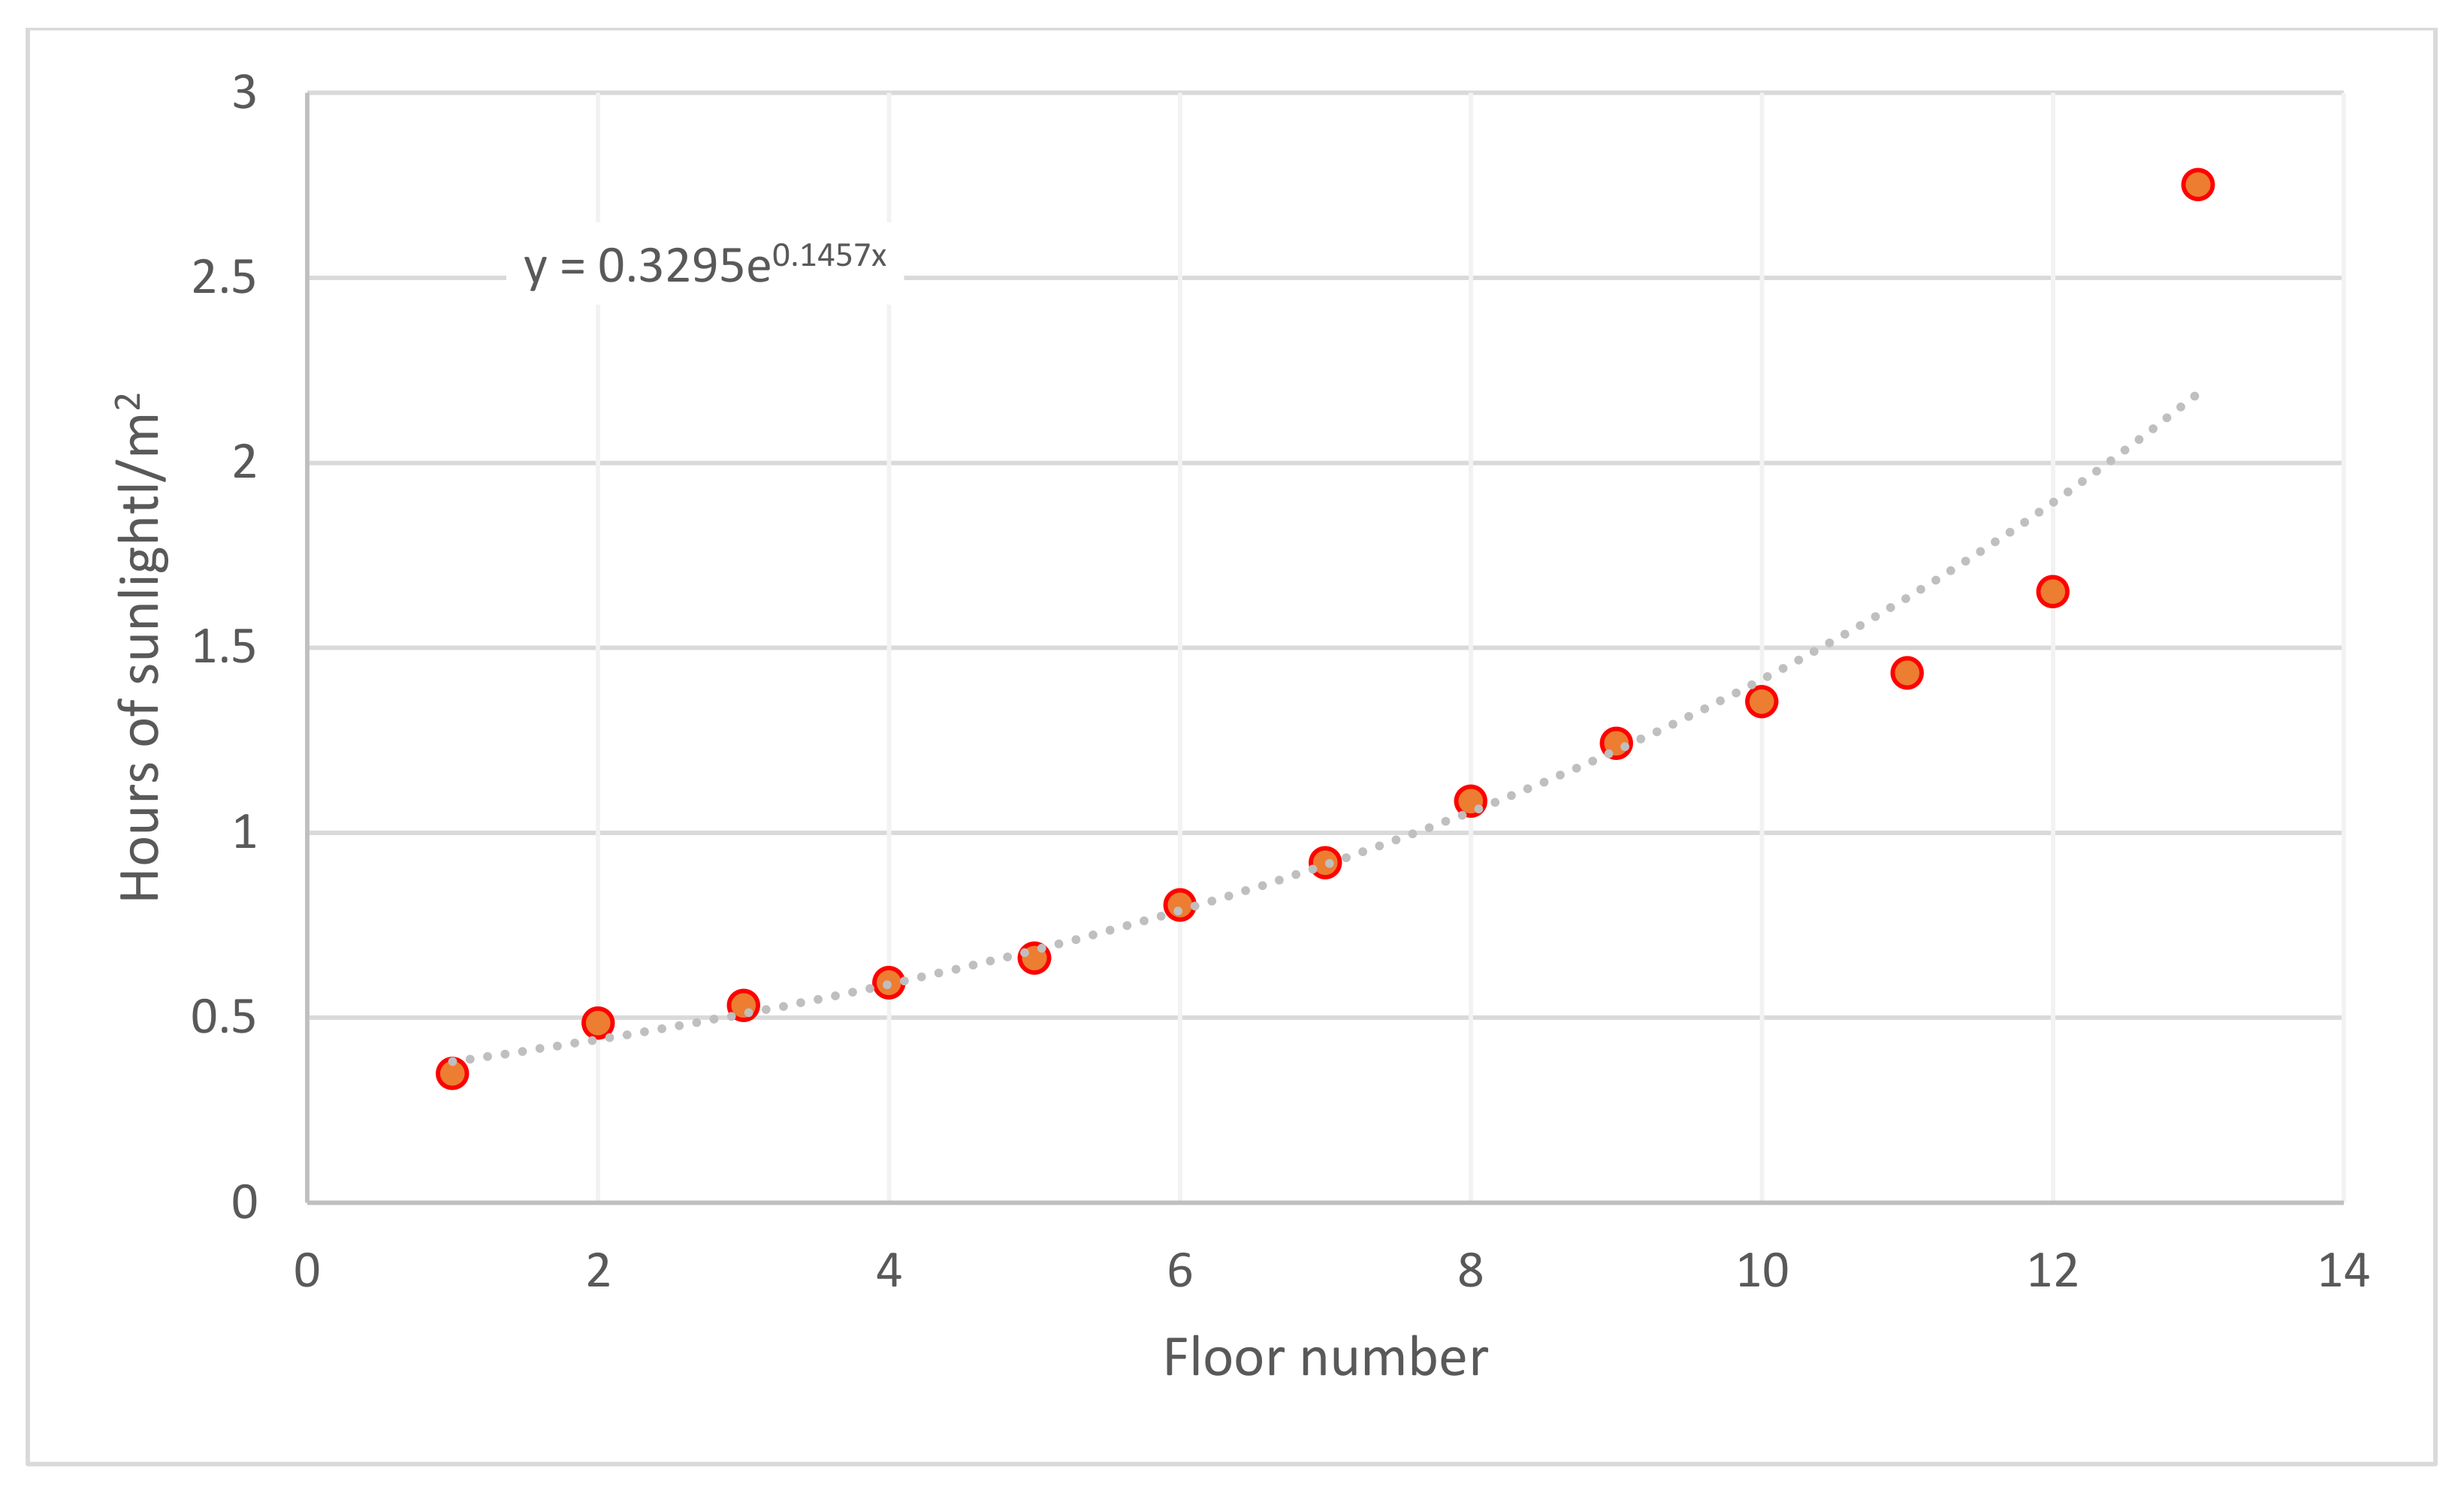
- Sub-objective 4: to contrast the differences in luminosity between the different floors and orientations of the same multi-family building.
2. State-of-the-Art
2.1. Extrusion of Buildings
2.2. Analysis of the Solar Volume
2.3. Application of Remote Sensing and BIM Techniques in Real Estate Valuation and Solutions
3. Materials
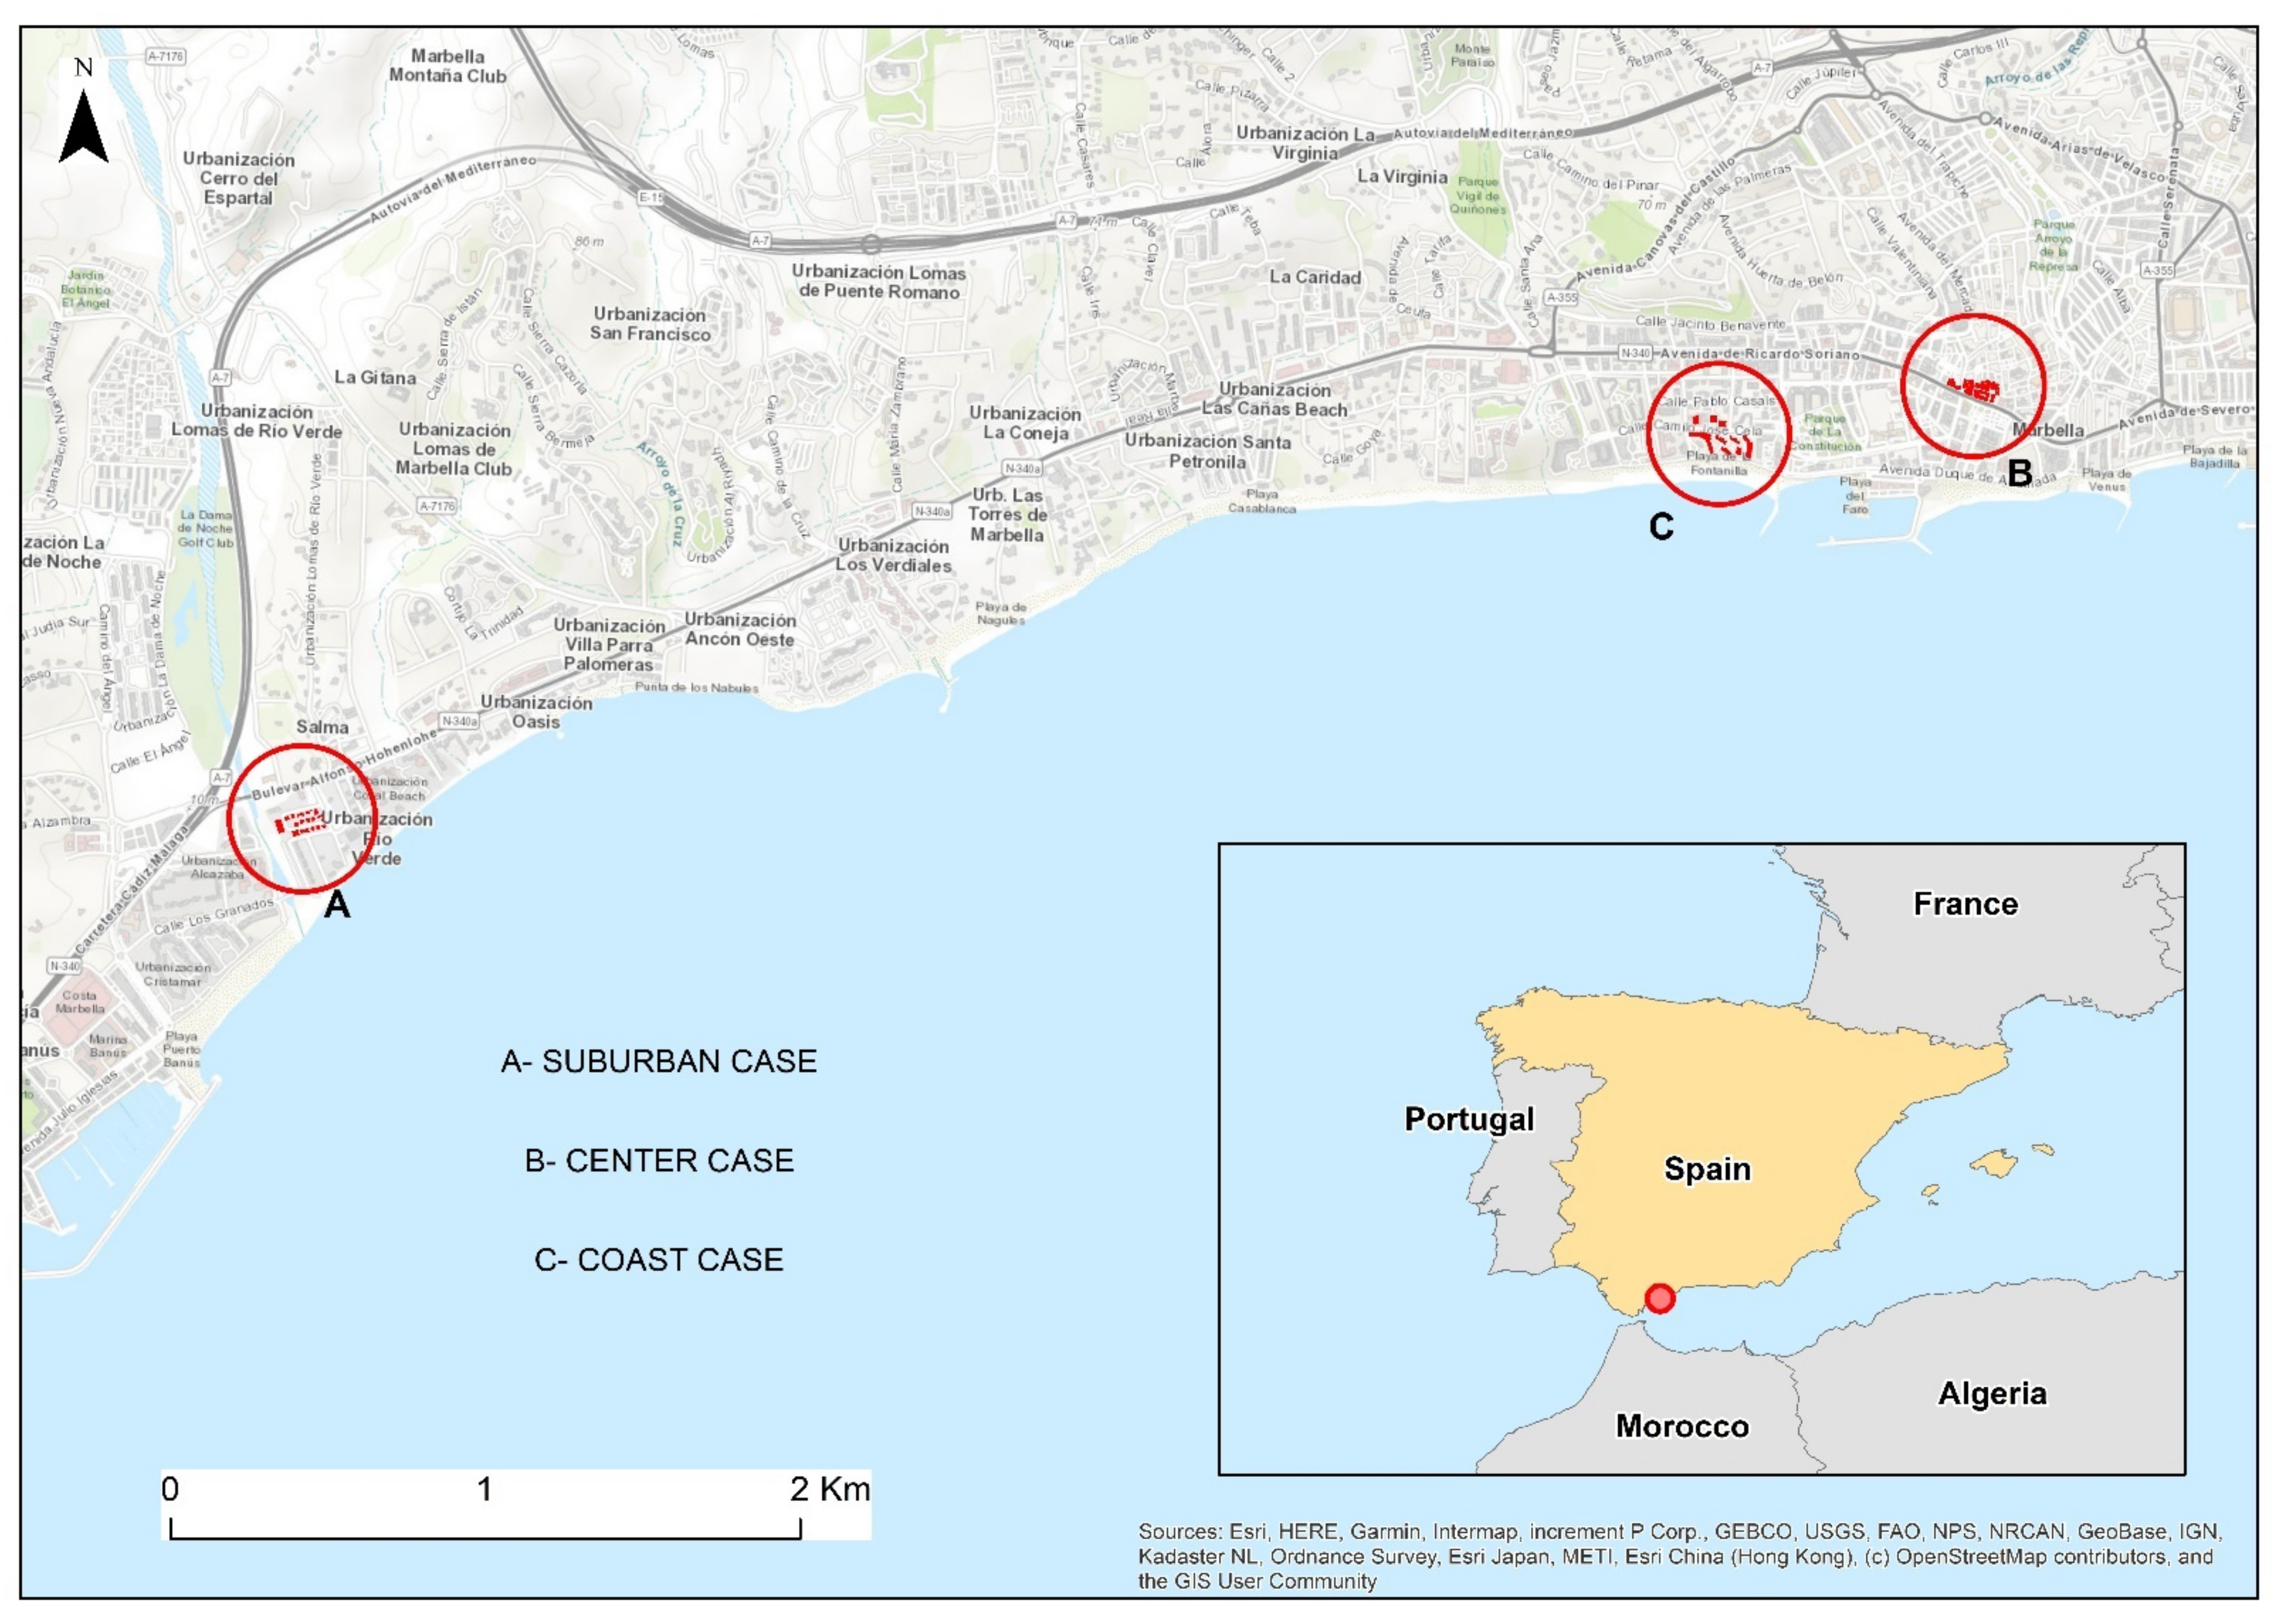
3.1. Study Area and Cases of Study
- Suburban area of single-family dwellings with some higher-pitched buildings: sample of two houses.
- Historic centre delimited by more recent multi-family buildings: sample of a two-story building.
- Urban expansion of buildings with more than six floors, next to the shoreline: sample of a multi-family building.
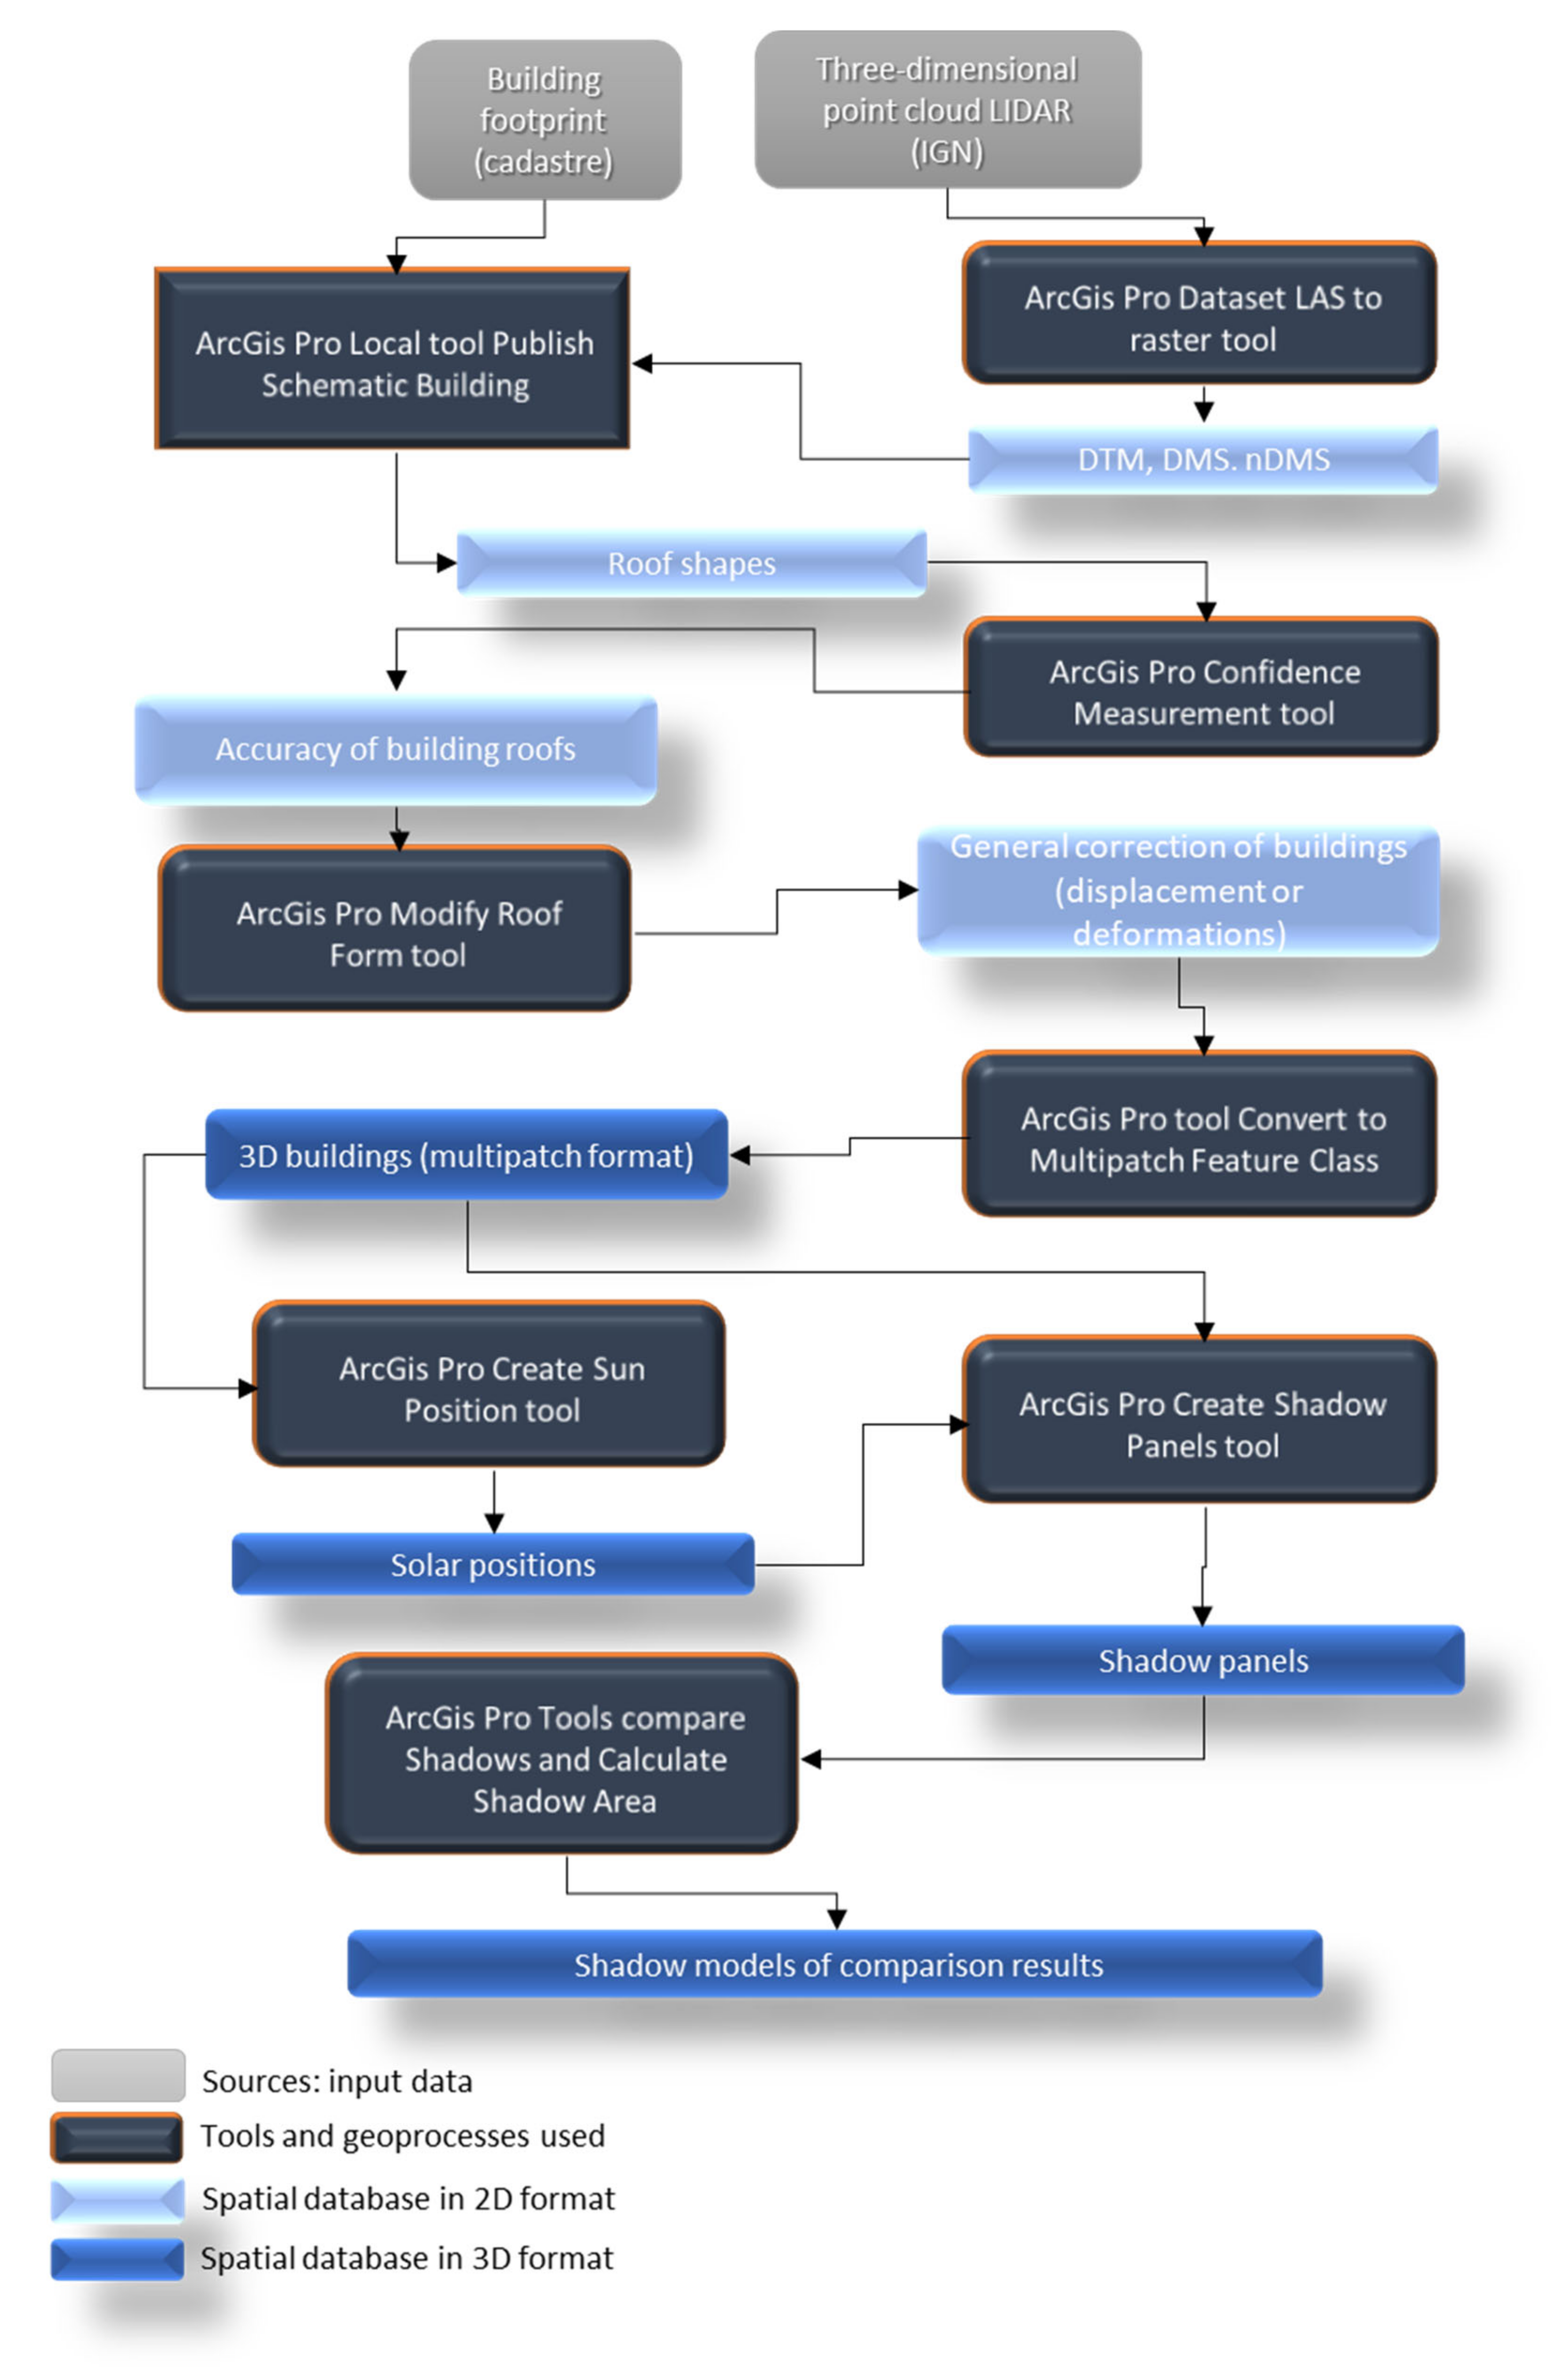
3.2. Software and Data Source Used
- ArcGIS Pro with 3D Analyst and Spatial Analyst licenses
- ArcGIS Solutions Deployment
- LAStools for LiDAR data processing
- ArcGIS Solutions
- General Directorate for the Cadastre (DGC from its Spanish acronym): at the Cadastre Electronic Site, in its section Download vector cartography, the cadastral information Urban without historical record of the municipality is obtained. The special database, in shapefile format, is called Constru, which contains traces of the building elements in 2D.
- Spanish National Geographic Institute (IGN): through its Download Center:
- -
- Digital elevation models. LiDAR 1st Coverage data containing the three-dimensional point cloud needed to obtain various DEM are used.
- -
- Aerial photos and images. The Most recent PNOA Ortophotos are used for the corresponding Spanish National Topographic Map 1: 50,000 (MTN50) sheet, in order to have an image of the study area as a guide or additional support for the interpretation of the results.
4. Methods and Procedure
4.1. Creation of Digital Elevation Models
- -
- The digital terrain model (DTM) shows only the terrain elevation, without buildings or other features.
- -
- The digital surface model (DSM) presents the elevation of the terrain and the characteristics of the terrain.
- -
- The standard DSM (nDSM) shows the height of the above-ground characteristics of all the buildings (the standard elevation).
4.2. Building Creation in 3D Format (Multipatch)
- Getting building roof shapes
- BLDGHEIGHT (Building height): the maximum height of the building.
- EAVEHEIGHT (Eave height): the minimum building height. Buildings without eave height have flat roofs.
- ROOFFORM (roof shape): the shape of the roof that is identified in the footprint of the buildings. The shape of the roof can be flat, gable or hip (Figure 4).
- BuildingFID: the building’s internal ID number.
- BASEELEV (elevation of the base): the height of the base of the building, generally equal to the elevation of the floor where the building is located.
- ROOFDIR (roof direction): the direction of the compass (in degrees) of the roof. Only the gable roof shapes have values for this field.
- RoofDirAdjust (Adjusted roof direction): This field allows adjustment of the roof direction. The default value is 0. A value of 1 rotates the roof counter clockwise 90 degrees, while a value of 2 rotates it 180 degrees. This field is used to manually edit cover forms that were incorrectly extracted and that are not used in this step.
- B.
- Checking the accuracy of the roofing of buildings
- C.
- General correction of buildings
- D.
- Conversion from 3D polygon to multipatch format
4.3. Shadow Impact Analysis
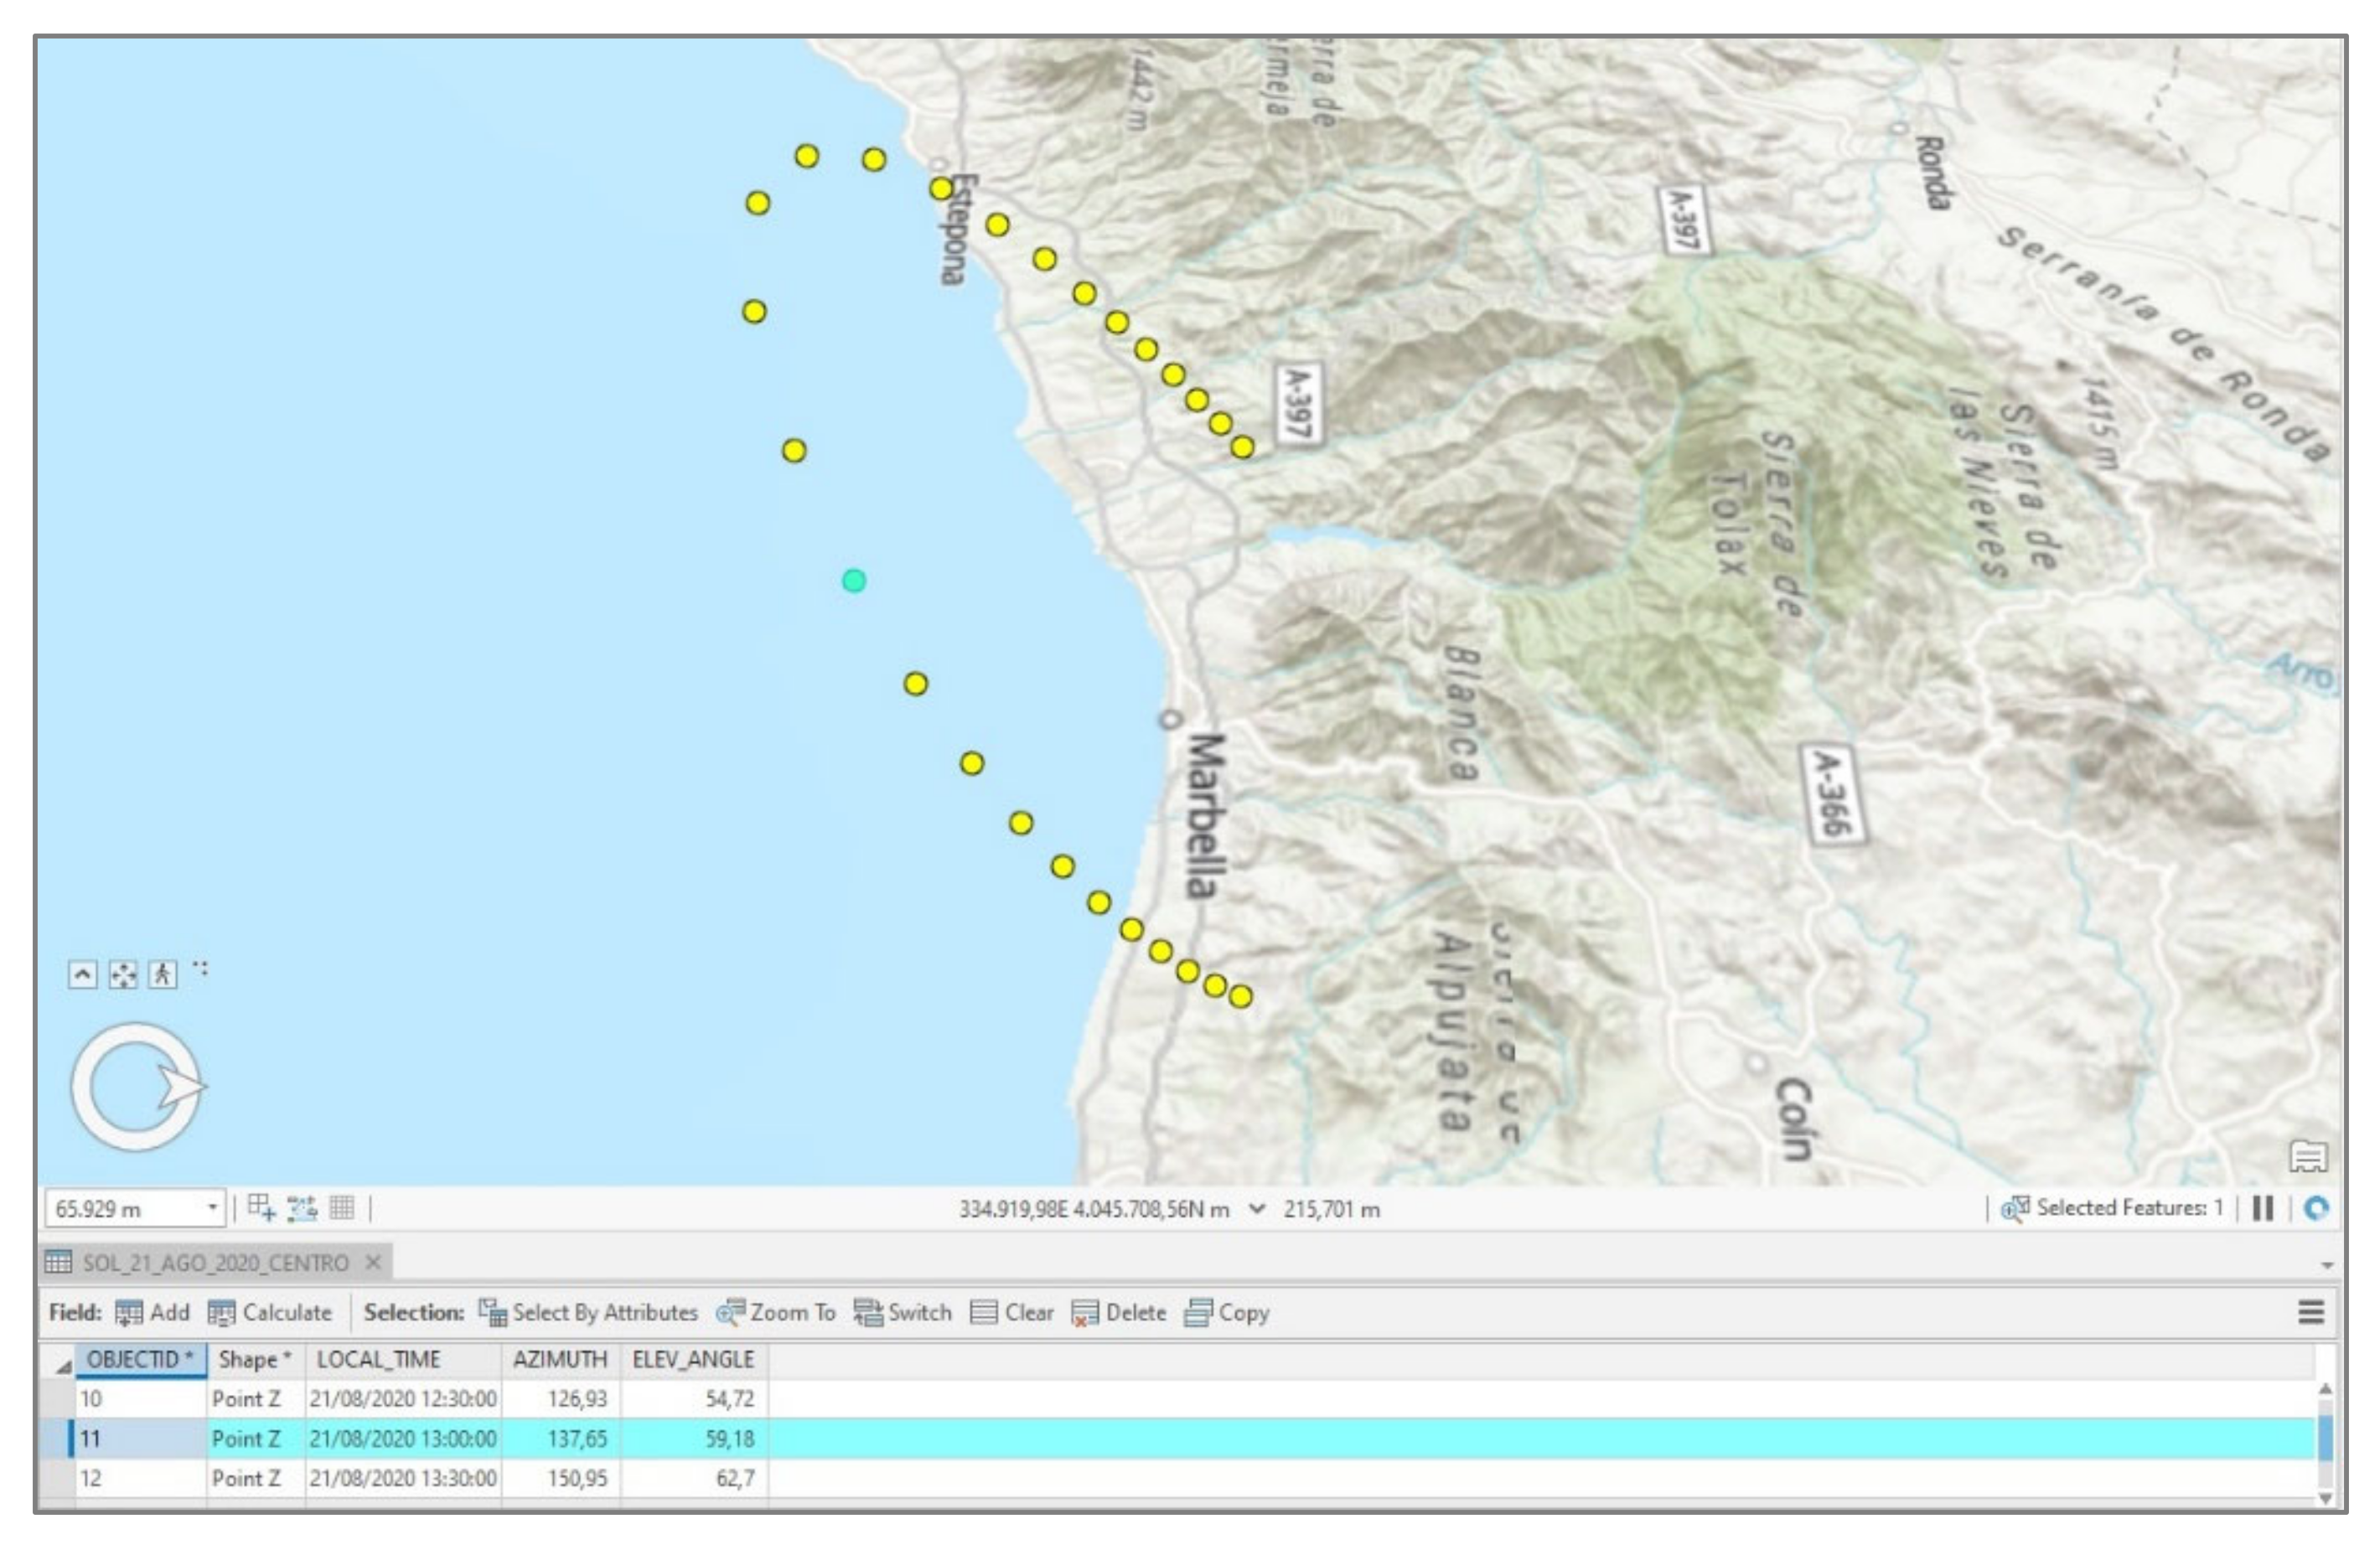
- Solar position
- -
- Input observer: these are the elements for which the impact of the shadow has to be calculated (e.g., a park or a building).
- -
- Elevation and horizon of the observer: this parameter will be automatically calculated by the software, otherwise, the condition Elevation Observer is set with the average elevation of the observing entity, and the field Observer Horizon Distance is set with a value slightly larger than the radius of the reference data.
- -
- Time zone: the time zone of the study area. In this work, the time zone of Madrid (Spain).
- -
- Start and end date and time: start and end date for each analysis. In this work 4 different solar periods are used, which are detailed below, in Table 1:
- -
- Time interval: the temporality that the tool uses to calculate the different positions of the sun is defined. In this work, this parameter was set at 30 min.
- B.
- Shadow panels
- Observer Features: calculates the impact of the building’s shadow.
- Output Shadows Panels: generation of panels containing the calculated shadow attributes.
- Panel Size: the size of the observer panel in meters. In this work, it was decided to use a 3-m-length panel since it is the standard height of a floor in a building. This means that a panel is created every 3 m and was adjusted to the number of floors of the 3D building. For the finish of non-quadrangular forms, such as roofs, some panels are smaller. The results were therefore calculated on the basis of the total area and not on the basis of the panel as a basic unit.
- Sun Position: the solar positions created and developed in previous steps are used.
- Obstruction Features: all the buildings in the surroundings that can cast shadows on the evaluated building have been chosen. While this parameter is optional when using the tool, it is appropriate to include this information, since it improves the results.
- Use Observer Features as Obstruction: this option checks if the observer function of a 3D volume can cast shadows. In this work, the 3D buildings were considered as the observers, and, as the buildings always cast shadow on themselves, it was appropriate to leave this option enabled.
- Obstruction Terrain: is necessary to incorporate the surface model of the elevations that can cast shadows on the characteristics of the observer, that is, the DSM of the study area.
- ▪
- shadow_h: the amount of shadow hours in each building panel.
- ▪
- shadow_hits: the number of time intervals (sun positions) that each building panel is in the shadow.
- ▪
- num_suns: the number of sunlight hours received by each building panel.
- ▪
- Starting_date: initial date and time of the performed analysis.
- ▪
- Ending_date: final date and time of the performed analysis.
4.4. Comparison of Shadow Models between Different Scenarios
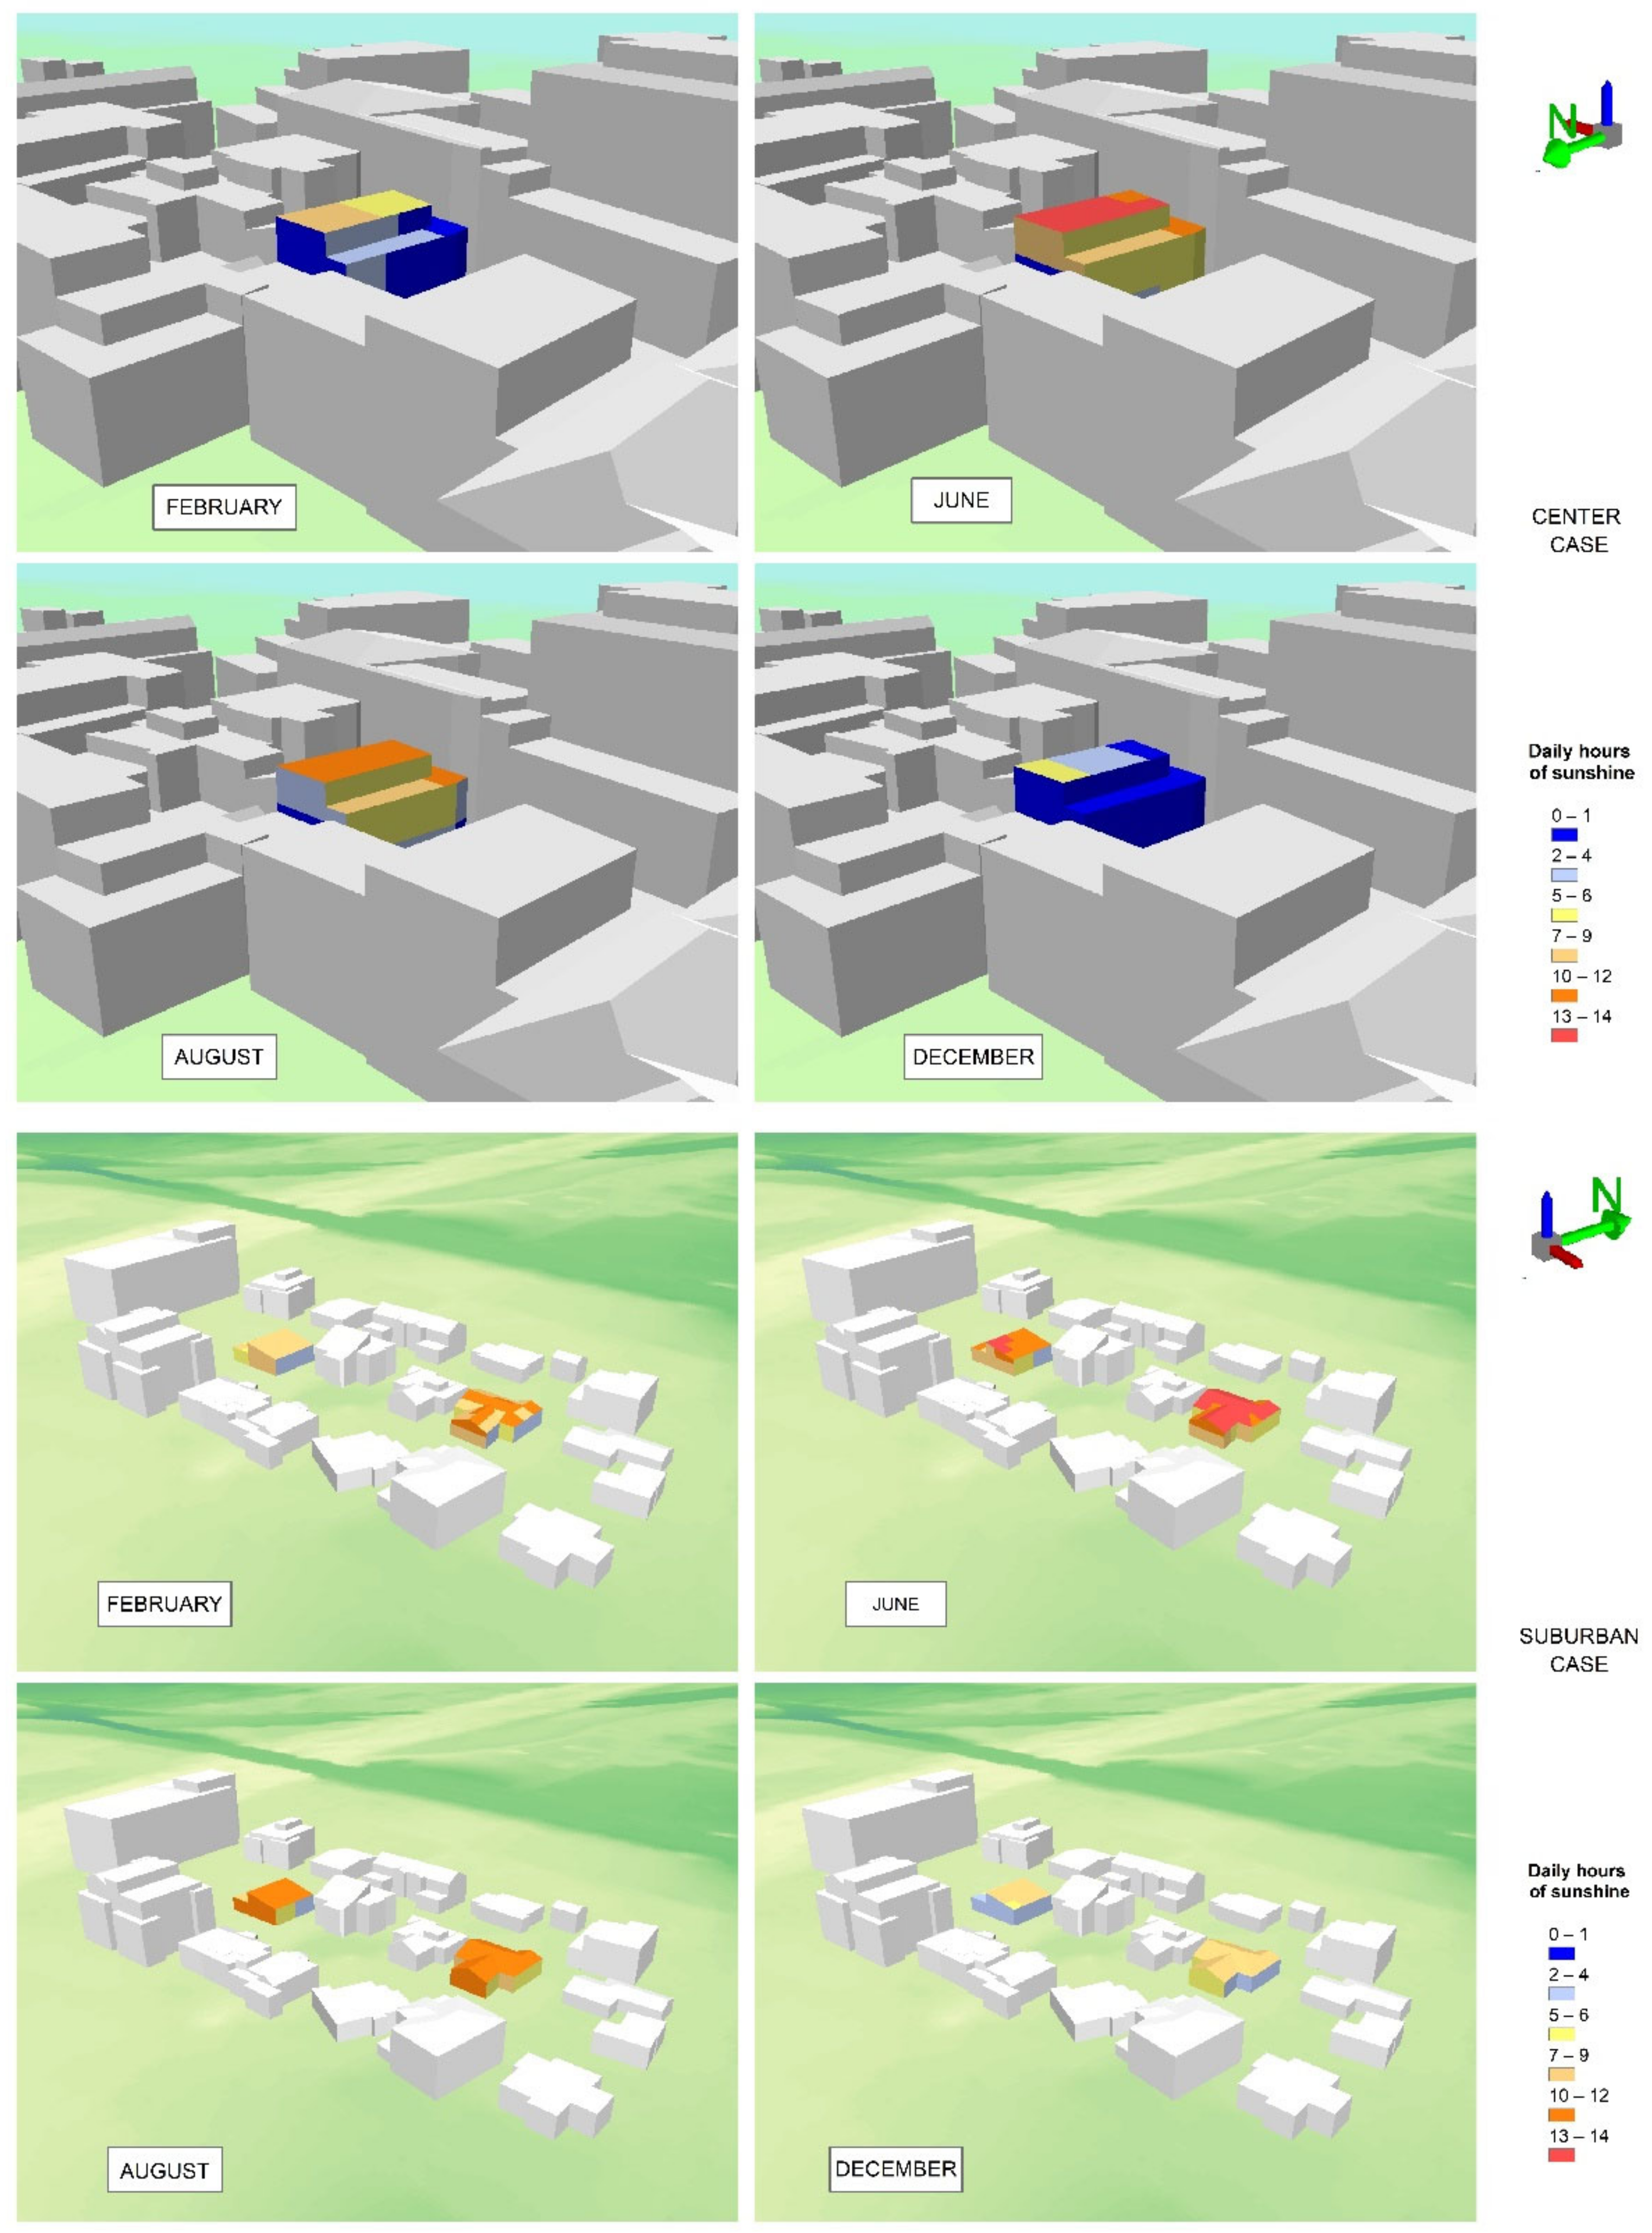
- Measurement at different dates of the year (February, June, August and December) for each building.
- Comparison between two single-family houses with similar characteristics.
- Comparison between case studies with a different construction environment.
- Comparison between different orientations of the building façade.
- Comparison for the same date between different floors of the building.
5. Results
6. Discussion and Conclusions
Author Contributions
Funding
Acknowledgments
Conflicts of Interest
Abbreviations
| 2D | Two-dimensional space |
| 3D | Three-dimensional space |
| BIM | Building Information Modelling |
| DEM | Digital Elevation Models |
| DGC | General Directorate for the Cadastre |
| DSM | Digital Surface Model |
| DTM | Digital Terrain Model |
| GIS | Geographic Information System |
| IGN | Spanish National Geographic Institute |
| LADM | Land Administration Domain Model |
| LiDAR | Light Detection and Ranging |
| MTN50 | Spanish National Topographic Map 1: 50,000 |
| nDSM | Standard digital surface model |
| PNOA | Spanish National Plan for Aerial Orthophotography |
| RMSE | Root-mean-square error |
References
- World Bank. (s.f.). Urban Population. 2021. Available online: https://data.worldbank.org/indicator/SP.URB.TOTL.IN.ZS (accessed on 3 February 2021).
- Garcia Pozo, A. A nested housing market structure: Additional evidence. Hous. Stud. 2009, 24, 373–395. [Google Scholar] [CrossRef]
- Andrić, I.; Gomes, N.; Pina, A.; Ferrão, P.; Fournier, J.; Lacarrière, B.; Le Corre, O. Modeling the long-term effect of climate change on building heat demand: Case study on a district level. Energy Build. 2016, 126, 77–93. [Google Scholar] [CrossRef]
- Park, Y.; Guldmann, J.M. Creating 3D city models with building footprints and LIDAR point cloud classification: A machine learning approach. Comput. Environ. Urban Syst. 2019, 75, 76–89. [Google Scholar] [CrossRef]
- Calugaru, A.; Anca, P.F.; Vasile, A. 3D cartography in urban environments for municipal administrations. In Proceedings of the 6th International Conference on Cartography and GIS, Albena, Bulgaria, 13–17 June 2016; p. 725. Available online: https://www.researchgate.net/profile/Temenoujka-Bandrova/publication/309772611_6th_International_Conference_on_Cartography_and_GIS/links/5d13644a299bf1547c7f9906/6th-International-Conference-on-Cartography-and-GIS.pdf#page=725 (accessed on 14 October 2020).
- Murtiyoso, A.; Veriandi, M.; Suwardhi, D.; Soeksmantono, B.; Harto, A.B. Automatic Workflow for Roof Extraction and Generation of 3D CityGML Models from Low-Cost UAV Image-Derived Point Clouds. ISPRS Int. J. Geo Inf. 2020, 9, 743. [Google Scholar] [CrossRef]
- Kolbe, T.H. Representing and exchanging 3D city models with CityGML. In 3D Geo-Information Sciences; Springer: Berlin/Heidelberg, Germany, 2009; pp. 15–31. [Google Scholar]
- Martín-Vares, A.V.; Olivares García, J.M.; Groeger, G. El Catastro que nos viene... El Catastro de edificios en 3D en los países europeos y la definición de las especificaciones de los edificios para la infraestructura de datos europea. CT Catastro 2010, 70, 27–43. [Google Scholar]
- Ungur, A.B.; Tudor, S.; Ferencz, Z. Example of a GIS Application afferent to the introduction of real estate cadastre in Cluj Napoca city, using AutoCAD Map 3D. Int. Multidiscip. Sci. GeoConference SGEM 2016, 3, 207–214. [Google Scholar] [CrossRef]
- Poux, F.; Billen, R. Voxel-based 3D point cloud semantic segmentation: Unsupervised geometric and relationship featuring vs. deep learning methods. ISPRS Int. J. Geo Inf. 2019, 8, 213. [Google Scholar] [CrossRef] [Green Version]
- Neuville, R.; Pouliot, J.; Poux, F.; de Rudder, L.; Billen, R. A Formalized 3D Geovisualization Illustrated to Selectivity Purpose of Virtual 3D City Model. ISPRS Int. J. Geo Inf. 2018, 7, 194. [Google Scholar] [CrossRef] [Green Version]
- Zhang, J. Developing a Comprehensive Framework for Property Valuation Using 3D and Remote Sensing Techniques in China. Master’s Thesis, University of Twente, Enschede, The Netherlands, 2019. Available online: https://library.itc.utwente.nl/papers_2019/msc/upm/zhang.pdf (accessed on 6 September 2020).
- Hofierka, J.; Zlocha, M. A new 3-D solar radiation model for 3-D city models. Trans. GIS 2012, 16, 681–690. [Google Scholar] [CrossRef]
- Rich, P.M.; Dubayah, R.O.; Hetrick, W.A.; Saving, S.C. Using viewshed models to calculate intercepted solar radiation: Applications in ecology. Am. Soc. Photogramm. Remote Sens. Tech. Pap. 1994, 524–529. Available online: http://www.professorpaul.com/publications/rich_et_al_1994_asprs.pdf (accessed on 4 October 2020).
- Fu, P.; Rich, P.M. Design and implementation of the solar analyst: An ArcView extension for modeling solar radiation at landscape scales. In Proceedings of the Nineteenth Annual ESRI User Conference, San Diego, CA, USA, 26–30 July 1999; Available online: http://www.esri.com/library/userconf/proc99/proceed/papers/pap867/p867.htm (accessed on 6 October 2020).
- Fu, P.; Rich, P.M. A geometric solar radiation model with applications in agriculture and forestry. Comput. Electron. Agric. 2002, 37, 25–35. [Google Scholar] [CrossRef]
- Miranda, F.; Doraiswamy, H.; Lage, M.; Wilson, L.; Hsieh, M.; Silva, C.T. Shadow accrual maps: Efficient accumulation of city-scale shadows over time. IEEE Trans. Vis. Comput. Graph. 2018, 25, 1559–1574. [Google Scholar] [CrossRef] [Green Version]
- Saretta, E.; Caputo, P.; Frontini, F. A review study about energy renovation of building facades with BIPV in urban environment. Sustain. Cities Soc. 2019, 44, 343–355. [Google Scholar] [CrossRef]
- Sirmans, G.S.; Macpherson, D.A.; Zietz, E.N. The Composition of Hedonic Pricing Models. J. Real Estate Lit. 2005, 13, 3–43. Available online: http://www.jstor.org/stable/44103506 (accessed on 6 October 2020).
- Ismail, S. Spatial autocorrelation and real estate studies: A literature review. Reg. Sci. Urban Econ. 2006, 1, 1–13. [Google Scholar]
- McMillen, D.P. Issues in spatial data analysis. J. Reg. Sci. 2010, 50, 119–141. [Google Scholar] [CrossRef]
- Franco, S.F.; Macdonald, J.L. Measurement and valuation of urban greenness: Remote sensing and hedonic applications to Lisbon, Portugal. Reg. Sci. Urban Econ. 2018, 72, 156–180. [Google Scholar] [CrossRef]
- Jain, S. Remote sensing application for property tax evaluation. Int. J. Appl. Earth Obs. Geoinf. 2008, 10, 109–121. [Google Scholar] [CrossRef]
- Zhang, Z.; Lu, X.; Zhou, M.; Song, Y.; Luo, X.; Kuang, B. Complex spatial morphology of urban housing based on digital elevation model: A case study of Wuhan City, China. Sustainability 2019, 11, 348. [Google Scholar] [CrossRef] [Green Version]
- Atazadeh, B.; Kalantari, M.; Rajabifard, A.; Ho, S. Modelling building ownership boundaries within BIM environment: A case study in Victoria, Australia. Comput. Environ. Urban Syst. 2017, 61, 24–38. [Google Scholar] [CrossRef]
- Atazadeh, B.; Kalantari, M.; Rajabifard, A.; Ho, S.; Ngo, T. Building information modelling for high-rise land administration. Trans. GIS 2017, 21, 91–113. [Google Scholar] [CrossRef]
- Drobež, P.; Fras, M.K.; Ferlan, M.; Lisec, A. Transition from 2D to 3D real property cadastre: The case of the Slovenian cadastre. Comput. Environ. Urban Syst. 2017, 62, 125–135. [Google Scholar] [CrossRef]
- Mahdjoubi, L.; Moobela, C.; Laing, R. Providing real-estate services through the integration of 3D laser scanning and building information modelling. Comput. Ind. 2013, 64, 1272–1281. [Google Scholar] [CrossRef]
- Kara, A.; van Oosterom, P.; Çağdaş, V.; Işıkdağ, Ü.; Lemmen, C. 3 Dimensional data research for property valuation in the context of the LADM Valuation Information Model. Land Use Policy 2020, 98, 104179. [Google Scholar] [CrossRef]
- El Yamani, S.; Hajji, R.; Nys, G.A.; Ettarid, M.; Billen, R. 3D Variables Requirements for Property Valuation Modeling Based on the Integration of BIM and CIM. Sustainability 2021, 13, 2814. [Google Scholar] [CrossRef]
- Eleftheriadis, S.; Mumovic, D.; Greening, P. Life cycle energy efficiency in building structures: A review of current developments and future outlooks based on BIM capabilities. Renew. Sustain. Energy Rev. 2017, 67, 811–825. [Google Scholar] [CrossRef] [Green Version]
- Encinas, F.; De Herde, A. Sensitivity analysis in building performance simulation for summer comfort assessment of apartments from the real estate market. Energy Build. 2013, 65, 55–65. [Google Scholar] [CrossRef]
- Natephra, W.; Motamedi, A.; Yabuki, N.; Fukuda, T. Integrating 4D thermal information with BIM for building envelope thermal performance analysis and thermal comfort evaluation in naturally ventilated environments. Build. Environ. 2017, 124, 194–208. [Google Scholar] [CrossRef]
- Freeman, A.M., III. Hedonic Prices, Property Values and Measuring Environmental Benefits: A survey of the Issues. Scand. J. Econ. 1979, 81, 154–173. [Google Scholar] [CrossRef] [Green Version]
- Abidoye, R.B.; Chan, A.P.C. Critical review of hedonic pricing model application in property price appraisal: A case of Nigeria. Int. J. Sustain. Built Environ. 2017, 6, 250–259. [Google Scholar] [CrossRef]
- Instituto Nacional de Estadística. Estadística del Padrón Continuo. 2021. Available online: https://www.ine.es/dyngs/INEbase/es/operacion.htm?c=Estadistica_C&cid=1254736177012&menu=resultados&idp=1254734710990 (accessed on 10 April 2021).




| Date | Starting Time | Ending Time |
|---|---|---|
| 20 June 2020 (Summer solstice) | 7:30 | 21:30 |
| 21 August 2020 | 8:00 | 20:30 |
| 21 December 2020 (Winter solstice) | 9:00 | 18:03 |
| 21 February 2020 | 8:30 | 19:00 |
| Historic Center | Periphery 1 | Periphery 2 | ||||||||||
|---|---|---|---|---|---|---|---|---|---|---|---|---|
| Feb. | Jun. | Ago. | Dic. | Feb. | Jun. | Ago. | Dic. | Feb. | Jun. | Ago. | Dic. | |
| South | 0 | 0.3 | 0.2 | 0 | 1.1 | 1.2 | 1.4 | 0.4 | 1.3 | 1.4 | 1.5 | 0.9 |
| East | 0 | 0 | 0 | 0 | 0.2 | 0.2 | 0.2 | 0.1 | 0.4 | 0.7 | 0.6 | 0.3 |
| West | 0 | 0.3 | 0.2 | 0 | 0.4 | 0.5 | 0.4 | 0.3 | 0.7 | 1 | 0.8 | 0.6 |
| North | 0 | 0.2 | 0.1 | 0 | 0 | 0.9 | 0.3 | 0 | 0 | 1.3 | 0.6 | 0 |
| Roof | 0.8 | 1.9 | 1.7 | 0.3 | 1 | 1.3 | 1.2 | 0.8 | 1.8 | 2.6 | 2.4 | 1.5 |
| Monthly Total | 0.8 | 2.8 | 2.1 | 0.3 | 2.7 | 4.1 | 3.5 | 1.6 | 4.2 | 7 | 5.9 | 3.3 |
| Annual Total | 6 | 11.9 | 20.4 | |||||||||
| June | August | December | February | |||||||||||||
|---|---|---|---|---|---|---|---|---|---|---|---|---|---|---|---|---|
| No. of Floors | 1–3 | 4–6 | 7–9 | 10–13 | 1–3 | 4–6 | 7–9 | 10–13 | 1–3 | 4–6 | 7–9 | 10–13 | 1–3 | 4–6 | 7–9 | 10–13 |
| South | 0.4 | 0.5 | 0.6 | 0.7 | 0.4 | 0.5 | 0.6 | 0.8 | 0.2 | 0.2 | 0.4 | 0.7 | 0.2 | 0.3 | 0.6 | 0.8 |
| East | 0.1 | 0.2 | 0.3 | 0.4 | 0.1 | 0.2 | 0.3 | 0.4 | 0 | 0 | 0.1 | 0.3 | 0 | 0.1 | 0.2 | 0.3 |
| West | 0.1 | 0.1 | 0.2 | 0.3 | 0 | 0.1 | 0.1 | 0.2 | 0 | 0 | 0 | 0.1 | 0 | 0 | 0.1 | 0.2 |
| North | 0.2 | 0.3 | 0.3 | 0.5 | 0.1 | 0.1 | 0.2 | 0.3 | 0 | 0 | 0 | 0 | 0 | 0 | 0 | 0.1 |
| Roof | - | 0.6 | - | 1.7 | - | 0.3 | - | 1.5 | - | 0 | - | 1.1 | - | 0.1 | - | 1.3 |
| Total | 0.8 | 1.7 | 1.4 | 3.6 | 0.6 | 1.2 | 1.2 | 3.2 | 0.2 | 0.2 | 0.5 | 2.2 | 0.2 | 0.5 | 0.9 | 2.6 |
| Total building | 7.5 | 6.2 | 3.1 | 4.2 | ||||||||||||
Publisher’s Note: MDPI stays neutral with regard to jurisdictional claims in published maps and institutional affiliations. |
© 2021 by the authors. Licensee MDPI, Basel, Switzerland. This article is an open access article distributed under the terms and conditions of the Creative Commons Attribution (CC BY) license (https://creativecommons.org/licenses/by/4.0/).
Share and Cite
Castro Noblejas, H.; Sortino Barrionuevo, J.F.; Gumiel Muñoz, D.; Mérida Rodríguez, M.F. A Methodological Proposal for the Analysis of Lighting the House Building Façades. ISPRS Int. J. Geo-Inf. 2021, 10, 536. https://doi.org/10.3390/ijgi10080536
Castro Noblejas H, Sortino Barrionuevo JF, Gumiel Muñoz D, Mérida Rodríguez MF. A Methodological Proposal for the Analysis of Lighting the House Building Façades. ISPRS International Journal of Geo-Information. 2021; 10(8):536. https://doi.org/10.3390/ijgi10080536
Chicago/Turabian StyleCastro Noblejas, Hugo, Juan Francisco Sortino Barrionuevo, Darío Gumiel Muñoz, and Matías Francisco Mérida Rodríguez. 2021. "A Methodological Proposal for the Analysis of Lighting the House Building Façades" ISPRS International Journal of Geo-Information 10, no. 8: 536. https://doi.org/10.3390/ijgi10080536
APA StyleCastro Noblejas, H., Sortino Barrionuevo, J. F., Gumiel Muñoz, D., & Mérida Rodríguez, M. F. (2021). A Methodological Proposal for the Analysis of Lighting the House Building Façades. ISPRS International Journal of Geo-Information, 10(8), 536. https://doi.org/10.3390/ijgi10080536


