Article

Improving Urban Land Cover Classification with Combined Use of Sentinel-2 and Sentinel-1 Imagery

1
State Key Laboratory of Information Engineering in Surveying, Mapping and Remote Sensing, Wuhan University, Wuhan 430079, China
2
School of Geography and Information Engineering, China University of Geosciences, Wuhan 430074, China
3
Department of Geosciences, University of Arkansas, Fayetteville, AR 72701, USA
4
School of Electronics Information and Communications, Huazhong University of Science and Technology, 1037 Luoyu Road, Wuhan 430074, China
5
School of Electronics and Automation, Inner Mongolia Electronic Information Vocational Technical College, Huhhot 010070, China
*
Author to whom correspondence should be addressed.
ISPRS Int. J. Geo-Inf. 2021, 10(8), 533; https://doi.org/10.3390/ijgi10080533
Submission received: 3 June 2021 / Revised: 28 July 2021 / Accepted: 5 August 2021 / Published: 9 August 2021
(This article belongs to the Special Issue Earth Observation Data in Sustainable Urban Science Research)

Abstract

:
Accurate land cover mapping is important for urban planning and management. Remote sensing data have been widely applied for urban land cover mapping. However, obtaining land cover classification via optical remote sensing data alone is difficult due to spectral confusion. To reduce the confusion between dark impervious surface and water, the Sentinel-1A Synthetic Aperture Rader (SAR) data are synergistically combined with the Sentinel-2B Multispectral Instrument (MSI) data. The novel support vector machine with composite kernels (SVM-CK) approach, which can exploit the spatial information, is proposed to process the combination of Sentinel-2B MSI and Sentinel-1A SAR data. The classification based on the fusion of Sentinel-2B and Sentinel-1A data yields an overall accuracy (OA) of 92.12% with a kappa coefficient (KA) of 0.89, superior to the classification results using Sentinel-2B MSI imagery and Sentinel-1A SAR imagery separately. The results indicate that the inclusion of Sentinel-1A SAR data to Sentinel-2B MSI data can improve the classification performance by reducing the confusion between built-up area and water. This study shows that the land cover classification can be improved by fusing Sentinel-2B and Sentinel-1A imagery.

1. Introduction

Rapid urbanization has several negative effects, such as heavy haze, the urban heat island effect, and the degradation of urban ecosystem services. Accurate land cover maps can contribute to land use management, urban management, and sustainable development. Remote sensing technology has become a useful tool for monitoring land cover and urban expansion. In particular, remote sensing images with a medium spatial resolution (10 m to 100 m) have been widely adopted to classify land cover types. For instance, Landsat 7 ETM+ and Landsat 8 OLI data have been widely applied for land cover mapping [1,2,3]. Sentinel-1 and Sentinel-2, as two new-generation platforms, also provide free satellite imagery [4,5,6]. The 30 m and 10 m global land cover maps are produced using Landsat TM, ETM+, and Sentinel-2 Multispectral Instrument (MSI) satellite images [7,8]. Given its fine resolution, Sentinel-2 MSI data are able to provide fine-scale land cover classification at global and regional scales. However, optical sensors are usually hampered by atmospheric conditions [9,10,11]. The geometric and dielectric properties of the Earth’s surface can be observed by Synthetic Aperture Rader (SAR) data. Additionally, microwaves can penetrate clouds, haze, and smoke. As a result, SAR data are not affected by weather conditions. SAR data are found to discriminate land cover types in clouded regions. Studies have proved that information of reflectance and backscatter coefficient can be obtained from the integration of optical data and SAR data [12,13,14]. Thus, land cover classification using multi-source images has shown great potential [15].
The Sentinel-2 and Sentinel-1 data have been used in many scientific fields. The applications of Sentinel-2 MSI data involve burned area discrimination, hydrothermally altered mineral mapping, landslide susceptibility assessment, and mangrove extent mapping [16,17,18,19,20]. It has been shown that Sentinel-2 MSI data can be used for land cover mapping in urban areas. The differences between dark impervious surface and water are not conspicuous, which poses a major problem for accurate classification using Sentinel-2 MSI data alone. Dark impervious surfaces tend to be confused with water when using optical images alone [21]. Sentinel-1 SAR imagery has been used for land cover mapping, flood monitoring, soil moisture retrieval, and rice production estimation [22,23,24,25]. Sentinel-1 SAR data can replace Sentinel-2 MSI data when the image quality of Sentinel-2 MSI is impacted by cloud and fog. Timely land cover maps derived from Sentinel-1 SAR images are of great importance to urban management. Considering the complex distributions of materials in urban areas, land cover classification generated from Sentinel-1 SAR data remains a challenge. Sentinel-2 MSI data can be combined with Sentinel-1 SAR data for vegetation type classification, biomass estimation of mangrove forests, and burned area mapping [26,27,28]. Several studies have shown that land cover classifications can be improved when SAR data are combined with optical data [29,30]. To improve the accuracy of land cover classification, Sentinel-1 SAR data should be synergistically combined with Sentinel-2 MSI data. However, few studies have focused on the fusion of Sentinel-2 MSI and Sentinel-1 SAR data for urban land cover classification. Therefore, the effectiveness of fusing Sentinel-2 MSI and Sentinel-1 SAR images deserves further assessment.
Machine learning algorithms that include support vector machine (SVM), extreme learning machine (ELM), and kernel extreme learning machine (KELM) have been widely used for image classification [31,32,33]. Traditionally, these machine learning algorithms only utilize spectral information. The classification accuracy can be improved by combining spatial information with spectral information [34,35,36,37]. Textures of bands can enhance classification by reducing heterogeneity and preserving boundaries of the same land cover type. The spatial information of remote sensing data has proven useful in urban land cover classification. Deep learning techniques have shown a great capability in extracting spatial information from raw images. However, these methods are limited by their inefficiencies in the processing time and difficulties in collecting training samples. The support vector machine with composite kernels (SVM-CK), which was proposed in 2015, can achieve a better performance compared with traditional methods [38]. To produce accurate land cover maps, the SVM-CK algorithm is applied to the combination of Sentinel-2B MSI and Sentinel-1A SAR data. The objectives of this research are: (1) to assess the effectiveness of Sentinel-1 SAR data in classifying land cover types, (2) to evaluate the effectiveness of fusing Sentinel-2 MSI and Sentinel-1 SAR images, and (3) to evaluate the effectiveness of SVM-CK in terms of land cover classification.

2. Study Area and Materials
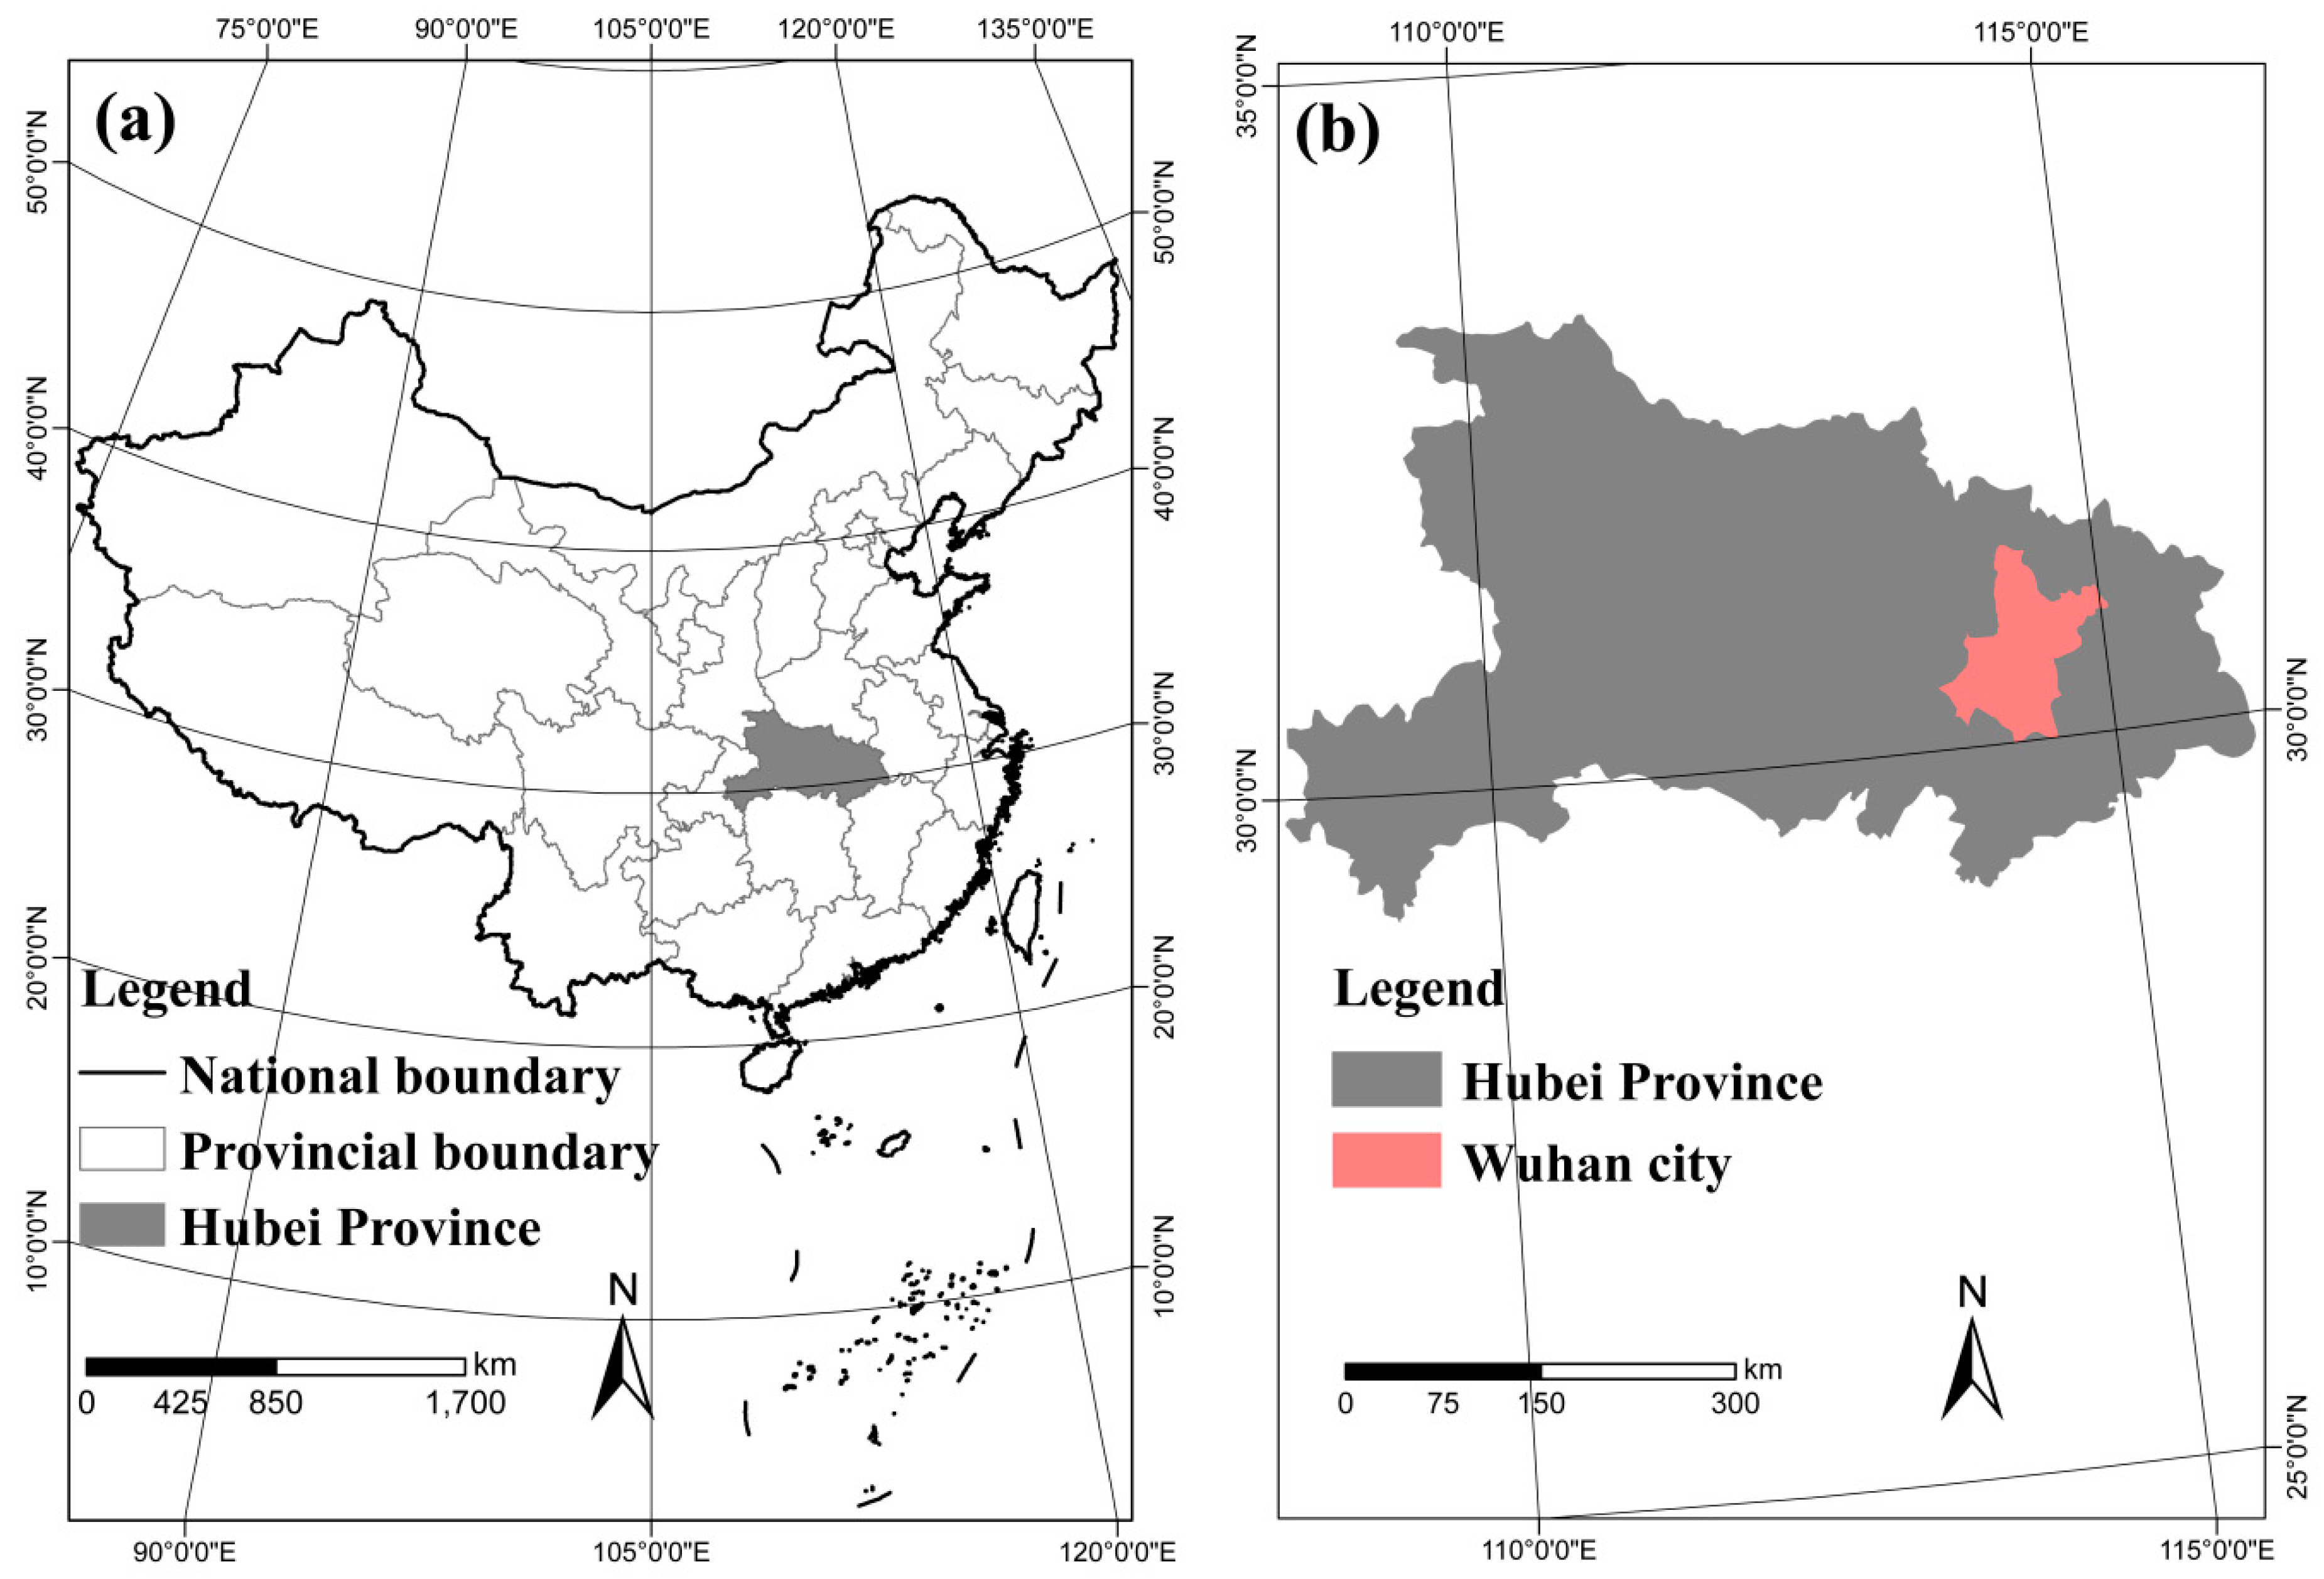
2.1. Study Area

The Wuhan metropolis, which is the capital of Hubei Province, is a representative city in central China [39]. Over the past four decades, Wuhan has experienced rapid urbanization because of the opening up and reform policy. The city of Wuhan has a great influence on the Yangtze River Economic Belt. The land cover types of Wuhan mainly include built-up area, water, forest, cropland, and bare soil [40,41,42]. To avoid the uncertainty introduced by image mosaicking, only one scene of a Sentinel-2B MSI image and one scene of a Sentinel-1A SAR image are used [43]. The study area (2223 km2) covers the core regions of Wuhan (Figure 1).

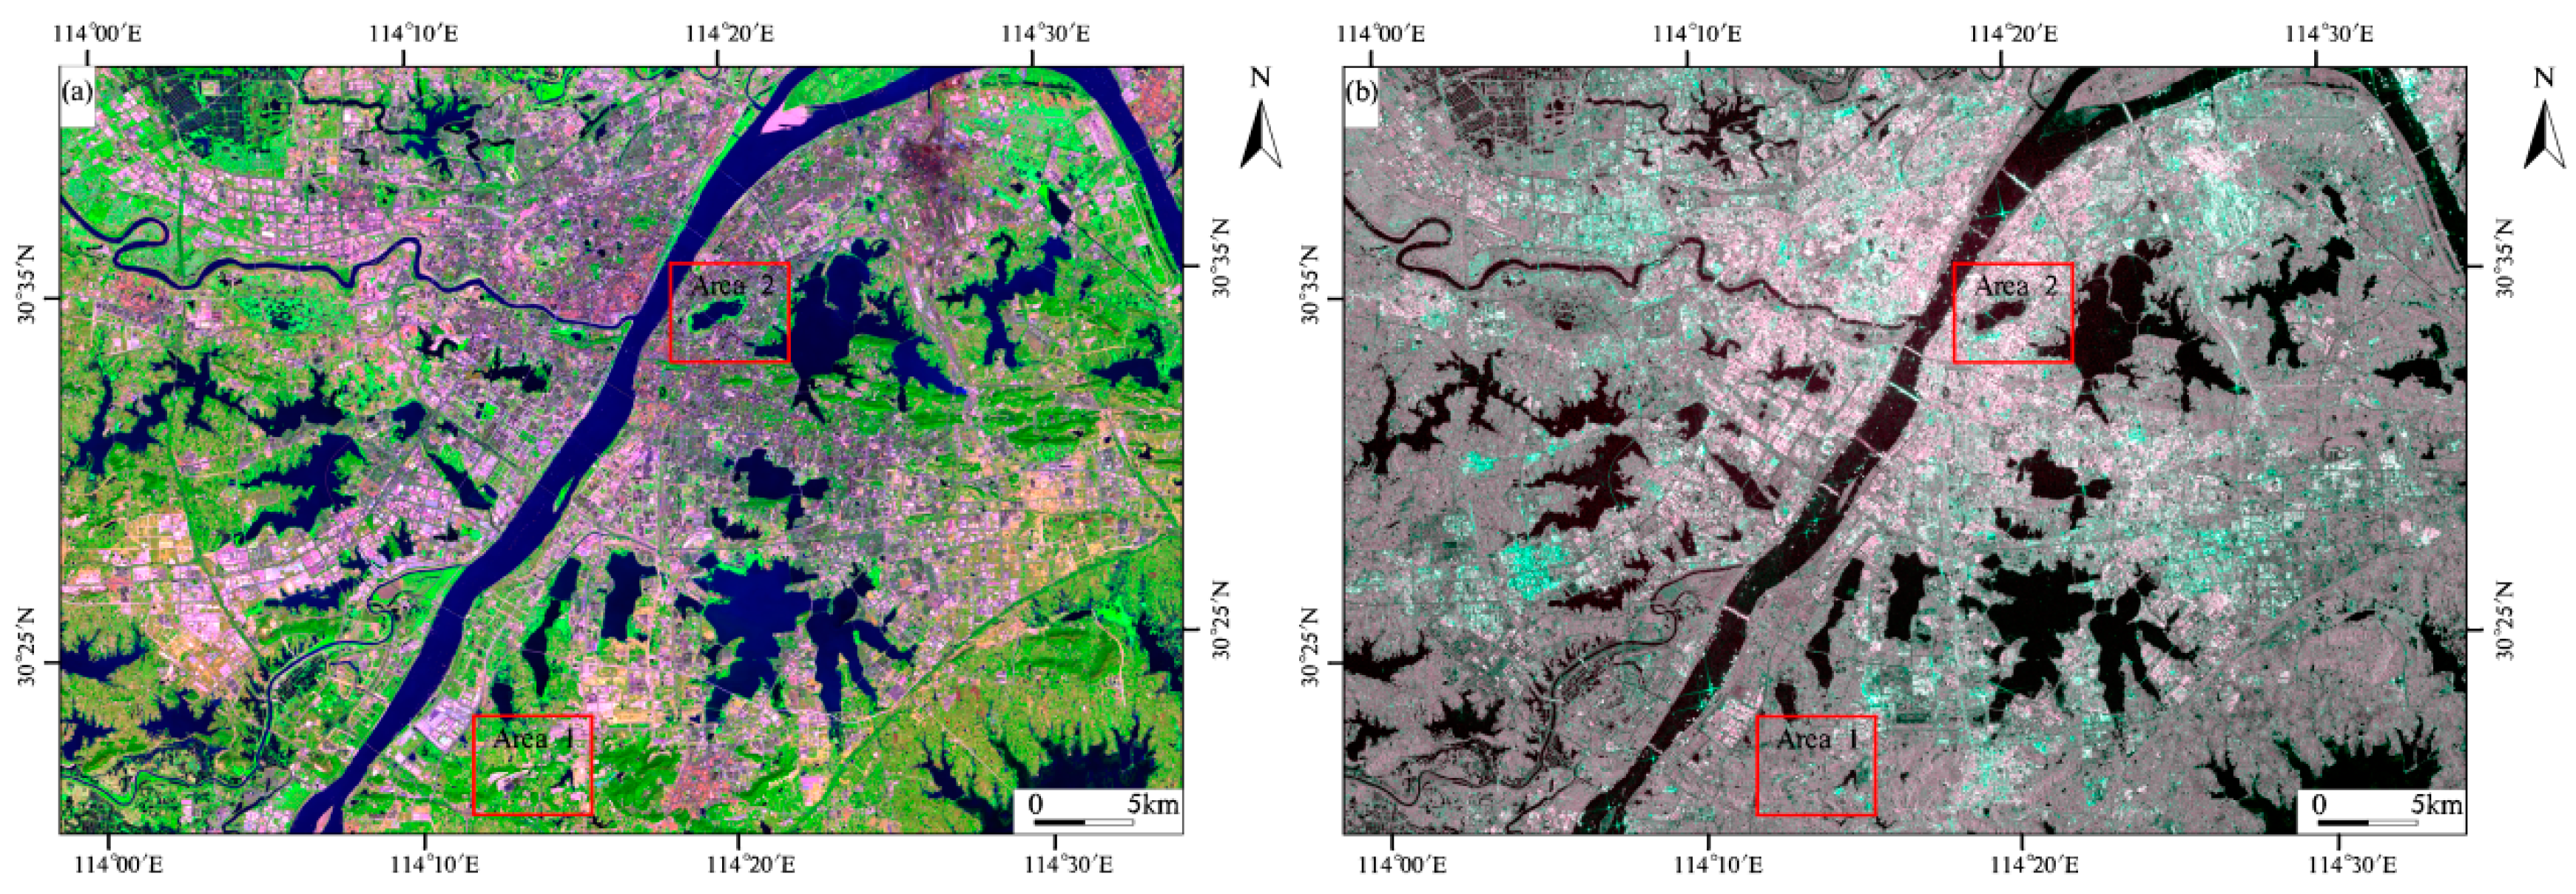
2.2. Remote Sensing Data
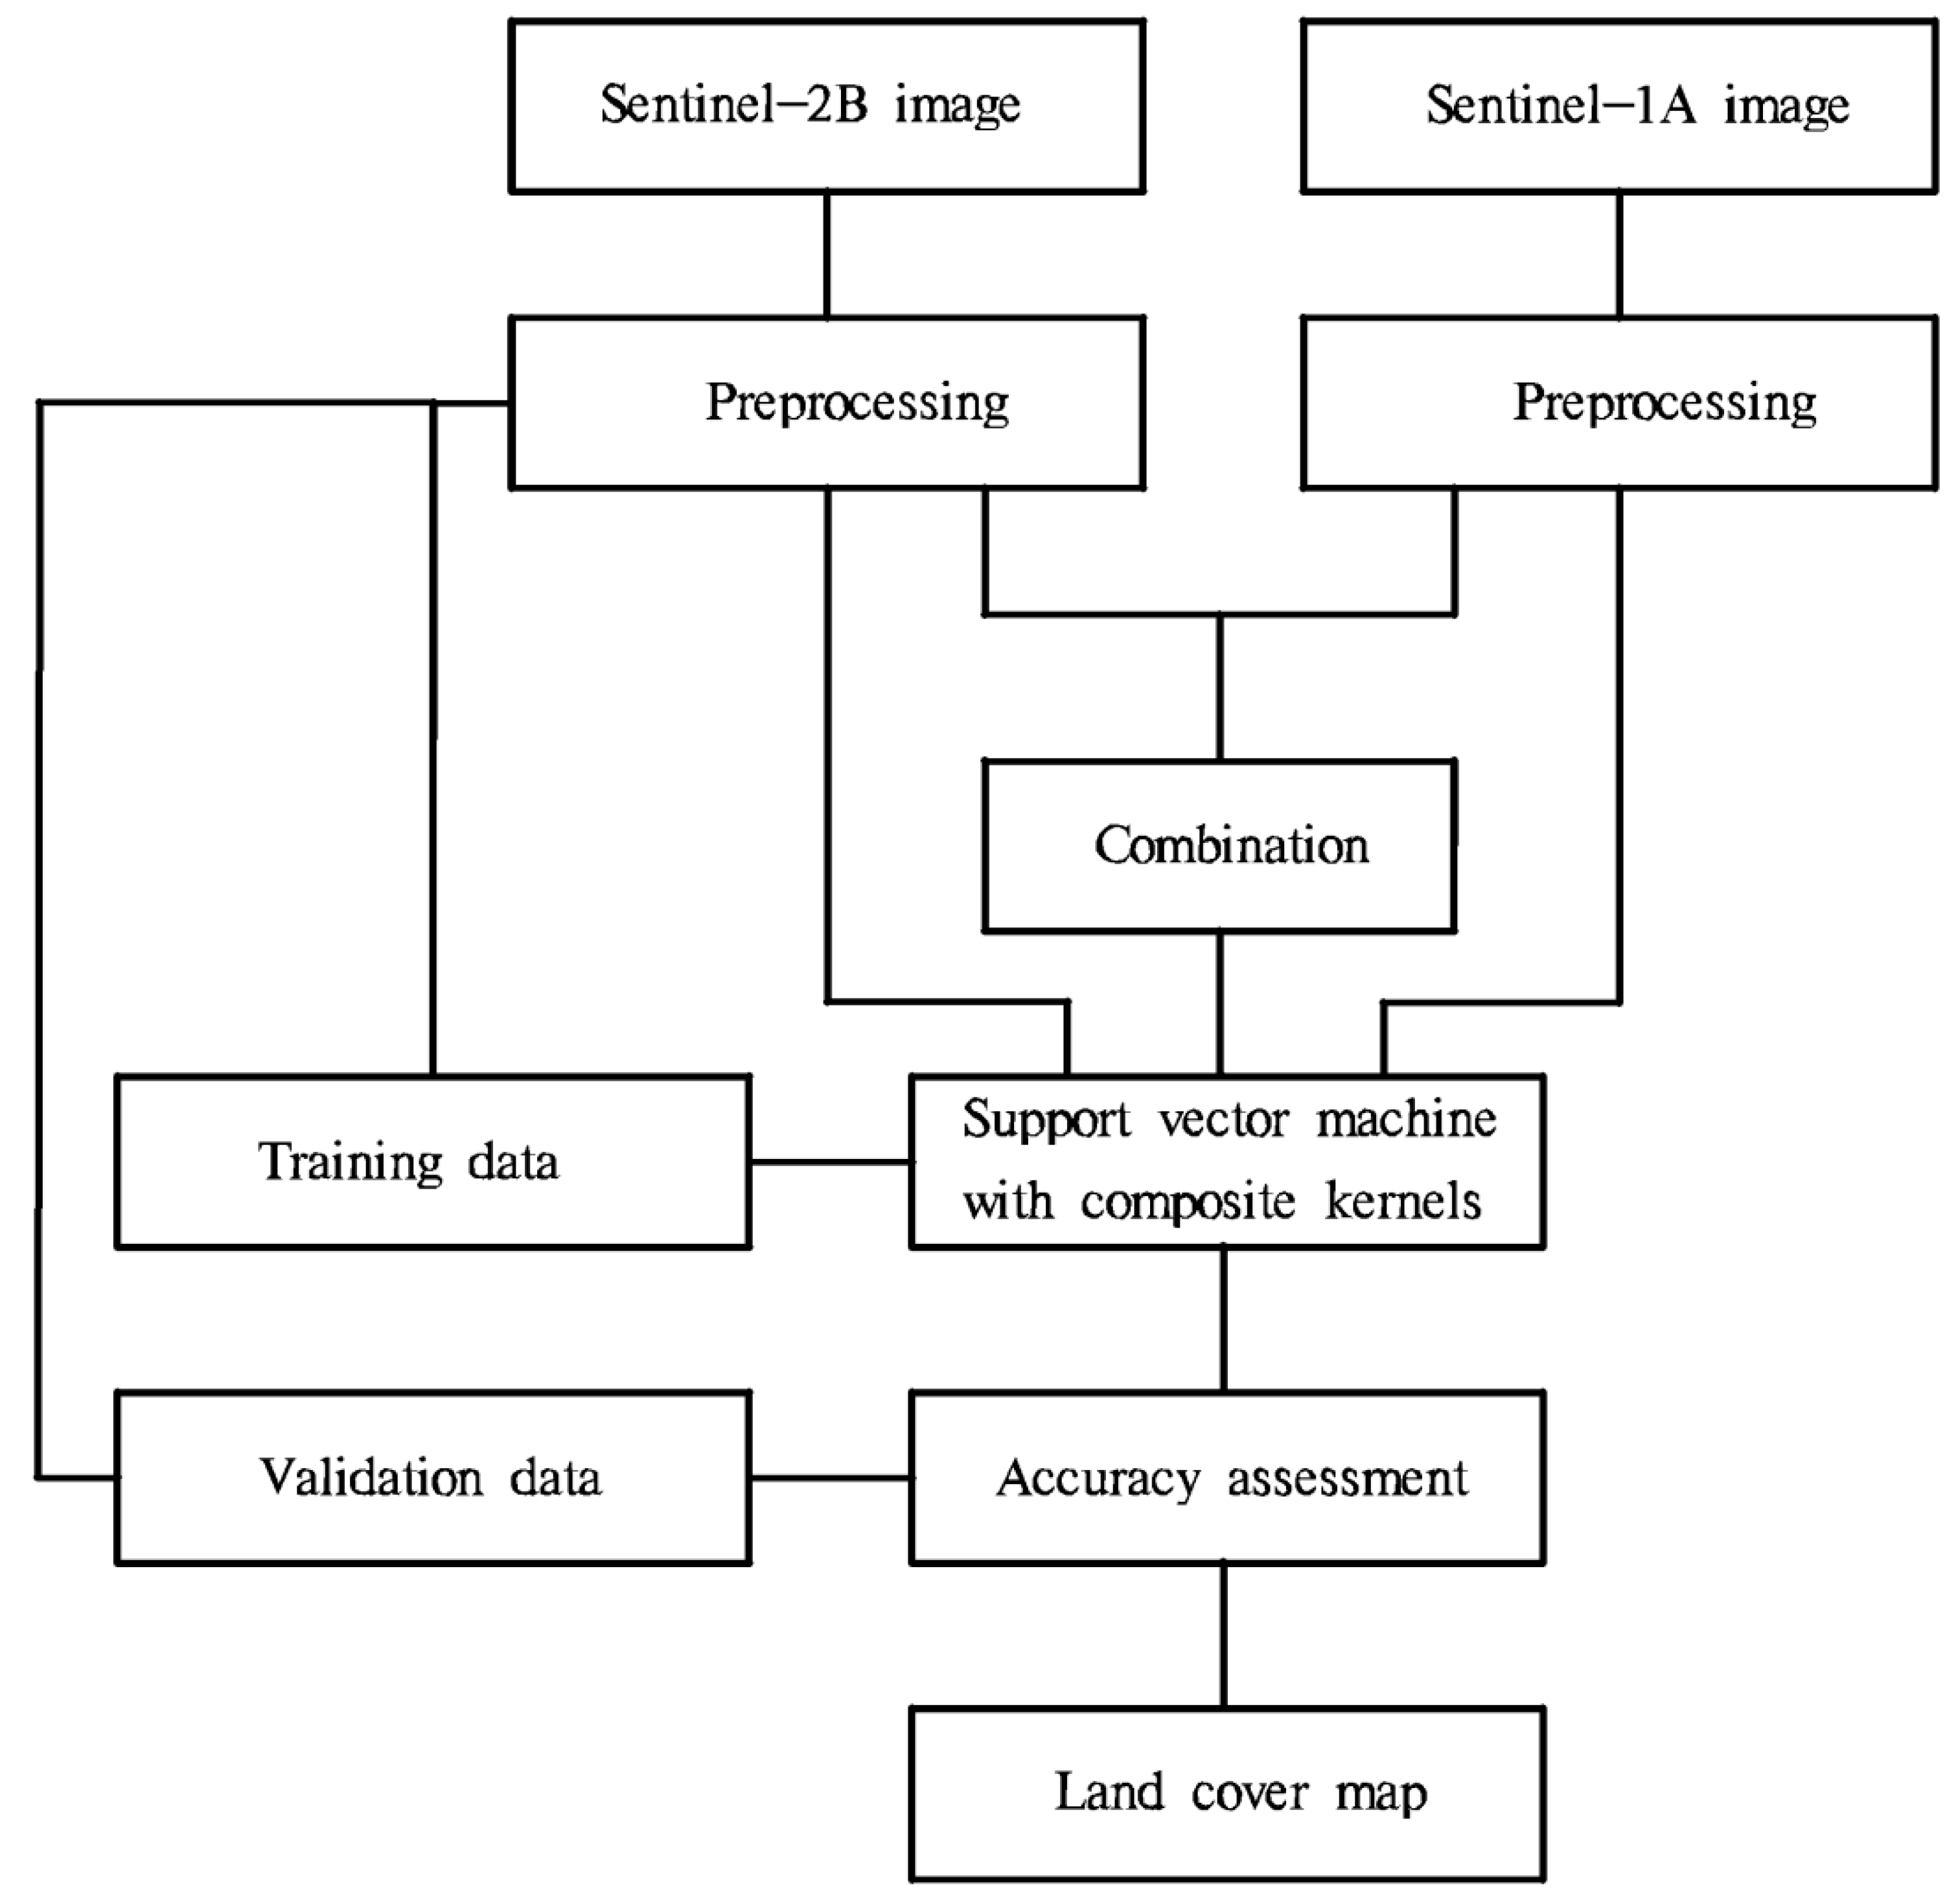
The Landsat 8 satellite that carries the Operational Land Imager (OLI) sensor was launched on 11 February 2013. OLI has five bands in the visible and near-infrared (VNIR) region and three bands in the shortwave infrared (SWIR) region [44]. These eight bands have a 30 m spatial resolution over a 185 km swath. The Sentinel-2B satellite that carries an innovative MSI was launched on 7 March 2017. The MSI has ten bands in the VNIR region and three bands in the SWIR region. The four bands (B02, B03, B04, and B08) have a 10 m spatial resolution over a 100 km swath. In addition, the six bands (B05, B06, B07, B8a, B11, and B12) have a 20 m spatial resolution over a 100 km swath [45].
The Sentinel-1A images acquired in the Interferometric Wide Swath (IW) mode are available. The Sentinel-1A IW level-1 Ground Range Detected (GRD) image acquired on 16 October 2018 is analyzed in this research. This Sentinel-1A scene is captured at 5 m by 20 m spatial resolution, in dual-polarization (VV + VH) [46,47].

3. Methods

3.1. Preprocessing of Sentinel-2B MSI and Sentinel-1A SAR Data

The Sentinel-2B MSI image acquired on 12 October 2018, Landsat 8 OLI image acquired on 15 September 2018, and Sentinel-1A SAR image acquired on 16 October 2018 are analyzed in this study. The Sentinel-2B image (bands 2–7,8a, 11–12) and Landsat 8 OLI image (bands 1–7) are radiometrically corrected in ENVI 5.5.1 (the Environment for Visualizing Images). A combination of the Sentinel-1A image and corresponding orbit file is imported into SARscape 5.2.1 [21]. A Frost filter with a 9×9 window is applied to reduce the noise. The intensity values of the Sentinel-1A image are converted into sigma naught (dB) by performing radiometric calibration. The Sentinel-2B MSI image and Sentinel-1A SAR image are resampled to a 20 m resolution and coregistered to the Landsat 8 OLI image. Both Sentinel-2B MSI and Sentinel-1A SAR data are spatially subset in ENVI 5.5.1 to the study area (Figure 2). The procedure for land cover classification is illustrated in Figure 3.

3.2. Reference Data Acquisition and Accuracy Assessment

A total of 435 regions of interest (ROIs) are selected for training and validation (Table 1) [48]. Pixels representing water, forest, cropland, and bare soil are selected from the false-color composite Sentinel-2B MSI image (Figure 2a). The built-up area consists of asphalt, concrete, red-tiled roofs, and metal. In urban areas, asphalt roads and old concrete roofs can be easily confused with water. It is also difficult to distinguish water from shaded areas caused by high buildings. Shaded areas caused by high buildings are common in urban areas due to the spatial resolution of the Sentinel-2B MSI image. Assisted by Google Earth imagery (available online: https://google-earth.gosur.com/ (accessed on 1 July 2021)), it is observed that shaded areas are predominantly covered by concrete. Therefore, the shaded area is not regarded as a land cover type. Google Earth is useful for selecting suitable ROIs. Therefore, pixels representing built-up area are collected from the Sentinel-2B MSI image and Google Earth images. The classifications are assessed by the overall accuracy (OA) and kappa coefficient (KA). Each land cover type is evaluated by the producer’s accuracy (PA), user’s accuracy (UA), and F-score.

3.3. SVM-CK Algorithm

The SVM-CK algorithm is employed to process the remote sensing data because of its great performance. The SVM-CK algorithm has shown good performance because this classifier can use spatial information. The method requires three adjustable parameters: the penalty parameter (C), the kernel parameter (σ1) for the remote sensing data, and the kernel parameter (σ2) for the mean texture of remote sensing data. The ranges of these three parameters correspond to: C = (10, 102, 103, 104, 105, 106), σ1 = (2 −5, 2 −4,…, 25), and σ2 = (2 −5, 2 −4,…, 25). A 5-fold cross-validation with a grid search method is used for tuning these parameters [49]. The training pixels are used to select the optimal parameters in MATLAB 2017a software. The validation pixels are used for accuracy assessments and statistical comparisons.

4. Results

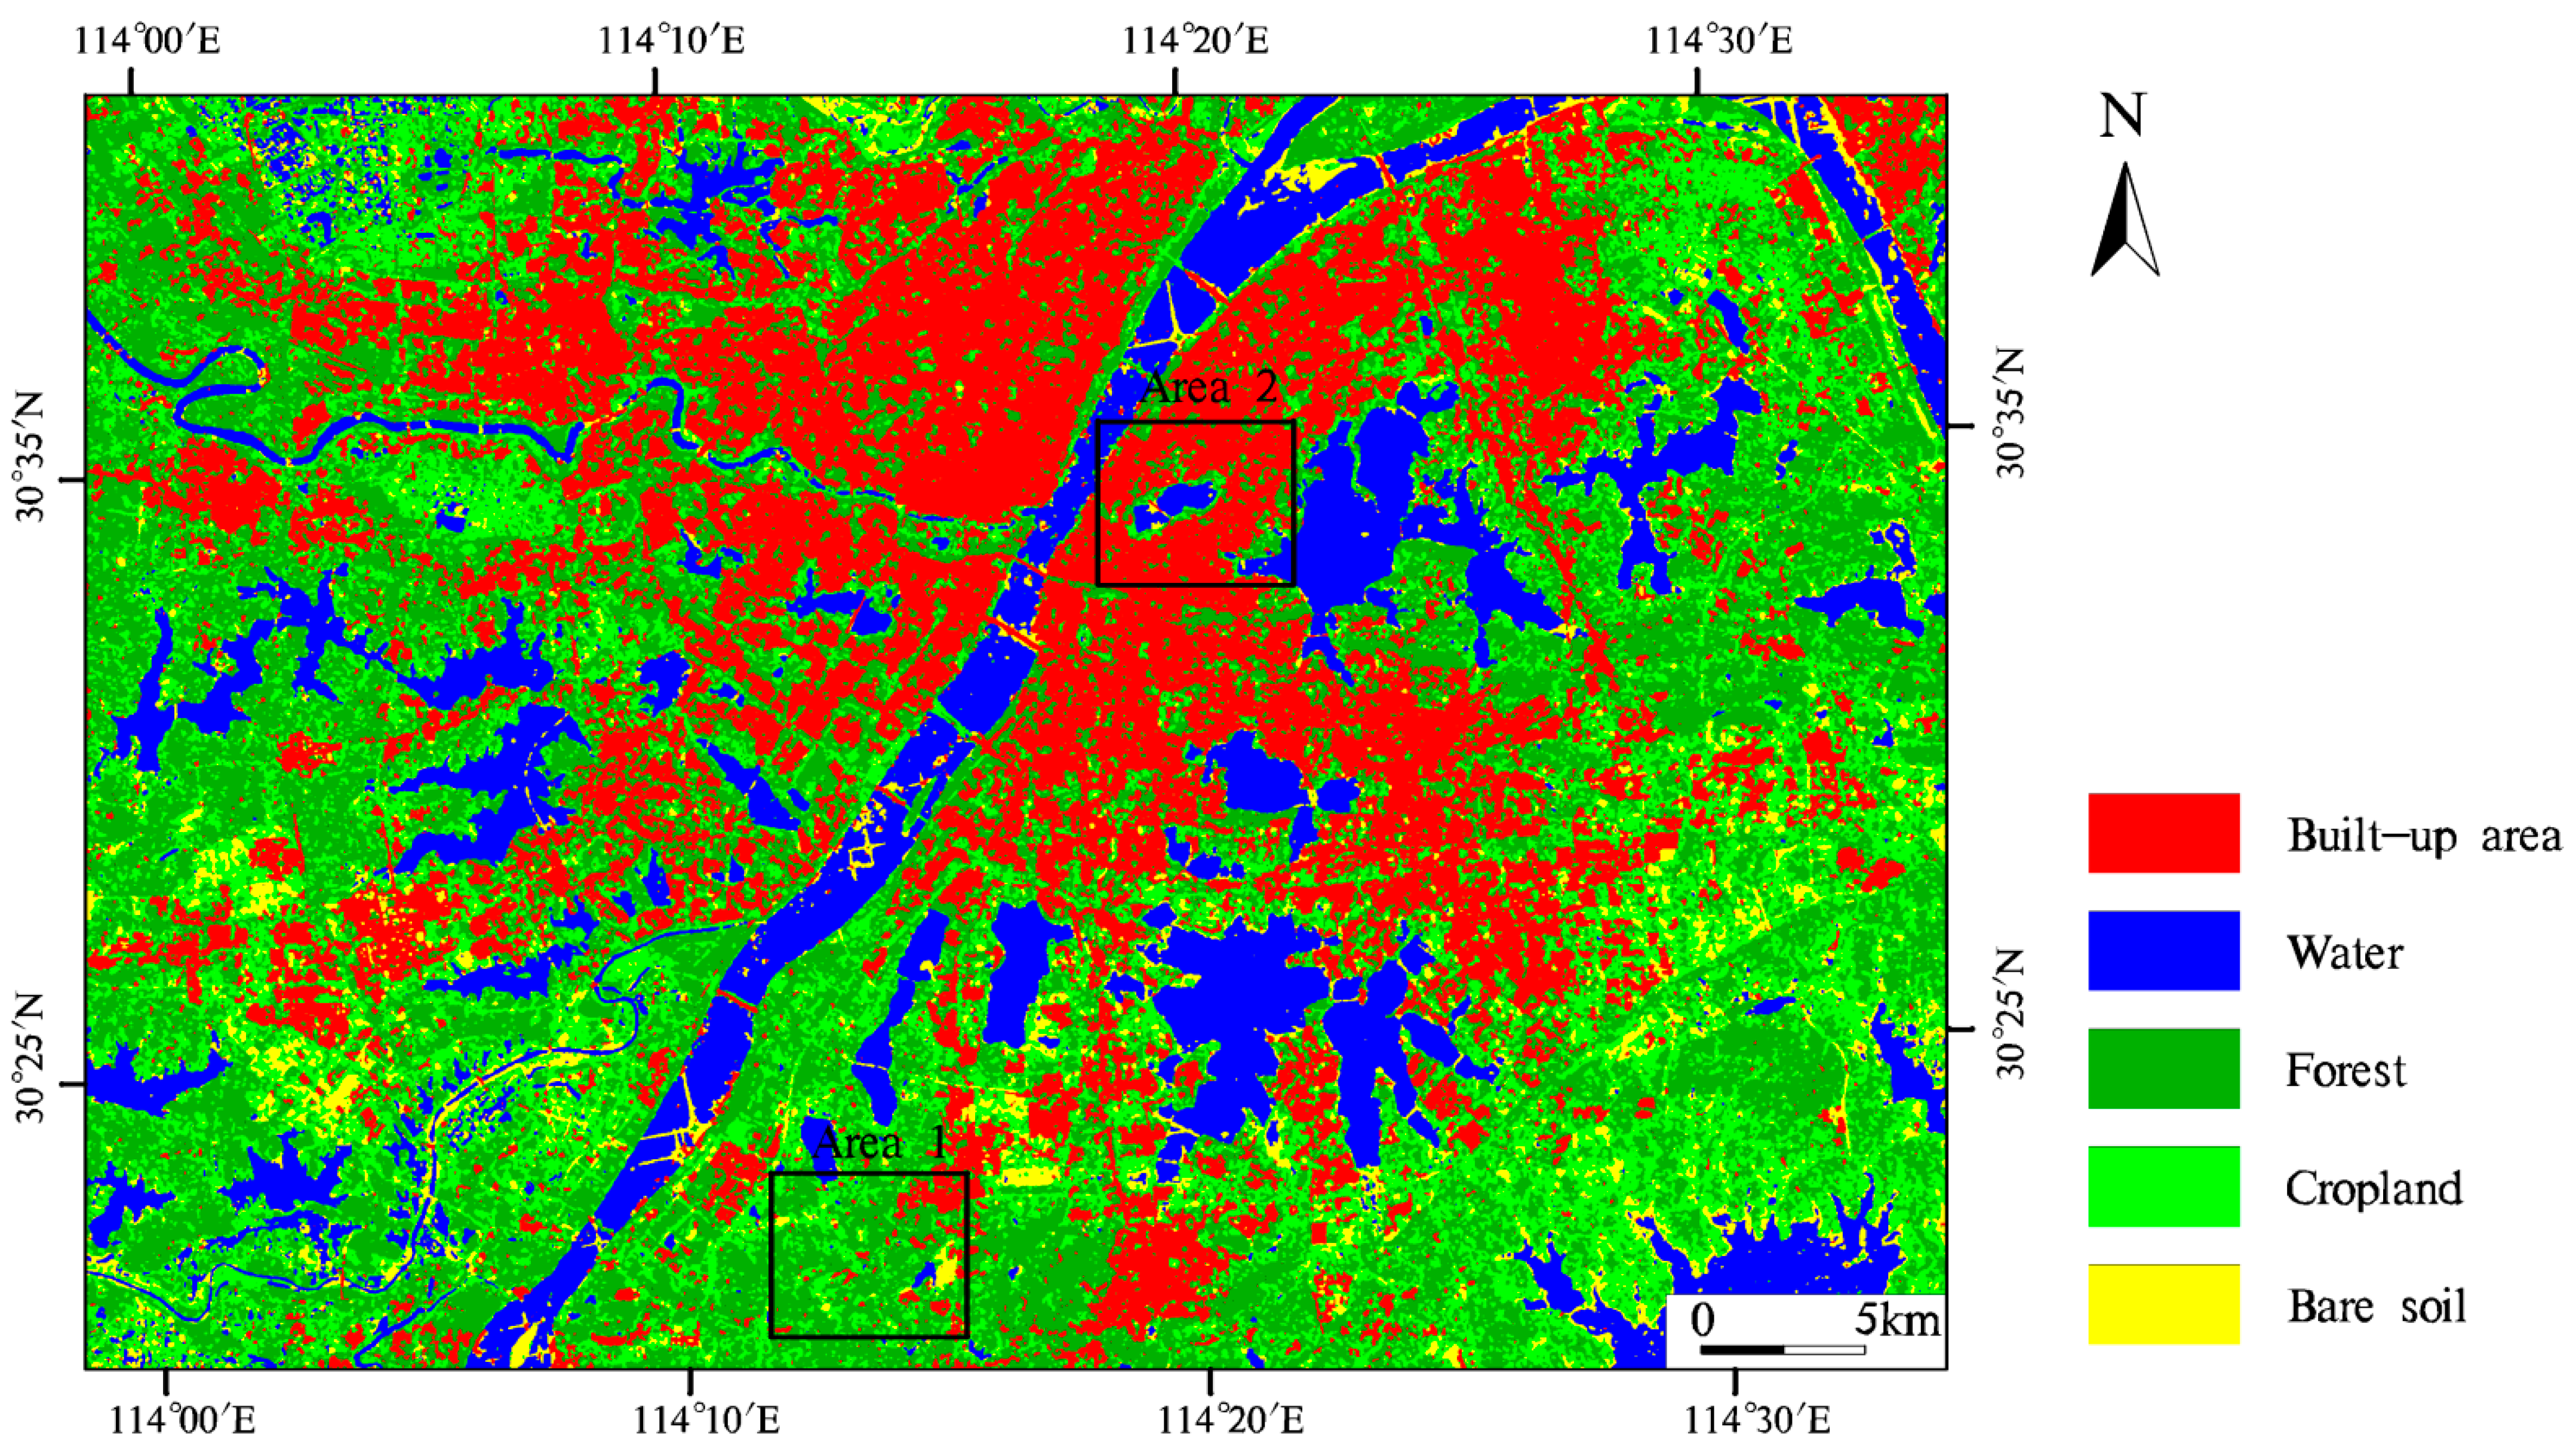
4.1. Classification with Sentinel-2B MSI Data

The SVM-CK algorithm is used to process the Sentinel-2B MSI data. The classification using the SVM-CK algorithm achieves an OA of 91.54% with a KA of 0.88 (Table 2). The highest PA is acquired for the built-up area (97.29%), followed by water (93.42%), bare soil (90.91%), forest (82.53%), and cropland (81.91%). The producer’s accuracies for the built-up area, water, and bare soil are considerably high. The PA for the built-up area is 97.29% (18 pixels of the built-up area are misclassified as water, and 2 pixels of the built-up area are misclassified as forest) (Table 2). The UA is highest for bare soil (100%), followed by built-up area (95.22%), water (92.65%), forest (85.77%), and cropland (76.17%). The user’s accuracies for bare soil, built-up area, and water are considerably high. The UA for water is 92.65% because 18 pixels of the built-up area are wrongly classified as water (Table 2). The F-score is highest for built-up area (96.24%), followed by bare soil (95.24%), water (93.03%), forest (84.12%), and cropland (78.93%). The confusion between the built-up area and water is apparent when only the Sentinel-2B MSI data are used. A majority filter is applied to process the land cover classification (Figure 4).

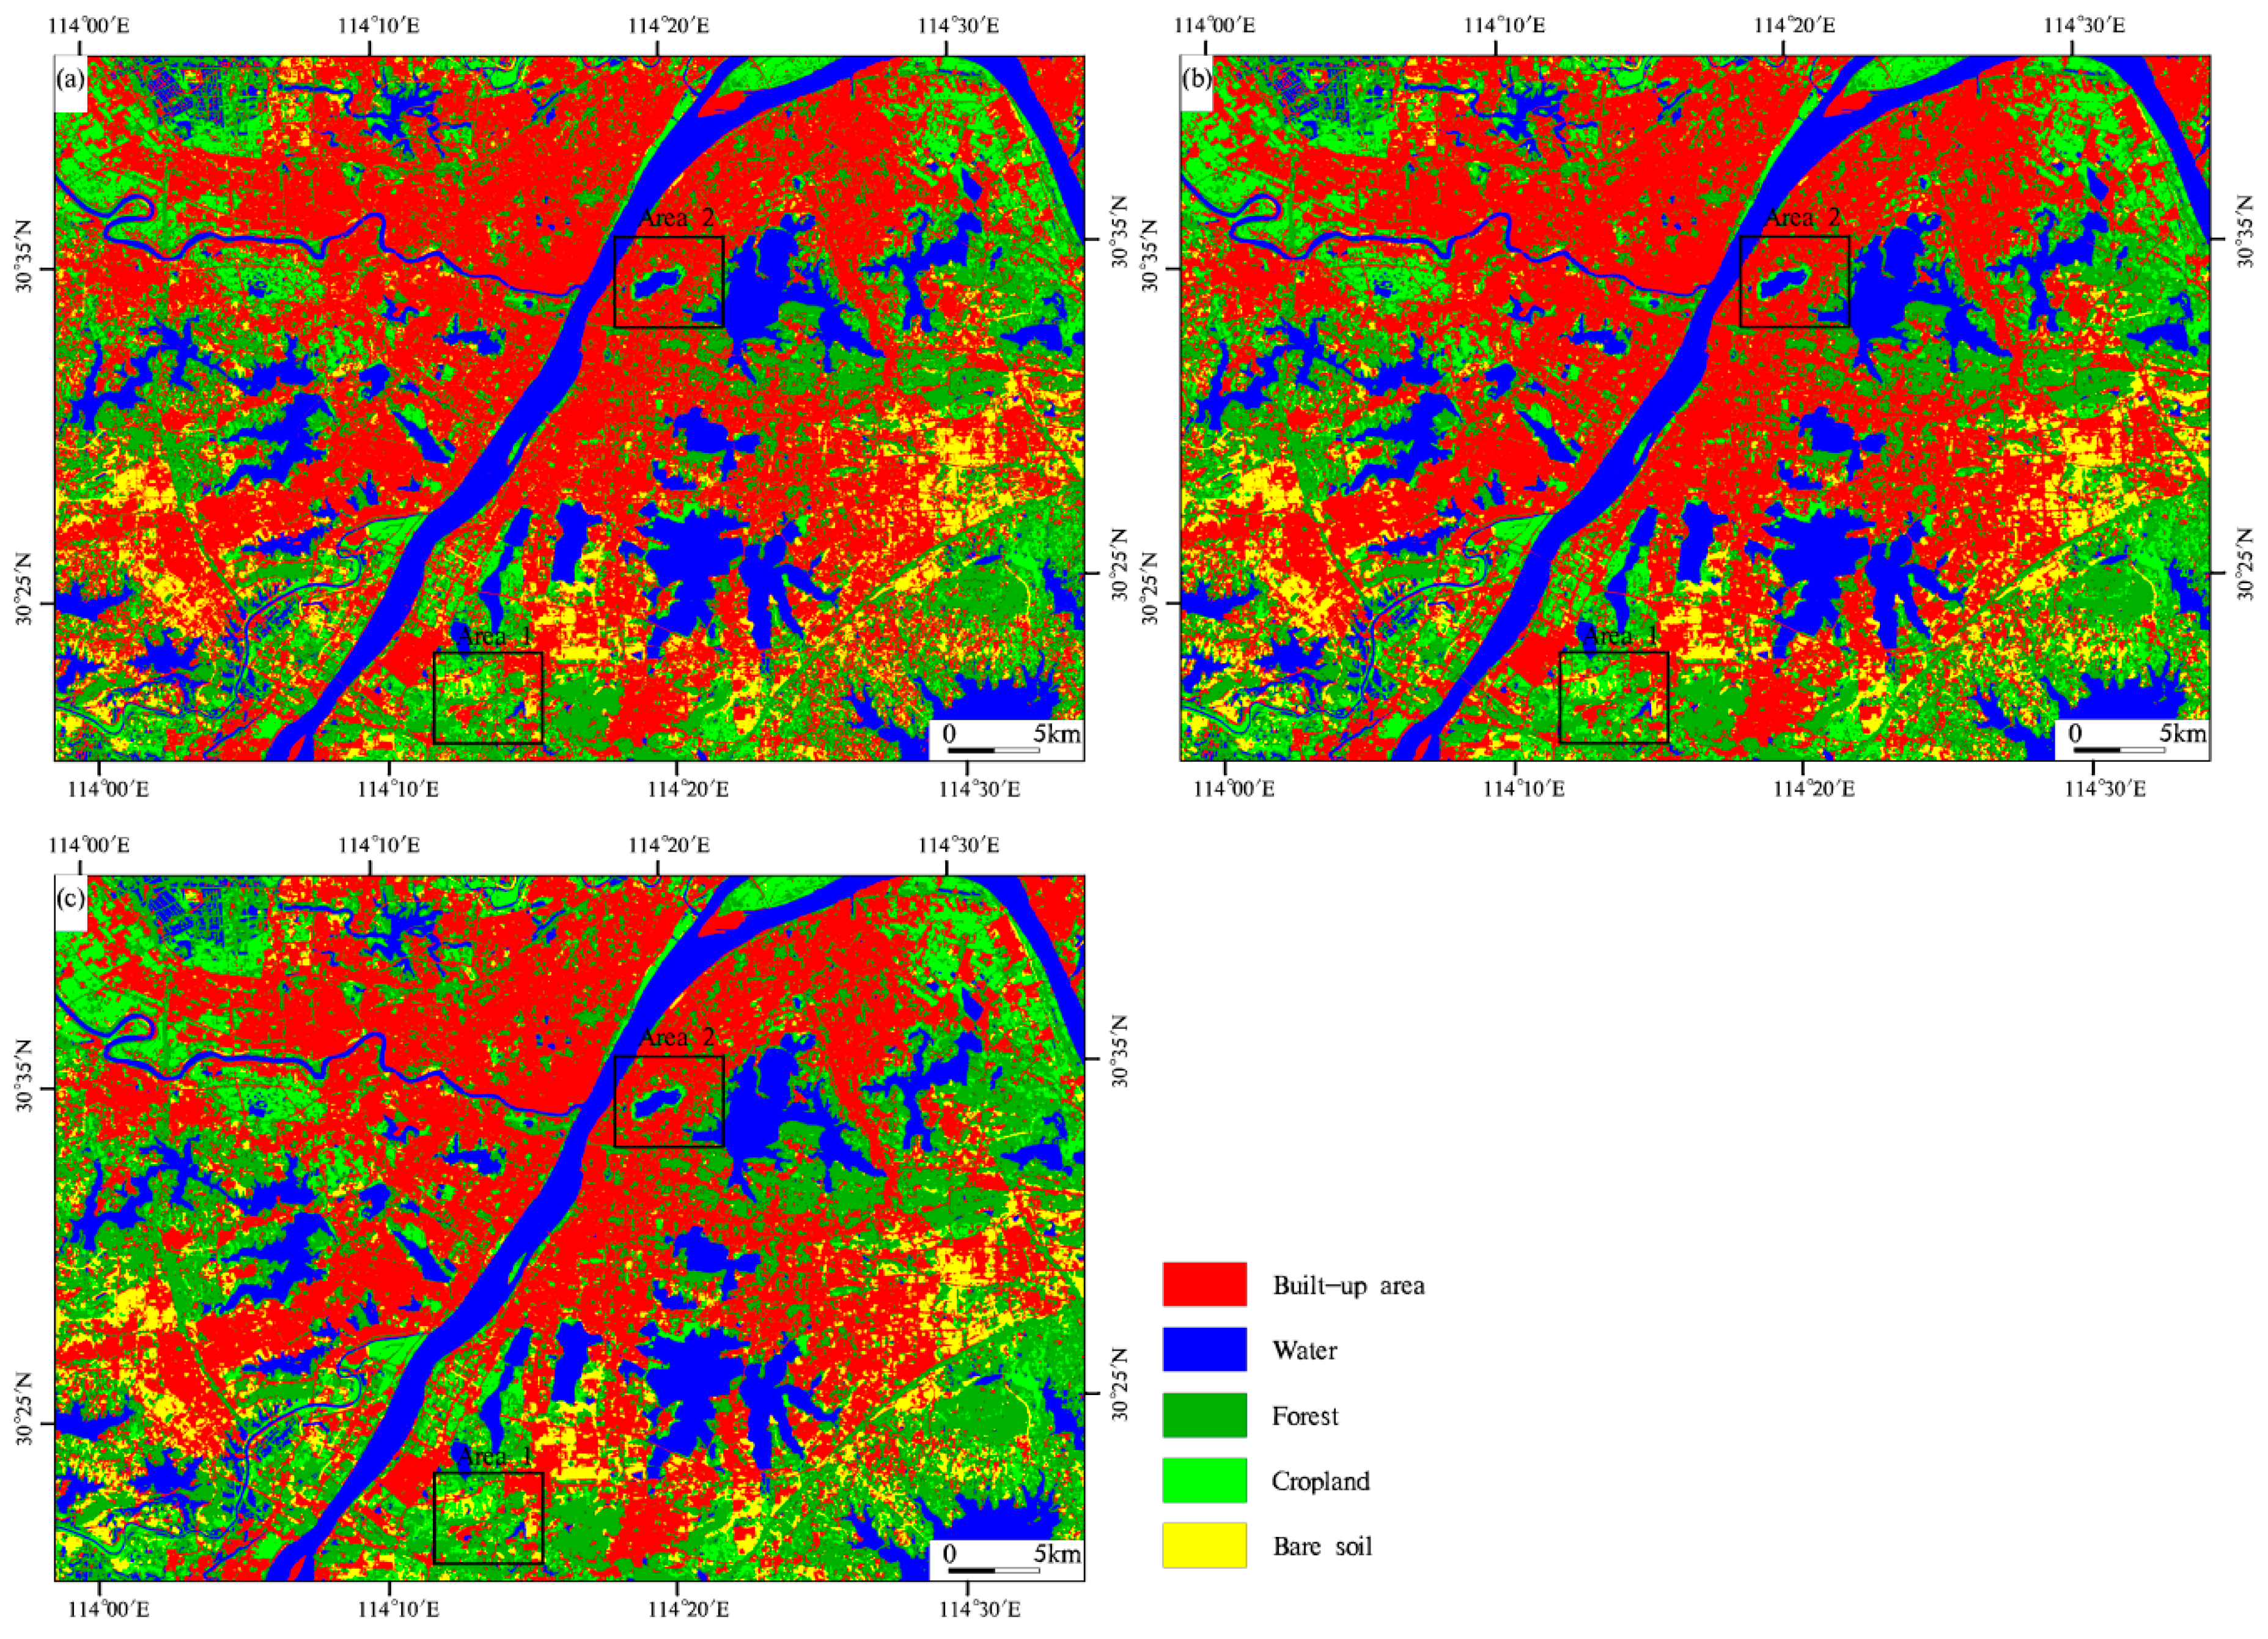
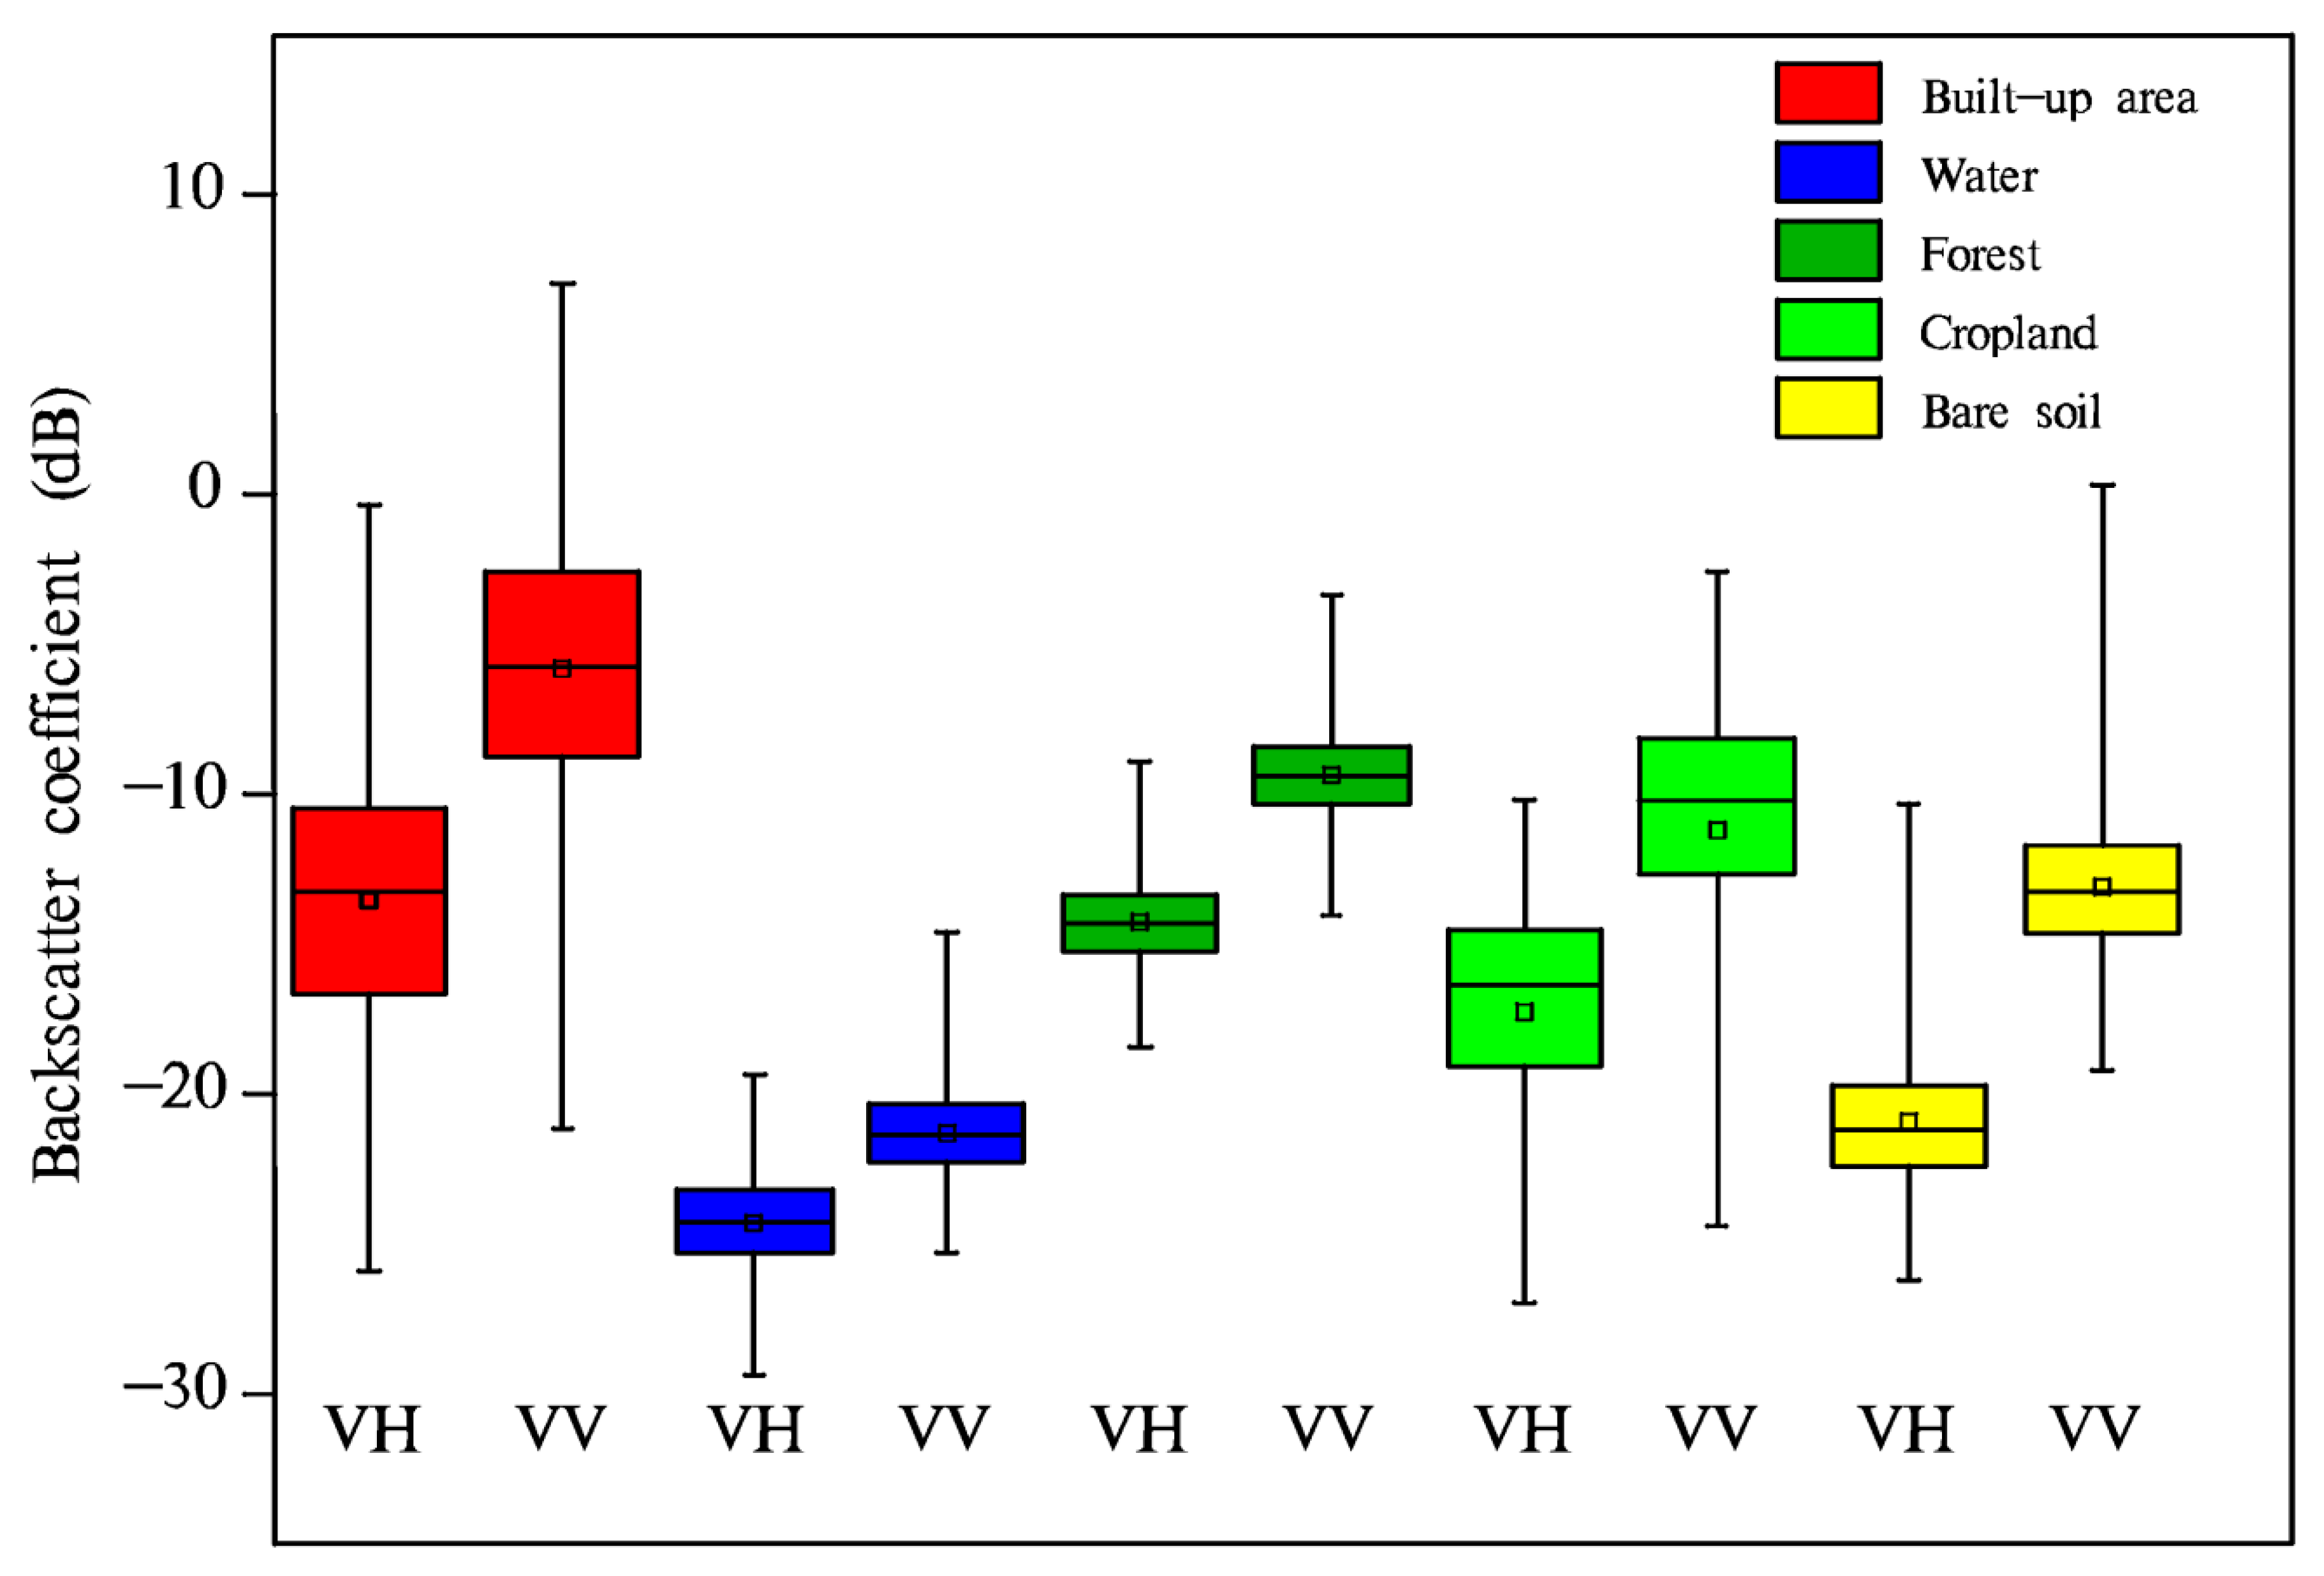
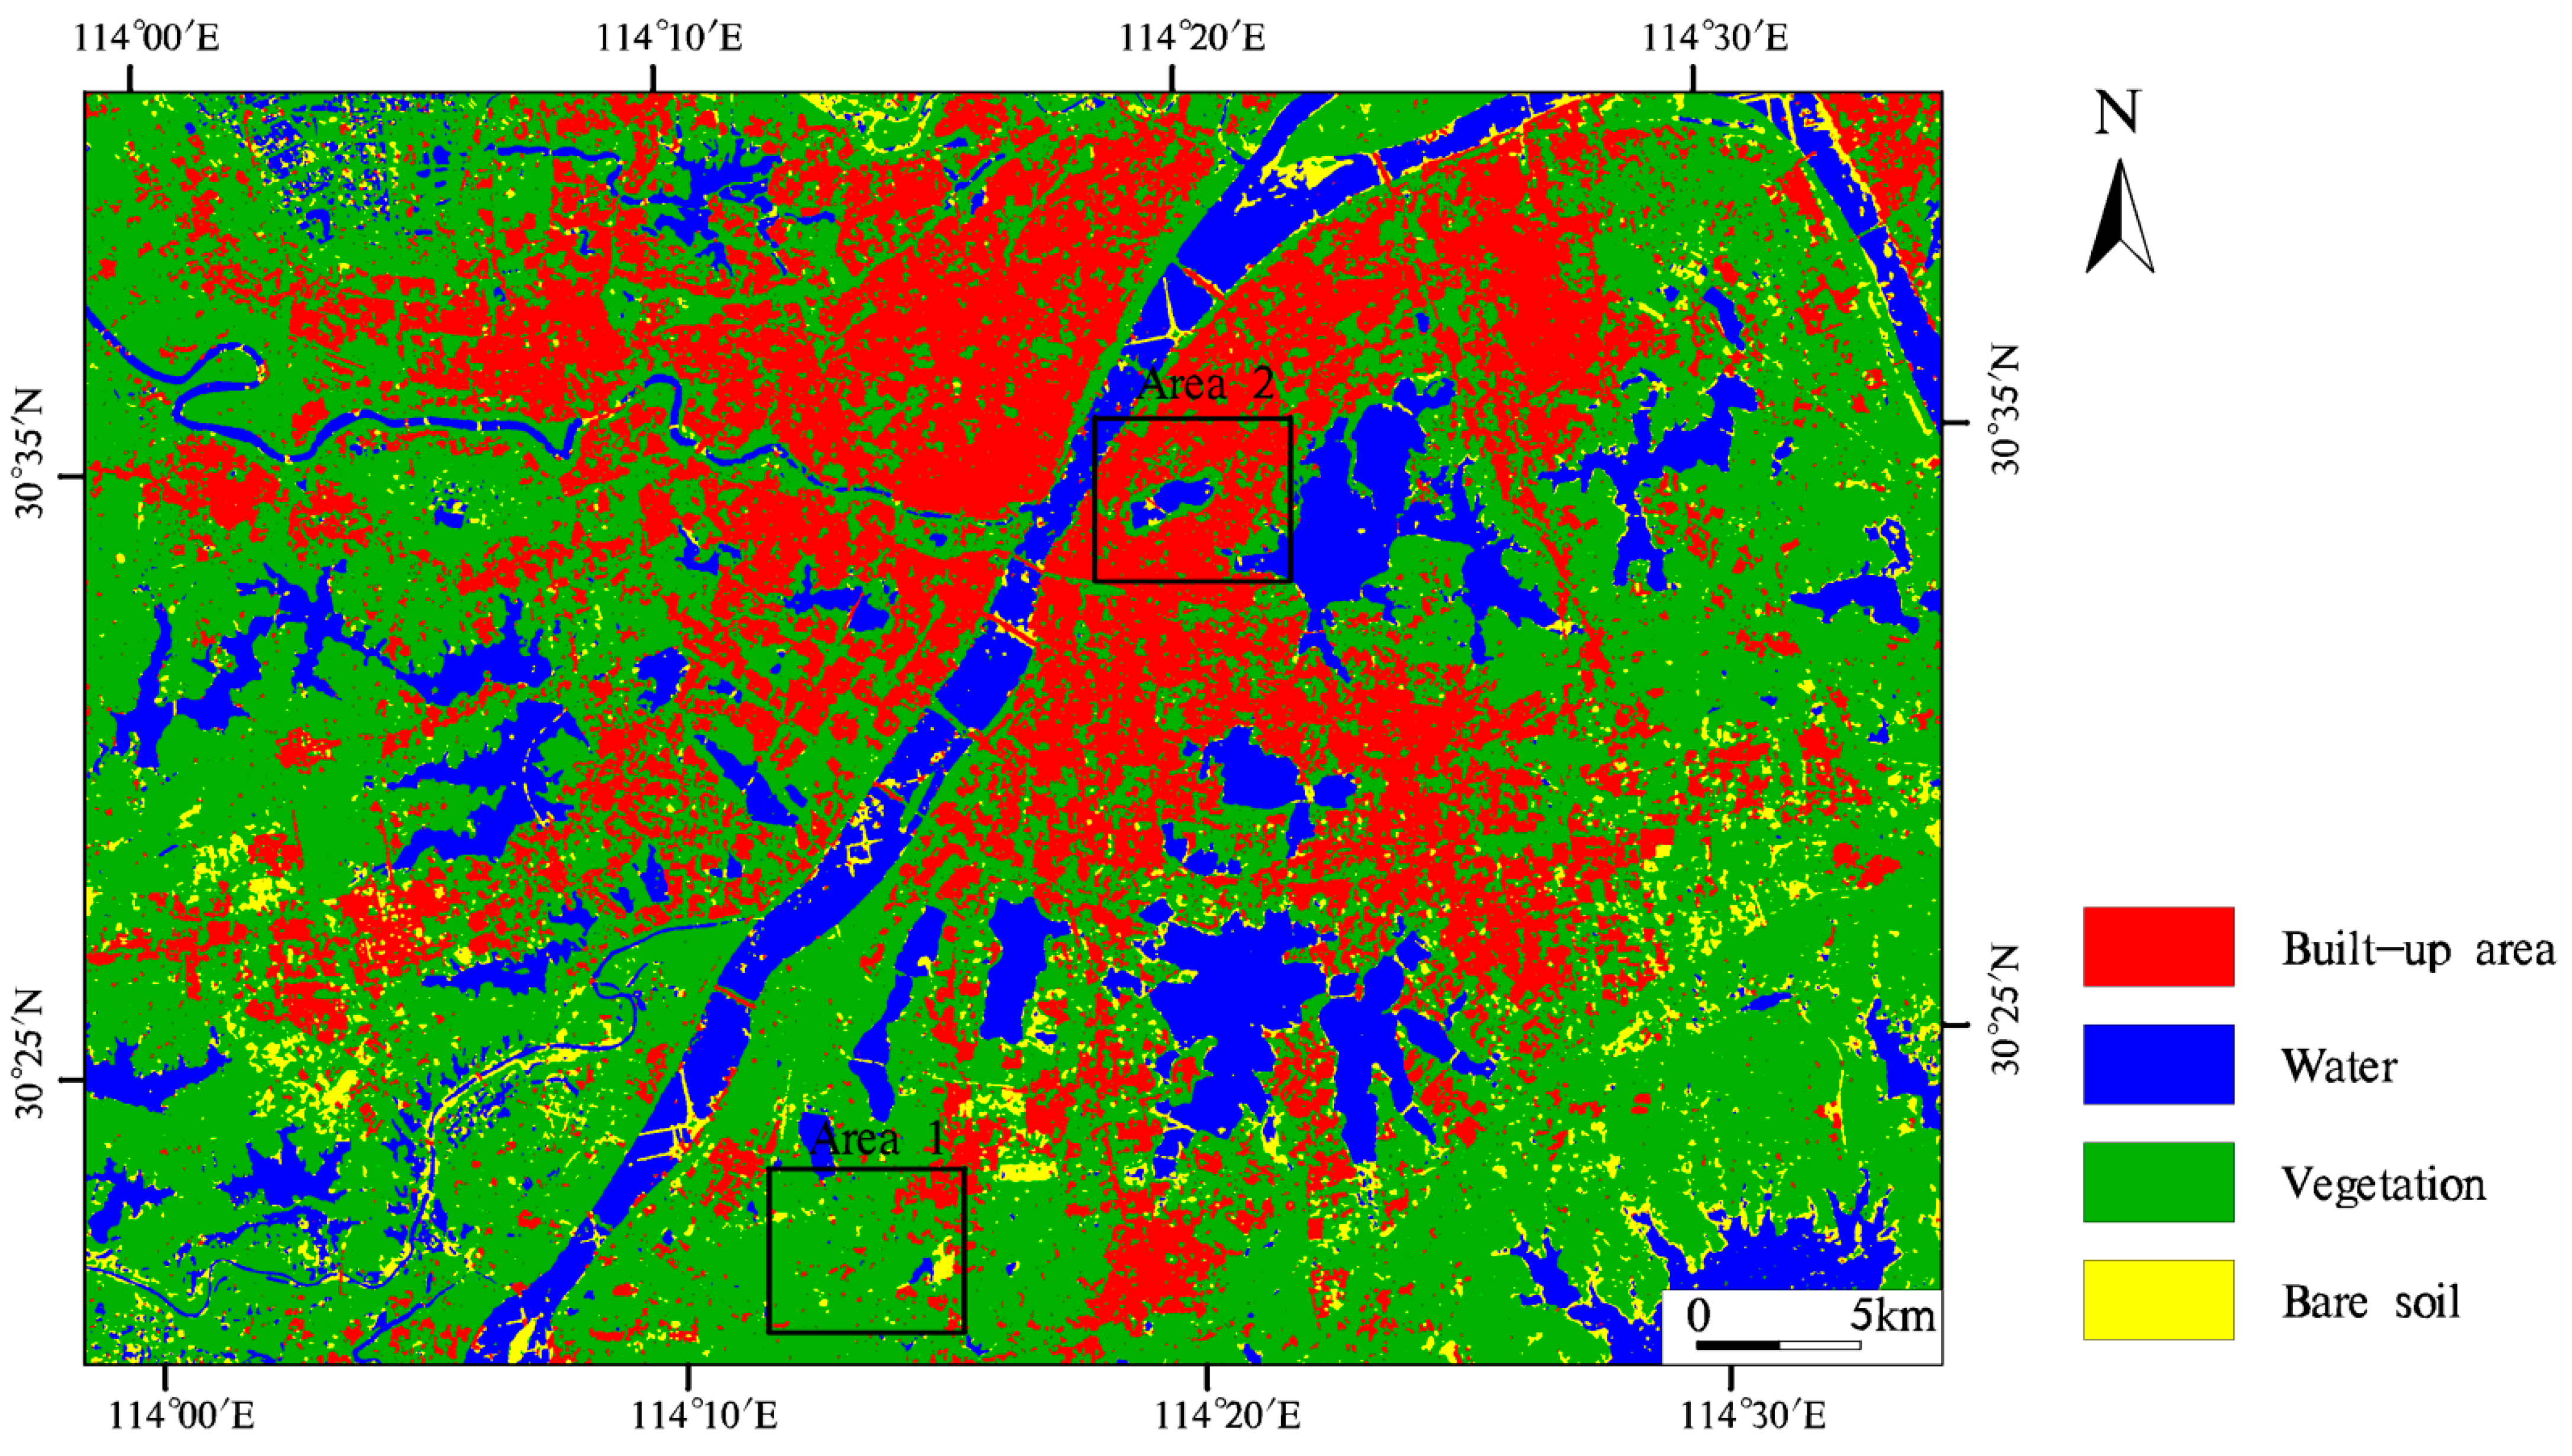
4.2. Classification with Sentinel-1A SAR Data

The SVM-CK algorithm is also used to process the Sentinel-1A SAR data. The classification using the Sentinel-1A SAR image achieves an OA of 73.09% with a KA of 0.64 (Table 3). Among the five land cover types, the largest area is covered by built-up area (29.19%), followed by forest (29.18%), cropland (22.17%), water (14.08%), and bare soil (5.38%). A noticeable underestimation of the built-up area, water, and bare soil is observed when using the Sentinel-1A SAR image alone. The above results indicate that Sentinel-1A SAR data distinguish land cover types with lower accuracy than Sentinel-2B MSI data with the same spatial resolution. The highest PA is acquired for water (91.77%), followed by forest (89.73%), bare soil (76.45%), built-up area (74.36%), and cropland (17.09%). The producer’s accuracies for water, forest, and bare soil are relatively high. The PA for the built-up area is 74.36% because 4 pixels of the built-up area are classified as water, 92 pixels of the built-up area are classified as forest, 62 pixels of the built-up area are classified as cropland, and 31 pixels of the built-up area are classified as bare soil (Table 3). The PA for cropland is less than 25%, suggesting a large omission error. The UA is highest for water (94.49%), followed by the built-up area (90.58%), bare soil (76.45%), forest (53.91%), and cropland (23.61%). The UA for water is 94.49% because 4 pixels of built-up area and 9 pixels of cropland are wrongly classified as water (Table 3). The user’s accuracies for forest and cropland are less than 60%, showing a large commission error for these two land cover categories. The producer’s and user’s accuracies for the built-up area, water, and bare soil are higher than 70% (Table 3). The F-score is highest for water (93.11%), followed by built-up area (81.67%), bare soil (76.45%), forest (67.35%), and cropland (19.83%). A majority filter is applied to process the land cover classification (Figure 5).

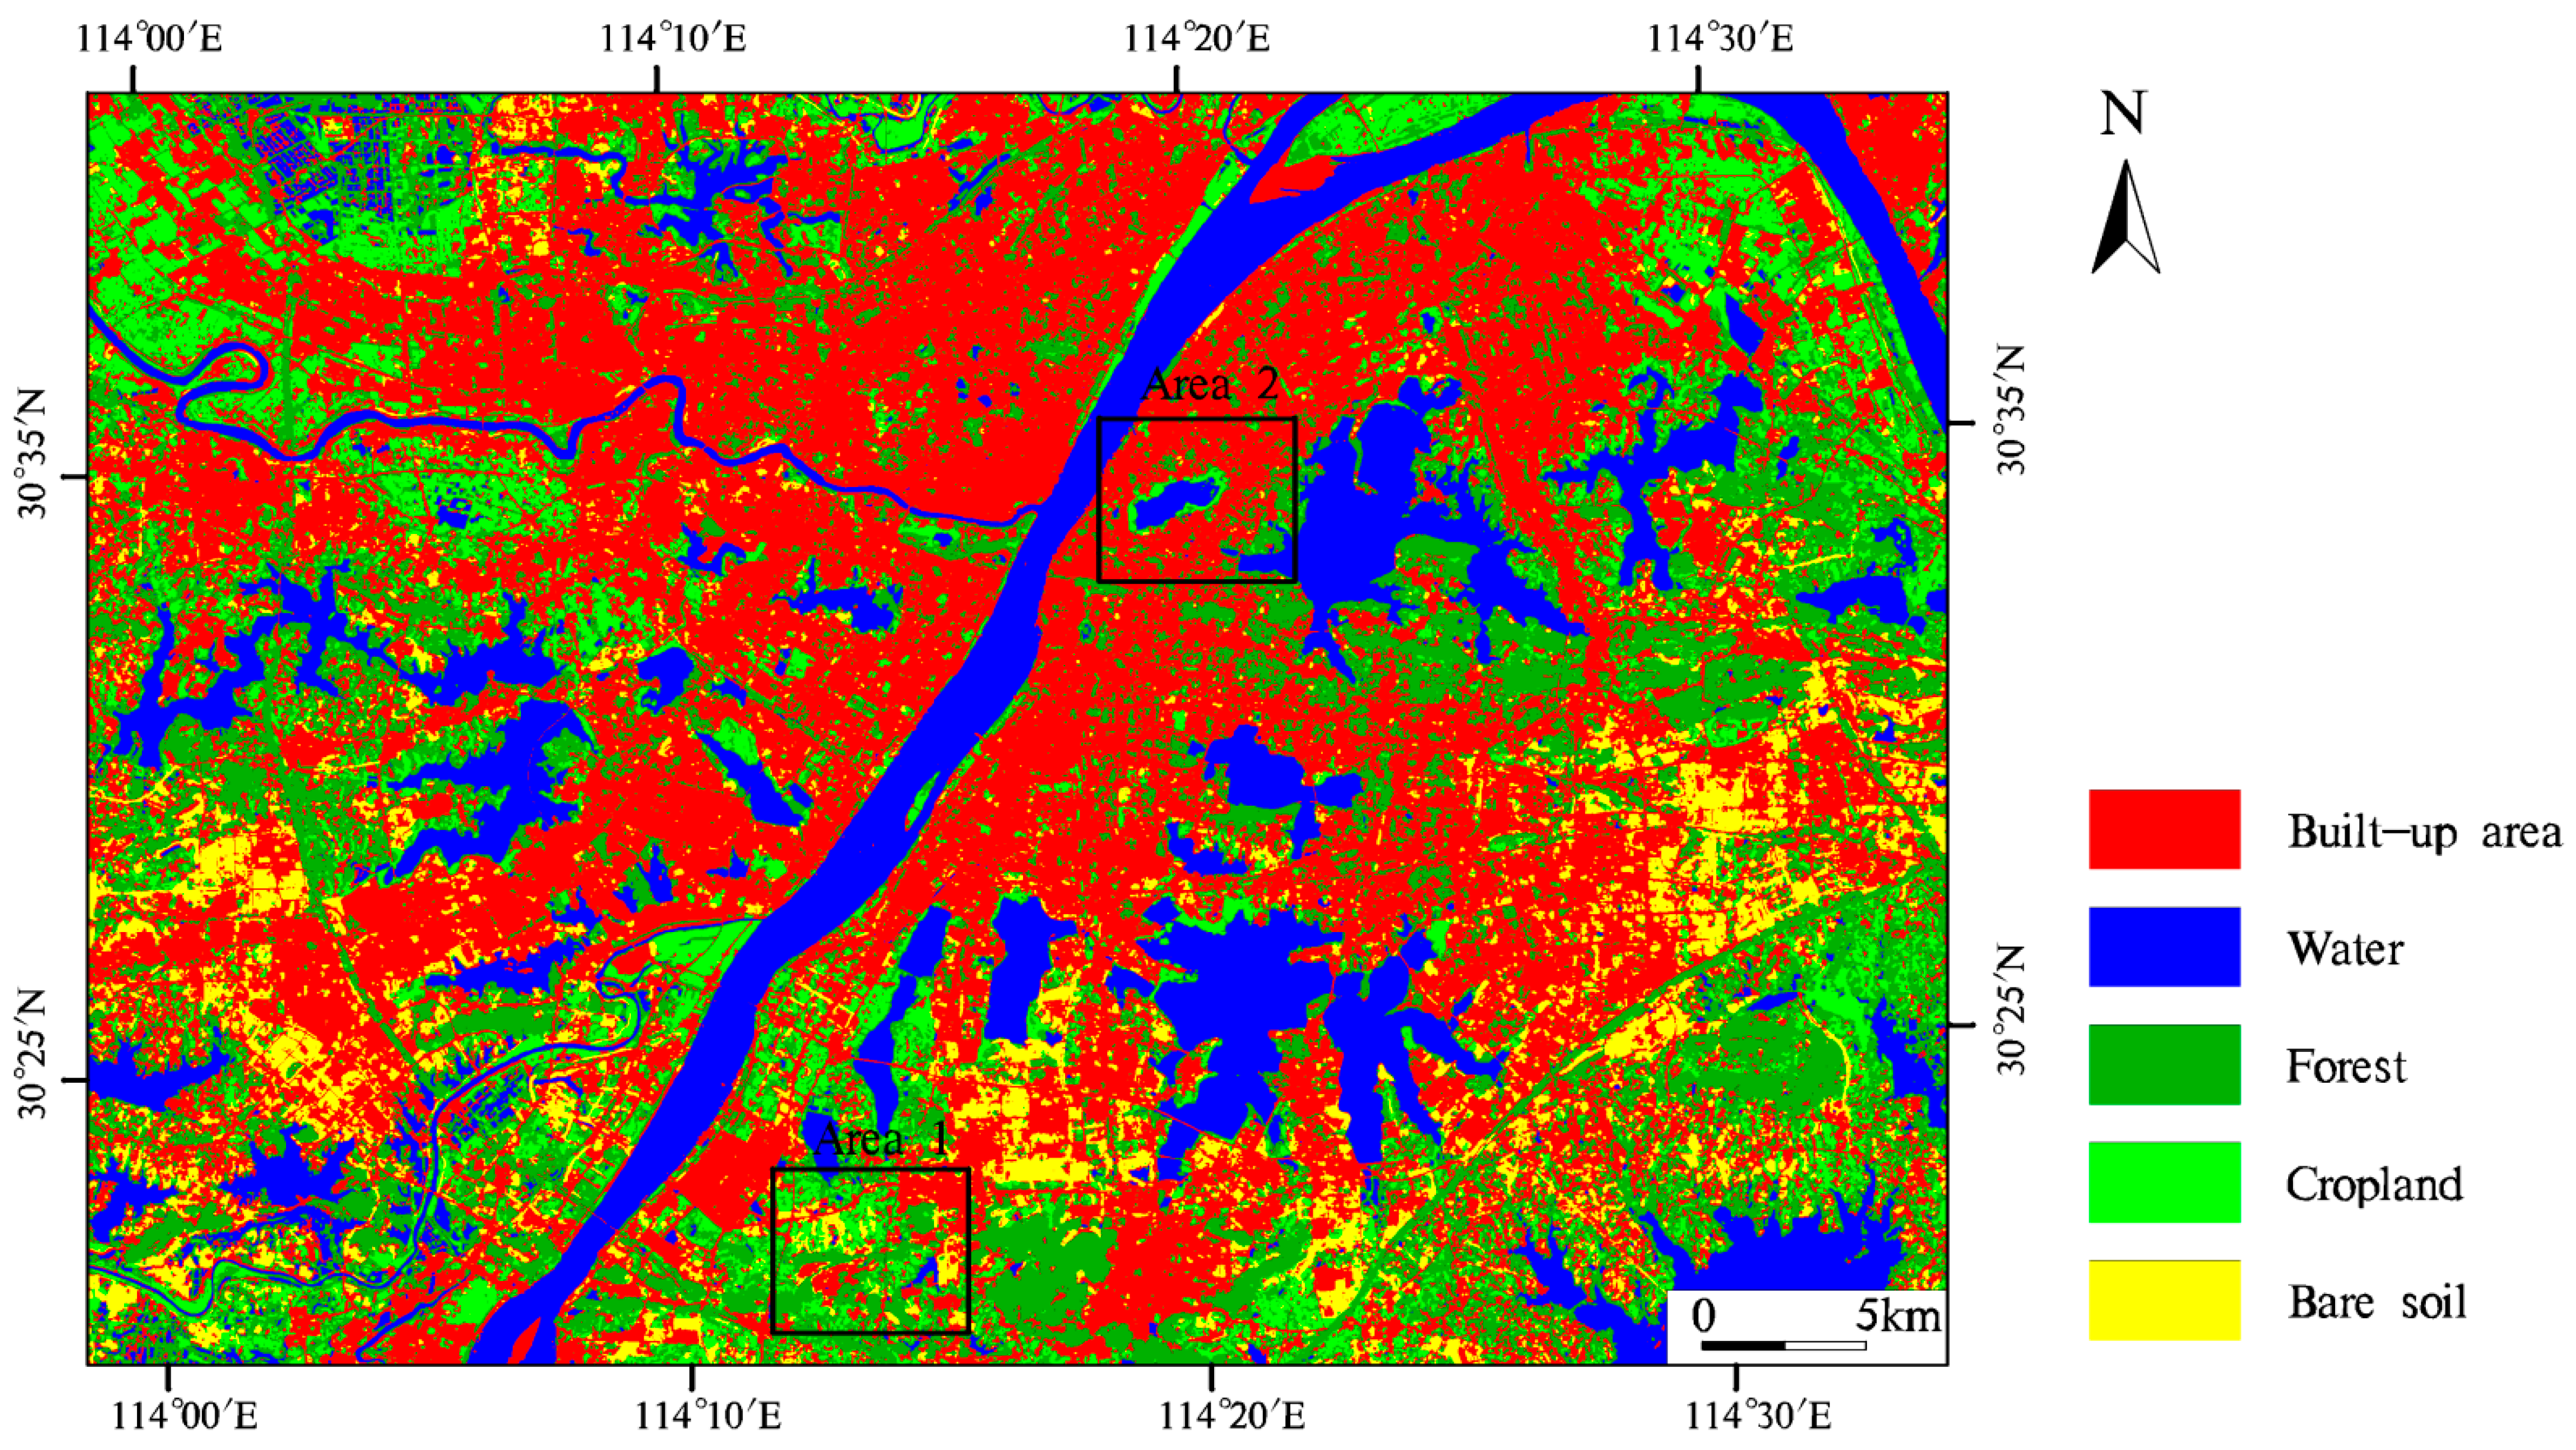
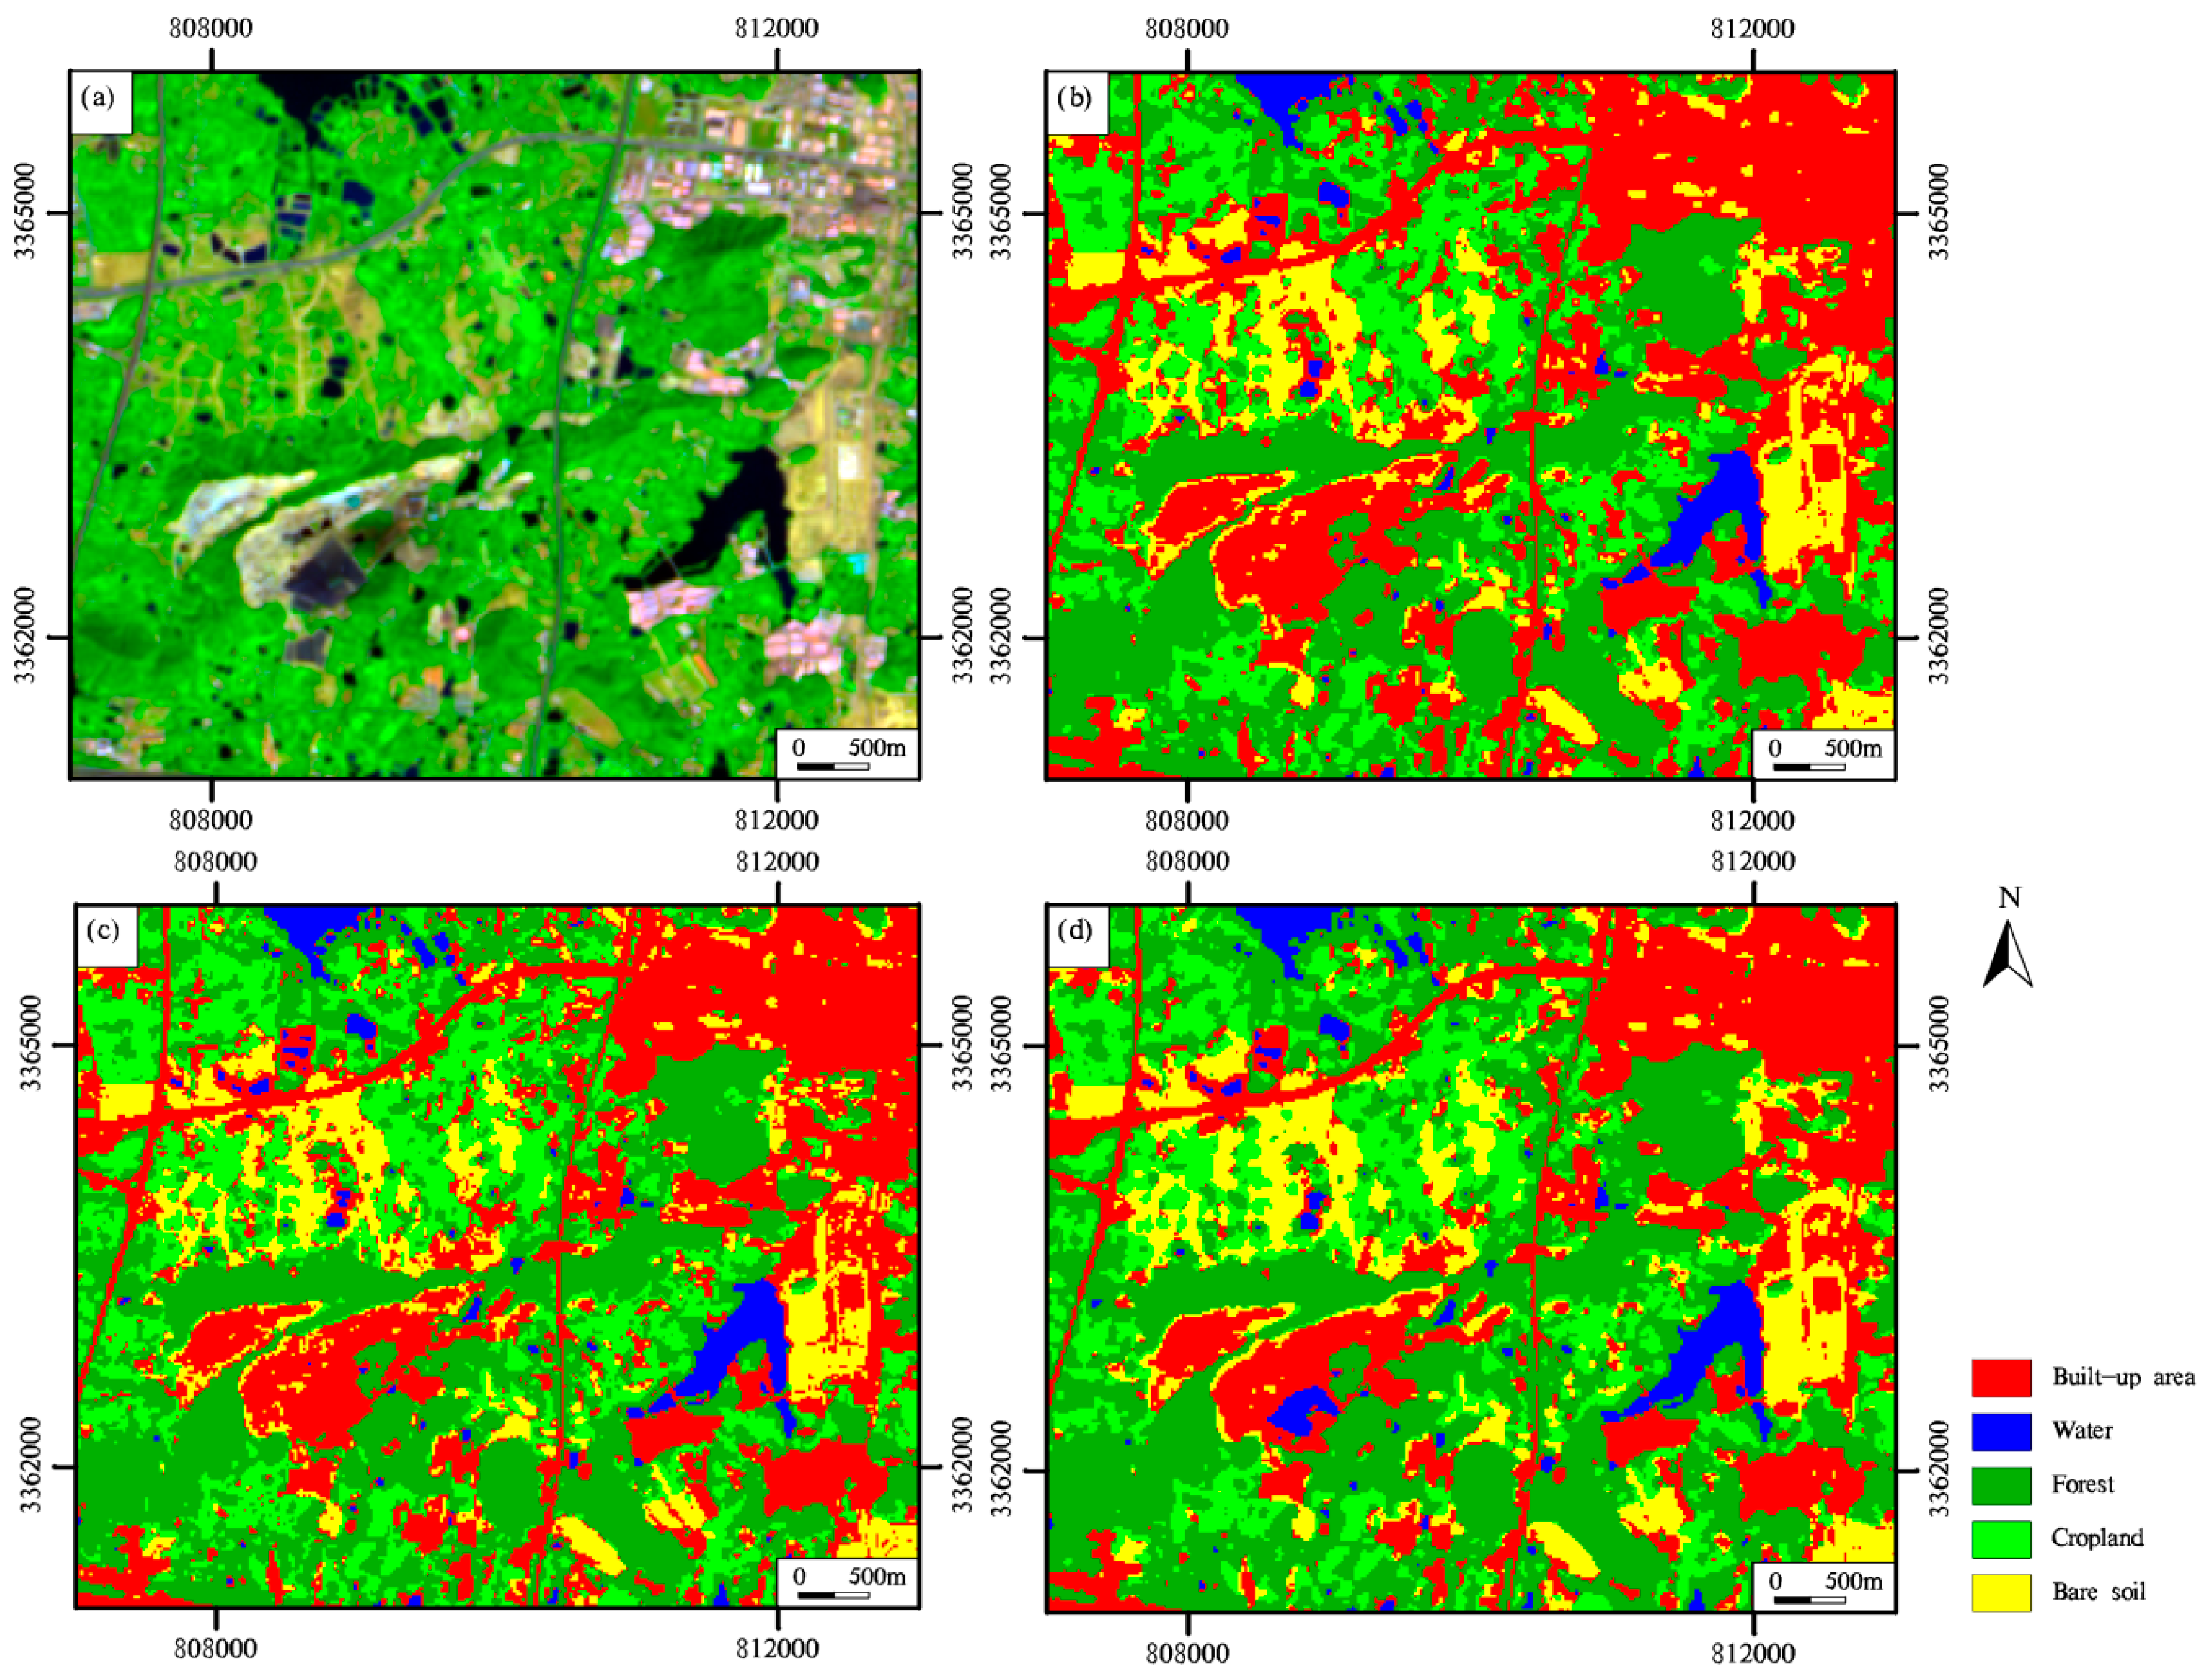
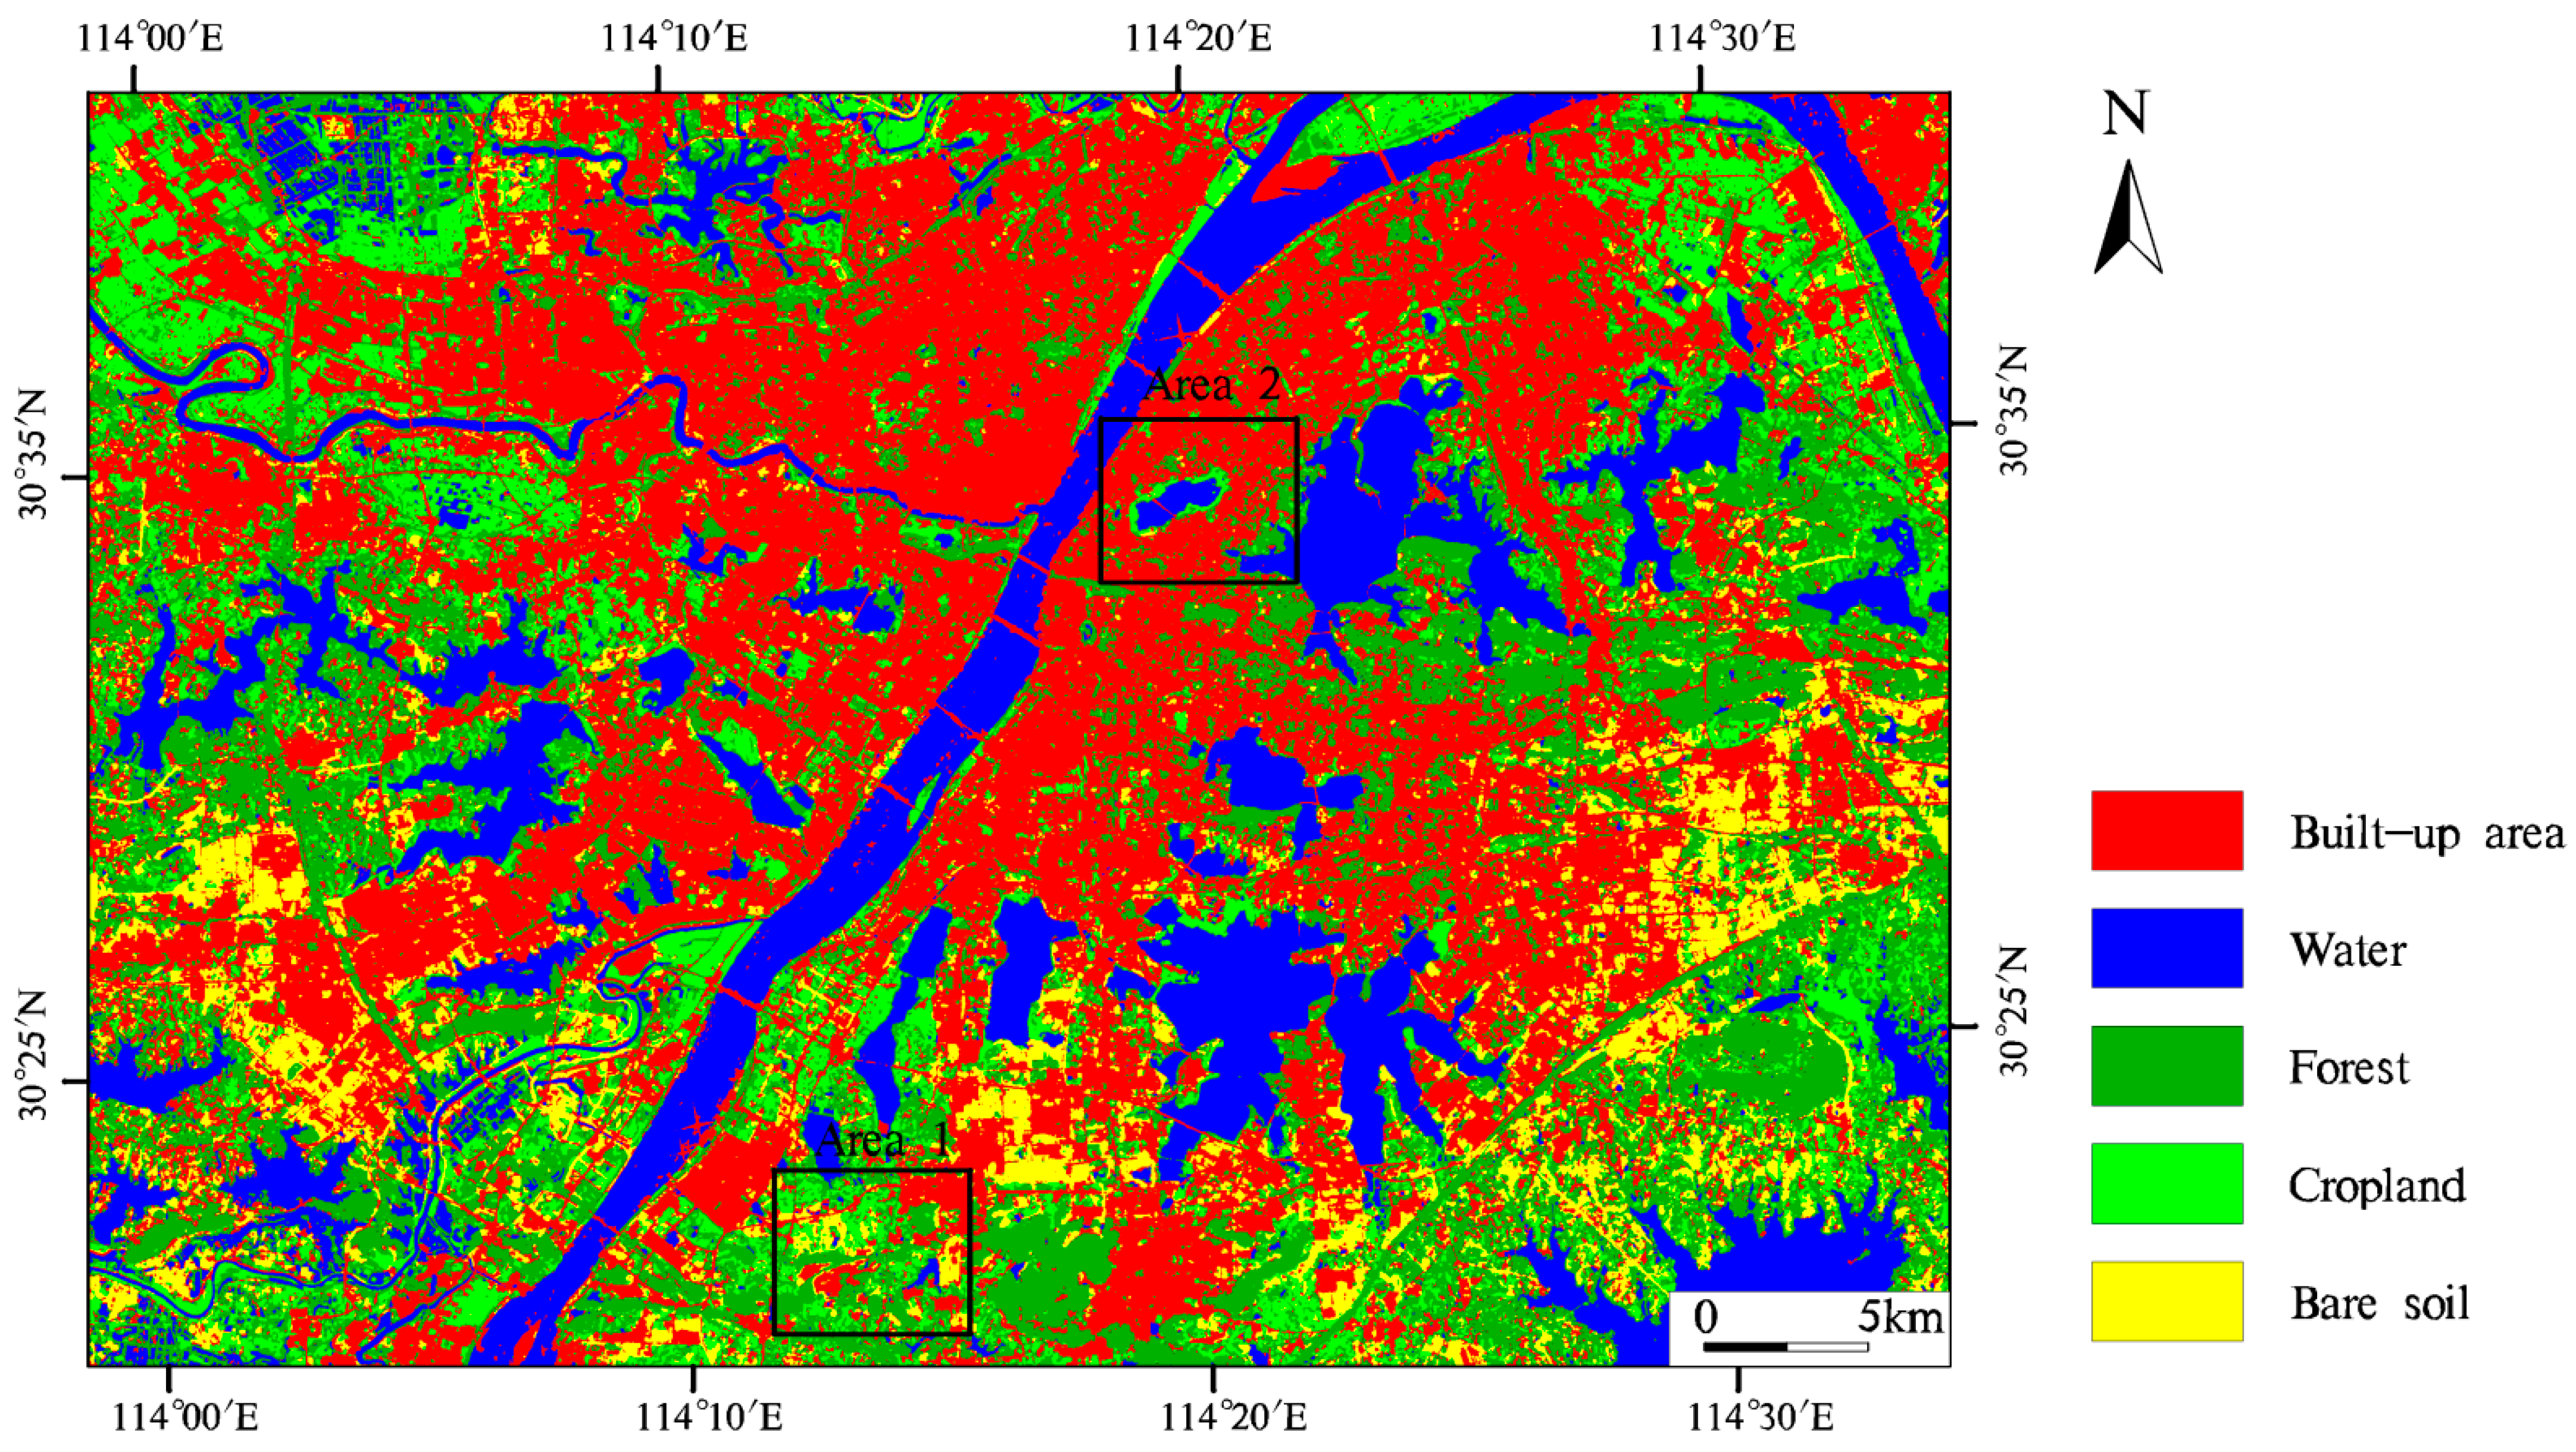
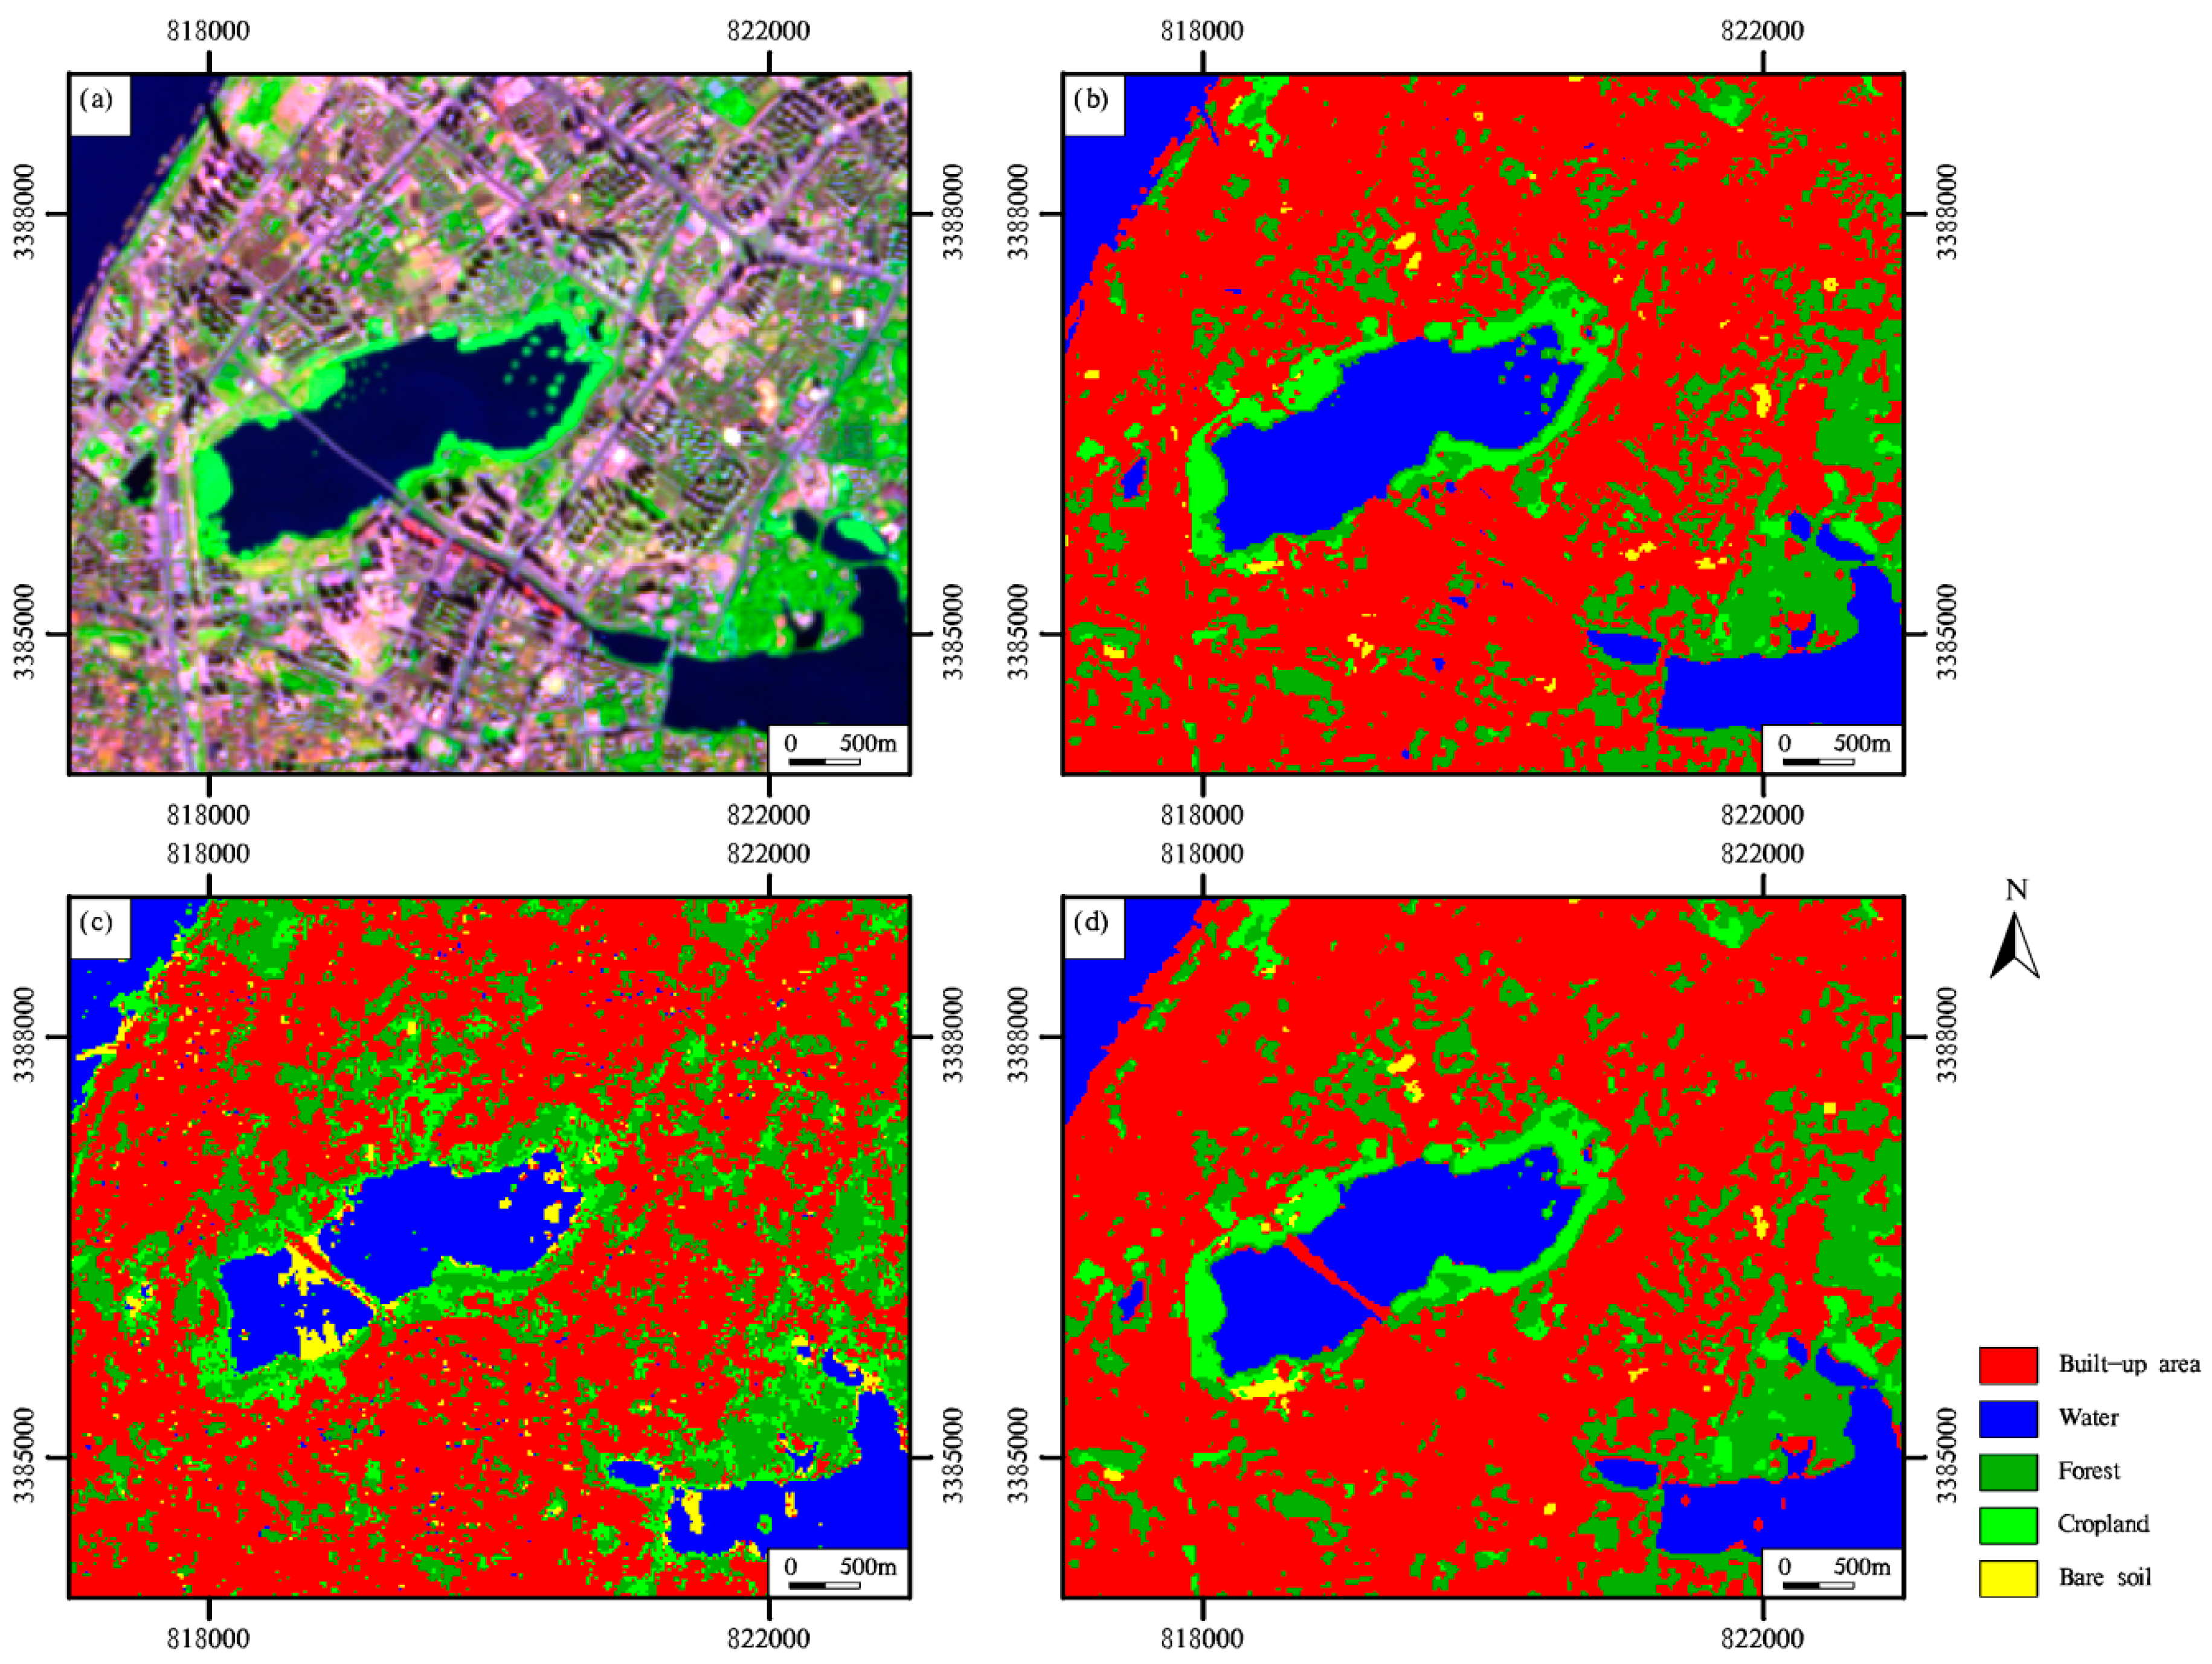
4.3. Classification with the Combination of Sentinel-2B MSI and Sentinel-1A SAR Data

Sentinel-2B MSI and Sentinel-1A SAR data are fused to improve land cover classification at the pixel level. The fusion of Sentinel-2B MSI and Sentinel-1A SAR data is achieved via the layer-stacking method. The Sentinel-1A SAR data are combined as two bands to the Sentinel-2B MSI data; an 11-dimensional dataset is obtained. The SVM-CK technique is also employed to process the combination of Sentinel-2B MSI and Sentinel-1A SAR data. The classification utilizing the SVM-CK algorithm yields an OA of 92.12% with a KA of 0.89 (Table 4). The above results suggest that the inclusion of Sentinel-1A data to Sentinel-2B data can increase the OA of the classification. The highest PA is acquired for the built-up area (99.73%), followed by water (98.77%), bare soil (90.08%), cropland (79.90%), and forest (77.40%). The highest UA is obtained for water (100%) and bare soil (100%), followed by built-up area (96.33%), forest (84.33%), and cropland (70.98%). The F-score is highest for water (99.38%), followed by built-up area (98%), bare soil (94.78%), forest (80.71%), and cropland (75.18%). Among the five land cover types, the largest area is covered by built-up area (43.55%), followed by forest (21.98%), water (16.41%), cropland (11.34%), and bare soil (6.72%). A majority filter is applied to process the land cover classification (Figure 6).

5. Discussion

5.1. Comparison of the Classifications Using Different Machine Learning Algorithms

The performance of the SVM-CK approach is evaluated by comparing it with the SVM and KELM-CK approaches (Figure 7) [50,51]. Three different algorithms, including SVM-CK, SVM, and KELM-CK, are applied to the Sentinel-2B MSI data. The classification based on the SVM-CK algorithm obtains the highest OA (91.54%), followed by SVM (90.43%) and KELM-CK (88.09%) algorithms (Table 5). Additionally, the McNemar test indicates that the difference between classifications using the SVM-CK and SVM algorithms is statistically significant (p < 0.05, Z = 2.22). Moreover, there is a statistically significant difference (p < 0.05, Z = 4) between the classifications using the SVM and KELM-CK algorithms. The above results indicate that the SVM-CK is more accurate than the SVM and KELM-CK in terms of land cover mapping. When using the KELM-CK algorithm, 78 pixels of the built-up area are classified as water, and 14 pixels of the built-up area are classified as forest. As a result, the PA for the built-up area is 87.52% when the KELM-CK algorithm is used (Table 5). In comparison, when using the SVM-CK algorithm, 18 pixels of the built-up area are classified as water, and 2 pixels of the built-up area are classified as forest. Therefore, the PA for the built-up area is 97.29% when the SVM-CK algorithm is used (Table 5). The results prove that it is challenging to distinguish the built-up area from water when using the Sentinel-2B MSI image alone. The influence of the three different algorithms is evaluated by a comparative experiment in Area 1 (see Figure 2). The MSI false-color composite image (band 12, 8a, 2 in RGB) of Area 1 is shown in Figure 8a. The classification results using the SVM-CK and SVM algorithms present good differentiation between the built-up area and water (Figure 8b,c). However, some pixels of dark impervious surface are incorrectly classified as water when using the KELM-CK algorithm (Figure 8d). This confusion is caused by the spectral similarity between dark impervious surface and water. The classification utilizing the KELM-CK algorithm shows more errors of commission when classifying water. The mean texture of the Sentinel-2B bands can improve the OA of classification by reducing the heterogeneity of the same land cover type. Compared with the SVM-CK classification, the classification based on the SVM algorithm contains more speckles (Figure 8b,c).

5.2. Comparison of the Classifications with Different Remote Sensing Data

The classification implemented on the Sentinel-1A SAR image shows that the Sentinel-1A SAR data can distinguish the built-up area, water, and bare soil. The backscatter coefficient (σ0) values of different land cover categories are affected by many factors. Microwave is sensitive to surface roughness, which contributes to identifying land cover types [52,53]. For both VV and VH polarizations, the built-up area has the highest mean σ0 value while the water body has the lowest mean σ0 value. Compared with the VV polarization, weaker backscatter is observed for the five land cover categories at VH polarization (Figure 9). The above results suggest that SAR data provide complementary information to better distinguish the built-up area, water, and bare soil. The F-scores for forest and cropland are 67.35% and 19.83%, indicating that Sentinel-1A SAR data are inefficient for discriminating forest and cropland. The results show that the backscattering information of forest and cropland is similar. When using only Sentinel-1A SAR data, forest is easily confused with cropland (Table 3). The value of transformed divergence is 0.77 (less than 1), suggesting that these two categories can be combined. The classification achieves an OA of 81.38% with a KA of 0.74 when forest and cropland are combined as vegetation (Figure 10). The PA and UA for vegetation are 89.21% and 69.52%, respectively. The F-score for vegetation is 78.14%, showing that Sentinel-1A SAR data have efficient performance in discriminating the vegetation category. The above results reveal the potential of Sentinel-1A SAR data in land cover classification. To further improve the classification accuracy, multi-temporal Sentinel-1A SAR data can be used [54,55].
To reduce the confusion between the built-up area and water, Sentinel-1A SAR data are synergistically combined with Sentinel-2B MSI data to improve the land cover classification. Using the Sentinel-2B MSI image alone, 18 pixels of the built-up area are misclassified as water, and 2 pixels of the built-up area are wrongly classified as forest. With the additional use of Sentinel-1A SAR data, only 2 pixels of the built-up area are misclassified as forest. Therefore, the confusion between the built-up area and water is greatly reduced. The PA for the built-up area is 97.29% in the classification based on Sentinel-2B MSI data. The classification implemented on the combination of Sentinel-2B MSI and Sentinel-1A SAR data achieves a PA of 99.73% for the built-up area, which corresponds to the highest Z value (Z = 3.84). Compared with the classification using Sentinel-2B MSI data via the SVM-CK algorithm, the classification using the combination of Sentinel-2B MSI and Sentinel-1A SAR data does not provide a statistically significant improvement in OA (p > 0.05, Z = 1.23). Another comparative study is performed to evaluate the effectiveness of the Sentinel-1A SAR data. When using Sentinel-2B MSI alone, it is noticeable that some areas of built-up area are misclassified as water in Area 2 (Figure 11a,b). The classification result obtained from the Sentinel-2B MSI image is spatially consistent with that obtained from the combination of Sentinel-2B MSI and Sentinel-1A SAR data (Figure 11b,d). The classification derived from the Sentinel-1A SAR data does not present a reasonable depiction of urban land cover types (Figure 11c). It is obvious that some areas of water are misclassified as bare soil (Figure 11c). When using Sentinel-2B MSI data alone, water is not easily confused with bare soil (Figure 11b). The misclassification of forest and cropland is also observed (Figure 11c). In comparison, the Sentinel-2B MSI image can distinguish the forest from the cropland (Figure 11b). Compared with the classification based on the Sentinel-2B MSI image, the classification based on the Sentinel-1A SAR image contains more speckles (Figure 11b,c).

6. Conclusions

Classifying land cover types in an accurate manner is very important for monitoring urban environments. Taking the city of Wuhan as a case study, this paper has shown that the combined use of Sentinel-2B MSI and Sentinel-1A SAR data can provide an accurate land cover classification. When using the Sentinel-2B MSI image alone, the land cover classification using the SVM-CK algorithm achieves an OA of 91.54% with a KA of 0.88. We further evaluate the efficiency of SVM-CK by comparing it with SVM and KELM-CK. The results suggest that the classification utilizing the SVM-CK algorithm obtains the highest OA (91.54%), followed by the SVM (90.43%) and KELM-CK (88.09%) algorithms. The SVM-CK algorithm has the ability to further improve classification performance. On certain occasions, dark impervious surface can be easily confused with water. The SVM-CK algorithm has the ability to improve classification accuracy by reducing the confusion between dark impervious surface and water. Sentinel-1A SAR data are also applied for the discrimination of the five land cover types. The classification utilizing Sentinel-1A SAR data yields an OA of 73.09% with a KA of 0.64. Compared with the classification using Sentinel-2B MSI data, the classification based on Sentinel-1A SAR data yields a lower OA. When using Sentinel-1A SAR data alone, forest can be easily confused with cropland. The classification achieves an OA of 81.38% with a KA of 0.74 when forest and cropland are merged. The results show that Sentinel-1A SAR data can identify built-up area, water, vegetation, and bare soil. This research demonstrates that Sentinel-1A SAR data have the potential to classify different land cover types. Thus, Sentinel-1A SAR data can be used as an independent source when optical data are affected by weather conditions. Sentinel-1A SAR data have great advantages in monitoring urban flooding when the city of Wuhan is hit by a flood. Sentinel-1A SAR data can provide timely information for land cover classification. The built-up area can be confused with water when using Sentinel-2B MSI data alone. To reduce the confusion between the built-up area and water, Sentinel-1A SAR data are synergistically combined with Sentinel-2B MSI data for land cover mapping. The classification implemented on the combination of Sentinel-2B MSI and Sentinel-1A SAR data achieves an OA of 92.12% with a KA of 0.89. The methodology proposed in this study can be generalized to other areas worldwide. In addition, the SVM-CK algorithm can be applied to other applications, such as crop-type classification, vegetation type classification, and flood monitoring. The above results confirm that the fusion of Sentinel-2B MSI and Sentinel-1A SAR data efficiently improves land cover classification in cloud-prone regions.

Author Contributions

Bin Hu, Yongyang Xu, Qimin Cheng, and Yan Li conceived and designed the experiments; Bin Hu, Yongyang Xu, and Qing Ding analyzed the data and performed the experiments; Bin Hu, Xiao Huang, Linze Bai, and Qimin Cheng wrote the paper in English. All authors have read and agreed to the published version of the manuscript.

Funding

This work is supported by the National Key Research and Development Program of China(2018YFB0505401), the Key Research and Development Program of Yunnan Province in China(2018IB023), the National Natural Science Foundation of China under Grants 41771452, 41771454, 41890820, and 41901340, the Natural Science Fund of Hubei Province in China under Grant 2018CFA007, the Natural Science Foundation of Inner Mongolia Autonomous Region (2019MS04017), and the Scientific Research Project of Colleges and Universities in Inner Mongolia Autonomous Region (NJZY20277).

Institutional Review Board Statement

Not applicable.

Informed Consent Statement

Not applicable.

Data Availability Statement

Not applicable.

Conflicts of Interest

The authors declare no conflict of interest.

References

  1. Chen, J.; Chen, J.; Liao, A.; Cao, X.; Chen, L.; Chen, X.; He, C.; Han, G.; Peng, S.; Lu, M. Global land cover mapping at 30 m resolution: A POK-based operational approach. ISPRS J. Photogramm. Remote Sens. 2015, 103, 7–27. [Google Scholar] [CrossRef] [Green Version]
  2. Chen, B.; Huang, B.; Xu, B. Multi-source remotely sensed data fusion for improving land cover classification. ISPRS J. Photogramm. Remote Sens. 2017, 124, 27–39. [Google Scholar] [CrossRef]
  3. Godinho, S.; Guiomar, N.; Gil, A. Using a stochastic gradient boosting algorithm to analyse the effectiveness of Landsat 8 data for montado land cover mapping: Application in southern Portugal. Int. J. Appl. Earth Obs. Geoinform. 2016, 49, 151–162. [Google Scholar] [CrossRef]
  4. Veloso, A.; Mermoz, S.; Bouvet, A.; Le Toan, T.; Planells, M.; Dejoux, J.-F.; Ceschia, E. Understanding the temporal behavior of crops using Sentinel-1 and Sentinel-2-like data for agricultural applications. Remote Sens. Environ. 2017, 199, 415–426. [Google Scholar] [CrossRef]
  5. Carrasco, L.; O’Neil, A.W.; Morton, R.D.; Rowland, C.S. Evaluating combinations of temporally aggregated Sentinel-1, Sentinel-2 and Landsat 8 for land cover mapping with Google Earth Engine. Remote Sens. 2019, 11, 288. [Google Scholar] [CrossRef] [Green Version]
  6. Drusch, M.; Del Bello, U.; Carlier, S.; Colin, O.; Fernandez, V.; Gascon, F.; Hoersch, B.; Isola, C.; Laberinti, P.; Martimort, P. Sentinel-2: ESA’s optical high-resolution mission for GMES operational services. Remote Sens. Environ. 2012, 120, 25–36. [Google Scholar] [CrossRef]
  7. Gong, P.; Wang, J.; Yu, L.; Zhao, Y.; Zhao, Y.; Liang, L.; Niu, Z.; Huang, X.; Fu, H.; Liu, S. Finer resolution observation and monitoring of global land cover: First mapping results with Landsat TM and ETM+ data. Int. J. Remote Sens. 2013, 34, 2607–2654. [Google Scholar] [CrossRef] [Green Version]
  8. Gong, P.; Liu, H.; Zhang, M.; Li, C.; Wang, J.; Huang, H.; Clinton, N.; Ji, L.; Li, W.; Bai, Y. Stable classification with limited sample: Transferring a 30-m resolution sample set collected in 2015 to mapping 10-m resolution global land cover in 2017. Sci. Bull. 2019, 64, 370–373. [Google Scholar] [CrossRef] [Green Version]
  9. Lu, D.; Batistella, M.; Moran, E. Land-cover classification in the Brazilian Amazon with the integration of Landsat ETM+ and Radarsat data. Int. J. Remote Sens. 2007, 28, 5447–5459. [Google Scholar] [CrossRef] [Green Version]
  10. Mitchard, E.T.; Saatchi, S.S.; White, L.; Abernethy, K.; Jeffery, K.J.; Lewis, S.L.; Collins, M.; Lefsky, M.A.; Leal, M.E.; Woodhouse, I.H. Mapping tropical forest biomass with radar and spaceborne LiDAR in Lopé National Park, Gabon: Overcoming problems of high biomass and persistent cloud. Biogeosciences 2012, 9, 179–191. [Google Scholar] [CrossRef] [Green Version]
  11. Lehmann, E.A.; Caccetta, P.A.; Zhou, Z.-S.; McNeill, S.J.; Wu, X.; Mitchell, A.L. Joint processing of Landsat and ALOS-PALSAR data for forest mapping and monitoring. IEEE Trans. Geosci. Remote Sens. 2011, 50, 55–67. [Google Scholar] [CrossRef]
  12. Laurin, G.V.; Liesenberg, V.; Chen, Q.; Guerriero, L.; Del Frate, F.; Bartolini, A.; Coomes, D.; Wilebore, B.; Lindsell, J.; Valentini, R. Optical and SAR sensor synergies for forest and land cover mapping in a tropical site in West Africa. Int. J. Appl. Earth Obs. Geoinform. 2013, 21, 7–16. [Google Scholar] [CrossRef]
  13. Jiang, L.; Liao, M.; Lin, H.; Yang, L. Synergistic use of optical and InSAR data for urban impervious surface mapping: A case study in Hong Kong. Int. J. Remote Sens. 2009, 30, 2781–2796. [Google Scholar] [CrossRef]
  14. Shao, Z.; Wu, W.; Guo, S. IHS-GTF: A Fusion Method for Optical and Synthetic Aperture Radar Data. Remote Sens. 2020, 12, 2796. [Google Scholar] [CrossRef]
  15. Zhang, H.; Zhang, Y.; Lin, H. A comparison study of impervious surfaces estimation using optical and SAR remote sensing images. Int. J. Appl. Earth Obs. Geoinform. 2012, 18, 148–156. [Google Scholar] [CrossRef]
  16. Huang, H.; Roy, D.; Boschetti, L.; Zhang, H.; Yan, L.; Kumar, S.; Gomez-Dans, J.; Li, J. Separability analysis of Sentinel-2A multi-spectral instrument (MSI) data for burned area discrimination. Remote Sens. 2016, 8, 873. [Google Scholar] [CrossRef] [Green Version]
  17. Roteta, E.; Bastarrika, A.; Padilla, M.; Storm, T.; Chuvieco, E. Development of a Sentinel-2 burned area algorithm: Generation of a small fire database for sub-Saharan Africa. Remote Sens. Environ. 2019, 222, 1–17. [Google Scholar] [CrossRef]
  18. Hu, B.; Xu, Y.; Wan, B.; Wu, X.; Yi, G. Hydrothermally altered mineral mapping using synthetic application of Sentinel-2A MSI, ASTER and Hyperion data in the Duolong area, Tibetan Plateau, China. Ore Geol. Rev. 2018, 101, 384–397. [Google Scholar] [CrossRef]
  19. Di Napoli, M.; Marsiglia, P.; Di Martire, D.; Ramondini, M.; Ullo, S.L.; Calcaterra, D. Landslide susceptibility assessment of wildfire burnt areas through earth-observation techniques and a machine learning-based approach. Remote Sens. 2020, 12, 2505. [Google Scholar] [CrossRef]
  20. Wang, D.; Wan, B.; Qiu, P.; Su, Y.; Guo, Q.; Wang, R.; Sun, F.; Wu, X. Evaluating the performance of sentinel-2, landsat 8 and pléiades-1 in mapping mangrove extent and species. Remote Sens. 2018, 10, 1468. [Google Scholar] [CrossRef] [Green Version]
  21. Zhang, H.; Li, J.; Wang, T.; Lin, H.; Zheng, Z.; Li, Y.; Lu, Y. A manifold learning approach to urban land cover classification with optical and radar data. Landscape Urban Plan. 2018, 172, 11–24. [Google Scholar] [CrossRef]
  22. Balzter, H.; Cole, B.; Thiel, C.; Schmullius, C. Mapping CORINE land cover from Sentinel-1A SAR and SRTM digital elevation model data using random forests. Remote Sens. 2015, 7, 14876–14898. [Google Scholar] [CrossRef] [Green Version]
  23. Ruzza, G.; Guerriero, L.; Grelle, G.; Guadagno, F.M.; Revellino, P. Multi-method tracking of monsoon floods using Sentinel-1 imagery. Water 2019, 11, 2289. [Google Scholar] [CrossRef] [Green Version]
  24. Bao, Y.; Lin, L.; Wu, S.; Deng, K.A.K.; Petropoulos, G.P. Surface soil moisture retrievals over partially vegetated areas from the synergy of Sentinel-1 and Landsat 8 data using a modified water-cloud model. Int. J. Appl. Earth Obs. Geoinform. 2018, 72, 76–85. [Google Scholar] [CrossRef]
  25. Clauss, K.; Ottinger, M.; Leinenkugel, P.; Kuenzer, C. Estimating rice production in the Mekong Delta, Vietnam, utilizing time series of Sentinel-1 SAR data. Int. J. Appl. Earth Obs. Geoinform. 2018, 73, 574–585. [Google Scholar] [CrossRef]
  26. Erinjery, J.J.; Singh, M.; Kent, R. Mapping and assessment of vegetation types in the tropical rainforests of the Western Ghats using multispectral Sentinel-2 and SAR Sentinel-1 satellite imagery. Remote Sens. Environ. 2018, 216, 345–354. [Google Scholar] [CrossRef]
  27. Castillo, J.A.A.; Apan, A.A.; Maraseni, T.N.; Salmo III, S.G. Estimation and mapping of above-ground biomass of mangrove forests and their replacement land uses in the Philippines using Sentinel imagery. ISPRS J. Photogramm. Remote Sens. 2017, 134, 70–85. [Google Scholar] [CrossRef]
  28. Colson, D.; Petropoulos, G.P.; Ferentinos, K.P. Exploring the potential of Sentinels-1 & 2 of the Copernicus Mission in support of rapid and cost-effective wildfire assessment. Int. J. Appl. Earth Obs. Geoinform. 2018, 73, 262–276. [Google Scholar]
  29. Walker, W.S.; Stickler, C.M.; Kellndorfer, J.M.; Kirsch, K.M.; Nepstad, D.C. Large-area classification and mapping of forest and land cover in the Brazilian Amazon: A comparative analysis of ALOS/PALSAR and Landsat data sources. IEEE J. Sel. Top. Appl. Earth Obs. Remote Sens. 2010, 3, 594–604. [Google Scholar] [CrossRef]
  30. Weng, Q. Remote sensing of impervious surfaces in the urban areas: Requirements, methods, and trends. Remote Sens. Environ. 2012, 117, 34–49. [Google Scholar] [CrossRef]
  31. Melgani, F.; Bruzzone, L. Classification of hyperspectral remote sensing images with support vector machines. IEEE Trans. Geosci. Remote Sens. 2004, 42, 1778–1790. [Google Scholar] [CrossRef] [Green Version]
  32. Pal, M. Extreme-learning-machine-based land cover classification. Int. J. Remote Sens. 2009, 30, 3835–3841. [Google Scholar] [CrossRef] [Green Version]
  33. Pal, M.; Maxwell, A.E.; Warner, T.A. Kernel-based extreme learning machine for remote-sensing image classification. Remote Sens. Lett. 2013, 4, 853–862. [Google Scholar] [CrossRef]
  34. Chen, C.; Li, W.; Su, H.; Liu, K. Spectral-spatial classification of hyperspectral image based on kernel extreme learning machine. Remote Sens. 2014, 6, 5795–5814. [Google Scholar] [CrossRef] [Green Version]
  35. Liu, J.; Wu, Z.; Wei, Z.; Xiao, L.; Sun, L. Spatial-spectral kernel sparse representation for hyperspectral image classification. IEEE J. Sel. Top. Appl. Earth Obs. Remote Sens. 2013, 6, 2462–2471. [Google Scholar] [CrossRef]
  36. Fauvel, M.; Chanussot, J.; Benediktsson, J.A. A spatial–spectral kernel-based approach for the classification of remote-sensing images. Pattern Recogn. 2012, 45, 381–392. [Google Scholar] [CrossRef]
  37. Quesada-Barriuso, P.; Argüello, F.; Heras, D.B. Spectral–spatial classification of hyperspectral images using wavelets and extended morphological profiles. IEEE J. Sel. Top. Appl. Earth Obs. Remote Sens. 2014, 7, 1177–1185. [Google Scholar] [CrossRef]
  38. Zhou, Y.; Peng, J.; Chen, C.P. Extreme learning machine with composite kernels for hyperspectral image classification. IEEE J. Sel. Top. Appl. Earth Obs. Remote Sens. 2014, 8, 2351–2360. [Google Scholar] [CrossRef]
  39. Wang, L.; Gong, W.; Xia, X.; Zhu, J.; Li, J.; Zhu, Z. Long-term observations of aerosol optical properties at Wuhan, an urban site in Central China. Atmos. Environ. 2015, 101, 94–102. [Google Scholar] [CrossRef]
  40. Hu, T.; Huang, X.; Li, J.; Zhang, L. A novel co-training approach for urban land cover mapping with unclear Landsat time series imagery. Remote Sens. Environ. 2018, 217, 144–157. [Google Scholar] [CrossRef]
  41. Zhou, K.; Liu, Y.; Tan, R.; Song, Y. Urban dynamics, landscape ecological security, and policy implications: A case study from the Wuhan area of central China. Cities 2014, 41, 141–153. [Google Scholar] [CrossRef]
  42. Wu, H.; Ye, L.-P.; Shi, W.-Z.; Clarke, K.C. Assessing the effects of land use spatial structure on urban heat islands using HJ-1B remote sensing imagery in Wuhan, China. Int. J. Appl. Earth Obs. Geoinform. 2014, 32, 67–78. [Google Scholar] [CrossRef]
  43. Shen, H.; Huang, L.; Zhang, L.; Wu, P.; Zeng, C. Long-term and fine-scale satellite monitoring of the urban heat island effect by the fusion of multi-temporal and multi-sensor remote sensed data: A 26-year case study of the city of Wuhan in China. Remote Sens. Environ. 2016, 172, 109–125. [Google Scholar] [CrossRef]
  44. Zhang, T.; Yi, G.; Li, H.; Wang, Z.; Tang, J.; Zhong, K.; Li, Y.; Wang, Q.; Bie, X. Integrating data of ASTER and Landsat-8 OLI (AO) for hydrothermal alteration mineral mapping in duolong porphyry cu-au deposit, Tibetan Plateau, China. Remote Sens. 2016, 8, 890. [Google Scholar] [CrossRef] [Green Version]
  45. Malenovský, Z.; Rott, H.; Cihlar, J.; Schaepman, M.E.; García-Santos, G.; Fernandes, R.; Berger, M. Sentinels for science: Potential of Sentinel-1,-2, and-3 missions for scientific observations of ocean, cryosphere, and land. Remote Sens. Environ. 2012, 120, 91–101. [Google Scholar] [CrossRef]
  46. Yang, H.; Pan, B.; Wu, W.; Tai, J. Field-based rice classification in Wuhua county through integration of multi-temporal Sentinel-1A and Landsat-8 OLI data. Int. J. Appl. Earth Obs. Geoinform. 2018, 69, 226–236. [Google Scholar] [CrossRef]
  47. Shao, Z.; Fu, H.; Fu, P.; Yin, L. Mapping urban impervious surface by fusing optical and SAR data at the decision level. Remote Sens. 2016, 8, 945. [Google Scholar] [CrossRef] [Green Version]
  48. Zhang, Y.; Zhang, H.; Lin, H. Improving the impervious surface estimation with combined use of optical and SAR remote sensing images. Remote Sens. Environ. 2014, 141, 155–167. [Google Scholar] [CrossRef]
  49. Duro, D.C.; Franklin, S.E.; Dubé, M.G. A comparison of pixel-based and object-based image analysis with selected machine learning algorithms for the classification of agricultural landscapes using SPOT-5 HRG imagery. Remote Sens. Environ. 2012, 118, 259–272. [Google Scholar] [CrossRef]
  50. Clark, M.L. Comparison of simulated hyperspectral HyspIRI and multispectral Landsat 8 and Sentinel-2 imagery for multi-seasonal, regional land-cover mapping. Remote Sens. Environ. 2017, 200, 311–325. [Google Scholar] [CrossRef]
  51. Pelletier, C.; Valero, S.; Inglada, J.; Champion, N.; Dedieu, G. Assessing the robustness of Random Forests to map land cover with high resolution satellite image time series over large areas. Remote Sens. Environ. 2016, 187, 156–168. [Google Scholar] [CrossRef]
  52. Zhu, Z.; Woodcock, C.E.; Rogan, J.; Kellndorfer, J. Assessment of spectral, polarimetric, temporal, and spatial dimensions for urban and peri-urban land cover classification using Landsat and SAR data. Remote Sens. Environ. 2012, 117, 72–82. [Google Scholar] [CrossRef]
  53. Dell’Acqua, F.; Gamba, P. Texture-based characterization of urban environments on satellite SAR images. IEEE Trans. Geosci. Remote Sens. 2003, 41, 153–159. [Google Scholar] [CrossRef]
  54. Waske, B.; Braun, M. Classifier ensembles for land cover mapping using multitemporal SAR imagery. ISPRS J. Photogramm. Remote Sens. 2009, 64, 450–457. [Google Scholar] [CrossRef]
  55. Cai, Y.; Guan, K.; Peng, J.; Wang, S.; Seifert, C.; Wardlow, B.; Li, Z. A high-performance and in-season classification system of field-level crop types using time-series Landsat data and a machine learning approach. Remote Sens. Environ. 2018, 210, 35–47. [Google Scholar] [CrossRef]
Figure 1. (a) The geographic location of Hubei Province; (b) the geographic location of Wuhan.
Ijgi 10 00533 g001
Figure 2. (a) False-color composite (red, band 12; green, band 8a; blue, band 2) Sentinel-2B MSI image acquired on 12 October 2018; (b) false-color composite (red, VH; green, VV; blue, VH+ VV) Sentinel-1A SAR image acquired on 16 October 2018.
Ijgi 10 00533 g002
Figure 3. Flowchart of the land cover classifications in the study area.
Ijgi 10 00533 g003
Figure 4. Land cover map obtained from the SVM-CK algorithm with the Sentinel-2B MSI image.
Ijgi 10 00533 g004
Figure 5. Land cover map obtained from the SVM-CK algorithm with the Sentinel-1A SAR image.
Ijgi 10 00533 g005
Figure 6. Land cover map obtained from the SVM-CK algorithm with the combination of Sentinel-2B MSI and Sentinel-1A SAR images.
Ijgi 10 00533 g006
Figure 7. Land cover classification results using Sentinel-2B MSI image alone with the SVM-CK algorithm (a), the SVM algorithm (b), and the KELM-CK algorithm (c).
Ijgi 10 00533 g007
Figure 8. (a) False-color composite (red, band 12; green, band 8a; blue, band 2) Sentinel-2B MSI image in Area 1. Land cover classification results using Sentinel-2B MSI image alone with the SVM-CK algorithm (b), the SVM algorithm (c), and the KELM-CK algorithm (d).
Ijgi 10 00533 g008
Figure 9. Box-and-whisker plot that represents the backscatter coefficient (σ0) values of five land cover categories.
Ijgi 10 00533 g009
Figure 10. Land cover map obtained from the SVM-CK algorithm with the Sentinel-1A SAR image.
Ijgi 10 00533 g010
Figure 11. (a) False-color composite (red, band 12; green, band 8a; blue, band 2) Sentinel-2B MSI image in Area 2. Land cover map obtained from the SVM-CK algorithm with the Sentinel-2B MSI image (b), the Sentinel-1A SAR image (c), and the combination of Sentinel-2B MSI and Sentinel-1A SAR data (d).
Ijgi 10 00533 g011
Table 1. Description of five land cover categories.
Class NameTraining ROIsValidation ROIsTraining PixelsValidation PixelsClass Description
Built-up80401510737Buildings, roads, and industrial areas
Water9045991243Lakes, rivers, and ponds
Forest40201064292Shrub, broadleaf, and coniferous
Cropland40201038199Farmland and grass
Bare soil4020743242Exposed rock and soils
Table 2. Confusion matrix of the classification results using only the Sentinel-2B MSI data.
Reference Data
Built-Up WaterForestCroplandBare SoilTotalPA(%)UA(%)F(%)
Built-up 71713012275397.2995.2296.24
Water1822700024593.4292.6593.03
Forest2324135028182.5385.7784.12
Cropland0051163021481.9176.1778.93
Bare soil000022022090.9110095.24
Total737243292199242
OA = 91.54% KA = 0.88
Table 3. Confusion matrix of the classification results using only the Sentinel-1A SAR data.
Reference Data
Built-UpWaterForestCroplandBare SoilTotalPA(%)UA(%)F(%)
Built-up548316172160574.3690.5881.67
Water422309023691.7794.4993.11
Forest921262128348689.7353.9167.35
Cropland62114343314417.0923.6119.83
Bare soil311501118524276.4576.4576.45
Total737243292199242
OA = 73.09% KA = 0.64
Table 4. Confusion matrix of the classification results using the combination of Sentinel-2B MSI and Sentinel-1A SAR data.
Reference Data
Built-UpWaterForestCroplandBare SoilTotalPA(%)UA(%)F(%)
Built-up7353102476399.7396.3398
Water024000024098.7710099.38
Forest2022640026877.4084.3380.71
Cropland0065159022479.9070.9875.18
Bare soil000021821890.0810094.78
Total737243292199242
OA = 92.12% KA = 0.89
Table 5. Accuracy assessment of the classification results using three different algorithms with the Sentinel-2B MSI data (all in percent).
SVM-CK SVM KELM-CK
PAUAFPAUAFPAUAF
Built-up97.2995.2296.2492.4096.7394.5287.5296.8591.95
Water93.4292.6593.0397.1281.3888.5598.3575.3985.36
Forest82.5385.7784.1284.2585.7184.9783.2281.2782.23
Cropland81.9176.1778.9381.4177.8879.6180.9076.6778.73
Bare soil90.9110095.2492.5610096.1491.3210095.46
OA 91.54 90.43 88.09
KA 88.40 87.03 84.00
Publisher’s Note: MDPI stays neutral with regard to jurisdictional claims in published maps and institutional affiliations.

