Abstract
The urban environment has a great impact on the wellbeing of citizens and it is of great significance to understand how citizens perceive and evaluate places in a large scale urban region and to provide scientific evidence to support human-centered urban planning with a better urban environment. Existing studies for assessing urban perception have primarily relied on low efficiency methods, which also result in low evaluation accuracy. Furthermore, there lacks a sophisticated understanding on how to correlate the urban perception with the built environment and other socio-economic data, which limits their applications in supporting urban planning. In this study, a new data-enabled intelligence framework for evaluating human perceptions of urban space is proposed. Specifically, a novel classification-then-regression strategy based on a deep convolutional neural network and a random-forest algorithm is proposed. The proposed approach has been applied to evaluate the perceptions of Beijing and Chengdu against six perceptual criteria. Meanwhile, multi-source data were employed to investigate the associations between human perceptions and the indicators for the built environment and socio-economic data including visual elements, facility attributes and socio-economic indicators. Experimental results show that the proposed framework can effectively evaluate urban perceptions. The associations between urban perceptions and the visual elements, facility attributes and a socio-economic dimension have also been identified, which can provide substantial inputs to guide the urban planning for a better urban space.
1. Introduction
The wellbeing of humans, a sense of community and a sense of place are important attributes that influence social sustainability [,]. Meanwhile, human wellbeing and behaviors are affected by the built environment and sense of place [,,]. Urban space perception, by gathering holistic knowledge about the people’s real experience of the urban environment, is of great significance for researchers, urban planners and decision makers to improve the built environment, so as to further enhance the wellbeing of citizens. Thus, research on urban space perception provides a promising way to uncover the psychological feelings perceived by humans towards the urban built environment and gives more scientific clues for urban planners by answering what and how to improve the built environment for urban planning or renewal.
The scale of expansion and the built environment of cities changes rapidly. Learning how to gather visual information of an urban space that affects people’s real experience cost-effectively has long been a challenging but key role in the related fields [,,]. Conventionally, the primary approach is by sending human auditors to the field to observe and record the urban built environment [], such as field surveys and questionnaires. It is labor intensive, costly, time-consuming and difficult to assess human perceptions, especially in a large scale urban region using traditional methods, due to their limitations of small sample size and the low throughput of data generation [,,,,,].
The emergence of multi-sources of data developed in recent years has generated a variety of geospatial data. The publicly available street view imagery data with geographic location information is one of the most popular sources for data on urban public spaces, containing abundant visual features that can effectively reflect a natural scene of an urban environment and covers a wide urban area [,]. The imagery data provides an efficient means for the analysis of visual elements and physical appearance at a city scale. The fast development of computer vision, on the other hand, has attracted much attention and achieved a great success in obtaining the visual information of the urban appearance at a large scale when it is combined with street-view imagery [,,,,,,,,,,,]. Although the above work has made great progress in the evaluation of urban space, the performance of their methods in terms of accuracy and the level of supported analysis are still very limited, which hindles the accuracy and comprehension to understand the human perception of urban space. On the one hand, inefficient methods may lead to inaccuracy in predicting the real experience of human perception of urban regions. On the other hand, current research is limited to the use of single street view image data to assess urban perception; the value of city scale data has yet to be fully explored, which can provide clues for urban planners to understand how people perceive urban regions comprehensively, e.g., how human perception is associated with the urban space, from the perspective of physical and socio-economic aspects.
In this study, a new data-enabled intelligence framework is developed to understand human perception of public spaces from multiple perspectives based on multi-source big data and deep learning techniques. We introduced a pipeline that starts with a classification model to extract high-level visual information followed by a regression model to evaluate human perceptions based on street view imagery. We took Beijing and Chengdu as our case study areas to predict human perceptions against six perceptual criteria—beautiful, boring, depressing, lively, safe and wealthy—which follow the definitions of the perceptual dimensions in the research of the MIT Place Pulse dataset []. Finally, we linked the human perceptions with physical aspects, in terms of visual elements and points-of-interest (POI) and socio-economic aspects, in terms of housing price, to demonstrate the effectiveness of the proposed multi-dimensional method and explore the influence of the factors on urban environment. The experimental results and case studies show that the proposed work has the capability and potential to inform the city design on the optimised elements to consider, to improve the urban environment for human-centered urban planning and further promote social sustainability.
The main contributions of this paper are as follows:
- (1)
- A novel classification-then-regression strategy has been proposed to convert the perceptual task into a classification task. This can mitigate the uncertainty of human perceptual evaluation and revert to the regression task to obtain the continuous perception values. The experimental results show that our method has better performance in evaluating human perceptions of urban regions.
- (2)
- We constructed a full-coverage spatial distribution map of human perceptions for the selected areas of Beijing and Chengdu using the proposed framework. These maps provide opportunities to comprehensively analyze the human perceptions of a city at the city scale and provide location-based data support for further urban environment optimization.
- (3)
- We employed street view imagery as the proxy for the urban physical environment and took Beijing and Chengdu as study areas to evaluate their physical environment using the matrix of physical aspects, including visual elements and facility attributes and socio-economic aspects of housing price to correlate them with human perceptions. The detailed results of mapping multi-dimensional factors to perceptual criteria in our research can provide scientific support for exploring the significant impact factors on urban planning optimization.
The remainder of this paper is organized as follows: Section 2 reviews the related work; Section 3 describes the four data sources used in this work; Section 4 gives details of the proposed framework; Section 5 presents the results of the proposed framework and the findings; Section 6 concludes the paper with remarks of the significance and limitations of this study.
2. Literature Review
2.1. Measuring Human Perceptions of Place
During the past few decades, it has been a widely-held belief of urban planners, decision makers and sociologists that the behavior and health of urban residents are affected by the physical appearance and perception of the city [,,,,]. The connections between human perceptions and the environment have been discussed in various research fields, e.g., neuroscience [], urban planning [] and environmental psychology []. Measuring human perceptions of urban space has been receiving increased attention in the research field of urban planning. Previous studies have been conducted using low-throughput surveys, such as audits, interviews, on-site observations and questionnaires, to perceive built environment from certain evaluative dimensions. For instance, volunteers were invited to rate the physical setting of a place by 10 scales [,,]. Yıldız et al. [] utilized a survey among people who previously worked in urban renewal projects to explore which design elements should be considered to improve the social sustainability of urban renewal projects. Due to the labor-demanding nature of the low-throughput surveys to assess the human sense of places, especially when the target area is a arge scale urban region, how to automate the urban perception evaluation process and boost work efficiency is a challenging but rewarding task in related fields.
2.2. Application of Street View Imagery to Evaluate Urban Space
In recent years, the advancement of map services has produced numerous panoramic imagery taken from the urban environment []. Its emergence has resulted in some relevant geo-tagged datasets released and widely used in various research works. Salesses et al. collected a massive number of street view images at a city scale to gather human perception of images. The dataset was released as Place Pulse 1.0 dataset []. Based on Salesses’s work, Dubey et al. extended the study area to a global scale and the perceptual attribute to multi-dimensions and an upgraded urban perception dataset was publicly released, termed as the Place Pulse 2.0 dataset []. The Place Pulse 2.0 dataset is, to date, the best general dataset covering the worldwide area, which collected a massive amount of human perceptual responses of images by crowd-sourcing, where 81,630 people are included in the survey to mark score of the image at different criteria, and this makes it a perfect training dataset for research. Researchers have conducted follow-up research analyzing human perceptions of the urban environment based on the provided datasets [,,,,,,,]. Specifically, Naik et al. exploited computer vision techniques to analyze street safety and measure the quality of urban appearance and explored urban appearance change to reveal the predictors of physical urban change by using street view images [,,]. Seiferling et al. [] combined computer vision and street view imagery to quantify and map urban trees. Liu et al. [] proposed a computer vision method including three machine learning models, to use street view images to evaluate the urban environmental quality from the architectural level on a large scale. Liu et al. [] proposed a deep learning approach to estimate the street quality score. Zhang et al. [] investigated a data-driven machine learning approach to measure how people perceive the urban region. Yao et al. [] established a human–machine adversarial scoring framework that combines semantic segmentation and iterative feedback to learn the scoring features of humans on street view images to recommend scoring for urban perception. Zhang et al. [] demonstrated the potential usage of street view images in uncovering Spatio-temporal urban mobility patterns. Wang et al. [] combined street view images and deep learning technique to assess perceptions of the built environment and health outcomes for ageing populations in Beijing.
The aforementioned work have made great progress for urban space evaluation. However, there still exist many limitations to a certain extent. The Place Pulse 2.0 dataset proposed by Dubey et al. only gives the score of the image without further correlation with other city data due to the need of crowd-sourcing for new data. The approach for urban physical environment analysis developed by Naik et al. has limitation to only extract low or mid-level image features including color Histograms, Gist, HOG2x2 and Dense SIFT [,,]. Liu et al. [] evaluated the qualities of urban appearance using machine learning, but it was limited to architectural level analysis. Liu et al. [] used deep learning to estimate street space quality based on three quantitative indices (i.e., cleanliness, comfort and traffic) they defined and labelled themselves; there may be a gap between their opinions and the public’s preference. Zhang et al. [] employed street view image as a proxy for the urban environment to evaluate human perceptions of a city by using a deep convolutional neural network (DCNN), but they only used the positive confidence of a binary classification model as the perception scores, without proving the consistency between their results with the ground truth. Furthermore, few studies have explored which elements affect human perception of urban space, such as which visual element is important in promoting “beautiful” perception and which infrastructure contributes to “lively” perception.
In this study, we employed DCNN to extract the high-dimensional deep feature of each street view image to solve the limitions in low/mid-features of Naik’s research [,,]. Meanwhile, street view images with multiple orientations were captured to evaluate urban perception with a more diverse appearance scale but not limited to the architectural level analysis. Moreover, a classification-then-regression strategy was used for training our models, which can mitigate the uncertainty of human perceptual evaluation and allow the comparison between the predicted human perceptions and the ground truth based on crowd-sourcing dataset from 81,630 surveys. Using this, our models achieved better accuracy than Zhang’s framework []. Finally, given the limitation that the above research did not explore the effects of multi-dimensional factors on urban perceptions, multiple data sources in case study areas were used to explore the associations of multi-factors to urban perceptions in this study and demonstrated an efficient way to comprehensively analyze the human perceptions of cities at city scale for further optimization.
3. Data Sources and Case Study Areas
In order to better evaluate urban space perception, the MIT Place Pulse 2.0 dataset, which contains the human perception of cities against six perceptual criteria, was leveraged as clues to explore the links between natural scene and human perceptions and was applied for the training of the proposed DCNN based model. To show the quality of such an application of our models in predicting human perception, Beijing and Chengdu were selected as case study areas. The Tencent street view images, which provide abundant visual information of the static physical structures of urban appearance on almost every corner of urban streets, were employed as a proxy for the urban environment of case study areas. To further research the links of city scale data to urban perceptions, two well-recognized data sources were also employed. The POI data indicating the location and attribution information of the functional facilities in urban space and the level of functional facilities closely related to the human perceptions of urban space, are employed to explore the associations between facility attributes and human perceptions. The housing price data play a very important role in economics at both the macro and micro scales in cities, which was used to analyze the association between the socio-economic indicator and urban perceptions. We will describe the data sources in detail in the following sections.
3.1. MIT Place Pulse 2.0 Dataset
The Place Pulse 2.0 dataset proposed by the Collective Learning group of the MIT Media Lab (https://www.media.mit.edu/projects/place-pulse/overview/, accessed on 16 March 2020), a crowd-sourced dataset of perceptual attributes of urban appearance for street view images, contains 110,988 images captured between 2007 and 2012 and sampled across 56 major cities from 28 countries spread across all six inhabited continents, which includes data from Hong Kong and Macao in the Chinese regions. []. In the literature [], their main contribution is the introduction of the crowd-sourcing dataset and the use of deep learning to predict human judgments of pairwise image comparisons and calculated the final perception score for a single image. Although the need for crowd-sourcing for obtaining new data in target cities makes it less efficient, the global coverage of the dataset makes it a perfect option to train a learning-based approach for urban perception. Based on Dubey’s work, we employed the Place Pulse 2.0 dataset as the proxy and sampled it to formulate our datasets for evaluating urban perception. Furthermore, we also used multi-sources data to mine the links of city scale data to urban perception.
In the Place Pulse 2.0 dataset, human perceptual responses of urban physical environment were collected via crowd-sourcing using a website by showing a randomly chosen pair of images from one city side-by-side to participants and asked them to choose one of the images as the answer to one of six relative perceptual judgment questions. Studies have shown that gathering relative comparisons is a more efficient and accurate way of obtaining human perceptions as compared to obtaining numerical scores from each user []. Consequently, the study had collected 1,169,078 pairwise comparisons from 81,630 participants between May 2013 and February 2016 [].
Perception scores of each image are assigned by using the results of the pairwise comparisons. For each pairwise comparison, the authors provide their results—the left or right image wins or the two tie. Mainly, two methods are adopted to convert the pair-to-pair comparison of images into perceptual rating scores in previous studies. Dubey et al. [], Naik et al. [], Kiapour et al. [], Jou et al. [] and Sartori et al. [] obtained perception scores based on the Microsoft TrueSkill algorithm []. Alternatively, Salesses et al. [], Ordonez and Berg [] and Zhang et al. [,] achieved this by adopting a statistical method similar to the concept of “strength of schedule” [] in sports matches. The latter approach was used as the basis for calculating the perception scores in our research. We define the win (Wi,u) and loss (Li,u) frequencies of image i for a perceptual attribute u as:
where , , represent the counts of image i won, lost, or tied in the comparisons, respectively. As a result, the perceptual rating score (Qi,u) of each image i with respect to perceptual indicator u can be defined as:
where and denote the total number of images i won and lost, respectively. The ranked score Qi,u is simply corrected by taking into account the ranked situation of these images that image i is compared with. Without losing generality, we rescale the perceptual score to a range between 0 and 10 (inclusive), i.e., adding an offset value 1 to obtain the minimum perceptual score of 0 and a multiplier 10/3 to ensure the maximum perceptual score is 10.
3.2. Street View Images of Case Study Areas
The street view images of study areas were obtained from Tencent Maps (https://map.qq.com/, accessed on 8 April 2020), one of the largest online map service providers in China []. Developers could collect street view images along urban streets using application programming interfaces (APIs) provided by Tencent Maps. The location information we need to provide for the samples includes the longitude and latitude, which can be generated from the road network data on OpenStreetMap.org. In this study, we captured street view images at four orientations (0, 90, 180 and 270 degrees) at an interval of 100 m along urban streets to depict the real urban environment. The two case study areas are Beijing and Chengdu, which are both regarded as among the most important cities in China. Beijing, as the capital and the political and cultural center of China, is a famous ancient capital and a modern international city. Chengdu, as an important central city of Western China, as well as China’s trade and logistics center and comprehensive transportation hub, is one of the most rapidly developing cities in China. We focused on the areas within the 5th ring road of Beijing and within the beltway of Chengdu, which cover most of their built-up areas. We collected 204,040 street view images for Beijing and 223,108 street view images for Chengdu. Figure 1 shows the case study areas and Tencent street view image samples in this study.
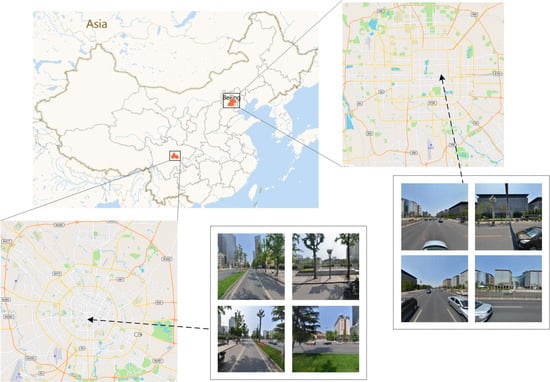
Figure 1.
Street view image samples of the case study areas.
3.3. Point-of-Interest Data
POI is a term in geographic information system, which indicates all geographic objects with location and attribution information of the functional facilities in urban space, such as gas stations, hospitals, supermarkets and schools []. As a type of non-visual data, POI can accurately locate the functional facilities in urban space and contain detailed information, such as name, category, coordinate and classification of the specific facilities, which are important geospatial data and represent the distribution of functional facilities in urban regions. Intuitively, the POI data are correlated with the perception of public spaces, e.g., a higher level of “Public Facility” tends to mean livelier in public spaces. In this study, we requested the POI data via an API provided by Amap (https://www.amap.com/, accessed on 8 April 2020), whose map coverage and POI data are in the leading position in China, ensuring the comprehensiveness and accuracy of the POI data we used. Specifically, to explore the relationship between various types of POI and human perceptions, we obtained the POI data associated with the selected case study areas and the geographical location, i.e., the latitude and longitude, allowing us to calculate the distribution of POI on each street so as to combine the POI data with human perceptions of each street in the case study areas. Consequently, we attained 442,306 points, which belong to 21 types and lists in Table 1.

Table 1.
POI category taxonomy.
3.4. Housing Price Data
Housing prices in cities play a very important role in economics at both the macro and micro scales, such as gross domestic product (GDP) and household housing and non-housing markets [], which is an important socio-economic indicator and can inevitably be influenced by the public appearance of the local area. Consequently, to explore the relationship between urban perception and socio-economic dimensions, we employed the housing price data as a socio-economic indicator. According to the Anjuke (https://www.anjuke.com/, accessed on 15 June 2020) housing price data, which includes data on new housing prices and resale housing prices, the resale housing transaction volume forms the main part of the urban housing transaction volume. Hence, we chose the transaction price of resale housing to establish our housing price dataset as a better representation of the actual situation of urban housing prices. Specifically, to explore the association between housing prices and human perceptions, we obtained the housing prices of the main administrative districts in Chengdu.
4. Methods
4.1. The Proposed Data-Enabled Intelligence Framework
Figure 2 shows the system architecture of the proposed data-enabled intelligence framework. The framework contains two phases: (1) model training and application using deep learning and (2) linking multi-dimensional factors to perceptual criteria.
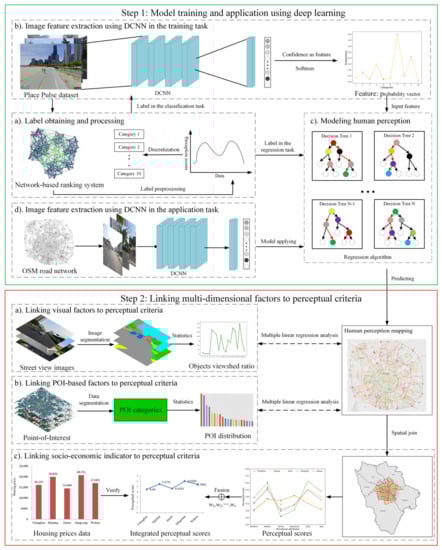
Figure 2.
The proposed data-enabled intelligence framework for measuring and analyzing human perception of urban regions.
- (1)
- Modeling human perception using deep learning:
To evaluate the human perception of urban space, a classification-then-regression strategy was introduced to train our models from six perceptual dimensions, namely, beautiful, boring, depressing, lively, safe and wealthy. The uncertainty and instability of human perceptual evaluation exist due to the subjective nature of human opinions, it is more practical to convert the perceptual task to a classification task and then revert to the regression task to obtain the continuous perception value. For each perceptual dimension, there are four sub-steps:
- (a)
- Obtaining the label of the Place Pulse dataset according to the ranking algorithm mentioned in Section 3.1 and discretizing the data and label of the Place Pulse dataset into multiple levels and each level is considered as a category.
- (b)
- In the classification task, a DCNN was employed to extract the high-dimensional spatial–visual features in each street view image from our datasets obtained from the previous step and that is then passed to a softmax function for computing the probability of each class.
- (c)
- In the regression task, the probability vectors that the DCNN model output are fed into the regression algorithm as input features to evaluate the perceptual value.
- (d)
- The trained models are used to predict human perceptions in the new urban region against six perceptual attributes separately by employing Tencent street view imagery as the proxy for the urban visual environment.
- (2)
- Linking multi-dimensional factors to perceptual criteria:
To explore the associations between multi-dimensional city factors with urban perceptions, multi-source data are employed for experimental analysis. The phase includes three procedural components:
- (a)
- Linking the objective environment in the visual experience to perceptual criteria, we utilized multiple linear regression analysis to analyze the dependence between visual elements and human perceptions, where the visual elements are extracted from street view images by using image segmentation technique and the perceptual scores are assessed by our models.
- (b)
- Linking the functional facilities in the public space to perceptual criteria, we used multiple linear regression analysis to explore the associations between facility attributes and human perceptions, where the facility attributes are obtained from POI data.
- (c)
- We extended the spatial scale of human perception to the district level. We utilize the housing price data as a socio-economic indicator to explore the links between the socio-economic indicator and the urban physical environment in this study. Consequently, the analyses results can be applied to demonstrate the effectiveness of our method from a multi-aspect; meanwhile, the urban perception can be thoroughly analyzed in multiple aspects.
4.2. Modeling Human Perception Using Deep Learning
The human perception measurement can be simulated by using artificial “eyes” and “brain” []. In our study, we model human perception by computer vision as “eyes” and machine learning as “brain” from six perceptual dimensions based on the classification-then-regression strategy. Figure 3 shows the system architecture of human perceptions modeling.
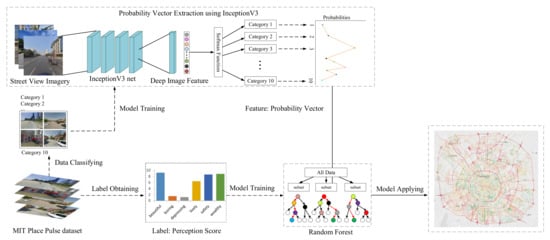
Figure 3.
The system architecture of human perceptions modeling.
The processing pipeline starts with the classification task to output the probability vector, then the softmax output, which can be interpreted as model confidence, followed by the quantification of human perception via a probabilistic inference to transform it into a regression task. Specifically, DCNNs are very similar to human visual systems: they both use restricted receptive fields and a hierarchy of layers that progressively extract more and more abstracted features []. This motivated us to employ InceptionV3 [], a well-constructed DCNN network, as a model in the classification task to simulate the human perceiving process and train the model to learn visual characteristics that may influence human perceptive judgment. Then, a Random Forest (RF) algorithm [], which has been proven to have excellent performance in model fitting [], was employed as our regression model to judge the perceptual value from the InceptionV3 model confidence of each class which relies on high-dimensional human perception characteristics.
Model training includes the training for the InceptionV3 model and RF model.
First, for the training of the InceptionV3 model, the Place Pulse 2.0 dataset was sampled and discretized into different categories from six perceptual attributes. Followed by a taxonomy that divides the perception scores into N levels with equal unit intervals [bn, bn+1), n = (0, 1, …, N − 1) and each level is treated as a category. For example, the images of perception scores fallen in the range [0,1] will be annotated as the same category. The perception scores are scaled to a range from 0 to 10; consequently, we obtained 10 perception categories. The label information was then fed into the InceptionV3 architecture for supervised training to classify any given street image into a perception category. Specifically, for typical image i, we can obtain the prediction probability vector of such classification from the softmax output of the InceptionV3 model as follows:
where pi indicates the probability that the image is predicted as category i.
Next, the similarity was analyzed across different probability vectors and perception scores were calculated within the street view imagery through RF algorithm. For the training of the RF model, the input features that we obtained from the InceptionV3 model and the input labels that we calculated in Section 3.1 were fed into it. Specifically, the RF model is composed of multiple CART regression trees. For a specific CART regression tree i, its inputs also include features and labels coming from a random sampling of the input data and the prediction results of the CART tree i can be modelled as follows:
where , presents the vector-matrix of input feature and the vector-matrix of input label of CARTi, respectively. The final prediction result of the RF model is the mean of all the predicted results of CART trees, i.e., predicted perceptual score, which can be defined as:
Finally, we employed the acquired Tencent street view images as the proxy for the natural scene of case study areas to test the application effect of our method, utilized the InceptionV3 model to extract the probability vectors of each perceptual category and combined with the RF model to evaluate the human perception of target cities.
4.3. Linking Multi-Dimensional Factors to Perceptual Criteria
Ordonez et al. [], Naik et al. [] and Jacobs et al. [] have proven that visual elements, urban functional areas and socio-economic indicators are correlated with human perceptions. In order to explore their relevance to human perception evaluation and significant factors on urban scene optimization, we linked multi-dimensional factors to human perceptions of the case study areas.
4.3.1. Linking Visual Factors to Perceptual Criteria
Numerous works of literature [,,] have proven that visual elements highly contribute to human perceptions. To explore whether our model can use similar visual cues to make similar judgement as humans do, we investigated the dependence between human perceptions and visual elements used in multiple linear regression analysis. In return, we can demonstrate the validity of our method by identifying driving factors from the aspect of a visual element. Meanwhile, the analysis of visual elements is of great significance in exploring visual factors in urban scene optimization. Figure 4 illustrates an overview of the technical procedures carried out in this analysis. Here, in each of the six independent analyses toward six different attributes, the perceptual scores are predicted by our models and the visual element descriptors are calculated by using the segmentation results extracted by the DeeplabV3+ model.
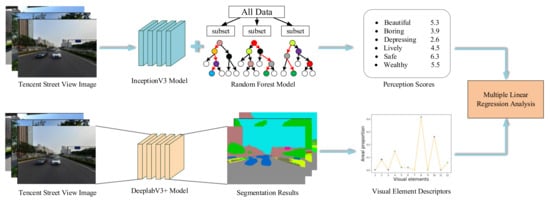
Figure 4.
Multiple linear regression analysis between the perceptual scores and the visual elements.
First, to extract the street scene elements, we employed the state-of-the-art semantic segmentation network DeepLabv3+ []. Specifically, we trained the DeepLabv3+ on the ADE20K dataset to parse each acquired Tencent street view image for extracting visual elements of the urban physical environment. ADE20K is a densely annotated dataset, which spans a range of diversely annotated scenes, objects and parts of objects. By ranking the pixel ratios of natural scene categories in the dataset, the top 150 categories were selected to build a scene parsing benchmark of ADE20K []. Based on this, we believe that the 150 categories can be taken as the basic visual objects influencing human perceptions and we can completely extract the visual elements that have impacts on human perceptions toward urban regions on street view scenes.
Next, we introduced the visual element descriptor for scene quantitative representation by utilizing the extracted visual elements. First, we defined the objecti to represent the visual objects i of image I. Using this, we were able to define the that represents the areal proportion of the objecti in image I as:
where denotes the number of pixel in objecti, indicates the total number of pixel in image I. Consequently, for typical image I, the visual element descriptor D can be represented by the vector-matrix:
Finally, for a specific perceptual indicator u, taking the visual element descriptors as independent variables and using the perception scores that our models predicted in the case study areas as dependent variables, we can proceed for multiple linear regression analysis. Using this, the multiple linear regression analysis model is as follows:
where is an unobserved error term, the is the regression coefficient matrix, which indicates the quantitative relationship between independent variables and dependent variables, but not the importance of the independent variables in the multiple linear regression analysis models. To compare the contribution of each independent variable to the perceptual indicator, the influence of the unit must be eliminated []. For this reason, it is necessary to standardize the variable value when carrying out linear regression, that is, the variable minus its mean and divided by its standard deviation estimation. The standardized regression model can be defined as:
where the denotes the standardized coefficient matrix. By doing this, the effect of each visual element on model perception judgment could be measured by observing the standardized coefficient of each independent variable. The larger the value, the greater the influence on the dependent variable.
4.3.2. Linking POI-Based Factors to Perceptual Criteria
Human perceptions tend to align with the actual functional areas of the cities []. In addition, POI data contain abundant facility attribute information such as life service, business and transportation facilities, which are often applied to study the classification of urban functional areas []. Meanwhile, previous studies showed that POI is also effective in urban space evaluations [,,]. Inspired by their work, we assessed the effects of multiple POIs on urban perceptions by multiple linear regression analysis to explore whether human perception prediction of our models is consistent with facility attributes around the adjacent street. Figure 5 presents an overview of the analytical approach in this case. The analysis is conducted for each of the six perceptual attributes individually. For each perceptual attribute analysis, the perceptual scores are evaluated by our models and the POI categories distribution are calculated by counting the POI numbers.
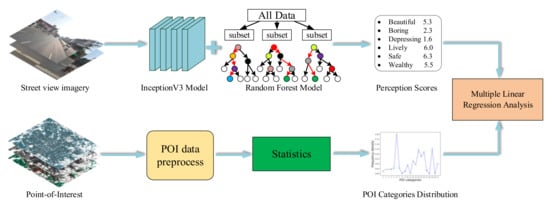
Figure 5.
Multiple linear regression analysis between the perceptual scores and the POI data.
It is worth pointing out that urban street space is the focus of this study, so the category and quantity of POI along the road network are the main aspects we concerned about. To calculate the number of each category of POIs (shown in Table 1) along the urban street, we served as the first step in extracting each POI category. Second, to analyze the POI distribution along each side of the streets, we established a buffer zone in respect to both sides of the road network to count the number of each POI category falling in the zone. The geographical location, i.e., the latitude and longitude, is the pivot to link streets with POI data. For a specific street s, let Ni, i = (1, 2, …, 21), represent the number of the i-th POI category in the street, we calculated the frequency fi for the i-th POI category in the street as follows:
where the Ss represents the total number of POI in the street s. Accordingly, the POI distribution matrix Vs of street s is denoted by:
The matrix Vs has the complete information which implies the spatial distribution of POI in the street s. Using this, we took the POI distribution matrixes as independent variables and using the perception scores that our models predicted as dependent variables to proceed for multiple linear regression analysis. Thereafter, the contribution of different independent variables to the dependent variables was compared by fitting the standardized coefficient matrix (achieved in Equation (14)).
4.3.3. Linking Socio-Economic Indicator to Perceptual Criteria
The finding that urban physical appearance is correlated with the actual socio-economic indicators has been reported in [,,,]. On one hand, urban perception not only can help understand the built environment of the urban regions but also can identify areas vulnerable to economic deprivation []. On the other hand, the literature [] employed street view imagery to evaluate the neighborhoods information to predict the properties valuation. Based on these theories, the connection between the urban perception and the housing prices is investigated, which aims to provide evidence of whether the urban physical environment influences socio-economic dimension and further assists in validating urban perception predicted by our models can promote the optimization of urban space so as to link housing prices in urban communities.
Firstly, we employed the administrative district as the quantifiable unit and spatially joined the street lines and their average perception scores to the selected district.
Secondly, we integrated the six perceptual scores into a comprehensive score to allow better comparison with the housing prices data. Inspired by Gong’s work [], we introduced a correlation coefficient to determine the weight wi of six perceptual attributes according to the interaction between different evaluation attributes. The weight wi is defined as follows:
where rij describes the correlation coefficient between i-th and j-th perceptual indicators. Thus, the multi-scale fusion score of perceptual attributes can be expressed as follows:
where Fr represents the fusion score of administrative district r, is the score of i-th perceptual indicator in administrative district r.
Finally, we used the fusion score Fr and the housing prices of the corresponding administrative district to correlate human perceptions with the socio-economic indicator.
5. Experiment and Results
Three types of expereiments have been conducted to demonstrate the effectiveness of the proposed framework. We first evaluated the perception prediction performance. Then, we investigated the full-coverage spatial distribution map of human perceptions and the correlation among all perceptions. Finally, the experiment of linking multi-dimensional factors to perceptual criteria was implemented to explore the associations between human perceptions and urban physical environment.
5.1. Modeling Human Perception Using Deep Learning
5.1.1. Dataset and Training Details
We trained our classification and regression models based on the dataset sampled from Place Pulse 2.0 along with six perceptual metrics separately, using a single Nvidia GTX 1070 graphics card. Specifically, we first trained the InceptionV3 model, which was pre-trained on the ImageNet [], with our dataset sampled from the Place Pulse 2.0 dataset. Then, the probability vectors output by the InceptionV3 model and their corresponding perception scores are fed into the RF model for training, as input features and input labels respectively. The standardized approach used in the literature [] has been followed to present the results in Table 2 and Table 3. Specificially, Table 2 reports the details of the DCNN module and Table 3 shows the details of the dataset and regression algorithm.
Table 2.
Reporting the DCNN of this study used.
Table 3.
Reporting the regression algorithm of this study used.
5.1.2. Experiments Setting and Metrics
We experimented in respect to six perceptual metrics: beautiful, boring, depressing, lively, safe and wealthy. In addition to prove the effectiveness of the proposed method and verify the performance of the models used in this paper, we conducted several groups of comparative experiments.
First, we compared our models with the state-of-the-art research of urban perception on the Place Pulse 2.0 dataset reported by Zhang’s []. Specifically, Zhang’s framework used DCNN to extract image features with training on the image features by using Radial Basis Function (RBF) kernel SVM to formulate the human perception prediction problem as a binary classification task. Then, the positive confidence of the SVM model was taken as the value of the perception.
Next, we conducted an experiment using the InceptionV3 for regression task to evaluate urban perception directly, to evaluate the effectiveness of the classification-then-regression strategy in this study.
Finally, various strategies were implemented to select a more effective way to modeling human perceptions, i.e., to select a more effective classification way to extract the probability vectors and feed them to the RF as input features. Specifically, because the perceptual scores range from 0 to 10, we divided our datasets into two categories, five categories and 10 categories based on the interval of perception score to conduct experiments from six perceptual attributes.
We conducted tests on each of the six perceptual models against the six perceptual attributes. We employed the evaluation metrics commonly used in classification and regression tasks, i.e., the accuracy (ACC) for classification model and the mean square error (MSE), the root mean square error (RMSE) and the mean absolute error (MAE) for the perception prediction regression model. They are calculated using the following formulations:
where TN represents the number of negative classes predicted as negative classes; TP is the number of positive classes predicted as positive classes; FP is the number of negative classes predicted as positive classes and FN is the number of positive classes predicted as negative classes. The yi and ti indicate the model rating score and perceptual rating score for each image, respectively, and n refers to the total number of samples.
5.1.3. Experimental Results and Discussion
The performance of the classification models is presented in Table 4. The results of the perception models evaluated using different methods (MAE, MSE and RMSE) are shown in Table 5, Table 6 and Table 7, respectively. In these tables, the “DCNN + SVM” refers to Zhang’s method, the minor numbers in bracket indicate the number of categories the dataset has been divided, e.g., “InceptionV3 (2)” refers to the experiment of dividing the dataset into two categories, similarily for the “InceptionV3 (5)” and “InceptionV3 (10)” refer to ones with five and 10 categories. The models were validated using ten-fold cross-validation.
Table 4.
Performance of the classification models (ACC).
Table 5.
Performance of the perception models (MAE).
Table 6.
Performance of the perception models (MSE).
Table 7.
Performance of the perception models (RMSE).
As can be seen from the above results, using InceptionV3 to classify images into two categories has the best classification effect, while classifying images into 10 has the worst result. However, when the IncpetionV3 model is combined with RF algorithm, the one with 10 classification tasks performed the best, in all evaluation matrics of MAE, MSE and RMSE. In particular, as we can see from Table 5, Table 6 and Table 7, it has better performance than only using InceptionV3 to evaluate human perception when we introduce the classification-then-regression strategy based on InceptionV3 and RF algorithm. Moreover, the performance of our models is better than Zhang’s framework [], which means our models are more effective in evaluating urban perception. Further analysis of the performance of our models, in the case with a maximum of a 10-point ceiling, our fitting error for the model rating scores was, on average, within 2 points. This is a good indication of the feasibility and effectiveness of our method by combining the probability vectors extracted from the InceptionV3 model and the human perception of urban regions measured by the RF algorithm. Furthermore, we can see that the human perceptions of “boring”, “depressing” and “wealthy” had slightly higher errors than the “beautiful”, “lively” and “safe” ones. One possible reason behind this phenomenon may be interpreted as the variances of people’s understanding of these concepts. This suggests that there is a relatively consistent subjectivity with the terms “beautiful”, “lively” and “safe”, whilst there is inconsistency with “boring”, “depressing” and “wealthy”. The insufficient number of comparisons available for the latter three indicators might be another factor; for example, for the “safe” perception, 7.67 comparisons per image on average were collected, but for the “boring” perception, 2.40 comparisons per image on average were collected in Dubey’s work [].
5.2. Perception Mapping in Case Study Areas
5.2.1. Full-Coverage Distribution Map of Human Perceptions
In this experiment, we constructed a city scale perception of selected areas of Beijing and Chengdu to verify the effectiveness of the proposed models. We used a two-step process to predict the perceptual distributions in new urban areas based on the probability vectors embedded in the RF model. First, the perceptual scores of Beijing and Chengdu were obtained by feeding street view images to our models, which rely on visual cues of images. Then, we employed the street as the visualization unit, by aggregating all the images into their corresponding streets to calculate the average perceptual scores. For a more efficient observation of the perception maps, four classes were created by adopting the method “Natural Breaks” to classify perceptual scores, which is a commonly used map classification algorithm proposed by Jenks []. Figure 6 and Figure 7 present the generated urban perceptual spatial distribution maps. We applied the coloring schemes commonly adopted in the discipline, i.e., cold colors indicate positive perceptions and warm colors indicate negative ones.
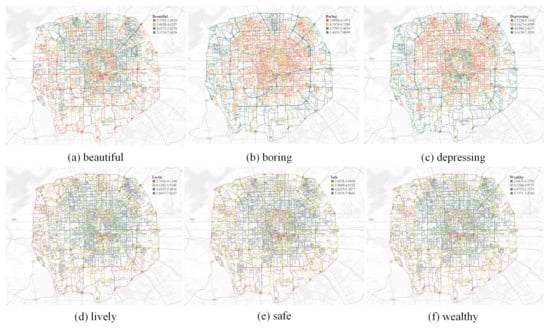
Figure 6.
Spatial distribution of the human perceptions with six perceptual attributes in Beijing.
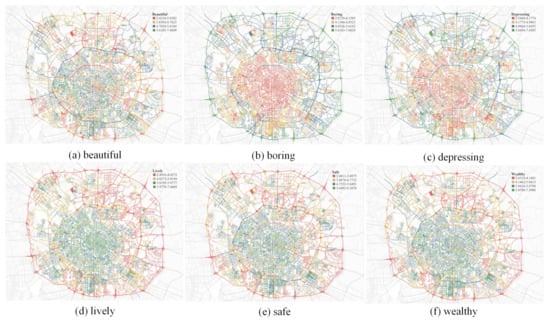
Figure 7.
Spatial distribution of the human perceptions with six perceptual attributes in Chengdu.
As shown in Figure 6 and Figure 7, the downtown areas are generally more “lively”, “safe” and “wealthy”, but less “boring” and “depressing” compared with the outskirts. Moreover, the ring road and highway are more “depressing” and “boring” than other types of roads. As one can observe in Figure 6, there is a clear pattern that the northern zone of Beijing has more positive perceptions than the southern zone. It is also apparent in Figure 7 that the overall positive perception scores in the southern and western parts of Chengdu are higher than in the northern and eastern parts. These results are consistent with the actual situation of urban construction.
Histogram statistical distribution of human perception of Beijing and Chengdu were further created to quantify the distribution of human perception evaluated by our models at city scales. We employed the street perception scores of each street as the data for the histogram analysis and the number of groups in the histogram is 10. Figure 8 and Figure 9 present the histogram analysis results of urban perceptual spatial distribution maps corresponding to Figure 6 and Figure 7, respectively.
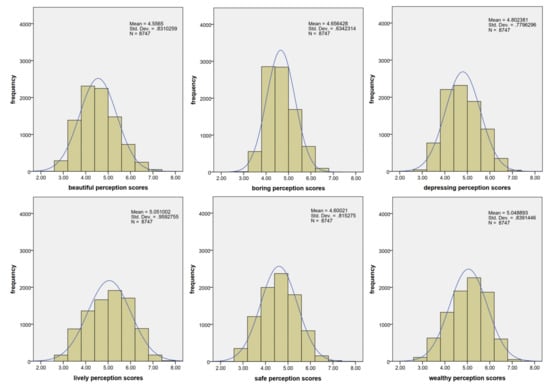
Figure 8.
Histogram distribution of human perceptions of Beijing.
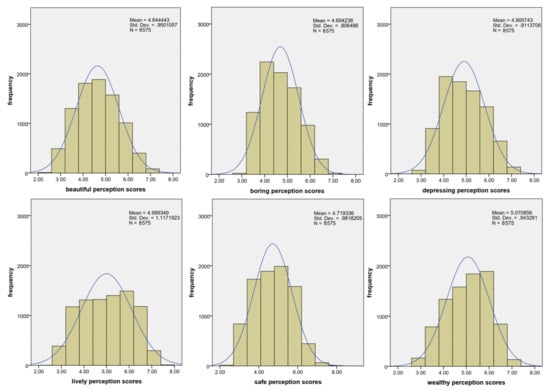
Figure 9.
Histogram distribution of human perceptions of Chengdu.
As shown in Figure 8 and Figure 9, although the histogram statistical results of different perceptual dimensions vary, they all follow the normal distribution, which describes a natural pattern of distribution. Figure 8 and Figure 9 also show the distribution state of perception results, including the distribution shape, center position and dispersion degree of perception. It can be observed that the Std. Dev of the histogram distribution of perception results in Chengdu was larger than that in Beijing irrespective of the perception dimension. This result might be caused by variances in the development status of the two cities. Beijing is more likely a developed city and its built environment tends to be more mature, with less perception of high values and low values. Chengdu is a developing city; many areas are still under development, or newly developed, which leads to their more scattered perception results when compared to Beijing. The parameters of the histogram are shown in Table 8, where N is the sample size, Mean is the mean value of sample data and Std. Dev is the standard deviation of sample data, which describes the dispersion degree of data distribution, i.e., the larger the Std. Dev, the more scattered the data distribution.
Table 8.
Performance of the perception models (RMSE).
5.2.2. Detailed Results for Specific Location
Figure 10 shows closer views of the spatial distribution of the human perceptions. In Beijing, zone A is the ancient city area and consists of traditional Hutongs where there may be full of old houses and narrow streets. Street view images of zone B, C and D show that these regions are similar to the dilapidated village, rather than a city. This is a reason why the zones were evaluated to be less beautiful, safe and wealthy. Instead, zone E and G are the Beihai Park and the Summer Palace, respectively, which belong to the ancient Chinese royal gardens. Zone F mainly covers Tsinghua University, which is one of the top universities in China with a beautiful campus environment. Zone H is the location of Beijing Sun Park, which is a comprehensive multi-functional arge scale cultural recreational park mainly dominated by gardening and greening. It is reasonable that they are predicted to be more beautiful. In Chengdu, zone A is near East Chengdu Railway Station, where the streets take the form of traffic arteries and overpasses. The street view images show zone B resembles a village, where many dilapidated buildings are near the streets. Zone C is mainly where some logistics parks and agricultural markets are located, billboards and cluttered goods are everywhere in these areas. Zone D is near Chengdu Railway Station, the public facilities in this area have been built for a long time and the facilities are seriously aging. In contrast, zone E, F, G and H are parks or tourist areas with good greenery and environment. Therefore, zone A, B, C and D of Chengdu are often predicted to have lower scores for positive perceptions, but zone E, F, G and H are commonly evaluated with higher scores.
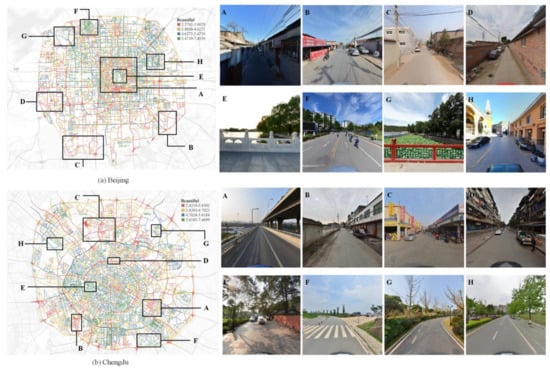
Figure 10.
(A–H) Local analysis of the perceptual map, taking “beautiful” perception as an example and the image represents an example of the corresponding zone.
5.2.3. Correlation Analysis among Indicators
In order to further explore the correlation among the six perception indicators, we conducted a crossover Pearson correlation analysis of the six attributes. The Pearson r is mathematically represented as follows:
where Xi is the perceptual value of indicator X, similarly, Yi is the perceptual value of indicator Y.
Figure 11 presents the resulting matrix of the Pearson correlation coefficients with different perceptual attributes from Beijing and Chengdu. We noticed that “safe” perception has highly positive correlations with “beautiful”, “lively” and “wealthy” perceptions, while “lively” perception has strong negative correlations with “boring” and “depressing” perceptions. Moreover, the “depressing” perception is negatively correlated with other attribute perceptions except for “boring” perception. These results are reasonable and consistent with our cognition.
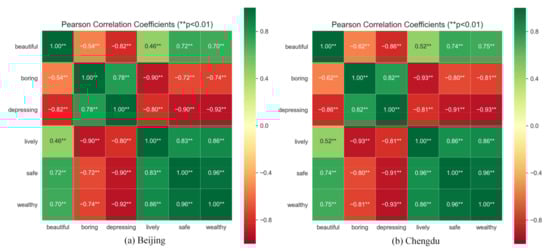
Figure 11.
Pearson correlation matrix among the six perceptions using data from Beijing and Chengdu.
5.3. Results of Linking Multi-Dimensional Factors to Perceptual Criteria
The strategy of linking multi-dimensional factors to perceptual criteria presented in Section 4.3 is a feasible way to explore the significant impact factors on urban planning optimization. In this section, we demonstrate this point by performing experiments on associations in terms of the visual element, facility attribute and socio-economic indicator. In the experiment of linking visual factors to perceptual criteria, the street view images of Beijing and Chengdu as well as their perceptual scores were used and the results are shown in Section 5.3.1. In the experiment of linking POI-based factors to perceptual criteria, we employed the POI data as described in Section 3.3 and the perceptual scores of each street predicted by our models, the results are presented in Section 5.3.2. In the experiment of linking socio-economic indicator to perceptual criteria, we used the housing price data of the main administrative districts in Chengdu and the corresponding perception scores, the results are described in Section 5.3.3.
5.3.1. Results of Linking Visual Factors to Perceptual Criteria
As shown in Figure 12, we present the results of visual element factor identification based on the multiple linear regression analysis. The top five and bottom five object categories out of the impactful 151 ones are ranked and listed in respect to all six perceptual attributes, with a significance level of p < 0.01. In Figure 12, the length of the bar denotes the value of the standardized coefficient to illustrate the contribution made by visual objects to perceptual metrics in this experiment.
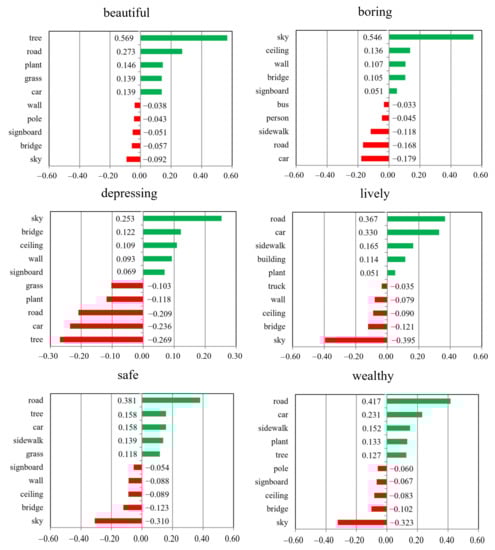
Figure 12.
Results of the multiple linear regression analysis between the visual elements and the perception scores.
As one can observe in Figure 12, natural elements such as “tree”, “plant” and “grass” are positively correlated with the “beautiful” perception. Plants can purify the air, beautify the environment and add beauty to the urban environment and hence play a key role in maintaining the urban ecological balance. This result aligns with Olmsted’s theory of integrating ecosystem into urban infrastructure []. Meanwhile, Ashihara concludes that greenery brings a feeling of tranquility and peacefulness [] and Perkins points out that the personalization of property can make the street environment appear safer []. Consistent with the theory, the “natural” objects and “car” category are both positive contributors to “safe” perception. Moreover, we noticed that “road”, “sidewalk” and “car” categories greatly contribute to the “lively” perception. This relationship is exactly in line with Jacobs’ conclusion of enhancing the liveliness of a city []. Meanwhile, “lively” and “wealthy” categories tend to show a strong positive correlation in the urban perception, the “road”, “sidewalk” and “car” categories also have a great positive contribution to the “wealthy” perception. On the contrary, the “sky”, “bridge”, “signboard” and “wall” categories are negatively correlated with almost all of the six perceptual dimensions, except for the two negative indicators of “depressing” and “boring”. For example, the “sky” category is positively correlated with the “depressing”, which may conflict with the common sense that the ability to view the sky (open space) would make people less depressed. The main reason is that the basic dataset for training our proposed model is the Place Pulse dataset and the model tends to learn the pattern of the dataset. Specifically, there are a large number of desolate landscape images with a large proportion of the sky, which are rated high score in “depressing”. The correlation analysis among indicators presented in Section 5.2.3 shows that the “depressing” perception is negatively correlated with other attribute perceptions, except for “boring” perception; thus, the “sky” is also positively correlated with the “boring”, but negatively correlated with other indicators. In addition, the increase of the “wall” category is accompanied by the decreased permeability, blocked vision and reduced sunlight; hence, it brings people a sense of closure [], which tends to be a negative element in almost all the six dimensions. The “bridge” and “signboard” are negative elements in the positive indicators of urban perception, because they are mainly represented by the crossroads or overpasses in the urban regions. These places mainly serve for transportation, which tends to be perceived as “boring”.
In this experiment, we presented how we can use the multiple linear regression analysis to assess the effects of visual factors on urban perceptions. To sum up, our results provide evidence of the effectiveness of our models, which used similar visual cues to make a judgement as human beings do. Later on, the sensitive visual factors can be further applied to explore the significant visual factors in urban planning optimization.
5.3.2. Results of Linking POI-Based Factors to Perceptual Criteria
As shown in Figure 13, we present the results of POI-based factor identification by using the multiple linear regression analysis. Most of the POI elements are positive perceptions in urban space; therefore, for the six perceptual attributes in this paper, most elements contribute to one side (positive or negative, i.e., there are usually less than five elements that contribute to the other side). In order to make the display effect more regular and unified, different from the result display of visual elements, the top 10 objects categories out of the 21 affecting POI categories are ranked and listed according to all six perceptual attributes, with a significance level of p < 0.01. The length of the bar represents the value of the standardized coefficient, an indicator of the contribution of each POI category to the perceptual metrics in this experiment.
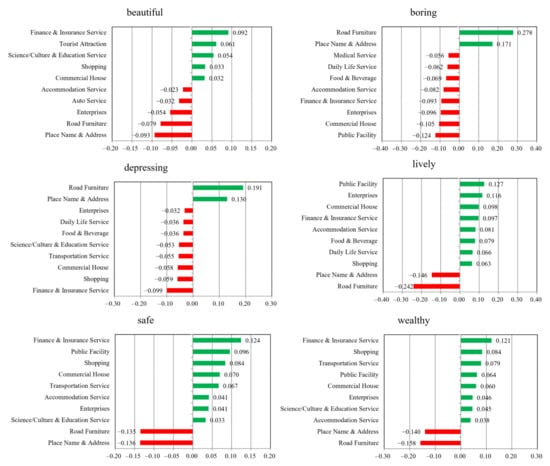
Figure 13.
Results of the multiple linear regression analysis between the POI and the perception scores.
In Figure 13, we can observe that the contribution among these POI categories varies between different perceptual metrics. For instance, the POI category of “Tourist Attraction” is positively correlated with the “beautiful” perception, which is intuitively considered to represent a higher level of beauty. Looking closer at the results, the “lively” perception is most sensitive to the “Public Facility”, “Commercial House”, “Food & Beverage” and other life functional facilities because they are indications of being more vivid. Moreover, the positive contributors of “safe” and “wealthy” mainly come from commercial elements, such as “Finance & Insurance Service”, “Shopping” and “Enterprises”, which symbolize prosperity and wealth and tend to show a gorgeous and neat appearance in most cases. Meanwhile, the chaos of the physical environment in a place, such as the poorly maintained buildings and filthiness of streets, reduces the perception of a “safe” feeling [,,]. In contrast, a well-maintained appearance will enhance the sense of security of the human subconscious, which will contribute to a place being perceived as “safe”. Regarding the “Place Name & Address” and “Road Furniture”, they are negative objects in the four positive perceptions, but are highly positively correlated with the two negative perceptions “depressing” and “boring”. Because they are mainly represented by the urban expressway entrance and exit, tunnel, overpass, toll gate and other traffic places, as well as the road number information, etc., these sites tend to be considered to provide a sense of hollowness and vapidity.
In this experiment, we presented how we can use the multiple linear regression analysis to assess the effects of POI-based factors on urban perceptions. Consequently, this case study complements the visual element analysis result and shows that our models produced a great approximation to perceive the real experience in the urban physical space and indicates the feasibility and effectiveness of our proposed method by considering facility attribute information of POI. Moreover, the results of POI-based factor identification can be possibly extended to work out which facility drives human to perceive a place as “wealthy”, “beautiful” or other perceptual attributes to help urban planners to explore the significant factors to make city optimization decision.
5.3.3. Results of Linking Socio-Economic Indicator to Perceptual Criteria
As shown in Figure 14, we took Chengdu as a case study and spatially joined the street lines to its district. To make the study administrative district representative, the district will be selected where most of its area is covered by the case study streets. Consequently, the selected districts cover the downtown area of Chengdu, mainly including five administrative districts, namely, Qingyang, Jinjiang, Wuhou, Chenghua and Jinniu.
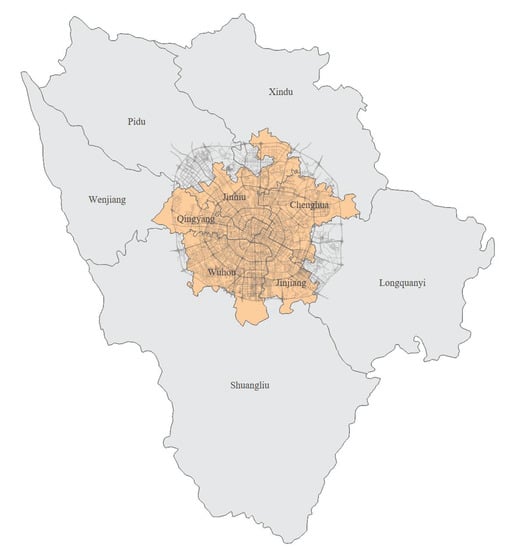
Figure 14.
Case study area: Administrative districts of Chengdu in this study involved.
Based on the perceptual scores of each street, we calculated the average scores of all streets in its district to obtain the perceptual result of the corresponding district. Figure 15 presents the perceptual results of different administrative districts.
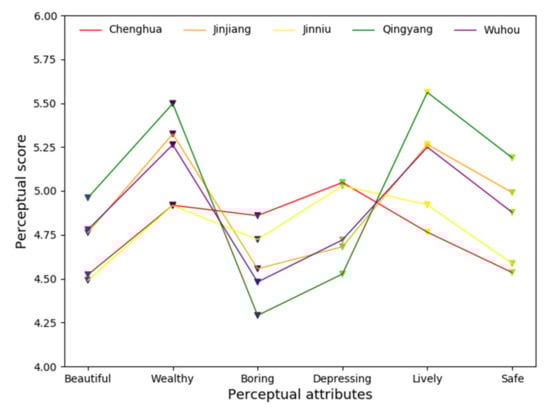
Figure 15.
The perceptual result with six attributes of each administrative district in Chengdu.
According to Equation (17), where rij was calculated in Section 5.1.2 and the results are shown in Figure 11, we obtained the weight wi i = (1,2, …, 6) as (0.416, −0.364, −0.460, 0.408, 0.503, 0.497), representing the weight of “beautiful”, “boring”, “depressing”, “lively”, “safe” and “wealthy”, respectively. Consequently, the resulting comprehensive perceptual scores of Chenghua, Jinjiang, Jinniu, Qingyang and Wuhou are 4.46, 5.47, 4.59, 6.03, 5.40, respectively. A higher score indicates better space quality of the region.
Furthermore, we obtained the average housing prices provided by Anjuke in the corresponding district on 15 June 2020, which were used to analyze the links between the urban perception evaluation and its housing prices. The analysis results are shown in Figure 16.
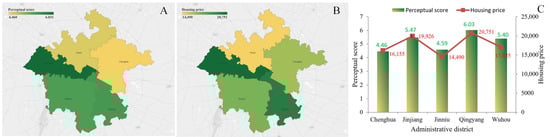
Figure 16.
Results of comparison between perceptual scores and housing prices in the main administrative district of Chengdu. Map (A) shows our predicted perceptual scores, map (B) shows housing price statistics and the mixed chart (C) shows specific statistics of the perceptual score and housing price.
In Figure 16, there is a strong correlation between housing prices and perceptual results. Furthermore, there is a strong positive Pearson correlation coefficient of 0.89 between our predicted human perceptions and housing prices, with a significance level of p < 0.01. The results have shown that the urban physical environment also influences a socio-economic dimension and further assists the validation of the optimization of the urban built environment which can drive the improvement of community housing price. This also implies the application value of our method in predicting human perceptions of a place.
6. Discussion
According to the experimental results demonstrated in Section 5, our proposed novel classification-then-regression strategy can better mitigate the uncertainties of human perceptions and, thus, achieved higher performance than existing work for evaluating urban perception in a more effective way. Moreover, the value of city scale data was further explored by our data-enabled intelligence framework, which used street view images, POI and housing prices data to analyze the links of the city scale data to urban perceptions.
We constructed a set of full-coverage spatial distribution maps of human perceptions of two cities, namely, Beijing and Chengdu. These maps have many opportunities to be utilized in a variety of ways. For research, urban researchers are able to further link arge scale human perceptions of six perceptual dimensions in the urban physical space and phenomena such as crime and economic deprivation. For planning, the maps of urban perception can take urban planners and researchers one step forward towards the understanding of the urban physical environment. It can also provide effective and readily available data reference for city decision-maker in identifying the areas that need to be optimized the most. In their daily lives, urban inhabitants and tourists can also benefit from the perceptual distribution maps by observing the places which are more beautiful, lively and safe in the city, so as to plan a more pleasant trips.
Meanwhile, by linking multi-dimensional factors to perceptual criteria using street view images, POI and housing prices data to explore the associations between human perceptions and city scale data. The results show that the visual elements and the facility elements are strongly correlated with our urban perceptions. For example, our models identified that the natural elements in the visual experience are always correlated with positive perceptions, especially the “beautiful” perception; a wall is a negative element in urban space, which is compatible with the literature in related fields. It is also clear that most of POI elements are positive elements in the urban perceptions, the abundance of POI elements reflects the facility status of a neighborhood, so neighborhoods with a higher level of public functional facilities are more likely to bring positive perceptions. In particular, the “lively” perception is most sensitive to those facilities such as “Public Facility”, “Commercial House”, “Food & Beverage” and other life functional facilities. But the facilities of “Place Name & Address” and “Road Furniture” are mainly represented by the urban expressway entrance and exit, tunnel, overpass, toll gate and other traffic places, as well as the road number information, etc., which means that they mainly serve for public transportation and tends to bring a sense of hollowness and vapidity, thus strongly contributing to negative perceptions. According to theese findings, these elements can be planned in the urban renewal area. Moreover, results indicate that the urban physical environment also influences a socio-economic dimension. In a city, where the built environment of the community is better, the housing price tends to be higher.
Briefly, this paper proposed an efficient data-driven approach for urban researchers and urban planners to better understand the built environment from a human perspective and proposed better urban planning or renewal strategies and design to improve the urban environment and promote urban studies.
The limitations of this work, which warrant our future works, are as follows: firstly, although street view imagery can provide abundant visual information of the static physical structures of urban appearance on almost every corner of urban streets, they do not cover all areas of urban space. Areas in urban space such as campus, parks, square and scenic spots also contribute greatly to human perceptions. With the rise of social media, a massive amount of images recording the beautiful or unique scenes of a city are now accessible. These can supplement the coverage of urban public space and can be considered and applied in our future studies. Secondly, urban perception is not just about the existence of a specific visual object, but also ties with local culture, which are affected by people’s cultural backgrounds. In future works, a local urban perception dataset from citizens who are aware of the local cultural background should be established. Meanwhile, other complex factors in the city should be considered in the urban perception, such as the economy, geographical location, commodity prices, education, culture, history and climate. Hence, our future work will extend our perception models to take more diverse data as input, such as cell phone signaling data and demographics of the neighborhood. Finally, the collection of street view images may not be able to keep up with changes in urban physical appearance. This may cause errors at the time that the human perception of urban region is quantified. These lagging issues should also be considered in future studies.
7. Conclusions
In this paper, we proposed a new data-enabled intelligence framework and approach to automatically evaluate human perceptions of the urban region in respect to six perceptual dimensions, namely, beautiful, boring, depressing, lively, safe and wealthy. Experimental results demonstrated that our proposed framework is a cost-effective and accurate way for predicting human perceptions of urban regions and can provide an efficient way to improve the understanding of human perceptions of the urban physical environment. Meanwhile, we conducted statistical analyses by linking multi-dimensional factors to perceptual criteria using street view images, POI and housing prices data. The results confirmed that the visual elements that may cause a place to be perceived as “beautiful”, “depressing”, “lively”, etc., where natural elements always induce positive perceptions. Meanwhile, the results also identified that human perception is significantly associated with the public facility in urban space. Additionally, our result evidenced that the urban perception also influences the housing prices of different neighborhoods in a city.
This work shows the value of employing machine learning methods to evaluate urban space perception and demonstrates the value of city scale data to urban perceptions. Urban perceptions were highly associated with both the visual elements—facility attributes and a socio-economic dimensions—which provide a great potential to translate the evidence obtained by our proposed framework to support for urban planners and researchers in developing insights into the underlying interactions between the urban environment and human perceptions. In future research, we will further consider human behavior in the urban public space and integrate additional social sensing data into our frameworks, such as human mobility, video in public space and public transport data.
Author Contributions
Conceptualization, methodology, validation, investigation, Haohao Ji and Linbo Qing; formal analysis, Haohao Ji, Linbo Qing, Yongqiang Cheng and Yonghong Peng; software, resources, data curation, Haohao Ji and Longmei Han; writing—original draft preparation, Haohao Ji; writing—review and editing, Linbo Qing, Yongqiang Cheng, Longmei Han and Yonghong Peng; visualization, Haohao Ji; supervision, Linbo Qing and Zhengyong Wang; project administration and funding acquisition, Linbo Qing and Longmei Han. All authors have read and agreed to the published version of the manuscript.
Funding
This research was funded by the National Natural Science Foundation of China under grant 61871278.
Acknowledgments
We acknowledge the funding received from the National Natural Science Foundation of China under grant 61871278.
Conflicts of Interest
The authors declare no conflict of interest.
References
- Ghahramanpouri, A.; Lamit, H.; Sedaghatnia, S. Urban social sustainability trends in research literature. Asian Soc. Sci. 2013, 9, 185. [Google Scholar] [CrossRef]
- Yıldız, S.; Kivrak, S.; Gultekin, A.B.; Arslan, G. Built environment design—Social sustainability relation in urban renewal. Sustain. Cities Soc. 2020, 60, 102173. [Google Scholar] [CrossRef]
- Frank, L.D.; Engelke, P.O. The built environment and human activity patterns: Exploring the impacts of urban form on public health. J. Plan. Lit. 2001, 16, 202–218. [Google Scholar] [CrossRef]
- Hong, J.Y.; Jeon, J.Y. Influence of urban contexts on soundscape perceptions: A structural equation modeling approach. Landsc. Urban Plan. 2015, 141, 78–87. [Google Scholar] [CrossRef]
- Ulrich, R.S. Visual landscapes and psychological well-being. Landsc. Res. 1979, 4, 17–23. [Google Scholar] [CrossRef]
- Hull, R.B.; Lam, M.; Vigo, G. Place identity: Symbols of self in the urban fabric. Landsc. Urban Plan. 1994, 28, 109–120. [Google Scholar] [CrossRef]
- Lynch, K. The Image of the City; MIT Press: Cambridge, MA, USA, 1960; Volume 11. [Google Scholar]
- Tuan, Y.F. Space and place: The perspective of experience. Leonardo 1978, 68. [Google Scholar] [CrossRef]
- Brownson, R.C.; Hoehner, C.M.; Day, K.; Forsyth, A.; Sallis, J.F. Measuring the built environment for physical activity: State of the science. Am. J. Prev. Med. 2009, 36, S99–S123. [Google Scholar] [CrossRef]
- Hannay, D.R. Mental illness in the community: The pathway to psychiatric care. Int. J. Rehabil. Res. 1983, 6, 47–53. [Google Scholar]
- Haymes, S.N.; Cresswell, T.; Vergara, C.J. In place/out of place: Geography, ideology, and transgression. J. Archit. Educ. 1997, 51, 138. [Google Scholar] [CrossRef]
- Kabisch, N.; Qureshi, S.; Haase, D. Human–Environment interactions in urban green spaces—A systematic review of contemporary issues and prospects for future research. Environ. Impact Assess. Rev. 2015, 50, 25–34. [Google Scholar] [CrossRef]
- Ludwig, R.B.J. Great American city: Chicago and the enduring neighborhood effect. Am. J. Sociol. 2013, 118, 1447–1449. [Google Scholar] [CrossRef]
- Montello, D.R.; Goodchild, M.F.; Gottsegen, J.; Fohl, P. Where’s downtown?: Behavioral methods for determining referents of vague spatial queries. Spat. Cogn. Comput. 2003, 3, 185–204. [Google Scholar]
- Gebru, T.; Krause, J.; Wang, Y.; Chen, D.; Deng, J.; Aiden, E.L.; Feifei, L. Using deep learning and Google Street View to estimate the demographic makeup of neighborhoods across the United States. Proc. Natl. Acad. Sci. USA 2017, 114, 13108–13113. [Google Scholar] [CrossRef] [PubMed]
- Li, X.; Ratti, C.; Seiferling, I. Quantifying the shade provision of street trees in urban landscape: A case study in Boston, USA, using Google street view. Landsc. Urban Plan. 2018, 169, 81–91. [Google Scholar] [CrossRef]
- Dubey, A.; Naik, N.; Parikh, D.; Raskar, R.; Hidalgo, C.A. Deep learning the city: Quantifying urban perception at a global scale. In Proceedings of the European Conference on Computer Vision, Amsterdam, The Netherlands, 8–16 October 2016; pp. 196–212. [Google Scholar]
- Liu, L.; Silva, E.A.; Wu, C.; Wang, H. A machine learning-based method for the large-scale evaluation of the qualities of the urban environment. Comput. Environ. Urban Syst. 2017, 65, 113–125. [Google Scholar] [CrossRef]
- Liu, M.; Han, L.; Xiong, S.; Qing, L.; Ji, H.; Peng, Y. Large-scale street space quality evaluation based on deep learning over street view image. In Proceedings of the International Conference on Image and Graphics, Beijing, China, 23–25 August 2019; pp. 690–701. [Google Scholar]
- Naik, N.; Kominers, S.D.; Raskar, R.; Glaeser, E.L.; Hidalgo, C.A. Computer vision uncovers predictors of physical urban change. Proc. Natl. Acad. Sci. USA 2017, 114, 7571–7576. [Google Scholar] [CrossRef]
- Naik, N.; Philipoom, J.; Raskar, R.; Hidalgo, C.A. Streetscore—Predicting the perceived safety of one million streetscapes. In Proceedings of the Computer Vision and Pattern Recognition, Columbus, OH, USA, 23–28 June 2014; pp. 793–799. [Google Scholar]
- Ordonez, V.; Berg, T.L. Learning high-level judgments of urban perception. In Proceedings of the European Conference on Computer Vision, Zurich, Switzerland, 6–12 September 2014; pp. 494–510. [Google Scholar]
- Porzi, L.; Bulo, S.R.; Lepri, B.; Ricci, E. Predicting and understanding urban perception with convolutional neural networks. In Proceedings of the 23rd ACM international conference on Multimedia (MM ’15), Brisbane, Australia, 26–30 October 2015; pp. 139–148. [Google Scholar]
- Salesses, P.; Schechtner, K.; Hidalgo, C.A. The collaborative image of the city: Mapping the inequality of urban perception. PLoS ONE 2013, 8, e68400. [Google Scholar] [CrossRef]
- Zhang, F.; Hu, M.; Che, W.; Lin, H.; Fang, C. Framework for virtual cognitive experiment in virtual geographic environments. ISPRS Int. J. Geo Inf. 2018, 7, 36. [Google Scholar] [CrossRef]
- Zhang, F.; Zhou, B.; Liu, L.; Liu, Y.; Fung, H.H.; Lin, H.; Ratti, C. Measuring human perceptions of a large-scale urban region using machine learning. Landsc. Urban Plan. 2018, 180, 148–160. [Google Scholar] [CrossRef]
- Zhang, F.; Wu, L.; Zhu, D.; Liu, Y. Social sensing from street-level imagery: A case study in learning spatio-temporal urban mobility patterns. ISPRS J. Photogramm. Remote Sens. 2019, 153, 48–58. [Google Scholar] [CrossRef]
- Wang, R.; Liu, Y.; Lu, Y.; Zhang, J.; Grekousis, G. Perceptions of built environment and health outcomes for older Chinese in Beijing: A big data approach with street view images and deep learning technique. Comput. Environ. Urban Syst. 2019, 78, 1–10. [Google Scholar] [CrossRef]
- Wang, R.; Xue, D.; Liu, Y.; Chen, H.; Qiu, Y. The relationship between urbanization and depression in China: The mediating role of neighborhood social capital. Int. J. Equity Health 2018, 17, 105. [Google Scholar] [CrossRef] [PubMed]
- Wolch, J.; Byrne, J.A.; Newell, J.P. Urban green space, public health, and environmental justice: The challenge of making cities ‘just green enough’. Landsc. Urban Plan. 2014, 125, 234–244. [Google Scholar] [CrossRef]
- Ulrich, R.S. Aesthetic and affective response to natural environment. In Behavior and the Natural Environment; Altman, I., Wohlwill, J.F., Eds.; Springer: Boston, MA, USA, 1960; pp. 85–125. [Google Scholar] [CrossRef]
- Kaplan, R.; Kaplan, S. The Experience of Nature: A Psychological Perspective; Cambridge University Press: Cambridge, UK, 1989; Volume 35. [Google Scholar]
- Wherrett, J.R. Creating Landscape Preference Models Using Internet Survey Techniques. Landsc. Res. 2000, 25, 79–96. [Google Scholar] [CrossRef]
- Nasar, J.L. The Evaluative Image of the City. J. Am. Plann. Assoc. 1990, 56, 41–53. [Google Scholar] [CrossRef]
- Schroeder, H.W.; Anderson, L.M. Perception of personal safety in urban recreation sites. J. Leis. Res. 1984, 16, 178. [Google Scholar] [CrossRef]
- Anguelov, D.; Dulong, C.; Filip, D.; Frueh, C.; Lafon, S.; Lyon, R.; Ogale, A.; Vincent, L.; Weaver, J. Google street view: Capturing the world at street level. Computer 2010, 43, 32–38. [Google Scholar] [CrossRef]
- Naik, N.; Raskar, R.; Hidalgo, C.A. Cities are physical too: Using computer vision to measure the quality and impact of urban appearance. Am. Econ. Rev. 2016, 106, 128–132. [Google Scholar] [CrossRef]
- Seiferling, I.; Naik, N.; Ratti, C.; Proulx, R. Green streets—Quantifying and mapping urban trees with street-level imagery and computer vision. Landsc. Urban Plan. 2017, 165, 93–101. [Google Scholar] [CrossRef]
- Yao, Y.; Liang, Z.; Yuan, Z.; Liu, P.; Bie, Y.; Zhang, J.; Wang, R.; Wang, J.; Guan, Q. A human-machine adversarial scoring framework for urban perception assessment using street-view images. Int. J. Geogr. Inf. Sci. 2019, 33, 2363–2384. [Google Scholar] [CrossRef]
- Kiapour, M.H.; Yamaguchi, K.; Berg, A.C.; Berg, T.L. Hipster wars: Discovering elements of fashion styles. In Proceedings of the European Conference on Computer Vision, Zurich, Switzerland, 6–12 September 2014; pp. 472–488. [Google Scholar]
- Jou, B.; Bhattacharya, S.; Chang, S. Predicting viewer perceived emotions in animated GIFs. In Proceedings of the 22nd ACM International Conference on Multimedia (MM ’14), Orlando, FL, USA, 3–7 November 2014; pp. 213–216. [Google Scholar]
- Sartori, A.; Yanulevskaya, V.; Salah, A.A.; Uijlings, J.; Bruni, E.; Sebe, N. Affective analysis of professional and amateur abstract paintings using statistical analysis and art theory. KSII Trans. Internet Inf. Syst. 2015, 5, 1–27. [Google Scholar] [CrossRef]
- Herbrich, R.; Minka, T.; Graepel, T. TrueSkill: A bayesian skill rating system. In Proceedings of the 19th International Conference on Neural Information Processing Systems, Vancouver, Canada, 4–7 December 2006; pp. 569–576. [Google Scholar]
- Park, J.; Newman, M.E. A network-based ranking system for US college football. J. Stat. Mech. Theory Exp. 2005, 2005, 10014. [Google Scholar] [CrossRef]
- Long, Y.; Liu, L. How green are the streets? An analysis for central areas of Chinese cities using Tencent street view. PLoS ONE 2017, 12, e0171110. [Google Scholar] [CrossRef] [PubMed]
- Li, L.; Wu, X. Housing price and entrepreneurship in China. J. Comp. Econ. 2014, 42, 436–449. [Google Scholar] [CrossRef]
- Kheradpisheh, S.R.; Ghodrati, M.; Ganjtabesh, M.; Masquelier, T. Deep networks can resemble human feed-forward vision in invariant object recognition. Sci. Rep. 2016, 6, 32672. [Google Scholar] [CrossRef] [PubMed]
- Szegedy, C.; Vanhoucke, V.; Ioffe, S.; Shlens, J.; Wojna, Z. Rethinking the inception architecture for computer vision. In Proceedings of the Computer Vision and Pattern Recognition, Las Vegas, NV, USA, 27–30 June 2016; pp. 2818–2826. [Google Scholar]
- Breiman, L. Random forests. Mach. Learn. 2001, 45, 5–32. [Google Scholar] [CrossRef]
- Fernandezdelgado, M.; Cernadas, E.; Barro, S.; Amorim, D. Do we need hundreds of classifiers to solve real world classification problems. J. Mach. Learn. Res. 2014, 15, 3133–3181. [Google Scholar]
- Jacobs, J. The Death and Life of Great American Cities. Yale Law J. 1962, 71, 1957. [Google Scholar]
- Wong, M.S.; Nichol, J.; Ng, E. A study of the “wall effect” caused by proliferation of high-rise buildings using GIS techniques. Landsc. Urban Plan. 2011, 102, 245–253. [Google Scholar] [CrossRef]
- Chen, L.; Zhu, Y.; Papandreou, G.; Schroff, F.; Adam, H. Encoder-decoder with atrous separable convolution for semantic image segmentation. In Proceedings of the European Conference on Computer Vision, Munich, Germany, 8–14 September 2018; pp. 833–851. [Google Scholar]
- Zhou, B.; Zhao, H.; Puig, X.; Fidler, S.; Barriuso, A.; Torralba, A. Scene parsing through ADE20K dataset. In Proceedings of the Computer Vision and Pattern Recognition, Honolulu, HI, USA, 21–26 July 2017; pp. 5122–5130. [Google Scholar]
- Wang, H.; Yang, F.; Liu, L. Comparison and application of standardized regressive coefficient & partial correlation coefficient. J. Quant. Tech. Econ. 2006, 23, 150–155. [Google Scholar]
- Xu, S.; Qing, L.; Han, L.; Peng, Y.; Shen, L. A new remote sensing images and point-of-interest fused (RPF) model for sensing urban functional regions. Remote Sens. 2020, 12, 1032. [Google Scholar] [CrossRef]
- Liu, X.; He, J.; Yao, Y.; Zhang, J.; Liang, H.; Wang, H.; Hong, Y. Classifying urban land use by integrating remote sensing and social media data. Int. J. Geogr. Inf. Sci. 2017, 31, 1675–1696. [Google Scholar] [CrossRef]
- Waddell, P.; Wang, L.; Charlton, B.; Olsen, A. Microsimulating parcel-level land use and activity-based travel: Development of a prototype application in San Francisco. J. Transp. Land Use 2010, 3, 65–84. [Google Scholar] [CrossRef]
- Yao, X.; Wang, Z.; Zhang, H. Dynamic changes of the ecological footprint and its component analysis response to land use in Wuhan, China. Sustainability 2016, 8, 329. [Google Scholar] [CrossRef]
- Naik, N.; Kominers, S.D.; Raskar, R.; Glaeser, E.L.; Hidalgo, C.A. Do People Shape Cities, or Do Cities Shape People? The Co-evolution of Physical, Social, and Economic Change in Five Major U.S. Cities; National Bureau of Economic Research: Cambridge, MA, USA, 2015. [Google Scholar]
- Zhao, J.; Liu, X.; Kuang, Y.; Chen, Y.V.; Yang, B. Deep CNN-based methods to evaluate neighborhood-scale urban valuation through street scenes perception. In Proceedings of the IEEE International Conference on Data Science in Cyberspace, Guangzhou, China, 18–21 June 2018; pp. 20–27. [Google Scholar]
- Gong, H.; Hong, L.; Wu, Q.; Huang, H. Application of the weight of matrix of correlation coefficient in talent identification of athletes. Fujian Sports Sci. Technol. 2003, 22, 36–38. [Google Scholar]
- Russakovsky, O.; Deng, J.; Su, H.; Krause, J.; Satheesh, S.; Ma, S.; Huang, Z.; Karpathy, A.; Khosla, A.; Bernstein, M.; et al. ImageNet large scale visual recognition challenge. Int. J. Comput. Vis. 2015, 115, 211–252. [Google Scholar] [CrossRef]
- Grekousis, G. Artificial neural networks and deep learning in urban geography: A systematic review and meta-analysis. Comput. Environ. Urban Syst. 2016, 74, 244–256. [Google Scholar] [CrossRef]
- Jenks, G.F. The data model concept in statistical mapping. Int. Yearb. Cartogr. 1967, 7, 186–190. [Google Scholar]
- Ashihara, Y. The Aesthetic Townscape; MIT Press: Cambridge, MA, USA, 1983. [Google Scholar]
- Perkins, D.D.; Meeks, J.W.; Taylor, R.B. The physical environment of street blocks and resident perceptions of crime and disorder: Implications for theory and measurement. J. Environ. Psychol. 1992, 12, 21–34. [Google Scholar] [CrossRef]
- Taylor, R.B.; Gottfredson, S.D.; Brower, S. Block crime and fear: Defensible space, local social ties, and territorial functioning. J. Res. Crime Delinq. 1984, 21, 303–331. [Google Scholar] [CrossRef]
- Toby, J.; Skogan, W.G.; Maxfield, M.G. Coping with crime: Individual and neighborhood reactions. Contemp. Sociol. 1982, 11, 420. [Google Scholar] [CrossRef]
- Wilson, J.Q.; Kelling, G.L. Broken windows: The police and neighbourhood safety. Atl. Mon. 1982, 249, 29–38. [Google Scholar]
Publisher’s Note: MDPI stays neutral with regard to jurisdictional claims in published maps and institutional affiliations. |
© 2021 by the authors. Licensee MDPI, Basel, Switzerland. This article is an open access article distributed under the terms and conditions of the Creative Commons Attribution (CC BY) license (https://creativecommons.org/licenses/by/4.0/).