Article

Road Characteristics Detection Based on Joint Convolutional Neural Networks with Adaptive Squares

1
Research Center for Humanities and Social Sciences, Academia Sinica, Taipei 11529, Taiwan
2
Department of Geography, National Taiwan University, Taipei 10617, Taiwan
*
Author to whom correspondence should be addressed.
ISPRS Int. J. Geo-Inf. 2021, 10(6), 377; https://doi.org/10.3390/ijgi10060377
Submission received: 25 March 2021 / Revised: 26 May 2021 / Accepted: 31 May 2021 / Published: 2 June 2021

Abstract

:
The importance of road characteristics has been highlighted, as road characteristics are fundamental structures established to support many transportation-relevant services. However, there is still huge room for improvement in terms of types and performance of road characteristics detection. With the advantage of geographically tiled maps with high update rates, remarkable accessibility, and increasing availability, this paper proposes a novel simple deep-learning-based approach, namely joint convolutional neural networks (CNNs) adopting adaptive squares with combination rules to detect road characteristics from roadmap tiles. The proposed joint CNNs are responsible for the foreground and background image classification and various types of road characteristics classification from previous foreground images, raising detection accuracy. The adaptive squares with combination rules help efficiently focus road characteristics, augmenting the ability to detect them and provide optimal detection results. Five types of road characteristics—crossroads, T-junctions, Y-junctions, corners, and curves—are exploited, and experimental results demonstrate successful outcomes with outstanding performance in reality. The information of exploited road characteristics with location and type is, thus, converted from human-readable to machine-readable, the results will benefit many applications like feature point reminders, road condition reports, or alert detection for users, drivers, and even autonomous vehicles. We believe this approach will also enable a new path for object detection and geospatial information extraction from valuable map tiles.

1. Introduction

Road networks, fundamental infrastructures in a nation, are primarily constructed for transport purposes such as carrying people or conveying goods from one place to another one and function as connecters to facilitate social interactions and economic activities between spatial locations. Because road networks are responsible for transportation, interconnection, and communication, and are widely used in our daily lives, it is vital to exploit road characteristics such as various types of road intersections, the road bends, turns, and corners where, not only are underlying structures established to support relevant traffic services but also traffic accidents happen often. The importance of road characteristics has also been highlighted in many studies, and many applications regarding the road characteristics have been performed in the field of assessment and management of road design and road safety [1,2,3,4,5,6] as well as routing planning [7,8,9].
Road characteristics detection means identifying a road characteristic’s location and type in the scope of our discussion. Several methods with GPS trajectory or remote sensing data have been proposed in previous studies. Two groups are distinguished based on the types of the spatial data models of study materials: vector-driven and raster-driven. In the vector-driven group, vehicle GPS traces are mainly used, while emerging GPS technologies provide up-to-date data and easily construct road networks from point elements [10,11,12,13,14,15,16,17]. In the literature, road networks with road intersections have been extracted from GPS traces [11,15] whereas, Wang, Wang [12], Xie and Philips [14], and Chen, Ding [16] aim at detecting road intersections only. Yang, Tang [13] addressed various types of intersections such as three-way intersections (e.g., “T” and “Y” junctions), four-way intersections (crossroads and skewed (X) intersections), and five-way intersections. In addition to the detection of road intersections, GPS traces have also been used to identify where traffic lights are and what they are set for, for instance, for vehicles or pedestrians [18]. Moreover, traffic lights, road intersections, and roundabouts are detected using a deep learning approach [17]. Besides, dominant regional movement patterns are detected based on a convolutional neural network [7]. In addition to GPS traces, some studies have conducted road characteristics detection from Lidar data [19,20]. More specifically, Soilán, Truong-Hong [19] proposed a workflow to extract features such as pavements and sidewalks and to detect road markings. Jung and Bae [20] performed road detection at lane and road levels.
In the raster-driven group, aerial or satellite imagery is primarily utilized for road characteristic detection, while remote sensing images could provide a great amount of rich information in a large area and update quickly, thus achieving efficient road characteristics detection and road network constructions. This group is divided into two subgroups based on the processing approaches adopted: the computer vision approach [21,22,23,24,25] and the machine learning approach [26,27,28,29]. In the computer vision approach, road networks are constructed [24,25] from satellite images using mathematical morphology techniques [25]. Chiang, Knoblock [23] and Chiang, Knoblock [22] successfully extracted road intersections from road networks fused with symbols and text on scanned maps. Road networks with various types of characteristics such as corners, T-shaped intersections (T-junctions), and two X-shaped intersections have been detected from aerial images [21]. In the machine learning approach, road networks and background pixels (non-road parts) are detected using a back-propagation neural network (BNN) based on high-resolution satellite images [26]. Road intersections such as T-junctions and cross junctions are detected using an IntersectNet model, a CNN model combined with a long-term recurrent convolutional network (LRCN), from immersive street-view-like images [27]. Bastani, He [28] used CNNs to construct road networks (graph structures) from aerial images. Recently, the extraction of road intersections using Faster R-CNN from historical scanned maps has been discussed [29]. Besides the above-mentioned studies based on either exclusive vector- or raster-type materials, one study has used a vector-image conflation method to identify the points of intersections in road networks [30]. From the above discussion, most previous studies have tended to focus on the construction of road networks or center point extraction of road intersections. Few researchers have addressed the issue of road characteristics detection with certain types such as T-junctions, Y-junctions, crossroads and five-way intersections using GPS traces, and corners, T-junctions, and crossroads using aerial images, respectively. Hence, there is still a need to detect various types of road characteristics, including intersections and curvatures in an efficient way and with location simultaneously, which can then be applied in many fields for much more precise analysis.
Since innovative tile map service specification such as a web map tile service (WMTS) [31], tile map service (TMS) [32], and vector tile service [33,34,35] were proposed in the past decade, there has been a rapid rise in the use of both raster tiled web maps and vector tiled web maps for presenting geographic information. A great number of tile services with rich geographic information are thus available online and enable us, for example, to add a Basemap from a tile service to establish a GIS system. A remarkable situation of the provision of geographic information in the future may turn to publish tiled map services rather than providing raw data directly because the accessibility of tile services via API through the internet is much easier than that of standalone GIS datasets and remote sensing datasets. With the advantages of high accessibility provided by tiled map services, especially because the accessibility of tile maps is much higher than that of vector data and remote sensing imagery, it brings substantial motivation to perform road characteristics detection using images from tile maps instead of vector-based data and remote sensing data, which are often used in many previous studies. For example, we can efficiently access tiles from various countries around the world, but it takes time or is expensive to collect vector-based road networks, and satellite and aerial images in a country or across countries for road characteristics detection. From the perspective of efficiency of data collection, using tiles is much more efficient than using vector data or remote sensing data for this task. While data is a core in research, the accessibility of data affects the performance of a study.
Machine learning (ML) approaches, especially deep learning, lately have attracted considerable attention and have been widely applied in many fields for issues such as object detection [36,37,38] and classification [39,40,41,42]. ML approaches have an outstanding performance of, especially for image processing. Therefore, in this study, a deep-learning-based approach is proposed for road characteristics detection from map tiles. Specifically, it is a joint convolutional neural networks (CNNs) framework composed of a VGG-16 and InceptionResNetV2 framework with adaptive squares designed by considering spatial properties of road networks at the street level representation and domain knowledge. The VGG-16, a powerful binary classification framework, is adopted to design a road foreground and background (abbreviated as FG and BG) image classification model that is responsible for distinguishing FG and BG images from the input samples. An FG image indicates that one of five road characteristics exists, whereas a BG image does not have any road characteristics. The InceptionResNetV2 framework, an excellent multi-class classification model, is adopted to design a road characteristics classification model to detect various types of road characteristics. In this study, five types of road characteristics—crossroads, T-junctions, Y-junctions, corners, and curves—are focused on because they are common patterns in road networks. Our proposed approach specifically adopts adaptive squares with combination rules designed by referring to the mapping criteria and the properties of road characteristics to carry out optimal detection results. More precisely, the use of adaptive squares conducts limited sampling and facilitates efficient detection, as road networks illustrated on a roadmap are represented as a polygonal feature with certain widths at each map scale. Furthermore, combination rules are used to solve inconsistent or duplicated initial detection results generated from various detection squares and to obtain optimal final results. For example, the result of two neighboring T-junctions will be replaced by an overlapped crossroad, as those two T-junctions are incorrect results caused by incomplete coverage from a small detection square size.
Google Maps [43], one of the common web mapping services developed based on tile services, provides rich geographic information. Recently, using vector tiles (also called vector maps) has become more and more popular because vector tiles make maps quickly and allow for customized maps with suitable styles for further applications. For example, one may create a map with road networks only that excludes extraneous marks such as text or symbols for road characteristic detection. Another common tiled mapping service, which has garnered attention and had a great amount of collaborative editing, is OpenStreetMap (OSM) [44]. OSM has assisted in the construction and improvement of road networks [45,46,47] and is used in many road-based applications [48,49,50,51]. However, the total number of users of Google Maps is more than that of OSM. Besides, a critical concern with OSM is the data quality [52,53,54]. Google Maps is a more stable source of quality data than OSM. Thus, a roadmap in Google Maps is employed in this study. With the advantages of vector tiles of Google maps and the rich road networks which are provided, tiles retrieved from the roadmap of Google Maps are thus selected as study materials. It is a novel idea to exploit road characteristics with location information from raster-based popular roadmap tiles. Originally, those types of road characteristics presented on the map are mostly human-readable. Locations with one type of road characteristics where information can be converted from human-readable to machine-readable. Thus, the results can be widely used in many road-network-based applications such as feature point reminders or road condition reports in route planning, early warning, or alert detection systems for users and drivers when approaching those road characteristics. Based on the proposed approach, our experiments are conducted in Taipei, Taiwan, which encompasses the most diverse road network structures in the nation. The experimental results demonstrate that we have found an innovative solution for road characteristics detection, and our approach is able to be applied in other areas and nations, especially where there are insufficient raw GIS dataset supplies for road-based analysis. In this paper, we also compare the proposed approach with a prevalent deep framework, Faster R-CNN [55], for objection detection in the evaluation section. The contribution of this paper is fourfold:
  • A simple joint deep framework including binary classification and multi-class classification for detection with high accuracy of various types of road characteristics from popular roadmap tiles with high accessibility and availability is proposed.
  • Adaptive squares and combination rules are proposed with reference to mapping criteria and geometric patterns of road characteristics in the roadmap to efficiently find optimal detection results.
  • Five common road characteristics, crossroads, T-junctions, Y-junctions, curves, and corners are successfully detected with outstanding performance.
  • Locations with one type of road characteristic where the information originally presented on maps is elaborately exploited and converted from human-readable to machine-readable, which has the potential to benefit many road-network-based applications with user-friendly programs.
The remainder of this paper is organized as follows. Section 2 presents the method, including a workflow of the road characteristics detection, the structure of two deep frameworks, the discussion of adaptive squares, and combination rules to yield optimal final detection results using various sizes of detection squares. Section 3 provides the experimental results, discussion, and evaluation of our implementation. The conclusions and future work are laid out in Section 4.

2. Methods

This work proposes a deep-learning-based approach with adaptive detection squares involving combination rules for detecting road characteristics from a digital roadmap. Figure 1 depicts the workflow, comprising six steps: 1. A filtered map tile retrieved from a comprehensive roadmap via Google Maps API [56] with style setting [57] is taken as the input to make the detection more efficient. As the road features are clearly presented at zoom level 16, the target zoom level of tiles is set at 16. 2. The detection is conducted by scanning with a row-major order, a moving step, and three various detection sizes on a tile. Three sizes of squares, small, medium, and large, are adopted for the detection based on the properties of the road network structure. The medium one is the main size, as it is able to capture most road characteristics. 3. The road FG and BG image classification model (a pre-trained model) is applied to identify FG and BG images; an FG image indicates that one of the five road characteristics exists in that image, whereas a BG image does not have any road characteristics. 4. The road characteristics classification model (a pre-trained model) is applied to identify road characteristics from FG images. 5. Initial detection results for the three sizes of detection squares are acquired after the two models are performed. 6. The process steps with combination rules are conducted to eliminate duplicate and inconsistent results so that the final results are obtained. More details of the proposed methods, including setting sizes of squares, two pre-trained models, and combination rules, are presented in the following sections.

2.1. Setting Sizes of Squares

After filtered map tiles are retrieved, the goals are exploiting the location of a road characteristic with a fitting spatial range and determining a type for that road characteristic within a tile. Although the road networks are represented as polygonal features with various widths, they can be re-categorized to some fixed widths depending on their road levels, such as primary roads or non-primary roads, to make the detection efficient. Thus, the following discussion focuses on how to determine an appropriate shape and size for efficient processing. Based on the properties of road networks, having the shape of a square is better rather than of a rectangle because of the former’s finiteness and rotation-insensitivity: 1. Finiteness: possible cases of squares are much fewer than those of rectangles, while rectangles are constructed with flexible widths or heights that generate excessive combinations, reducing the efficiency of detection. For example, there is only one case of a square with an edge of 16 pixels, but there could be many cases of rectangles with a width of 16 pixels and various heights from 1 to 256 pixels, and vice versa. 2. Rotation-insensitivity: while roads tend to spread in arbitrary directions in road networks, a square is insensitive to rotation, whereas the size of a rectangle changes along with the orientation of roads.
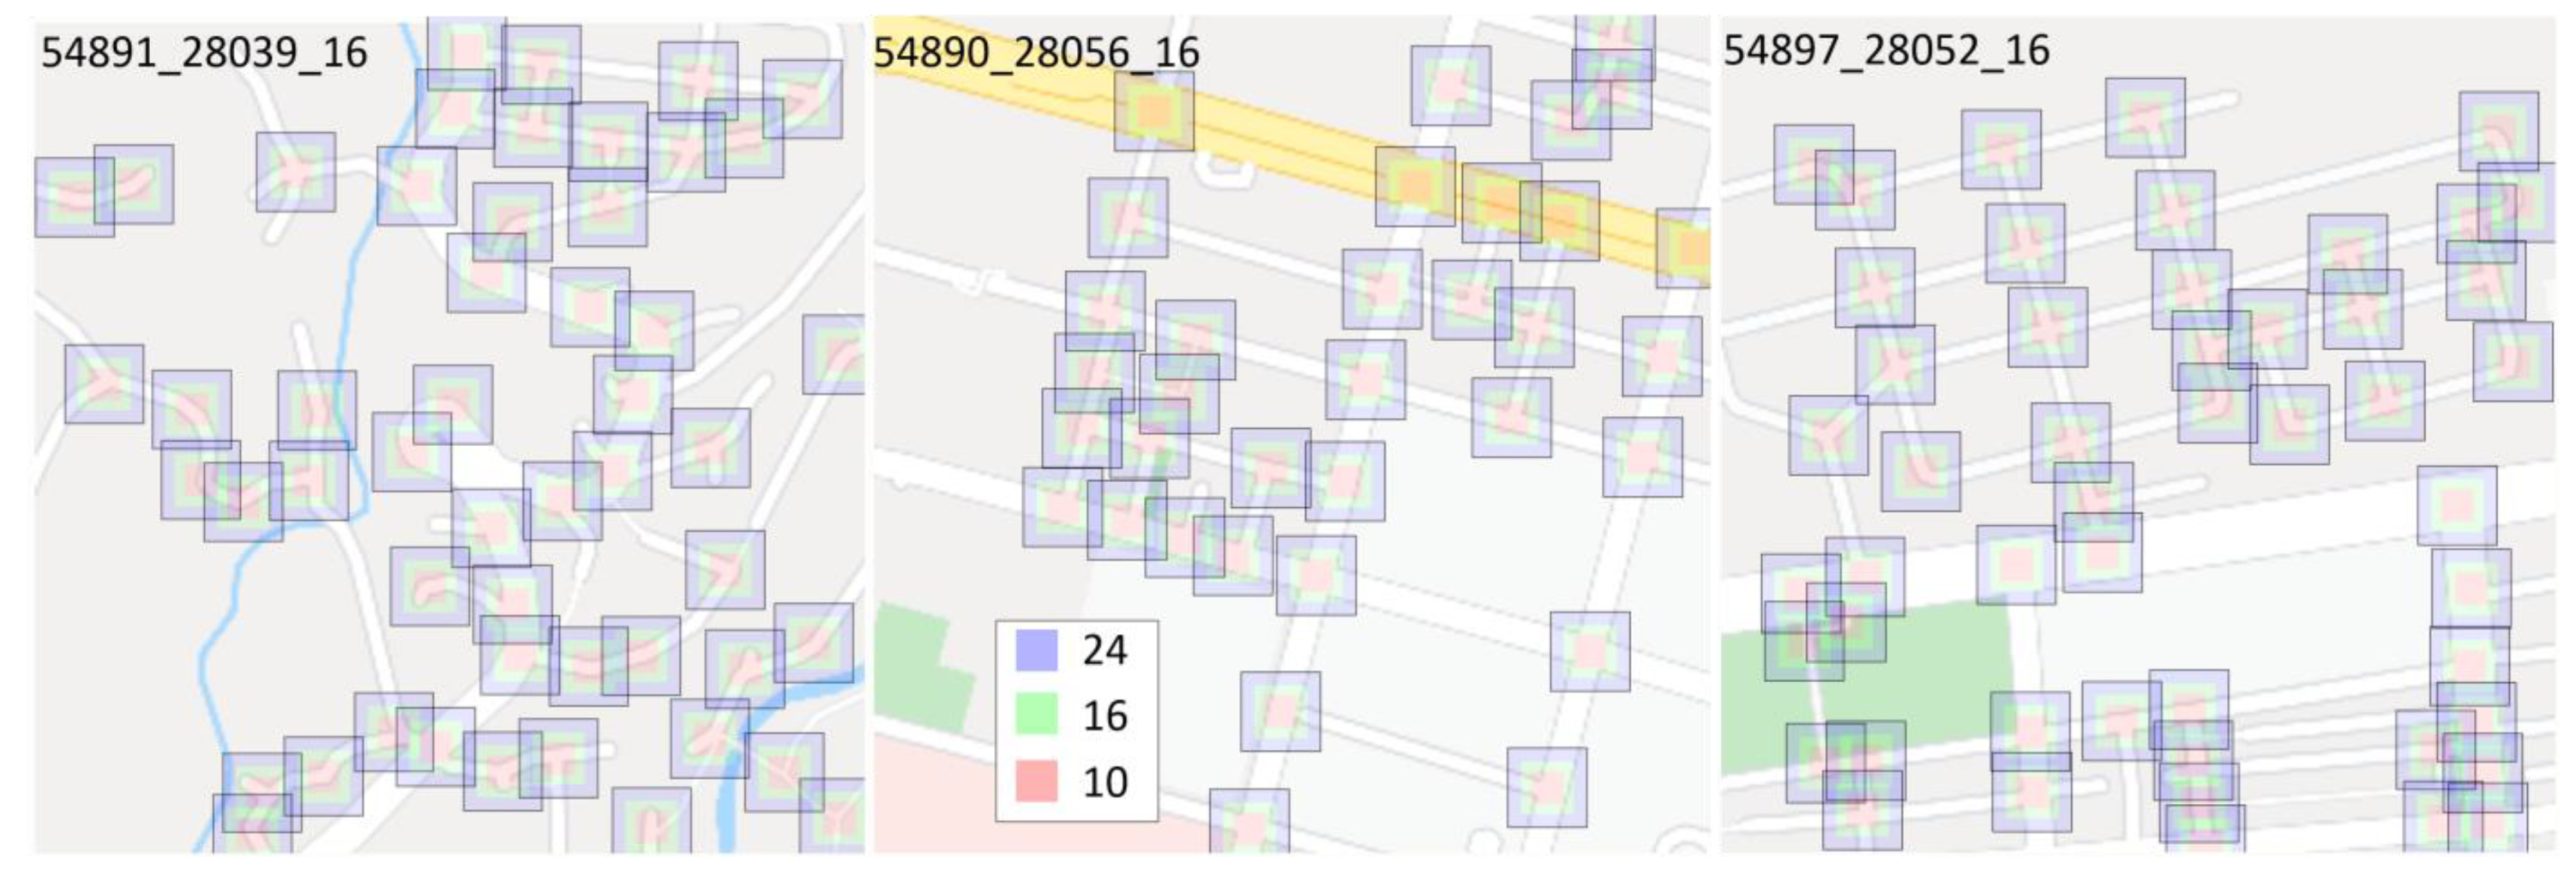
In addition to the shape, the other crucial issue is to specify a suitable size for a square to achieve efficient detection. From our observations and measurements, roads with various widths at a specific zoom level are able to be classified into three categories by referring to the mapping criteria of the roadmap of Google Maps. Consequently, three sizes of squares, small, medium (the main size), and large are adopted rather than 256 sizes. Three sizes, 10 × 10 pixels, 16 × 16 pixels, and 24 × 24 pixels, are adopted at zoom level 16, and 16 × 16 pixels is the main size, as it is able to capture most road characteristics. Figure 2 gives samples to demonstrate that three sizes of squares are able to encompass most sizes of road characteristics. In Figure 2, a label noted as X_Y_Z encoded by the tile specification indicates the location and zoom level of the tile.

2.2. Joint Convolutional Neural Networks

To recognize what type of road characteristic a target image is, a CNN-based approach, joint convolutional neural networks, that is composed of two models, a road FG and BG image classification model and a road characteristics classification model, are proposed. The former model aims at FG and BG image classification (a binary classification), and the latter model focuses on five types of road characteristics classification (a multi-class classification). Both models are pre-trained on sufficient datasets and are applied sequentially, such that the FG images are identified first and classified second in the road characteristics detection application. More details about the two models are presented in the following sections.

2.2.1. Road Foreground and Background (FG and BG) Image Classification Model

The model based on a deep learning approach, that is, a convolutional neural network (CNN), is proposed to distinguish FG and BG images from input target images. The proposed model is built based on the visual geometry group network-16 (VGG-16) framework because the VGG-16 performs especially well on binary classification [58]. To fit in the architecture of VGG-16, several operations and parameters regarding the model are set as follows: 1. FG and BG images are manually labeled as training datasets at the main size, 16 × 16 pixels. 2. Input images are resized to 224 × 224 pixels, consistent with the requirements of the fully convolutional network (FCN) process. 3. The loss function adopted in the model is binary cross-entropy, while the FG and BG images classification task is a binary classification problem. The bottom part in Figure 3 illustrates the architecture of the road FG and BG image classification model.

2.2.2. Road Characteristics Classification Model

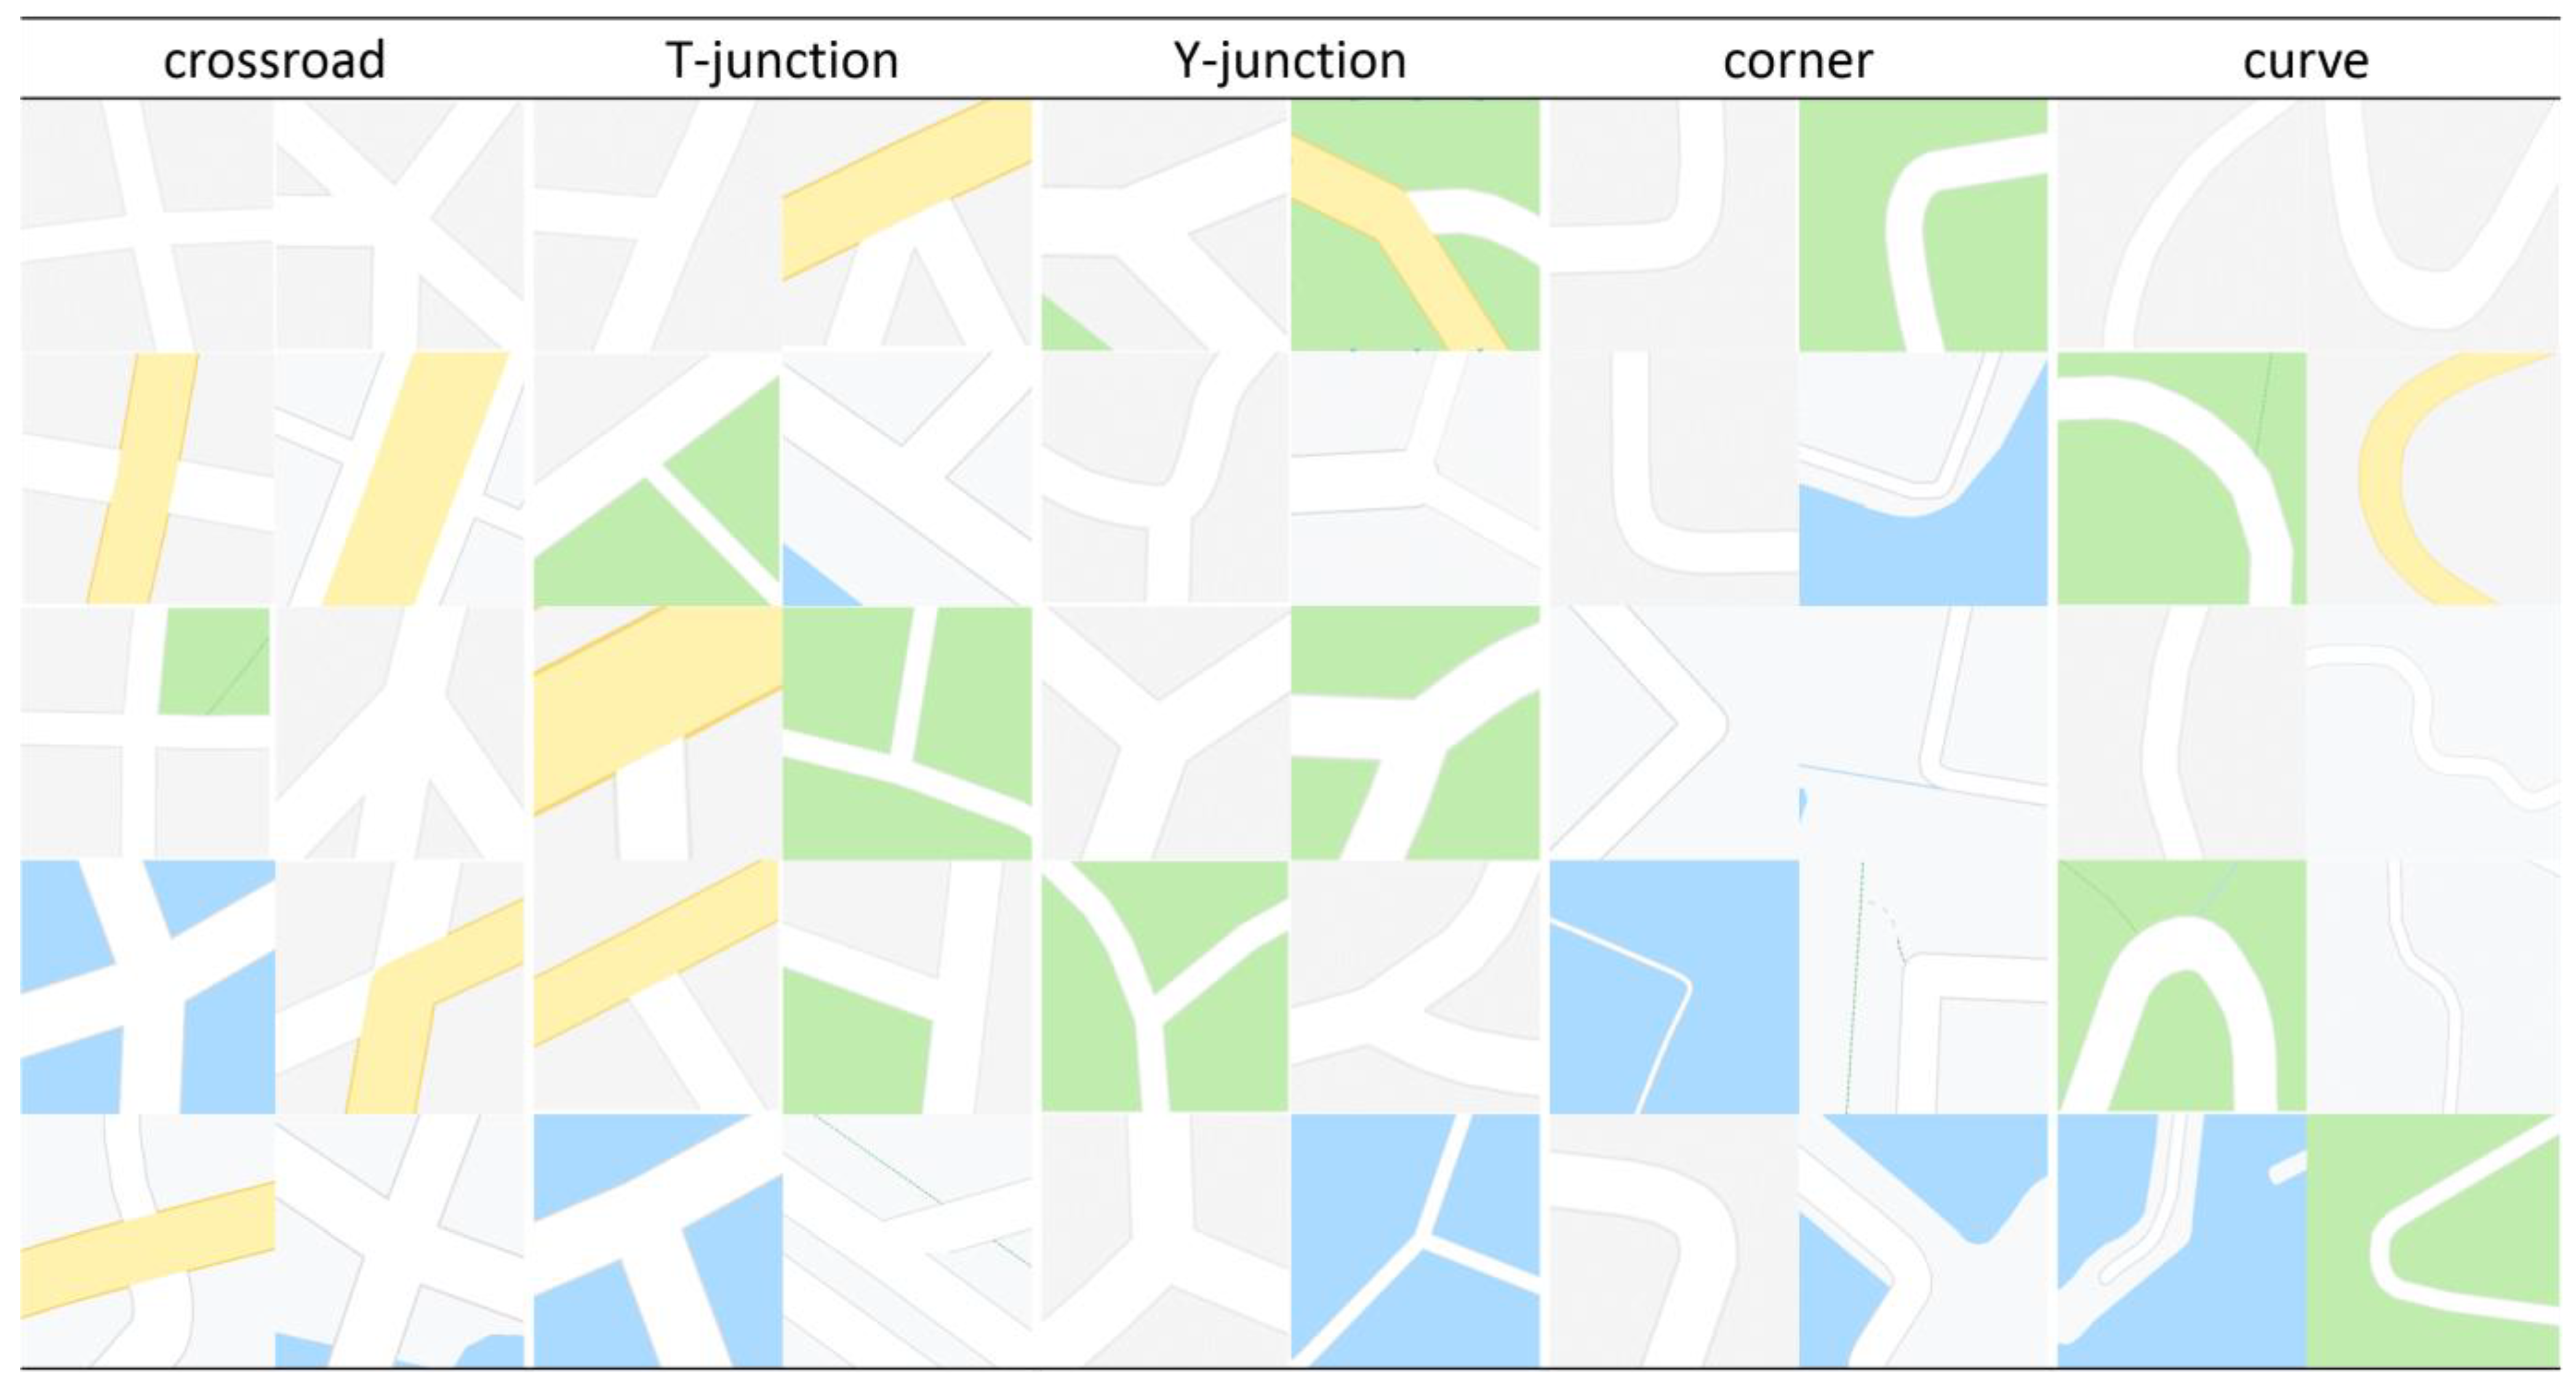
The other underlying model is a road characteristics classification model proposed to distinguish the type of road characteristics from an FG image obtained from the previous model. This model is also a pre-trained model that takes representative sample images in terms of types of road characteristics and BG images for the training. While a crossroad is defined as “a place of intersection of two or more roads” by Merriam-Webster dictionary, in order to address the difference between crossroads and intersections and to obtain precise results of road characteristics detection, intersections are reclassified into three types, that is, crossroad, T-junction, and Y-junction, according to their shape. In this study, we specifically define that a crossroad indicates a junction connected by over three ways. Consequently, five types of road characteristics, crossroads, T-junctions, Y-junctions, corners, and curves, are targeted for identification because they are the most common features and principal structures in road networks. Figure 4 presents the sample images of five road characteristics retrieved from the filtered roadmap of Google Maps.
Like the concept of the road FG and BG image classification model, to distinguish road characteristics from images, the road characteristics classification model is built based on CNN architecture with the InceptionResNetV2 model for identifying five road characteristics, while the InceptionResNetV2 model has better performance than others on multi-class classification [59]. Regarding the parameters set in this model, in addition to the difference of the core of CNN between the road FG and BG image classification model and the road characteristics classification model, five types of road characteristics images and BG images are manually labelled as a training dataset which is at 16 × 16 pixels as well, and the loss function adopted in the model is categorical cross-entropy. The upper part in Figure 3 illustrates the architecture of the road characteristics classification model.

2.3. Process Steps and Combination Rules

After two pre-trained models are built, three sizes of initial detection results can be obtained by applying the two models. However, there could be several candidates which are spatially overlapping with identical results (called type I duplicated detection results) or nonidentical results (called type I inconsistent detection results) from the detection in each size as a row-major ordering scanning with a moving step is conducted. Besides, type II duplicated results or type II inconsistent detection results to a certain characteristic may appear because various detection sizes are used. To eliminate the above-mentioned duplicated or inconsistent detection results and to obtain optimal detection results, in this step, the following process steps and combination rules are proposed to efficiently integrate three sizes of detection results. As the process is oriented, the one taken from two detection results being compared is called the subject and the other is called the object in the following explanation. Table 1 presents five combination rules in various colors used for cases of five types of road characteristics with three sizes of detection squares, and Figure 5 depicts the flowchart of the process.
  • Process step 1 (for the same type of road characteristic at each size): the process begins at the cases of the same type of road characteristics. The purpose of this step is to remove the type I duplicated detection results that occurred for each size of initial detection results by scanning with a moving step. A non-maximum suppression (NMS) algorithm [60] is adopted to select the best candidate for the process afterwards.
  • Process step 2 (for various types of road characteristics at each size): after the process of step 1, there still could be multiple results with various types of road characteristics detected for a target location at each size. This is called a type I inconsistent detection result. To remove it, Rule I with an IoU threshold determined by a heuristic approach based on a street-level representation, zoom level 16, is applied, and the following comparison order is conducted according to the accuracy of those road characteristics. The comparison order is set as crossroad > T-junction > Y-junction > corner (in decreasing priority from left to right according to their accuracy and the evaluation metrics of model 2). A T-junction has higher priority than a Y-junction because the former has higher precision than the latter in the validation report. Each type is compared against the other types. To avoid duplicate comparison, the types of objects for crossroad are T-junction, Y-junction, corner, and curve; the types of objects for T-junction are Y-junction, corner, and curve; the types of objects for Y-junction are curve and corner; the type of objects for the corner is the curve.
    • Rule I: if two detection results have a qualified intersection determined by their IoU, such as an IoU equal to or greater than a threshold T1, the subject or the object with lower confidence is removed. When the subject and the object have the same confidence scores, the subject is preserved, and the object is removed.
  • Process step 3 (for adding supplementary detection results from large and small squares): the medium square is taken as the main size of detection to obtain basically much more precise results than others. However, deficient specific cases such as insufficient detection squares for a wide road or oversized detection squares among roads in dense areas leading to incorrect detection results may appear in the medium size. To improve this situation, in this step, supplementary detection results from large and small squares will be added by applying Rule II.
    • Rule II: if two detection results, that is, the subject is from a medium size, and the object is either from a large or a small size, do not have a qualified intersection, for example, the distance between their centers is greater than a threshold T2 × L, where T2 indicates a scaling factor and L indicates the side of the larger detection results, the object is added. That means two objects are valid detection results at various locations. The distance between the centers of two detection results is measured and used to determine whether one of the two results is duplicated as the process is located at various sizes of detection results and the measurement is more efficient and more stable than the IoU method. In short, the result of using the IoU method is affected by the area of the two detection results, but not in our method. Next, when two objects found through large and small detection region squares have a qualified intersection, one of the two objects must be removed through comparison to avoid a type II duplicated case that occurs since the same detection results regarding a type of road characteristic for the same target location are generated by two sizes of squares. If the confidence scores of the two objects are the same, the detection result from the large size is preserved, and the other is removed because the large one encompasses a wider range with more certain information than the small one. Otherwise, the one with the lower confidence score is removed.
  • Process step 4 (for crossroads): after supplementing from other sizes of detection results, the type II inconsistent detection results caused by incomplete coverage of medium size may still occur. For example, a location may be detected as a T-junction at medium size but a crossroad at large size due to insufficient detection size of the medium square. This step aims at utilizing large-sized crossroads to solve type II inconsistent detection results. Then, Rule III is conducted. In such cases, only large-sized crossroads containing no medium-sized crossroads are processed because a large-sized crossroad containing a medium-sized crossroad is not possible via process step 3. However, after applying Rule III, there could be cases of large-sized and medium-sized crossroads or large-sized and small-sized crossroads existing, leading to type II duplicated cases for a target location. Then Rule IV is conducted to remove duplicated crossroads.
    • Rule III (for large-sized crossroads and medium-sized T-junctions or Y-junctions): if two detection results (the subject is a T-junction or a Y-junction from a medium size, and the object is a crossroad from large size) have a qualified intersection, for example, the distance between their centers is equal to or smaller than threshold T2 × L, which are the same as described in Rule II, the object is preserved, and the subject is removed.
    • Rule IV (for large-sized and medium-sized crossroads, large-sized and small sized-crossroads): when two detection results are crossroads, if the subject detected from the medium-size square and the object detected from the large-size square have a qualified intersection, for example, the same as described in Rule III, the subject is preserved, and the object is removed because the subject is the main size. In addition, if the subject detected from the large-size square and the object detected from the small-size square have a qualified intersection, the subject is preserved, and the object is removed because the subject encompasses larger coverage with more extensive investigation than the object.
  • Process step 5 (optional for curves): the shape of the curve is much more diverse than other types, while roads may frequently bend based on topography or other practical demands. For example, a curve could be a sharp turn in a mountain area or a smooth turn like an arc in a flat area. To avoid generating too many discrete curves, especially for a curve with a huge curvature radius, this step aims at merging adjacent curves into a curve. The combination process is conducted by Rule V. This is an optional process step, as many discrete curves detected but not merged are also allowed.
    • Rule V: If two detection results have a qualified intersection, for example, the distance between their centers is equal to or smaller than a threshold T3 × L, where T3 indicates a scaling factor, a new spatial range for the location of the curve type is reconstructed based on the maximum extents of the subject and object.

3. Implementation

This section presents the selected study area with study materials, experiments, results, and discussion with evaluation and comparison.

3.1. Study Area and Study Materials

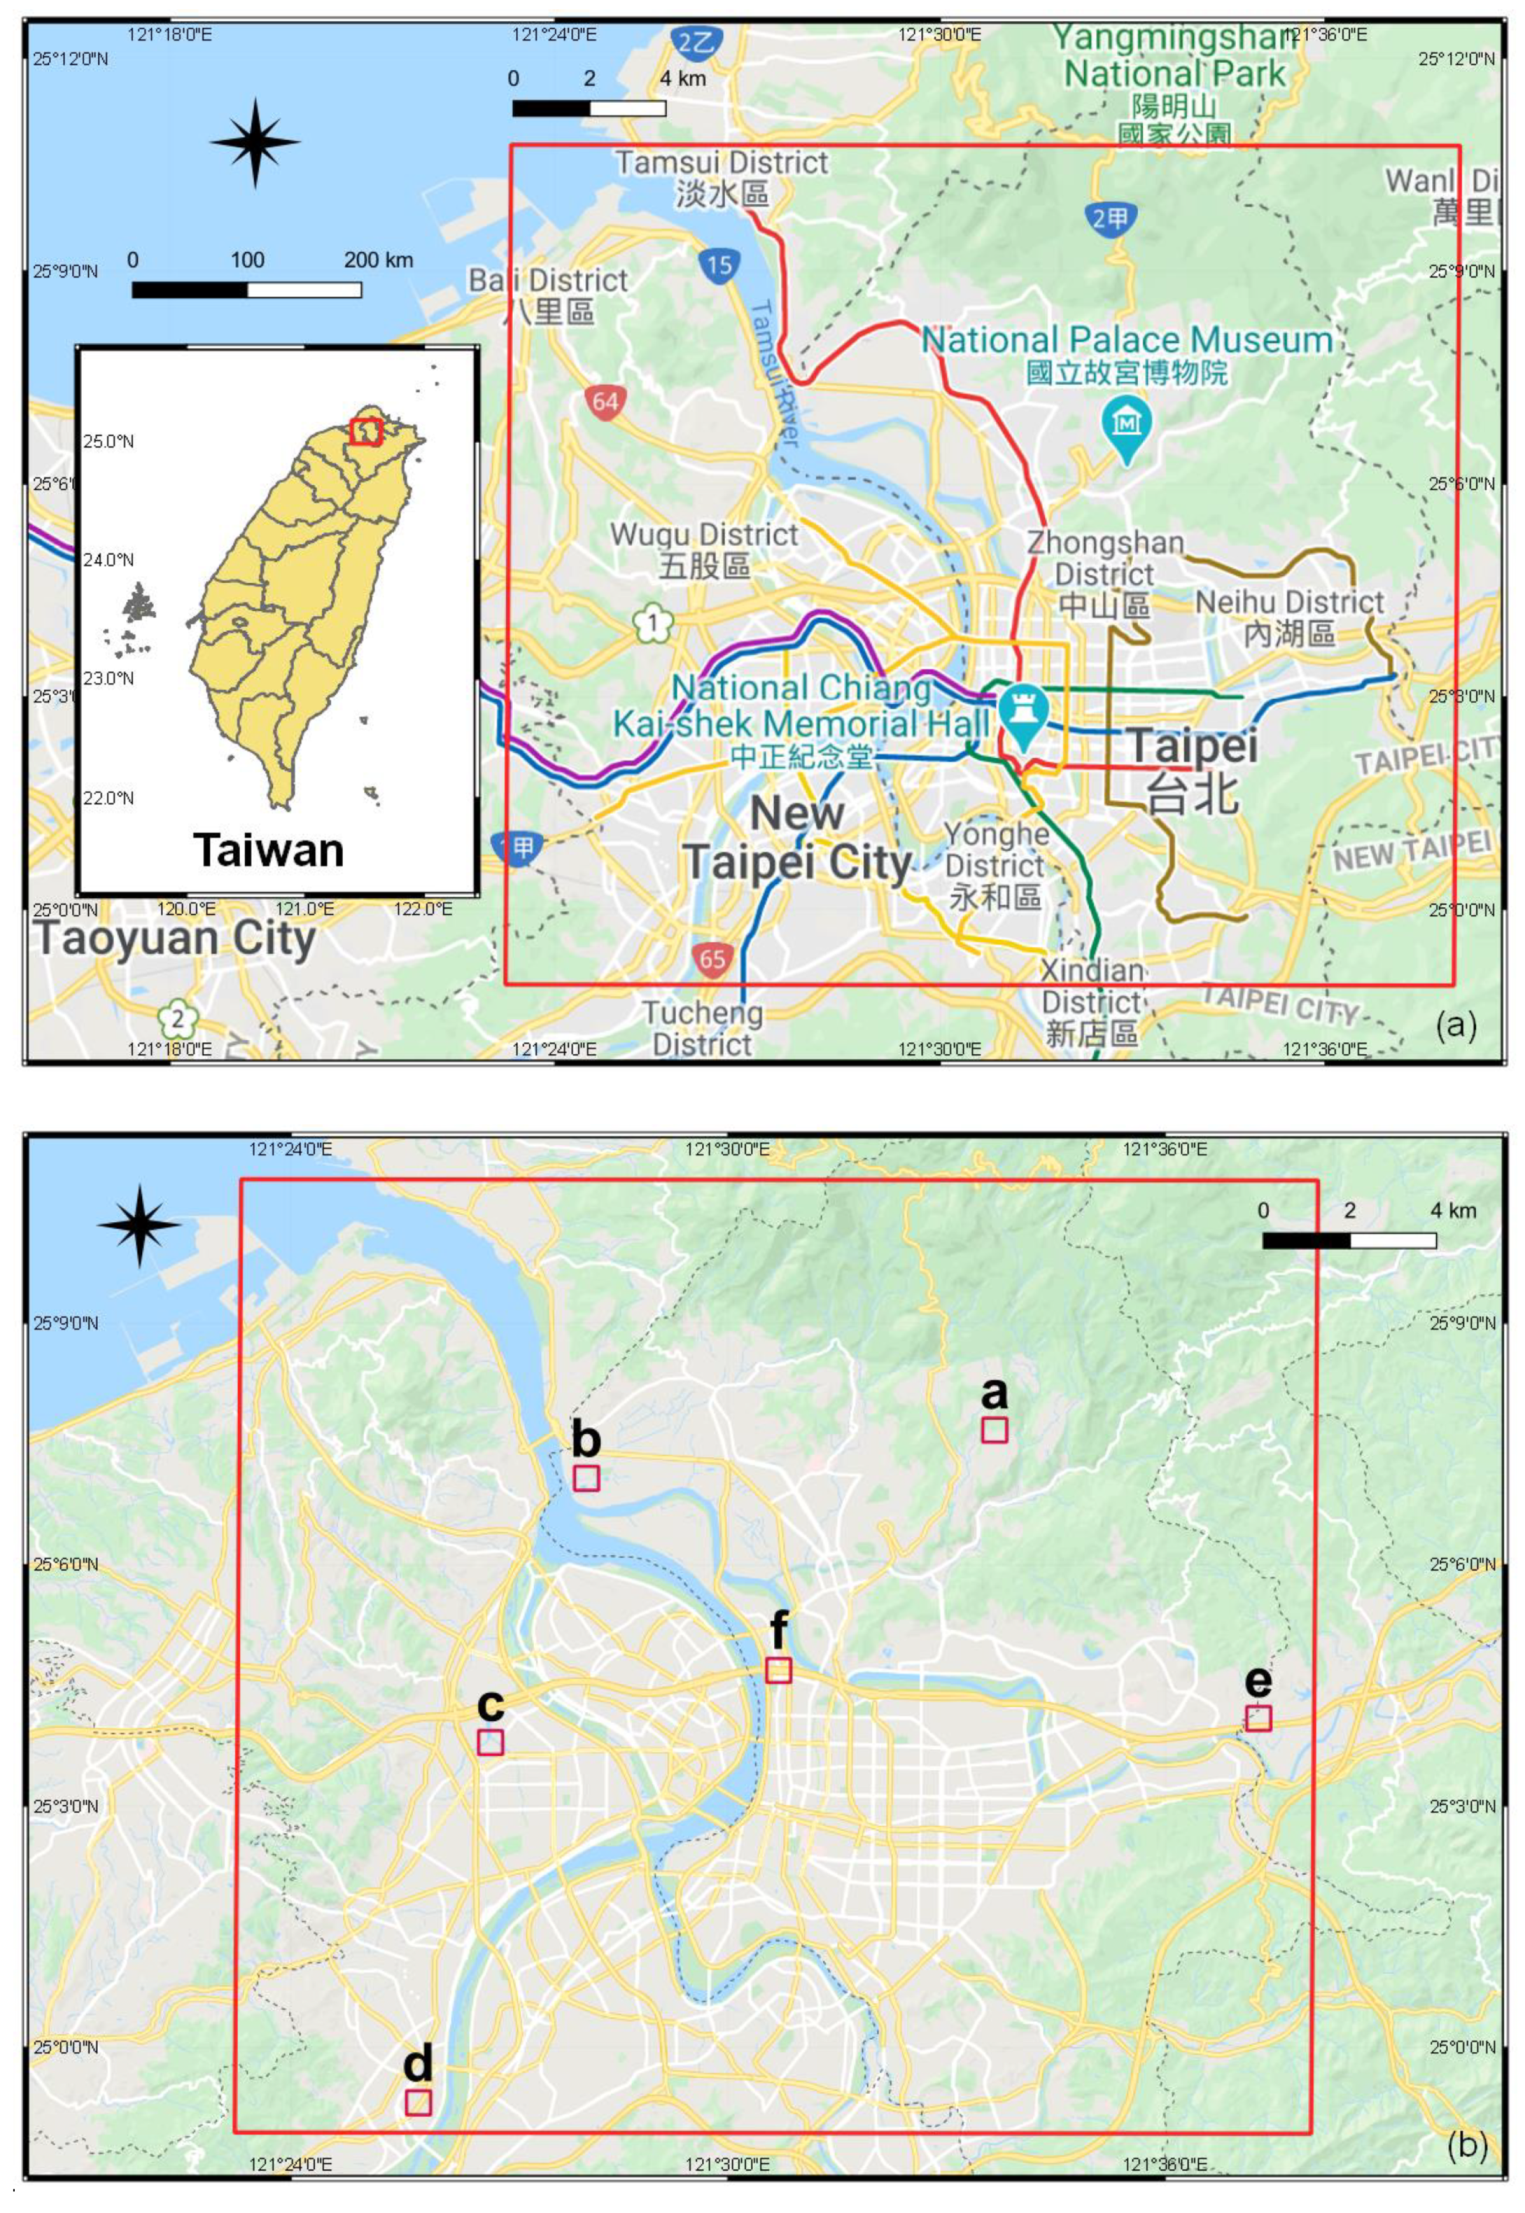
The study area shown as a red rectangle area in Figure 6a at around 540 km2, is located mostly in the middle of Taipei city, which is the most modern city in Taiwan and has the highest population density, at around 9700/km2, extensive road networks, advanced traffic construction, a great amount of mobility and busy social activities, and is located partly in New Taipei City. This area simultaneously contains urban, rural, river, and mountain regions. We thus retrieve a training set and validation set to provide representative samples of road characteristics to build two pre-trained models for road characteristics detection.
As discussed earlier, roadmap tiles fetched from Google Maps are chosen as study materials because Google Maps are mapped based on a vector tile service that provides road networks with a high update frequency and flexible functionalities that enable not only easy generation of customized maps, but also easy accessibility. Study materials shown in Figure 6b are thus, collected from filtered roadmap by adopting a customized style testing in an online styling wizard [61] at the zoom level 16, a street-level representation. Each collected map tile is at the size of 256 × 256 pixels. The numbers of images of training, validation, and test sets for two pre-trained models are shown in Table 2.

3.2. Experiments and Results

Experiments of the road FG and BG image classification model and the road characteristics classification model are conducted by utilizing the dataset listed in Table 2. The road FG and BG image classification model is built based on a VGG-16 framework with 190 epochs, whereas the road characteristics classification model is built based on the InceptionResNetV2 framework with 150 epochs. Table 3 and Table 4 present the classification report of the two models including, the accuracy of the validation set and test set and the overall precision, recall, and F1-Score, respectively.
After the two pre-trained models are built, experiments for road characteristics detection are conducted by the proposed workflow presented in Section 2. Target images for detection are retrieved from a map tile by a row-major ordering scanning with a moving step, for example, two pixels, from the top left corner to the bottom right corner. In the experiments, the confidence score is set at 0.85 and 0.98 for model 1 and model 2, respectively, which indicates that only target images with a confidence score equal to or greater than 0.85 in model 1, and those equal to or greater than 0.98 in model 2 become FG images for the road characteristics detection task, otherwise they are BG images. Further, the threshold for the IoU of NMS to eliminate type I duplicated detection results is 0.3, that for the IoU of Rule I to remove type II duplicated detection results is 0.3(T1) as well, that for the combination process in Rule II, Rule III and Rule IV is 0.4(T2), and that for the combination process of curves in Rule V is 0.5(T3).
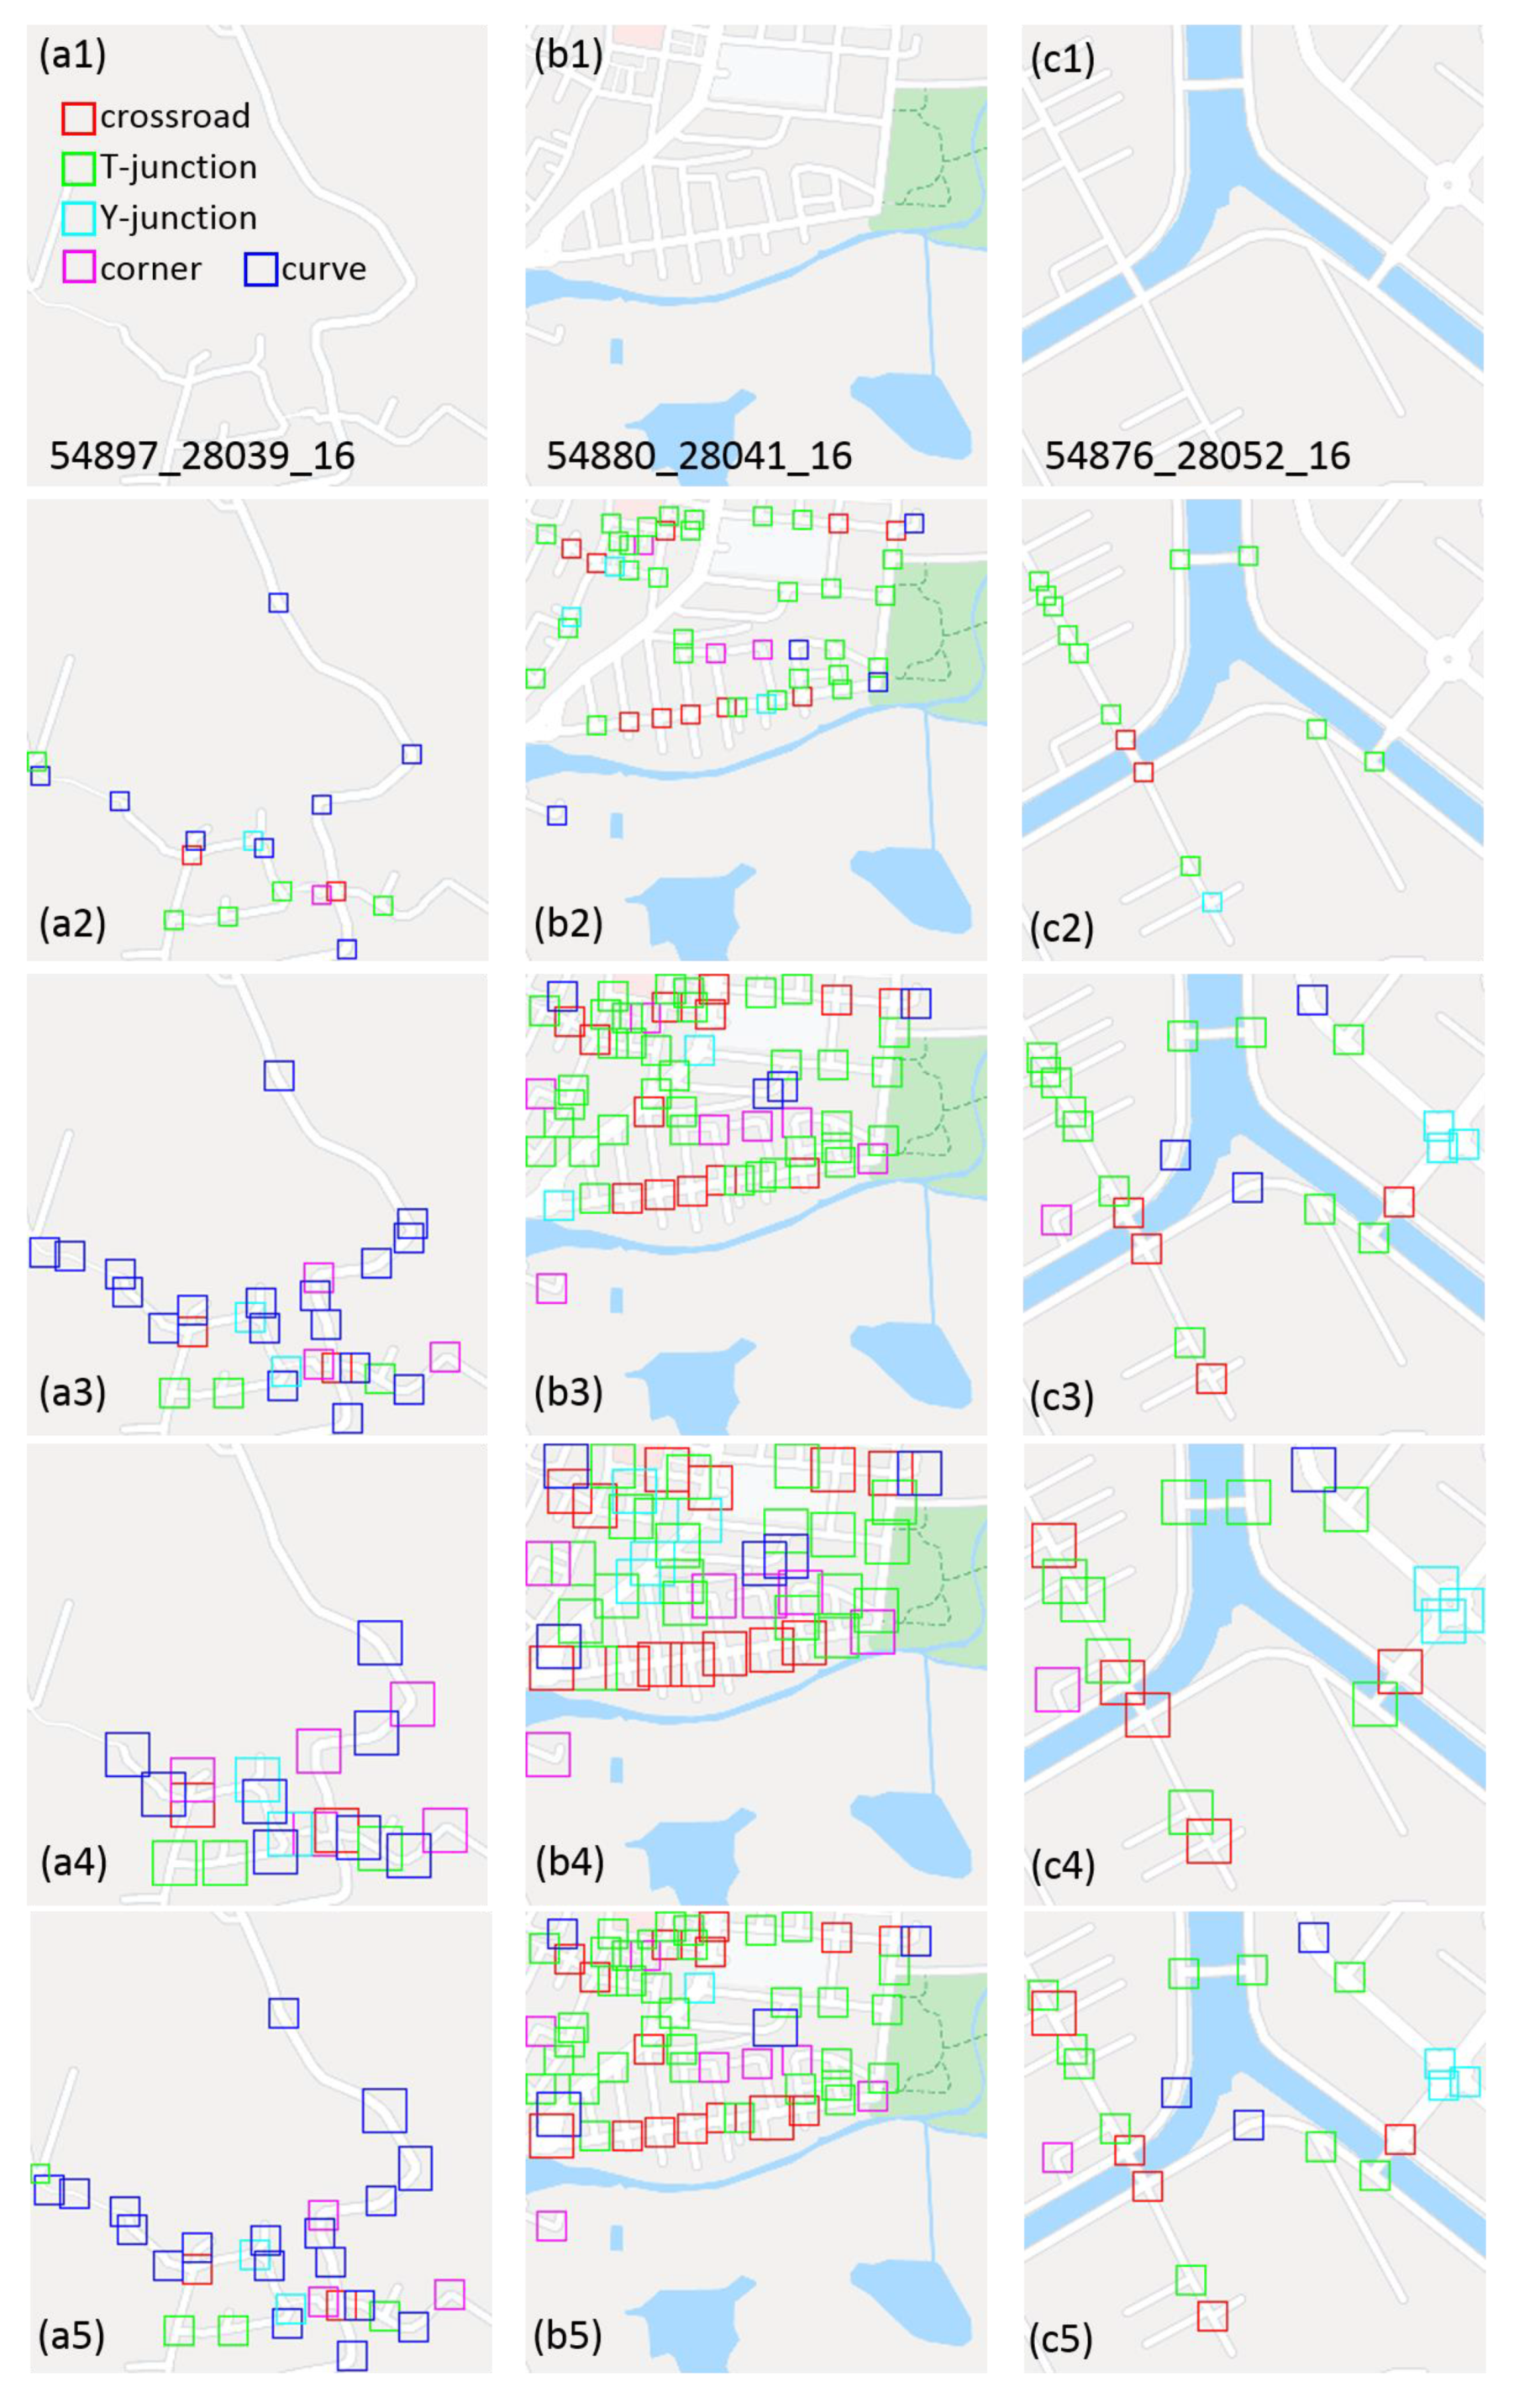
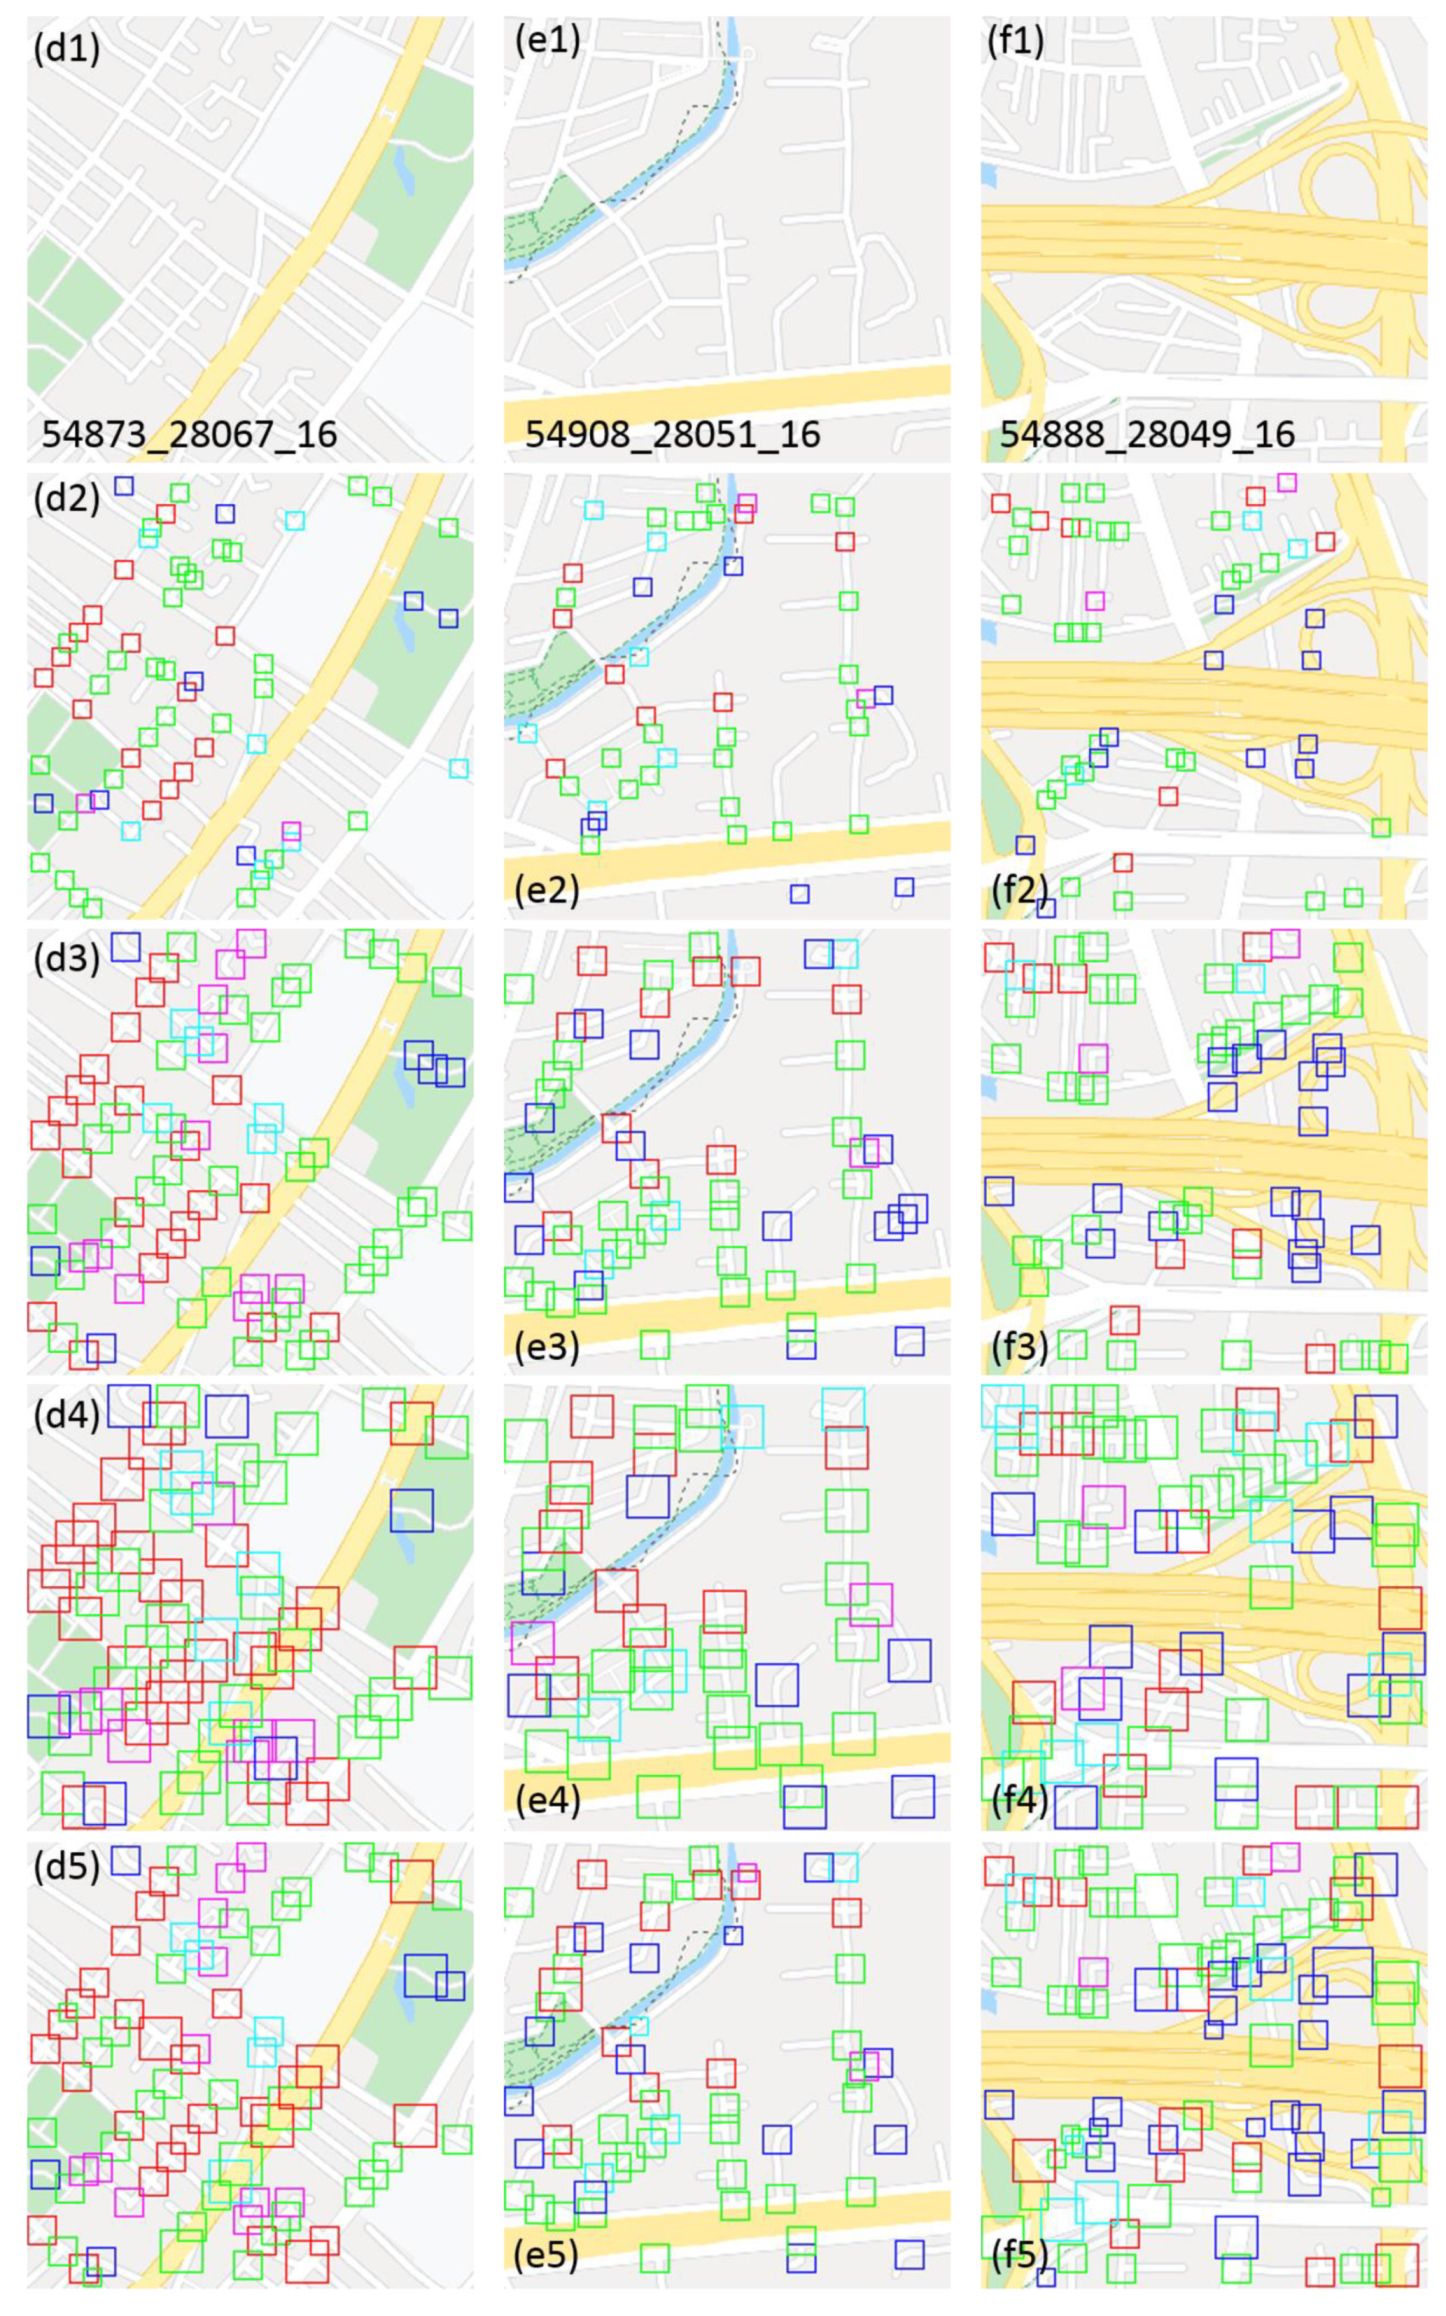
Due to limited space, six sample tiles, shown in Figure 7(a1)–(f1), are taken as examples with a comprehensive discussion to demonstrate the feasibility of our approach. These tiles encompass simple and complex road networks from the perspective of road network structure; rural, mountain, and city from the perspective of urbanization; and specific road networks such as bridges or highways from the perspective of road network construction. The XYZ encoding presented on the tiles shown in Figure 7(a1)–(f1) is noted as X_Y_Z, which indicates the location and zoom level of tiles. Figure 7 shows the road characteristics detection results, including results of three selected squares, small size (10 × 10 pixels) (Figure 7(a2)–(f2)), medium size (16 × 16 pixels) (Figure 7(a3)–(f3)), large size (24 × 24 pixels) (Figure 7(a4)–(f4)), and the final results (Figure 7(a5)–(f5)).

3.3. Discussion and Evaluation

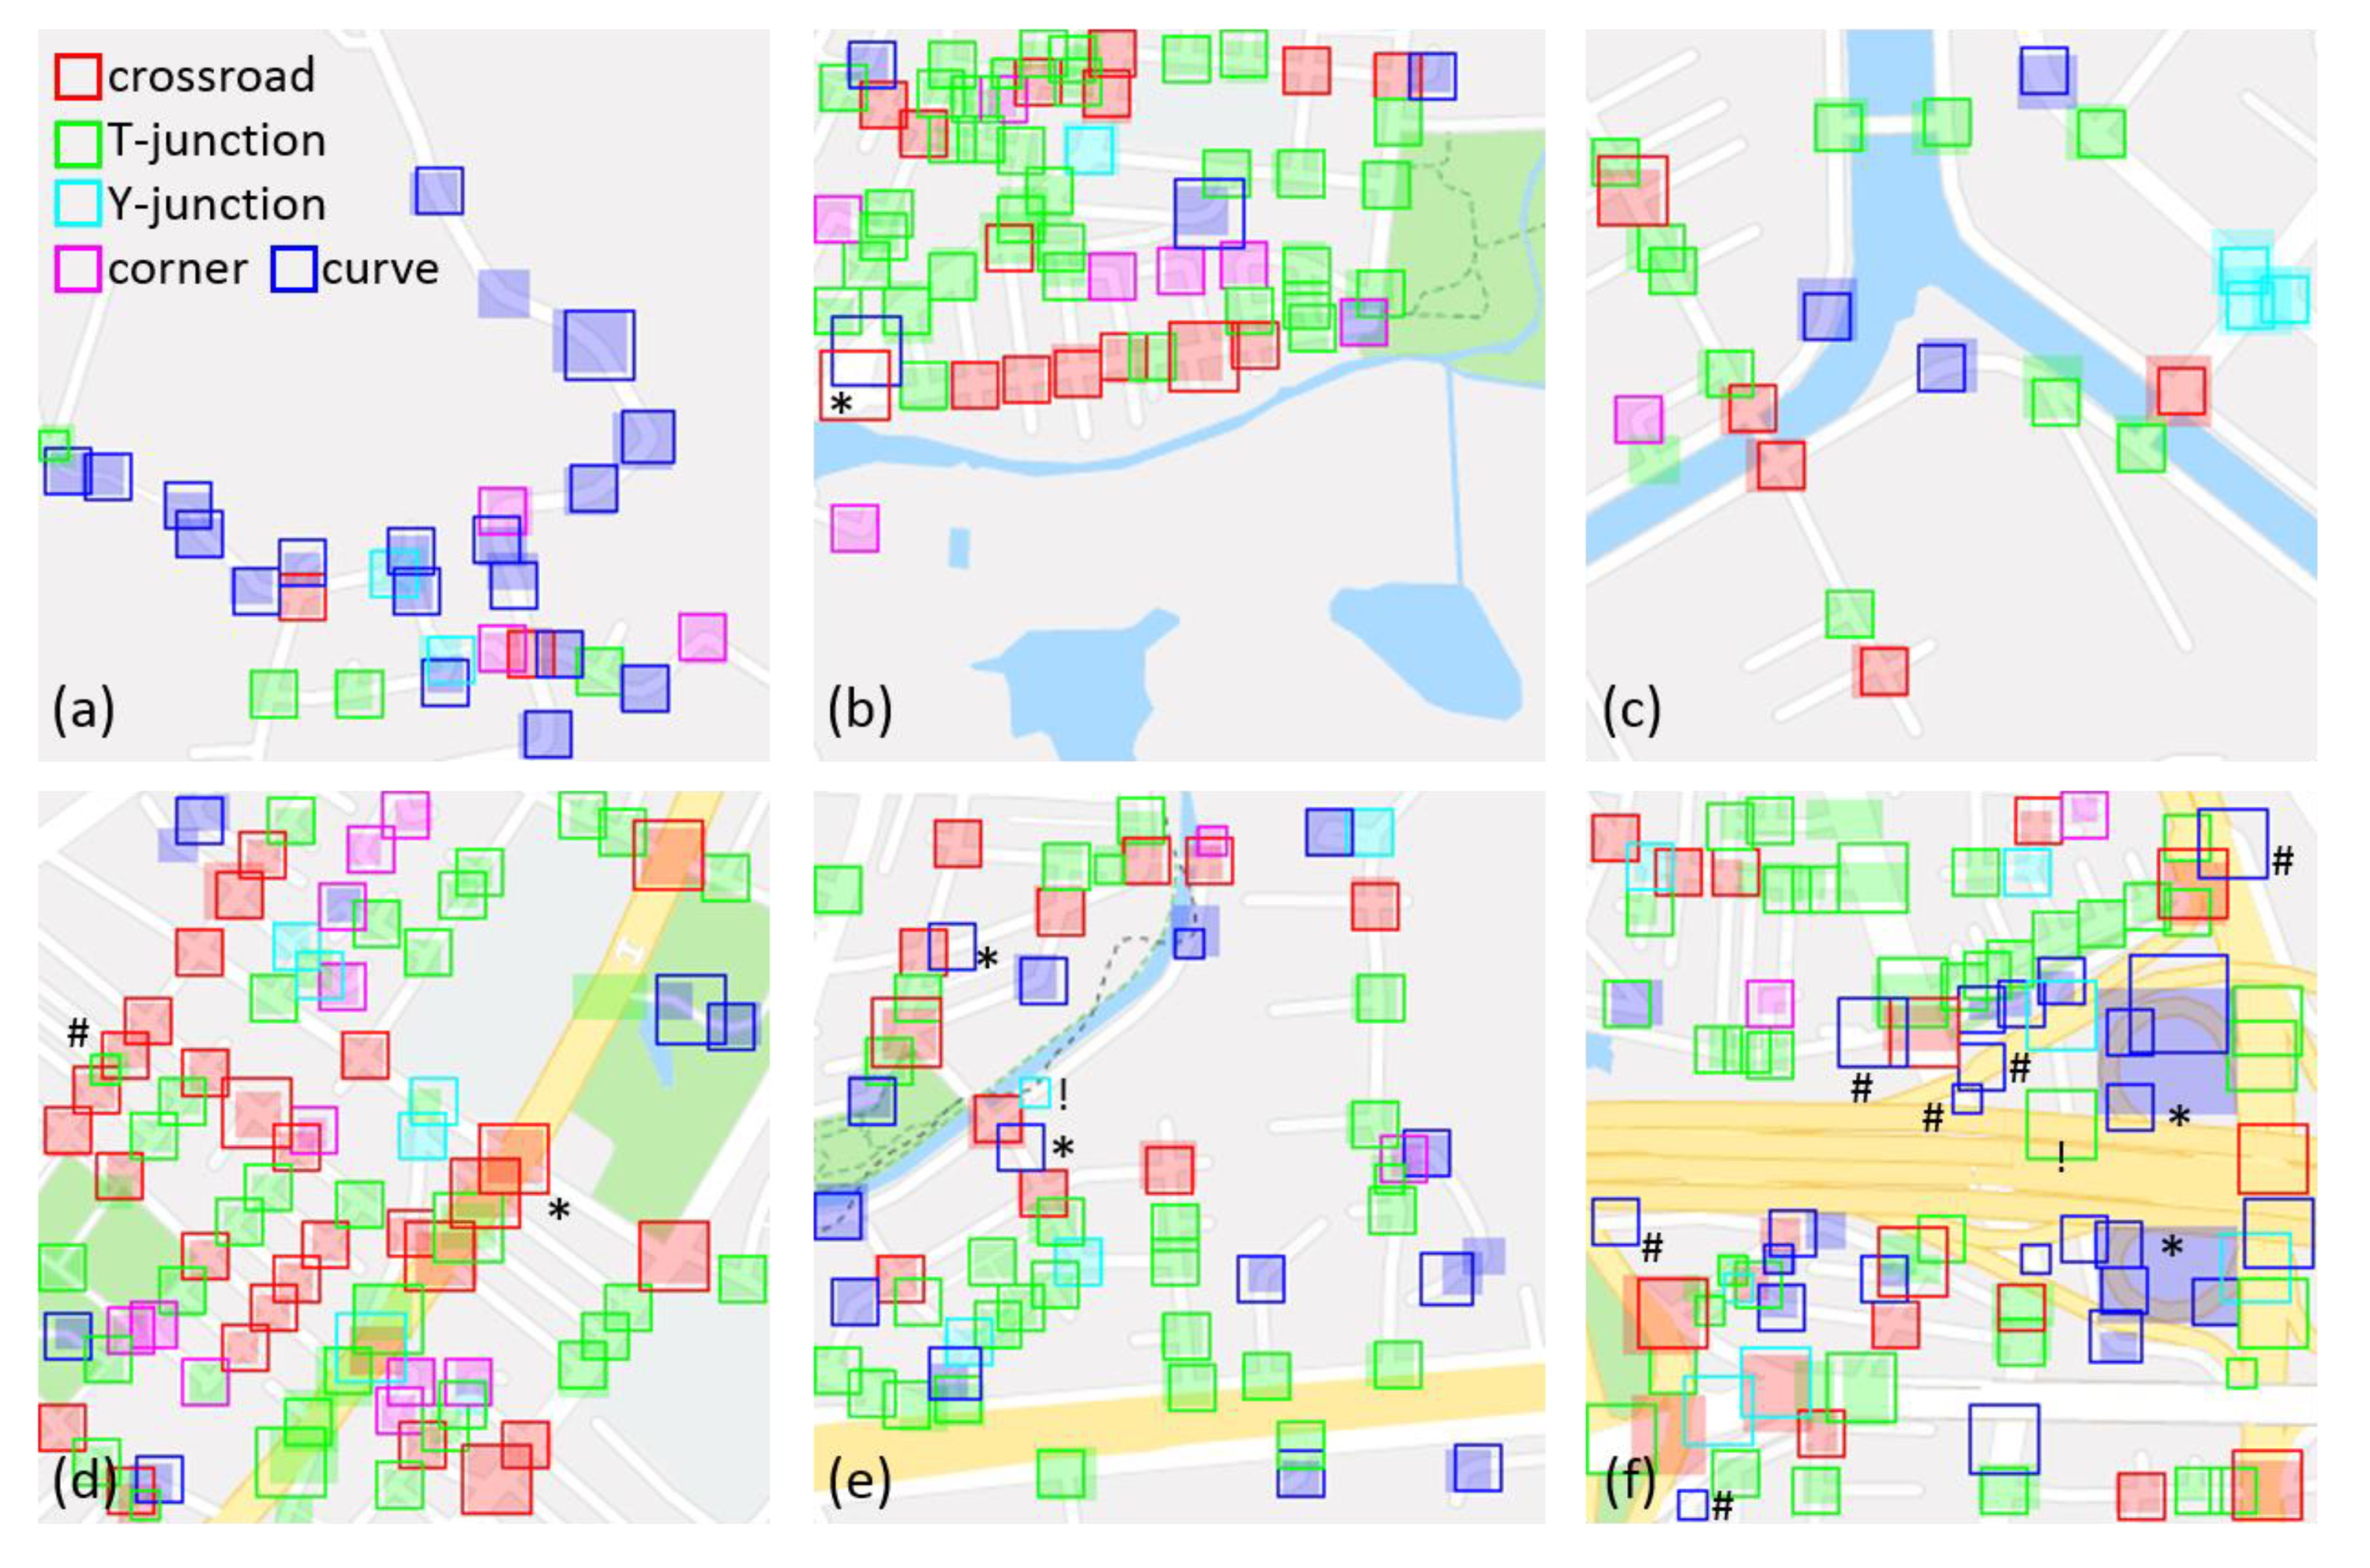
Remarkably, in model 1 and model 2, nearly 96% accuracy is achieved, and over 90% precision and recall are reached in most types of classification, except curves. Tests shown in Figure 7 reveal impressive results. Figure 8a–f shows our detection results overlaying ground truth results marked manually with color-filled areas. In all, five types of road characteristics are detected very well. Our experiments confirm the advantages of applying three sizes of detection squares to various widths and types of road networks. More specifically, in Figure 7(a5) and Figure 8a, it is interesting to note that the medium size performs general road detection well, while the large and small sizes handle a curve with a large radius of curvature and small road detection well, respectively. In Figure 7(b5) and Figure 8b, it is notable that bodies of water are detected as background features with perfect results, and roads are detected extremely successfully as well. Besides, one curve and one crossroad shown near a star sign (*) in Figure 8b are not marked in the ground truth results because they are not easily recognized by humans. Nevertheless, the two road characteristics can still be detected successfully using a large square by our methods. A striking result to emerge from Figure 7(c5) and Figure 8c is that a roundabout is detected as several Y-junctions. In Figure 7(d5) and Figure 8d, it is worth mentioning that large crossroads are detected in the middle of the main road with yellow (near a star sign (*) in Figure 8d) because T-junctions detected from the medium-sized square are replaced by applying Rule IV, which solves spatial coverage issues. In addition, a small T-junction successfully taken as supplementary is marked near multiple medium crossroads in a dense area (near a pound sign (#) in Figure 8d). In Figure 7(e5) and Figure 8e at the bottom, several T-junctions are correctly detected among local plane roads because there is a viaduct highway across. It is worth mentioning that two curves are detected successfully near two star signs (*) in Figure 8e even though they are not easily recognized by humans and thus not marked in the ground truth results. Most of the detection results perform well except for a Y-junction near an exclamation sign (!) in Figure 8e because a dashed line leads to an incorrect detection. In Figure 7(f5) and Figure 8f, because a freeway system interchange consisted of several lanes and loops with huge curvature radius, those lanes and loops are detected by several curves, not just one (shown near two star signs (*)). This is an expected limitation caused by the use of three fixed detection sizes in this study. That is, a low rate of recall may occur with all types of road characteristics for large objects because of unsupported detection sizes. In addition, several curves shown near a pound sign (#) can be successfully detected with three sizes of squares even though they are not easily recognized by humans. However, a few incorrect detections appear on the border between freeways and general roads, such as a T-junction near an exclamation sign (!) in Figure 8f. We are aware of the above limitation and conclude the following reasons for the incorrect detection.
  • The types of corner and curve have lower precision and lower recall than other types because of misclassification between these two types. Although a corner is defined as a road characteristic type shaped like a 90-degree geometric pattern, a curve is sometimes classified as a corner because its curvature is nearly 90 degrees. This is why the curve type has only 86% precision.
  • The detection of the types T-junction and Y-junction has shown good performance. However, false-positive cases of T-junctions may be caused when two nearly straight lanes are connected, or a curve is connected with a lane from three lanes of a Y-junction. In addition, the cases may be caused by vague images on the border between freeways and general roads as well. So it may be solved by including more training datasets.
  • Using adaptive squares for road characteristics detection has performed an outstanding job. However, a few incorrect detection results are mostly caused by insufficient coverage in the squares. For example, crossroads or T-junctions with large widths are not detected. Thus, this is a limitation identified in this study.
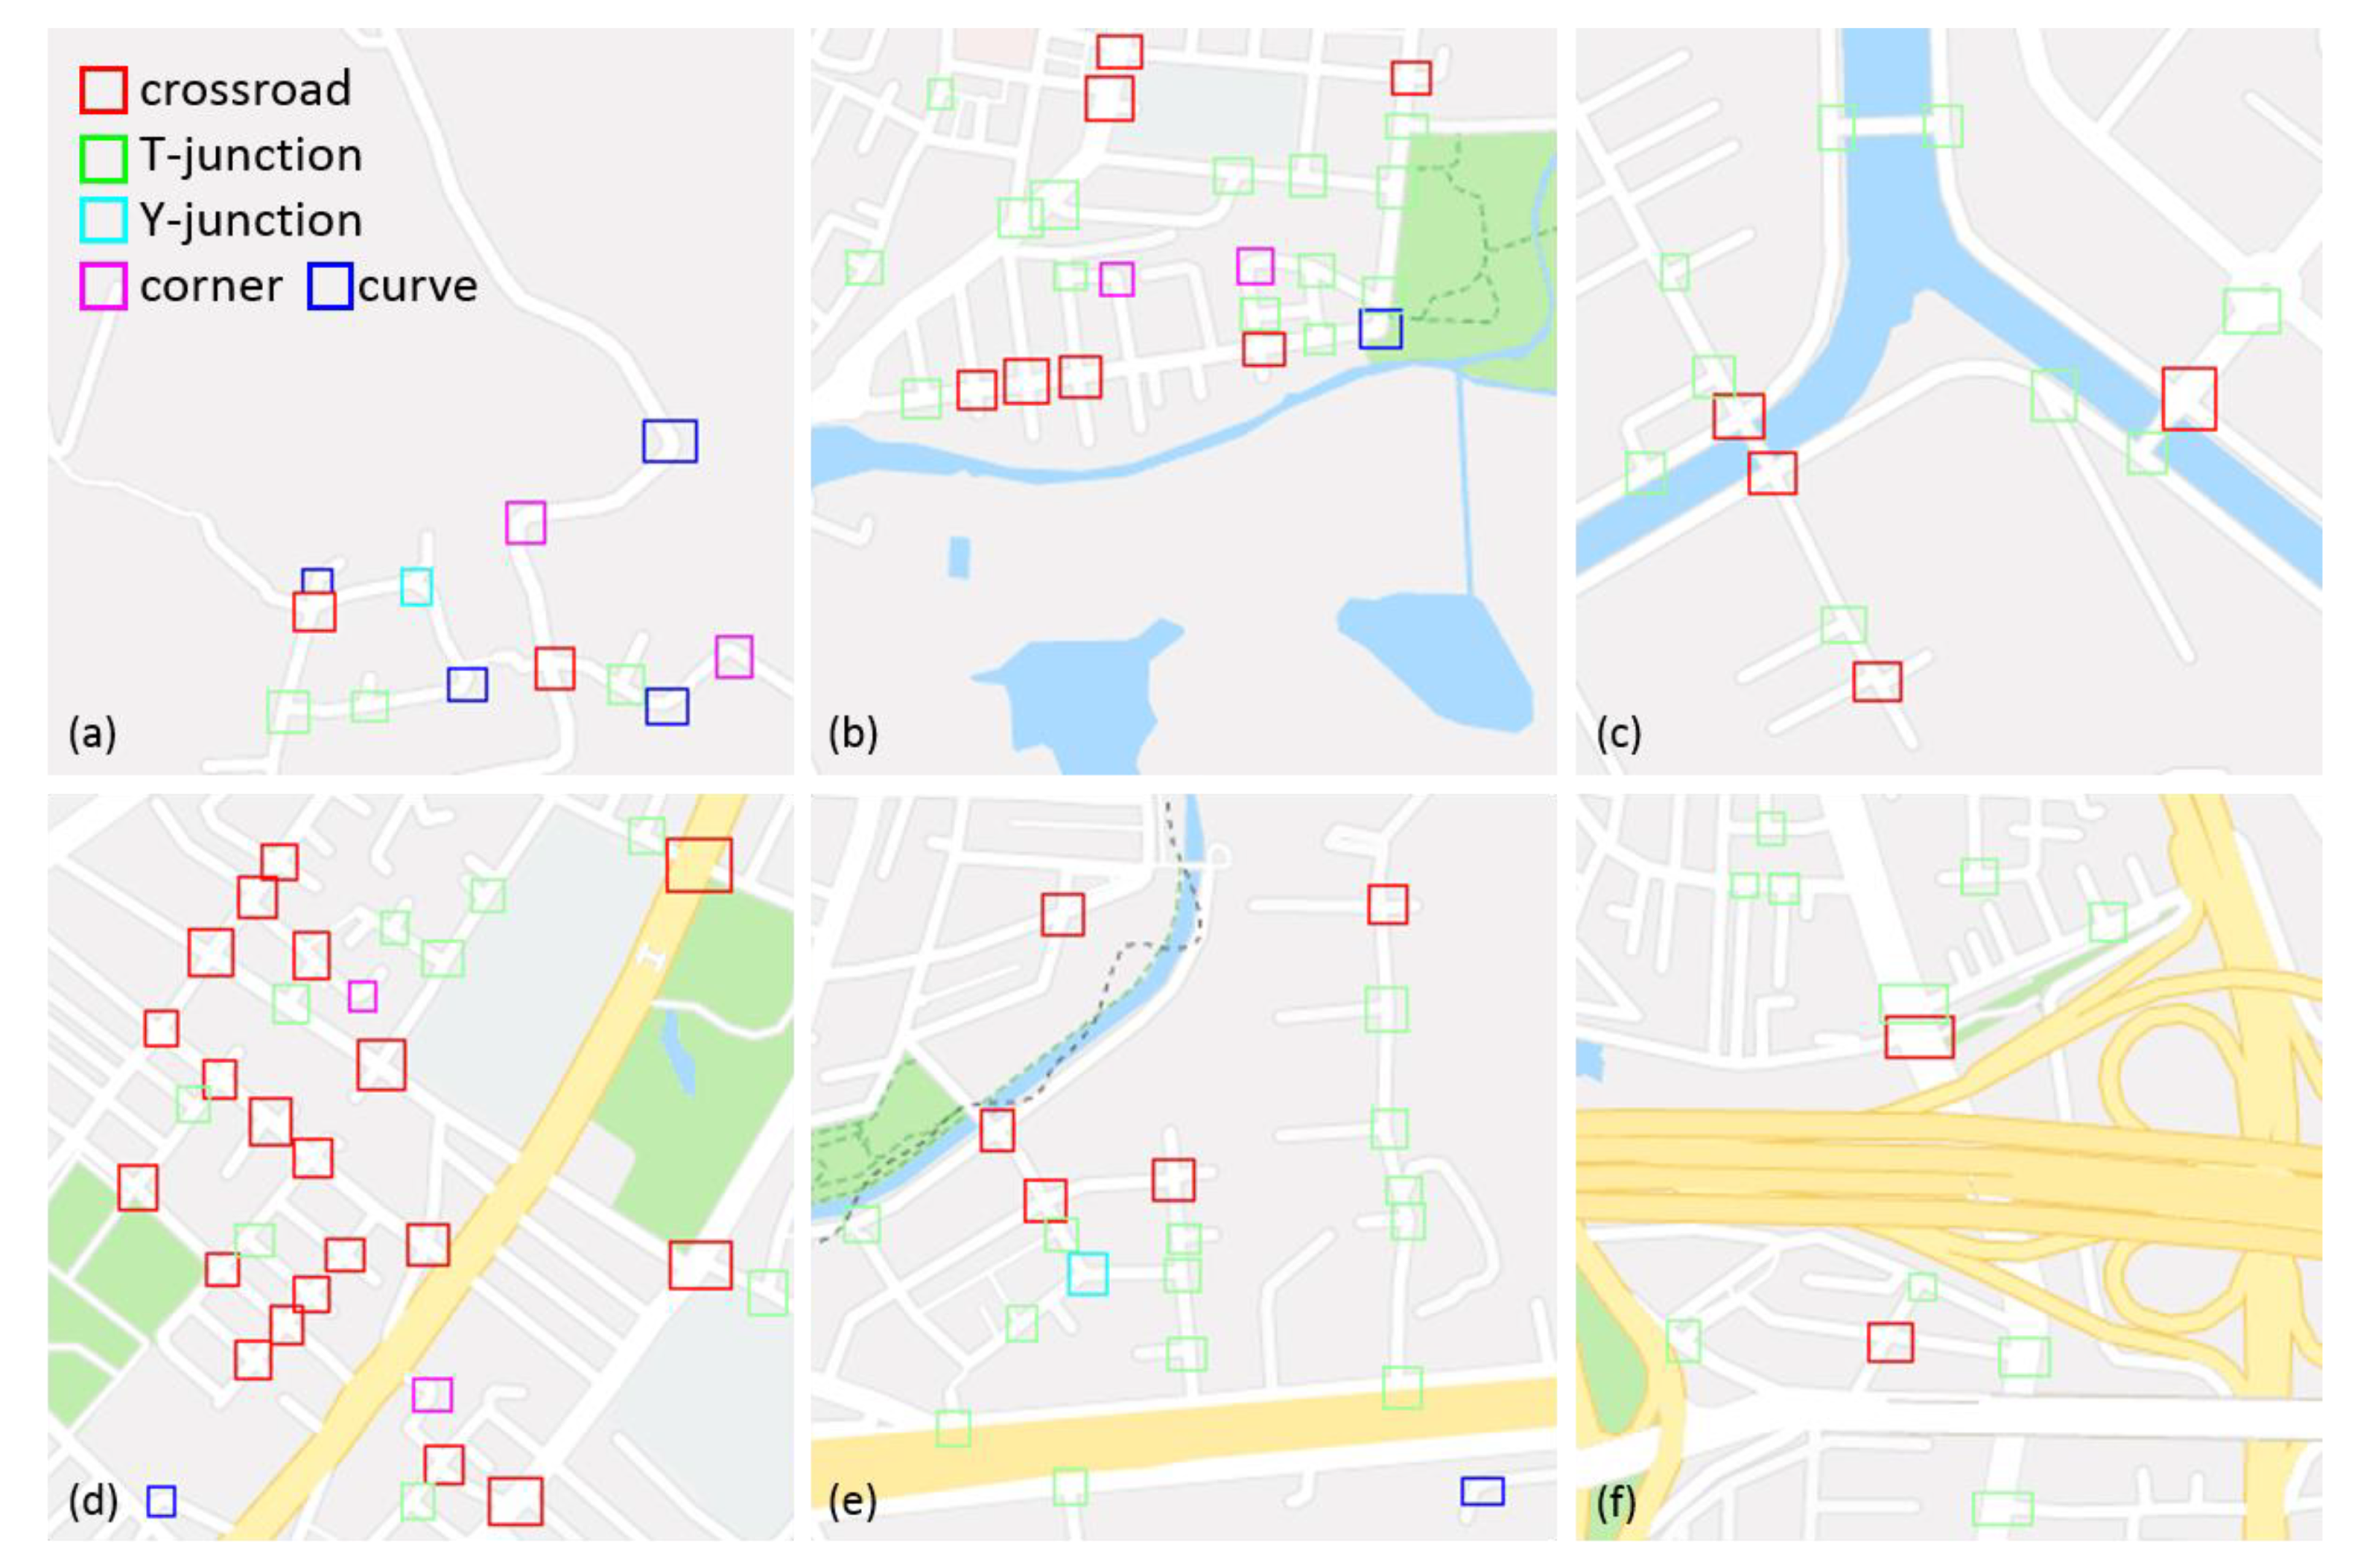
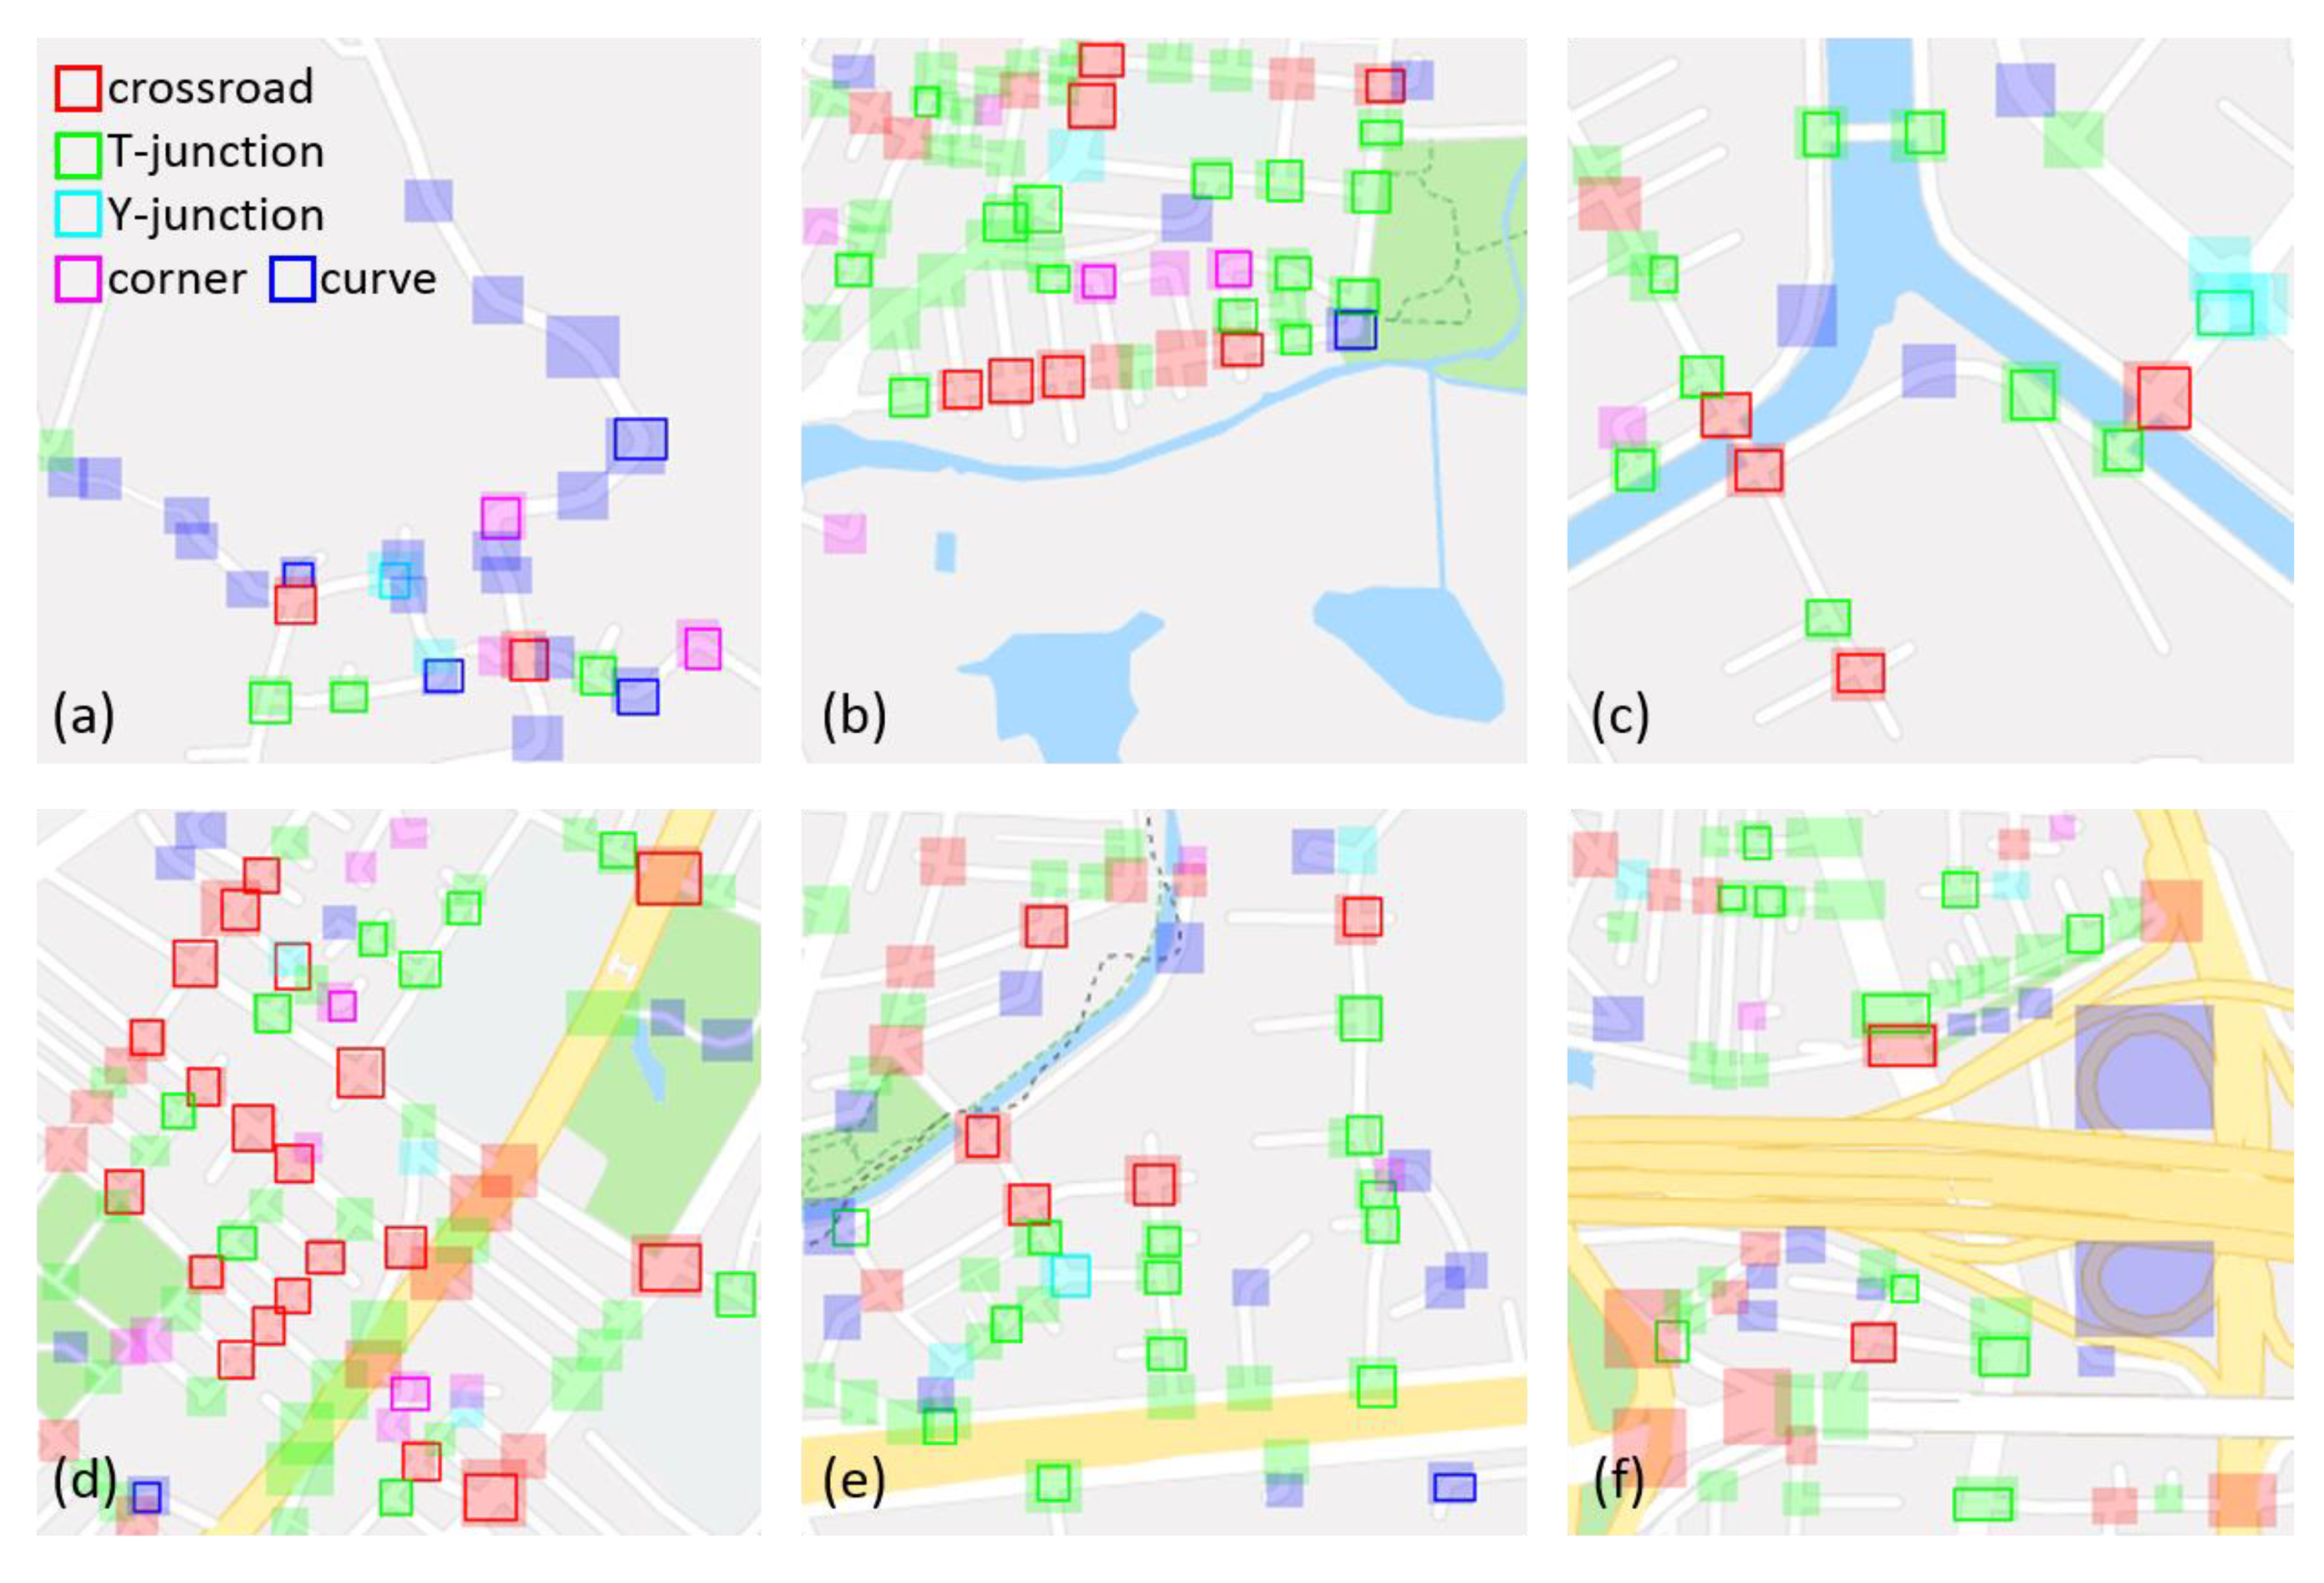
Faster R-CNN, a dominant deep-learning approach for object detection with excellent performance, is taken as a comparison. Faster R-CNN is a joint model composed of a region proposal network (RPN), and an R-CNN structure which takes tiles with label information to build a model, thus, 330 tiles (115 from urban areas, 95 from mountain areas, and 120 from areas with specific objects such highways or bridges) are selected as training data and labeled using the Labeling Script tool [62]. The total number of crossroads, T-junction, Y-junction, corner, and the curve are 4582, 8442, 509, 855, and 1371. The model is built completely with 500k steps. Sequentially, the model is applied for the road characteristics detection. Figure 9a–f shows the detection results of Faster R-CNN with a confidence score, 0.9, and Figure 10a–f shows the detection results overlaying ground truth results marked as color-filled areas. Overall, types of crossroad, T-junction, Y-junction, and corner achieved high precision but low recall. Based on the experimental results, we can claim that our method performs better than the Faster R-CNN as the amount of the training set used in the Faster R-CNN method is higher than that of training set used in our method, and outstanding results are shown in our method.

4. Conclusions and Future Work

Road characteristics such as intersections, irregular bends, and corners are not only substantial structures constructed in road networks to support transportation services but also crucial features widely used to assist with traffic-relevant analyses. This paper has proposed a deep-learning-based approach to detect five types of road characteristics, namely crossroads, T-junctions, Y-junctions, corners, and curves, from a currently popular geospatial tile service using a roadmap. The proposed approach, comprising two convolutional neural networks with adaptive squares, is simple and outperforms other deep frameworks because the joint frameworks responsible for binary classification and multi-class classification contribute to the high accuracy of classification results. Further, adopting three sizes of rotation-insensitive squares makes detection focused and much more efficient. Besides, combination rules are adopted to obtain optimal final results from three sizes of initial results. Our experimental results have demonstrated successful outcomes in reality and have been evaluated by ground truth results. The evaluation results show that our method provides a promising solution for the road characteristics detection and performs much better than a dominant deep-learning approach, the Faster R-CNN method. With the proposed method, the information of detected road characteristics with location and type is converted from human-readable to machine-readable. The study yields significant improvements in types of road characteristics, accuracy, and efficiency. Furthermore, it will potentially benefit many road-network-based applications such as feature point reminders, road condition reports, and early warning systems or alert detection for users, drivers, and even autonomous vehicles. We believe the simple deep-learning-based approach will provide a new method for object detection and geospatial information extraction from map tiles. Further research might explore more fully detailed road characteristics considering various degrees of curvature such as sharp curves and terrain factors such as uphill and downhill gradients to much more closely match our real-life usage cases. In addition, data fusion based on roadmaps and remote sensing imagery for a more robust solution is potentially interesting.

Author Contributions

Conceptualization, Chiao-Ling Kuo; methodology, Chiao-Ling Kuo and Ming-Hua Tsai; software, Chiao-Ling Kuo and Ming-Hua Tsai; validation, Chiao-Ling Kuo and Ming-Hua Tsai; formal analysis, Chiao-Ling Kuo and Ming-Hua Tsai; investigation, Chiao-Ling Kuo; resources, Chiao-Ling Kuo; data curation, Chiao-Ling Kuo and Ming-Hua Tsai; writing—original draft preparation, Chiao-Ling Kuo; writing—review and editing, Chiao-Ling Kuo; visualization, Chiao-Ling Kuo and Ming-Hua Tsai; supervision, Chiao-Ling Kuo; project administration, Chiao-Ling Kuo; funding acquisition, Chiao-Ling Kuo. All authors have read and agreed to the published version of the manuscript.

Funding

This research was funded by the Ministry of Science and Technology, Taiwan (R.O.C.), grant number MOST 108-2621-M-001-001-.

Data Availability Statement

Not applicable.

Acknowledgments

This research was also supported by the Spatial Economics project from the Center for Institution and Behavior Studies, RCHSS, Academia Sinica.

Conflicts of Interest

The authors declare no conflict of interest.

References

  1. Xie, K.; Wang, X.; Ozbay, K.; Yang, H. Crash frequency modeling for signalized intersections in a high-density urban road network. Anal. Methods Accid. Res. 2014, 2, 39–51. [Google Scholar] [CrossRef]
  2. Farahani, R.Z.; Miandoabchi, E.; Szeto, W.Y.; Rashidi, H. A review of urban transportation network design problems. European J. Oper. Res. 2013, 229, 281–302. [Google Scholar] [CrossRef] [Green Version]
  3. Marshall, W.E.; Garrick, N.W. Does street network design affect traffic safety? Accid. Anal. Prev. 2011, 43, 769–781. [Google Scholar] [CrossRef]
  4. Ewing, R.; Hamidi, S.; Grace, J.B. Urban sprawl as a risk factor in motor vehicle crashes. Urban Stud. 2016, 53, 247–266. [Google Scholar] [CrossRef] [Green Version]
  5. Wang, X.; Wu, X.; Abdel-Aty, M.; Tremont, P.J. Investigation of road network features and safety performance. Accid. Anal. Prev. 2013, 56, 22–31. [Google Scholar] [CrossRef] [PubMed]
  6. Montella, A.; Guida, C.; Mosca, J.; Lee, J.; Abdel-Aty, M. Systemic approach to improve safety of urban unsignalized intersections: Development and validation of a Safety Index. Accid. Anal. Prev. 2020, 141, 105523. [Google Scholar] [CrossRef] [PubMed]
  7. Yang, C.; Gidófalvi, G. Detecting regional dominant movement patterns in trajectory data with a convolutional neural network. Int. J. Geogr. Inf. Sci. 2020, 34, 996–1021. [Google Scholar] [CrossRef] [Green Version]
  8. Iagnemma, K. Route Planning for an Autonomous Vehicle. U.S. Patent US10126136B2, 13 November 2018. [Google Scholar]
  9. Chen, C.; Rickert, M.; Knoll, A. Combining task and motion planning for intersection assistance systems. In Proceedings of the 2016 IEEE Intelligent Vehicles Symposium (IV), Gothenburg, Sweden, 19–22 June 2016. [Google Scholar]
  10. Qiu, J.; Wang, R. Automatic extraction of road networks from GPS traces. Photogramm. Eng. Remote. Sens. 2016, 82, 593–604. [Google Scholar] [CrossRef]
  11. Li, L.; Li, D.; Xing, X.; Yang, F.; Rong, W.; Zhu, H. Extraction of road intersections from GPS traces based on the dominant orientations of roads. ISPRS Int. J. Geo-Inf. 2017, 6, 403. [Google Scholar] [CrossRef] [Green Version]
  12. Wang, J.; Wang, C.; Song, X.; Raghavan, V. Automatic intersection and traffic rule detection by mining motor-vehicle GPS trajectories. Comput. Environ. Urban Syst. 2017, 64, 19–29. [Google Scholar] [CrossRef]
  13. Yang, X.; Tang, L.; Niu, L.; Zhang, X.; Li, Q. Generating lane-based intersection maps from crowdsourcing big trace data. Transp. Res. Part C Emerg. Technol. 2018, 89, 168–187. [Google Scholar] [CrossRef]
  14. Xie, X.; Philips, W. Road intersection detection through finding common sub-tracks between pairwise GNSS traces. ISPRS Int. J. Geo-Inf. 2017, 6, 311. [Google Scholar] [CrossRef] [Green Version]
  15. Xie, X.; Wong, B.-Y.K.; Aghajan, H.; Veelaert, P.; Philips, W. Inferring directed road networks from GPS traces by track alignment. ISPRS Int. J. Geo-Inf. 2015, 4, 2446–2471. [Google Scholar] [CrossRef] [Green Version]
  16. Chen, B.; Ding, C.; Ren, W.; Xu, G. Extended Classification Course Improves Road Intersection Detection from Low-Frequency GPS Trajectory Data. ISPRS Int. J. Geo-Inf. 2020, 9, 181. [Google Scholar] [CrossRef] [Green Version]
  17. Munoz-Organero, M.; Ruiz-Blaquez, R.; Sánchez-Fernández, L. Automatic detection of traffic lights, street crossings and urban roundabouts combining outlier detection and deep learning classification techniques based on GPS traces while driving. Comput. Environ. Urban Syst. 2018, 68, 1–8. [Google Scholar] [CrossRef] [Green Version]
  18. Zourlidou, S.; Fischer, C.; Sester, M. Classification of street junctions according to traffic regulators. In Geospatial Technologies for Local and Regional Development: Short Papers, Posters and Poster Abstracts, Proceedings of the 22nd AGILE Conference on Geographic Information Science, Limassol, Cyprus, 17–20 June 2019; Kyriakidis, P., Hadjimitsis, D., Skarlatos, D., Mansourian, A., Eds.; Springer: Berlin/Heidelberg, Germany, 2019. [Google Scholar]
  19. Soilán, M.; Truong-Hong, L.; Riveiro, B.; Laefer, D. Automatic extraction of road features in urban environments using dense ALS data. Int. J. Appl. Earth Obs. Geoinf. 2018, 64, 226–236. [Google Scholar] [CrossRef]
  20. Jung, J.; Bae, S.-H. Real-time road lane detection in urban areas using LiDAR data. Electronics 2018, 7, 276. [Google Scholar] [CrossRef] [Green Version]
  21. Hu, J.; Razdan, A.; Femiani, J.C.; Cui, M.; Wonka, P. Road network extraction and intersection detection from aerial images by tracking road footprints. IEEE Trans. Geosci. Remote. Sens. 2007, 45, 4144–4157. [Google Scholar] [CrossRef]
  22. Chiang, Y.-Y.; Knoblock, C.A.; Shahabi, C.; Chen, C.-C. Automatic and accurate extraction of road intersections from raster maps. GeoInformatica 2009, 13, 121–157. [Google Scholar] [CrossRef]
  23. Chiang, Y.-Y.; Knoblock, C.A.; Chen, C.-C. Automatic extraction of road intersections from raster maps. In Proceedings of the 13th annual ACM international workshop on Geographic information systems, Bremen, Germany, 4–5 November 2005. [Google Scholar]
  24. Liu, J.; Qin, Q.; Li, J.; Li, Y. Rural road extraction from high-resolution remote sensing images based on geometric feature inference. ISPRS Int. J. Geo-Inf. 2017, 6, 314. [Google Scholar] [CrossRef] [Green Version]
  25. Bakhtiari, H.R.R.; Abdollahi, A.; Rezaeian, H. Semi automatic road extraction from digital images. Egypt. J. Remote. Sens. Space Sci. 2017, 20, 117–123. [Google Scholar] [CrossRef]
  26. Mokhtarzade, M.; Zoej, M.V. Road detection from high-resolution satellite images using artificial neural networks. Int. J. Appl. Earth Obs. Geoinf. 2007, 9, 32–40. [Google Scholar] [CrossRef] [Green Version]
  27. Bhatt, D.; Sodhi, D.; Pal, A.; Balasubramanian, V.; Krishna, M. Have i reached the intersection: A deep learning-based approach for intersection detection from monocular cameras. In Proceedings of the 2017 IEEE/RSJ International Conference on Intelligent Robots and Systems (IROS), Vancouver, BC, Canada, 24–28 September 2017. [Google Scholar]
  28. Bastani, F.; He, S.; Abbar, S.; Alizadeh, M.; Balakrishnan, H.; Chawla, S.; Madden, S.; DeWitt, D. Roadtracer: Automatic extraction of road networks from aerial images. In Proceedings of the IEEE Conference on Computer Vision and Pattern Recognition, Salt Lake City, UT, USA, 18–23 June 2018. [Google Scholar]
  29. Saeedimoghaddam, M.; Stepinski, T. Automatic extraction of road intersection points from USGS historical map series using deep convolutional neural networks. Int. J. Geogr. Inf. Sci. 2020, 34, 947–968. [Google Scholar] [CrossRef]
  30. Ruiz, J.; Rubio, T.; Urena, M. Automatic extraction of road intersections from images based on texture characterisation. Surv. Rev. 2011, 43, 212–225. [Google Scholar] [CrossRef]
  31. Masó, J.; Pomakis, K.; Julià, N. OGC Web Map Tile Service (WMTS). Implement. Standard. Ver 2010, 1, 114. [Google Scholar]
  32. Tile Map Service Specification. Available online: https://wiki.osgeo.org/wiki/Tile_Map_Service_Specification (accessed on 15 June 2020).
  33. Kastanakis, B. Mapbox Cookbook; Packt Publishing Ltd.: Birmingham, UK, 2016. [Google Scholar]
  34. Martinelli, L.; Roth, M. Vector Tiles from OpenStreetMap; HSR Hochschule für Technik Rapperswil: Rapperswil-Jona, Switzerland, 2015. [Google Scholar]
  35. Shi, N.X.; Wu, X. Method of Client Side Map Rendering with Tiled Vector Data. U.S. Patent US7734412B2, 8 June 2010. [Google Scholar]
  36. Zhao, Z.-Q.; Zheng, P.; Xu, S.-T.; Wu, X. Object detection with deep learning: A review. IEEE Trans. Neural Netw. Learn. Syst. 2019, 30, 3212–3232. [Google Scholar] [CrossRef] [PubMed] [Green Version]
  37. Liu, L.; Ouyang, W.; Wang, X.; Fieguth, P.; Chen, J.; Liu, X.; Pietikäinen, M. Deep learning for generic object detection: A survey. Int. J. Comput. Vis. 2020, 128, 261–318. [Google Scholar] [CrossRef] [Green Version]
  38. Pathak, A.R.; Pandey, M.; Rautaray, S. Application of deep learning for object detection. Procedia Comput. Sci. 2018, 132, 1706–1717. [Google Scholar] [CrossRef]
  39. Behrendt, K.; Novak, L.; Botros, R. A deep learning approach to traffic lights: Detection, tracking, and classification. In Proceedings of the 2017 IEEE International Conference on Robotics and Automation (ICRA), Singapore, 29 May–3 June 2017. [Google Scholar]
  40. Mundhenk, T.N.; Konjevod, G.; Sakla, W.A.; Boakye, K. A large contextual dataset for classification, detection and counting of cars with deep learning. In European Conference on Computer Vision; Springer: Berlin/Heidelberg, Germany, 2016. [Google Scholar]
  41. Kussul, N.; Lavreniuk, M.; Skakun, S.; Shelestov, A. Deep learning classification of land cover and crop types using remote sensing data. IEEE Geosci. Remote. Sens. Lett. 2017, 14, 778–782. [Google Scholar] [CrossRef]
  42. Zhang, C.; Sargent, I.; Pan, X.; Li, H.; Gardiner, A.; Hare, J.; Atkinson, P.M. Joint Deep Learning for land cover and land use classification. Remote. Sens. Environ. 2019, 221, 173–187. [Google Scholar] [CrossRef] [Green Version]
  43. Google Maps. Available online: https://www.google.com/maps (accessed on 1 February 2020).
  44. OpenStreetMap. Available online: https://www.openstreetmap.org/ (accessed on 5 May 2021).
  45. Pourabdollah, A.; Morley, J.; Feldman, S.; Jackson, M. Towards an authoritative OpenStreetMap: Conflating OSM and OS OpenData national maps’ road network. ISPRS Int. J. Geo-Inf. 2013, 2, 704–728. [Google Scholar] [CrossRef]
  46. Wu, S.; Du, C.; Chen, H.; Xu, Y.; Guo, N.; Jing, N. Road extraction from very high resolution images using weakly labeled OpenStreetMap centerline. ISPRS Int. J. Geo-Inf. 2019, 8, 478. [Google Scholar] [CrossRef] [Green Version]
  47. Nasiri, A.; Abbaspour, R.A.; Chehreghan, A.; Arsanjani, J.J. Improving the quality of citizen contributed geodata through their historical contributions: The case of the road network in OpenStreetMap. ISPRS Int. J. Geo-Inf. 2018, 7, 253. [Google Scholar] [CrossRef] [Green Version]
  48. Li, J.; Qin, H.; Wang, J.; Li, J. OpenStreetMap-based autonomous navigation for the four wheel-legged robot via 3D-Lidar and CCD camera. IEEE Trans. Ind. Electron. 2021, 1-1. [Google Scholar] [CrossRef]
  49. Keller, S.; Gabriel, R.; Guth, J. Machine learning framework for the estimation of average speed in rural road networks with openstreetmap data. ISPRS Int. J. Geo-Inf. 2020, 9, 638. [Google Scholar] [CrossRef]
  50. Novack, T.; Wang, Z.; Zipf, A. A system for generating customized pleasant pedestrian routes based on OpenStreetMap data. Sensors 2018, 18, 3794. [Google Scholar] [CrossRef] [Green Version]
  51. Wang, Z.; Niu, L. A data model for using OpenStreetMap to integrate indoor and outdoor route planning. Sensors 2018, 18, 2100. [Google Scholar] [CrossRef] [Green Version]
  52. Sehra, S.S.; Singh, J.; Rai, H.S. Assessing OpenStreetMap Data Using Intrinsic Quality Indicators: An Extension to the QGIS Processing Toolbox. Future Internet 2017, 9, 15. [Google Scholar] [CrossRef] [Green Version]
  53. Jacobs, K.T.; Mitchell, S.W. OpenStreetMap quality assessment using unsupervised machine learning methods. Trans. GIS 2020, 24, 1280–1298. [Google Scholar] [CrossRef]
  54. Mooney, P.; Minghini, M. A review of OpenStreetMap data. In Mapping and the Citizen Sensor; Foody, G., See, L., Fritz, S., Mooney, P., Olteanu-Raimond, A., Fonte, C.C., Antoniou, V., Eds.; Ubiquity Press: London, UK, 2017; pp. 37–59. [Google Scholar] [CrossRef] [Green Version]
  55. Ren, S.; He, K.; Girshick, R.; Sun, J. Faster r-cnn: Towards real-time object detection with region proposal networks. arXiv 2015, arXiv:1506.01497. [Google Scholar] [CrossRef] [Green Version]
  56. Google Maps Platform Documentation- Maps Static API. Available online: https://developers.google.com/maps/documentation/maps-static/start (accessed on 10 October 2020).
  57. Google Maps Platform Documentation- Styled Maps. Available online: https://developers.google.com/maps/documentation/maps-static/styling (accessed on 10 October 2020).
  58. Simonyan, K.; Zisserman, A. Very deep convolutional networks for large-scale image recognition. arXiv 2014, arXiv:1409.1556. [Google Scholar]
  59. Szegedy, C.; Ioffe, S.; Vanhoucke, V.; Alemi, A.A. Inception-v4, inception-resnet and the impact of residual connections on learning. In Proceedings of the Thirty-First AAAI Conference on Artificial Intelligence, San Francisco, CA, USA, 4–9 February 2017. [Google Scholar]
  60. Hosang, J.; Benenson, R.; Schiele, B. Learning non-maximum suppression. In Proceedings of the IEEE Conference on Computer Vision and Pattern Recognition, Honolulu, HI, USA, 21–26 July 2017; pp. 4507–4515. [Google Scholar]
  61. Google Maps Platform Styling Wizard. Available online: https://mapstyle.withgoogle.com/ (accessed on 14 October 2019).
  62. LabelImg. Git Code. Available online: https://github.com/tzutalin/labelImg (accessed on 1 July 2020).
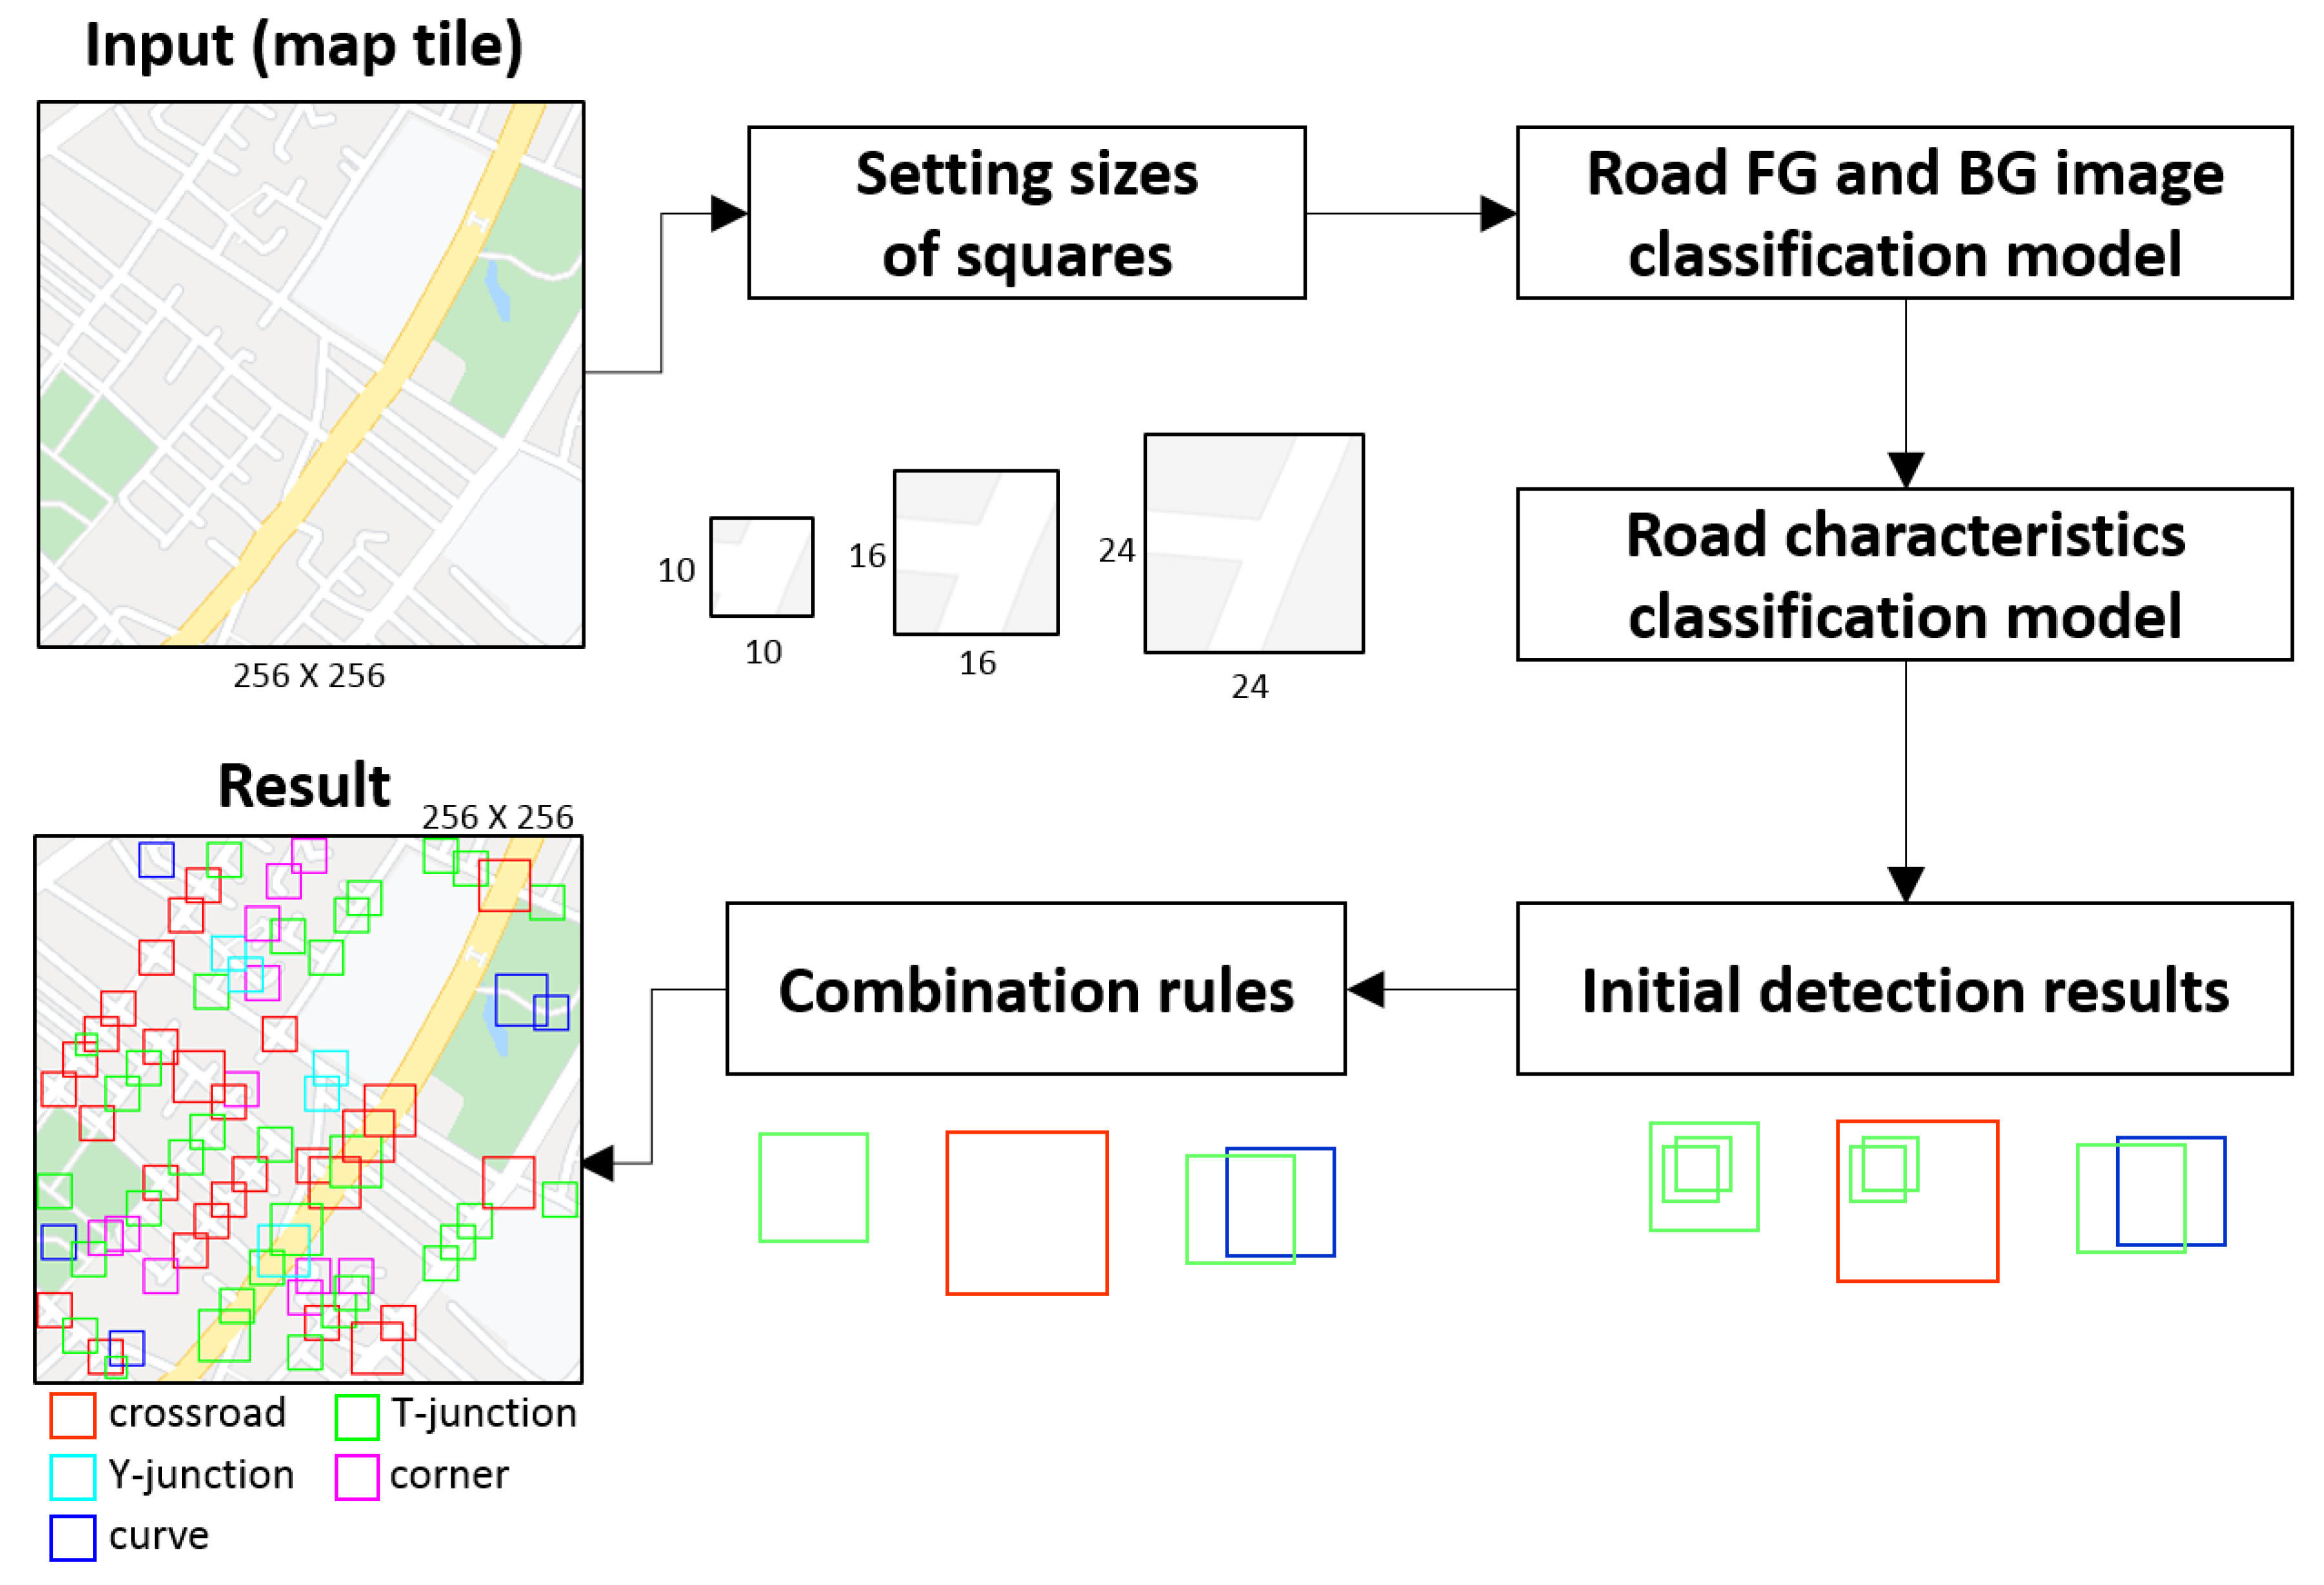
Figure 1. Workflow of the road characteristics detection.
Ijgi 10 00377 g001
Figure 2. Samples of road networks with proposed three sizes of squares.
Ijgi 10 00377 g002
Figure 3. Architecture of road FG and BG image classification model and road characteristics classification model.
Ijgi 10 00377 g003
Figure 4. Samples of five types of road characteristics retrieved from Google roadmap.
Ijgi 10 00377 g004
Figure 5. The flowchart of processing steps with combination rules.
Ijgi 10 00377 g005
Figure 6. The study area is located in Taipei, Taiwan. (a) Comprehensive roadmap with a large red rectangle where the study area is located; (b) filtered roadmap with six sample tiles indicated in small red squares and by letters a through f.
Ijgi 10 00377 g006
Figure 7. Road characteristics detection results: (a1f1) are original tiles numbered 54897_28039_16, 54880_28041_16, 54876_28052_16, 54873_28067_16, 54908_28051_16, and 54888_28049_16. Those from (a2f2) are initial results of small size; (a3f3) are initial results of medium size; (a4f4) are initial results of large size; and from (a5f5) are final results obtained from three sizes of initial results adopting combination rules.
Ijgi 10 00377 g007aIjgi 10 00377 g007b
Figure 8. Our results overlaid on ground truth results that are marked as color-filled areas: (a) 54897_28039_16, (b) 54880_28041_16, (c) 54876_28052_16, (d) 54873_28067_16, (e) 54908_28051_16, and (f) 54888_28049_16.
Ijgi 10 00377 g008
Figure 9. Road characteristics detection results using Faster R-CNN: (a) 54897_28039_16, (b) 54880_28041_16, (c) 54876_28052_16, (d) 54873_28067_16, (e) 54908_28051_16, and (f) 54888_28049_16.
Ijgi 10 00377 g009
Figure 10. Faster R-CNN results overlaid on ground truth results that are marked as color-filled areas: (a) 54897_28039_16, (b) 54880_28041_16, (c) 54876_28052_16, (d) 54873_28067_16, (e) 54908_28051_16, and (f) 54888_28049_16.
Ijgi 10 00377 g010
Table 1. Combination rules.
Object10 × 10 Pixels (Small)16 × 16 Pixels (Medium)24 × 24 Pixels (Large)
Subject ABCDEABCDEABCDE
10 × 10
pixels (small)
A //////////
B/ /////////////
C //////////
D/// ///////////
E //////////
16 × 16
pixels (medium)
A
B / ///
C
D /// /
E
24 × 24
pixels (large)
A /////
B ////// ///
C /////
D //////// /
E /////
A: crossroad, B: curve, C: corner, D: T-junction, E: Y-junction. /: Non-processed. Rule I: Ijgi 10 00377 i001 Rule II: Ijgi 10 00377 i002 Rule III: Ijgi 10 00377 i003 Rule IV: Ijgi 10 00377 i004 Rule V: Ijgi 10 00377 i005 NMS + CS: Ijgi 10 00377 i006.
Table 2. The numbers of images of training, validation and test sets for the experiments.
ModelModel 1Model 2
Data Set BGFGBGCrossroadT-JunctionY-JunctionCornerCurve
Training set25502550510510510510510510
Validation set12751275250255255255255255
Test set425425808585858585
Table 3. The accuracy of the two models.
ModelValidation SetTest Set
Model 10.9620.960
Model 20.9620.969
Table 4. The precision and recall of the two models of the test dataset.
MeasuresPrecisionRecallF1-Score
Model with Types
Model 1BG0.9510.9690.960
FG0.9690.9520.960
Model 2BG0.9980.9930.995
crossroad111
T-junction0.9410.9410.941
Y-junction0.9410.9410.941
corner0.9650.9010.932
curve0.859 0.9480.901
Publisher’s Note: MDPI stays neutral with regard to jurisdictional claims in published maps and institutional affiliations.