Article

Assessment of Surface Water Availability under Climate Change Using Coupled SWAT-WEAP in Hongshui River Basin, China

1
College of Civil Engineering and Architecture, Guangxi University, Nanning 530004, China
2
Key Laboratory of Disaster Prevention and Structural Safety of Ministry of Education, Nanning 530004, China
3
Guangxi Key Laboratory of Disaster Prevention and Engineering Safety, Nanning 530004, China
*
Author to whom correspondence should be addressed.
ISPRS Int. J. Geo-Inf. 2021, 10(5), 298; https://doi.org/10.3390/ijgi10050298
Submission received: 22 February 2021 / Revised: 15 April 2021 / Accepted: 2 May 2021 / Published: 5 May 2021

Abstract

:
Climate change adversely affects the hydrological cycle at the basin level. This study integrated two models, the Soil and Water Assessment Tool (SWAT) for future climate prediction, and Water Evaluation and Planning (WEAP) for the simulation of water quantity in the Hongshui River Basin (HRB), to evaluate the impacts of climate change, which plays a significant role in the lives of inhabitants downstream of the basin. Downscaled monthly rainfalls and temperatures under four Representative Concentration Pathways (RCPs) emission scenarios from five global circulation models (GCMs) were used to generate streamflow using the SWAT model. Streamflow data (1991–2001) were used to calibrate and validate, with the period of 1991–1997 used for calibration and that of 1998–2001 used for validation. Six scenarios were established to evaluate the response of the basin under socio-economic scenarios. The simulated results show that precipitation and streamflow would likely undergo a slight increase. The available water resources would be sufficient to meet the existing needs until 2050. The results indicated that no water shortages exist under socio-economic, low, and medium climate change emission scenarios, however the basin will experience a water shortage under the high climate change emission scenario (RCP-8.5). The study proposed that, to ensure the sustainability of water resources, better long-term management policies are required to be implemented in the basin and to meet future downstream water needs.

1. Introduction

Climate change is a major challenge and a leading cause of global warming. Climate changes alter the average temperature of the Earth’s climate system and induce related effects. These effects are likely to affect the hydrological cycle and, consequently, water availability for agriculture, industrial, and domestic sectors [1]. To tackle future water stress, the sustainable use of water resources, at local and global scales, is essential [2]. Sustainable water resources management requires analysis and quantification of several hydrological processes taking place within the watershed basin [3]. Anthropogenic effects have rapidly changed the global eco-system. These rapid changes can be seen as socio-economic development, population growth, and deforestation associated with the expansion of cities [4]. Climate change and urbanization are interconnected and have had an increasing environmental impact during the 21st century. The urban population, as a share of the total, recently reached 50%, and this proportion will be over 80% by 2050, according to Yan, et al. [5]. Global warming has altered precipitation and temperature patterns, which could have a significant impact on the local hydrological cycle. These changes in the hydrological cycle will increase or decrease stream water flows [6].
Climate change, population growth, and economic development will clearly affect the availability of potential water resources in numerous regions. Climate change impacts are a global issue, however, researchers are most interested in local effects at the basin level. One of the most influential findings of related research is that climate change will alter hydrological processes and water availability around the world [7]. Introducing proper water management strategies and understanding the interaction between climate change and water resources, will help researchers and policymakers reduce the harmful effects. Several studies of the impacts of climate change on hydrological processes indicate that streamflow variations are related to changes in temperature and rainfall [3,8,9,10]. Researchers frequently analyze hydro-climatological processes using the global circulation model (GCM), and hydrological models have been demonstrated to support water resource management and prediction, especially at the basin scale [11,12,13,14]. In the Upper Colorado River Basin (UCRB), demand in most years exceeds supply, and is likely to continue to rise. Results of research using the GCM showed that the summer streamflow declines with a median decrease of 46%, and a total range of +22% until 2100 [15]. In a study of the uncertainty related to seven GCMs, the consequences for the Mekong River Basin of a 2 °C increase in the global average temperature were investigated. Result showed a relatively small, yet nonlinear, response of annual river discharge, from 4.5% to 5.4%, to a rise in the global average temperature [16]. Studies indicates that a temperature increase of 0.05 °C per decade has occurred as a consequence of urbanization in mainland China [17]. An investigation of climate change impacts on the Lanchang River (LR), in the Tibetan plateau in China, show that climate change contributed 57% to the increase in stream flows, and human activity contributed 95% to the post-impact period (2008–2014) [18]. Climate data were projected using a statistical downscaling model and three CMIP5 global circulation models under Representative Concentration Pathways for Xin River Basin, China. The average ensemble of the GCMs showed that streamflows under RCPs decrease significantly [12]. The characteristics of hydro-climatic changes in the Tarim River Basin were analyzed using data collected at 39 weather stations and 29 hydrological stations for the periods 1961–2008 and 1952–2008. Changes were explained by anthropogenic activities and climate change [19], and the hydrological response to climate change under the average of four RCPs showed a decline of 21.5–40% in annual average runoff [20]. During the past 50 years, runoff has decreased in most river basins in China. Examination of the contributions of related human activity and climate change to the hydrological response of the Weihe River Basin established that human activity has had a greater impact on basin runoff than climate change [21,22,23]. These studies have highlighted the strong impact on stream flows of climate change and illustrated the importance of incorporating such research into adaptive management.
Researchers have widely used hydrological models to assess climate change impacts on hydrological regimes. These tools can be used to calculate many hydrological parameters, including streamflow, runoff, evapotranspiration, and yield of water. Computing these hydrological parameters and selecting hydrological approaches are crucial to assessing the impacts of current and future climate change [2,9,24,25]. Integrated simulation models are needed to quantify water supply and demand balance [24]. Integrated water change management concepts have been well established as one of the best approaches to manage sustainability of water resources [25,26]. The Water Evaluation and Planning (WEAP) model provides a set of objects and procedures to address issues faced by water managers using a scenario-based approach that can be applied to natural watersheds, reservoirs, streams, and channels [27]. The WEAP tool has been used by several researchers to model water demand and supply, and to assess climate change impacts on hydrological processes, groundwater management, and water pricing [28,29,30,31,32]. These models are mainly restricted to water resource research in relation to runoff, however, and no analysis has been undertaken of other hydrological components for physical use, such as evapotranspiration (ET). The Soil and Water Assessment Tool (SWAT) model and other hydrological models can adequately represent hydrological processes and other physical hydrological elements. Nonetheless, traditional water-based simulation models are often unable to address contemporary water management problems [33,34]. Therefore, a robust water resource assessment and management tool is needed to consider hydrological responses to climate change, water resource allocation, the agricultural economy, and other factors in the design of water management options. In this study, we established a SWAT–WEAP combination approach that considered both hydrological processes and water management evaluations and analysis [35].
Historically, the Hongshui River Basin, China, one of the major streams of the Xijiang River Basin, did not undergo rapid land cover changes. However, government reforms in the early 1980s, undertaken to boost economic growth, directly improve living standards, and increase urbanization by 300 percent, had serious impacts on various hydro-climatic observations [36,37]. The overexploitation of water resources in the region has resulted in a series of environmental and ecological effects, including the drying up of rivers and lakes, groundwater depletion, grassland erosion, and ravaging dust storms. Additionally, water shortages have exacerbated disputes around provincial boundaries between upstream and downstream water users [38]. Guo, et al. [39] also stressed that climate change plays a key role in shifting the hydrology and flow of basins in the Xijiang River Basin. Studies have been conducted to examine climate change impacts on Hongshui River Basin water resources. Huang, Wang, Xiao, Chen, Zhou, Song and Wang [38] examined anthropogenic activities and climate change impacts on long-term streamflow patterns. The study reported negative effects, including reduced runoff, using a variable infiltration capability (VIC) model and hydrological sensitivity system in the upper reaches of Hongshui Basin, Southwest China, during the past 55 years. Touseef, Chen, Masud, Khan, Yang, Shahzad, Ijaz and Wang [9] applied the Soil and Water Assessment Tool (SWAT) to the upper reaches of the Xijiang Basin of Hongshui River and concluded that large negative shifts in low flows can be expected under future climate scenarios, showing a monthly decrease of 10% to 30% in water yield over the watershed. However, no study has been carried out under all four future scenarios to assess effects of climate change on streams and water demand using a combined SWAT–WEAP approach.
In this study, we introduced a SWAT–WEAP integrated approach, which considered both hydrological processes and water management assessments, and hydrological component analyses. Five global climate model (GCM) outputs under each of the four future scenarios were used to simulate the impact of climate change on streamflow and water demand across the Hongshui River Basin (HRB). The major objective of this research was to investigate the impacts of socio-economic and climate change scenarios on hydrological processes and water demand in the HRB. The study’s sub-objectives were to calibrate and validate the hydrological module embedded in the WEAP model for streamflow simulation at Qianjiang and Tianer stations; to forecast and analyze changes in stream flows in the catchment under emission scenarios between 2010 and 2050; and forecast and analyze resulting water shortages in the HRB.

2. Materials and Methods
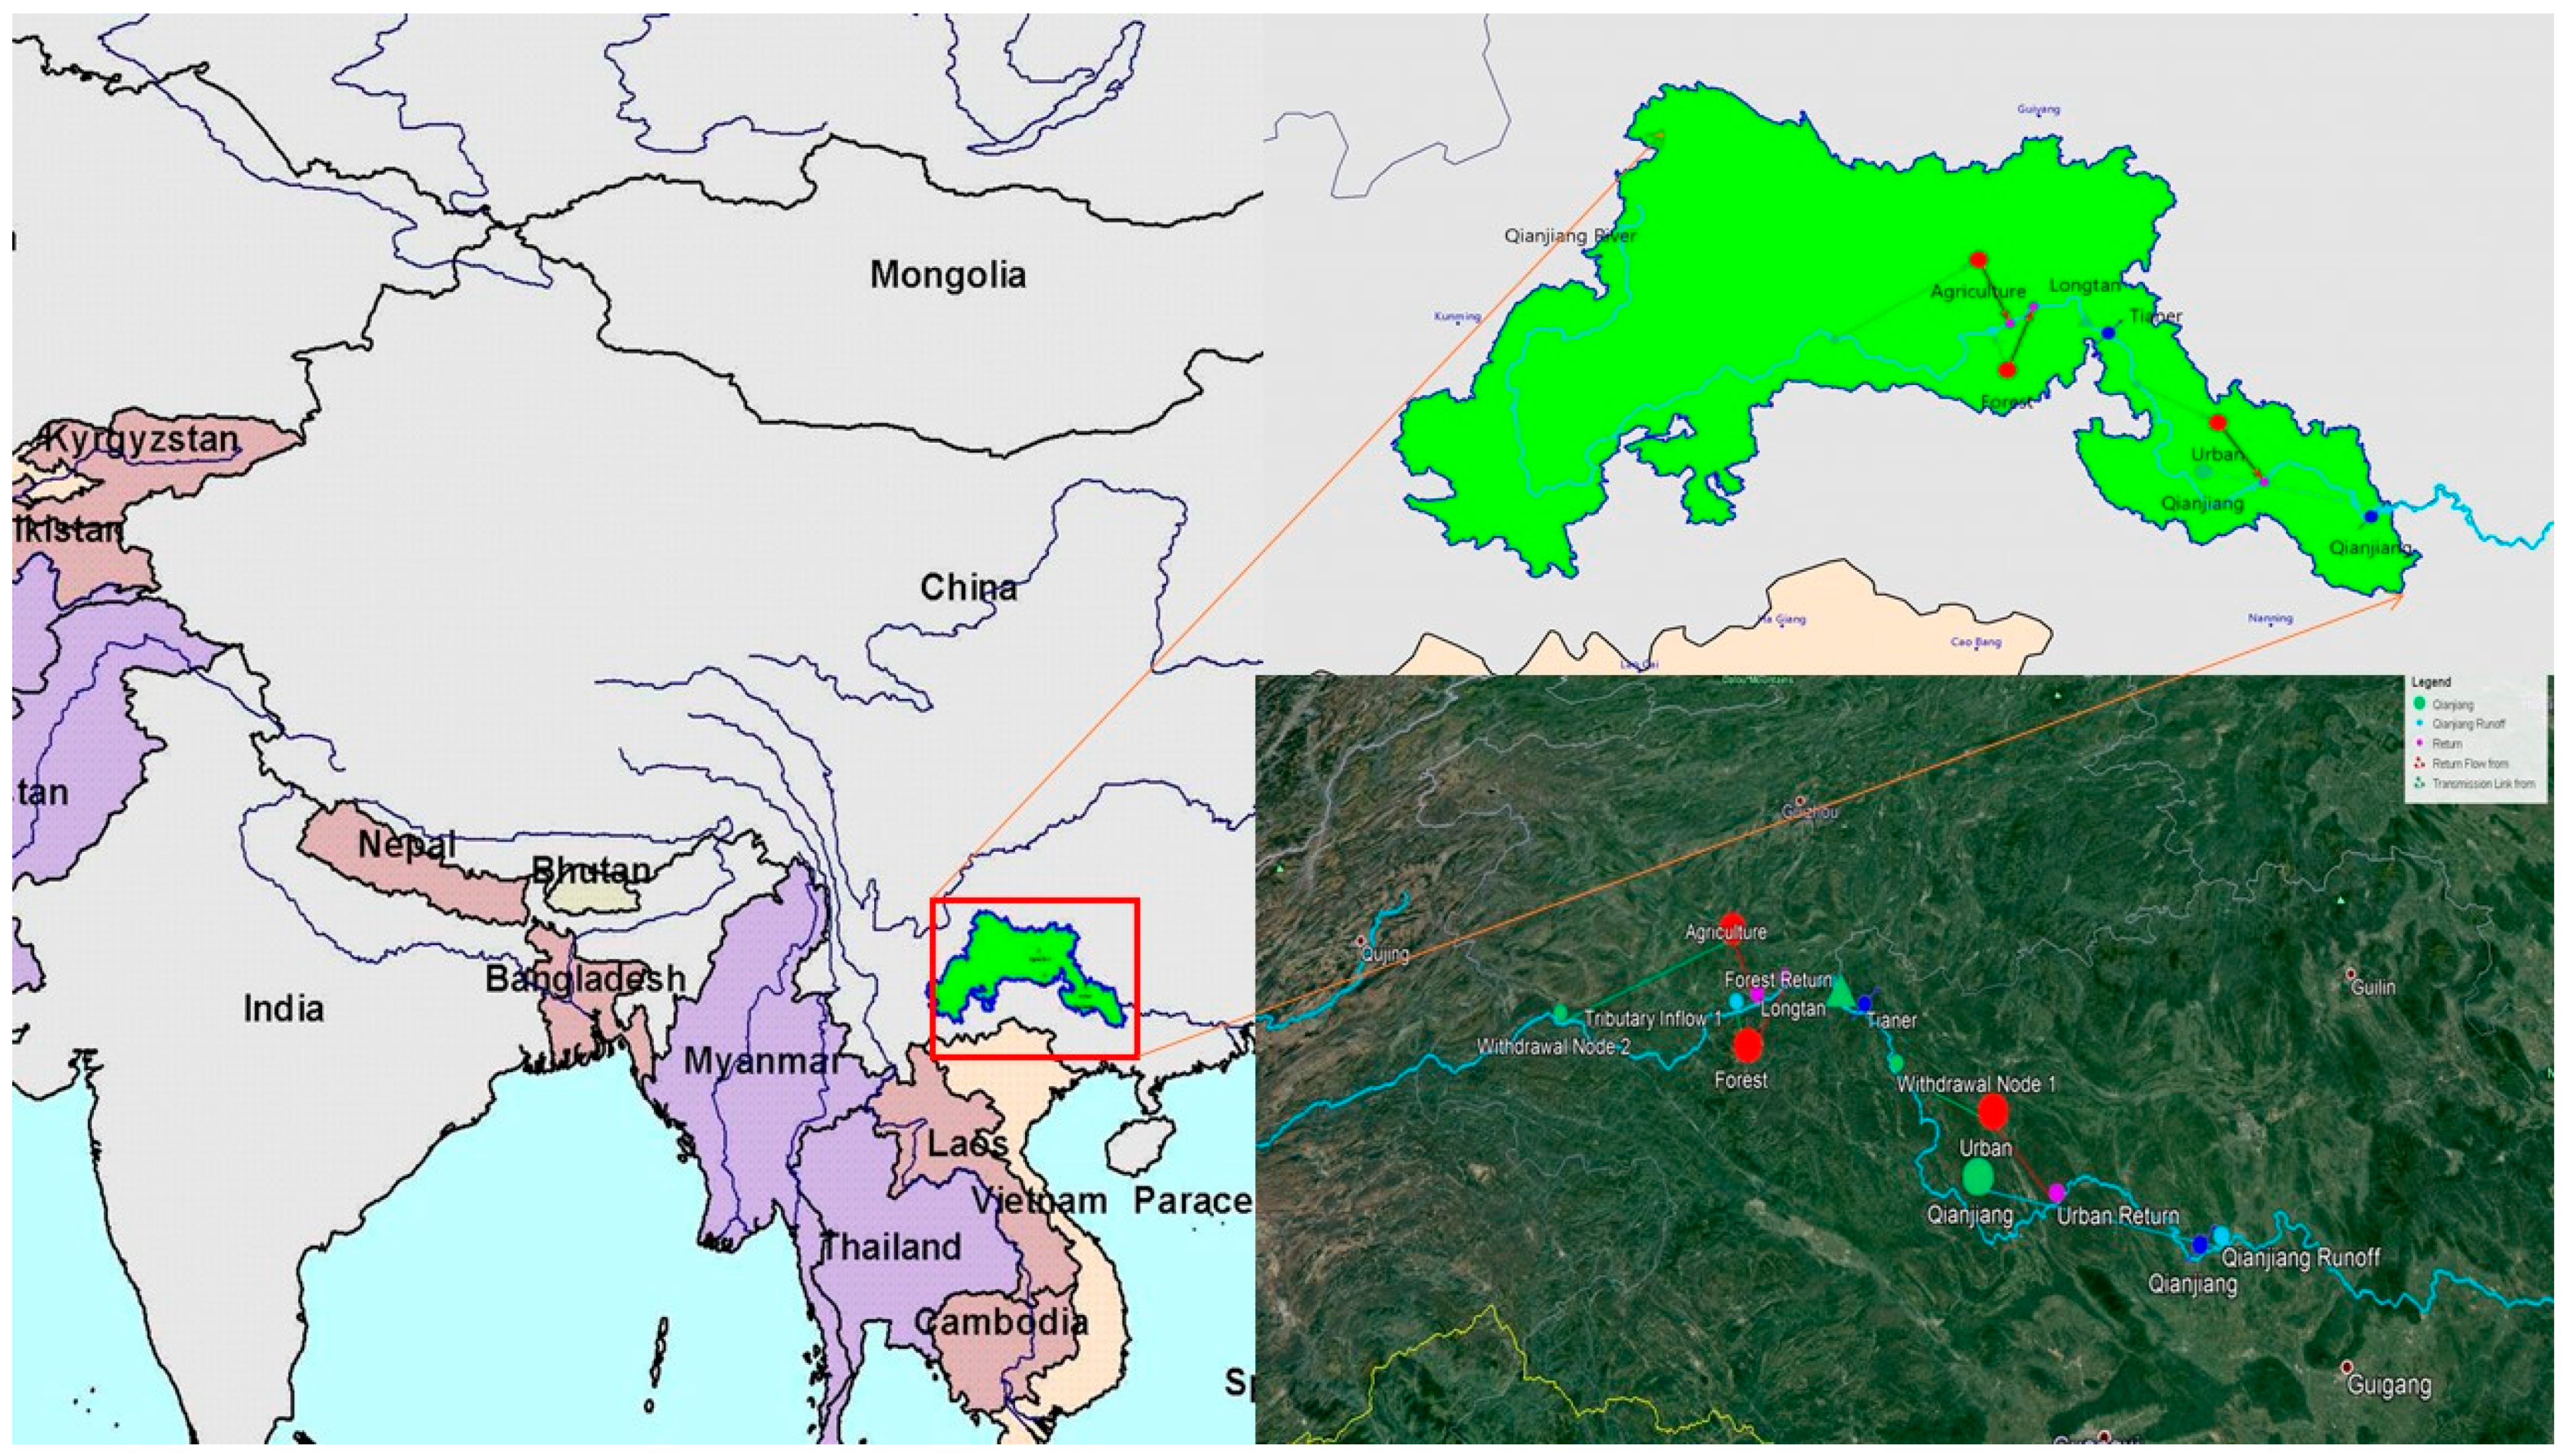
2.1. Study Area

The chosen study area is the Hongshui River Basin (HRB; shown in Figure 1), above the Qianjiang River Gauge Station. The Hongshui River Basin is the Pearl River Basin’s main tributary, which lies in South China’s subtropical region. In turn, the Pearl River Basin is China’s third-largest river basin, with a population of more than 100 million. The Hongshui River Basin has a total drainage area of 98,500 km2 [40]. The main channel of the Upper Xijiang River Basin has distinctive names for specific sections: Beipanjiang, Nanpanjiang, Hongshuihe, and Qianjiang [41]. The basin is dry and tropical with sufficient precipitation, and usually has a high air temperature. The mean air temperature is about 14–22 °C. The mean annual precipitation ranges from 760 to 1860 mm, with west-to-east variations. Precipitation occurs mainly from April to October, accounting for 72–86% of annual precipitation [42]. Significant changes have occurred in the natural cycle of the river, due to climate change and to anthropogenic activities, such as afforestation, reservoir operation and irrigation infrastructure [40].

2.2. Data Availability

Hydrological modeling requires data on topography, soil characteristics, and land use/land cover (LULC) maps, as summarized in Table 1. The digital elevation model (DEM) is the most important input to provide topographical information in the WEAP system. This study used the Shuttle Radar Topography Mission Digital Elevation Model (SRTM-DEM) with a resolution of 90 m from the CGIAR Consortium for Spatial Information (CGIAR-CSI) (http://srtm.csi.cgiar.org/ (accessed on 21 February 2021)) [43]. The DEM is a simple input layer in the model configuration and was used to extract the slope and drainage network of the study area. The FAO–UNESCO global soil map, with a 5 km resolution, was obtained as the land map of the study area from the Food and Agriculture Organization (FAO) (http://www.fao.org/nr/land/soils/digital-soil-map-of-the-world/en/ (accessed on 21 February 2021)) [44].
LULC 2015, developed by the European Space Agency (ESA) as part of the Climate Change Initiative CCI-LC project, was analyzed to simulate stream flow discharge and water demand (http://maps.elie.ucl.ac.be/CCI/viewer/download.php (accessed on 21 February 2021)) [45].
The National Meteorological Information Center (NMIC) of the China Meteorological Administration (CMA) provided daily precipitation data for 32 weather stations and two river discharge stations in the Hongshui River Basin [10].
GCMs are major tools used to test climate change scenarios, and to model the global climate system’s reaction to changes in the atmosphere [46]. This study analyzed the climate data sets of five GCMs from the Inter-Sectorial Impact System Inter-Comparison Project (ISI-MIP)—GFDL-ESM2 M, HadGEM2-ES, IPSL-CM5A-LR, MIROC-ESM-CHEM, and NorESM1-M [47]—and three emission scenarios (RCP-2.6, RCP-4.5, and RCP-8.5). The raw GCM output was statistically downscaled, and bias-corrected using special disaggregation (BCSD) with the Climate Change Toolkit (CCT) [48,49,50]. The CCT package also includes historical climate data (1970–2006) from the Climate Research Unit (CRU TS 3.1) that can be used as an observed dataset. All climate datasets (precipitation, temperature, relative humidity, solar radiation, wind) are downscaled and available in text format. The CCT was used to undertake extraction, downscaling, bias correction, and interpolation of raw GCM outputs.

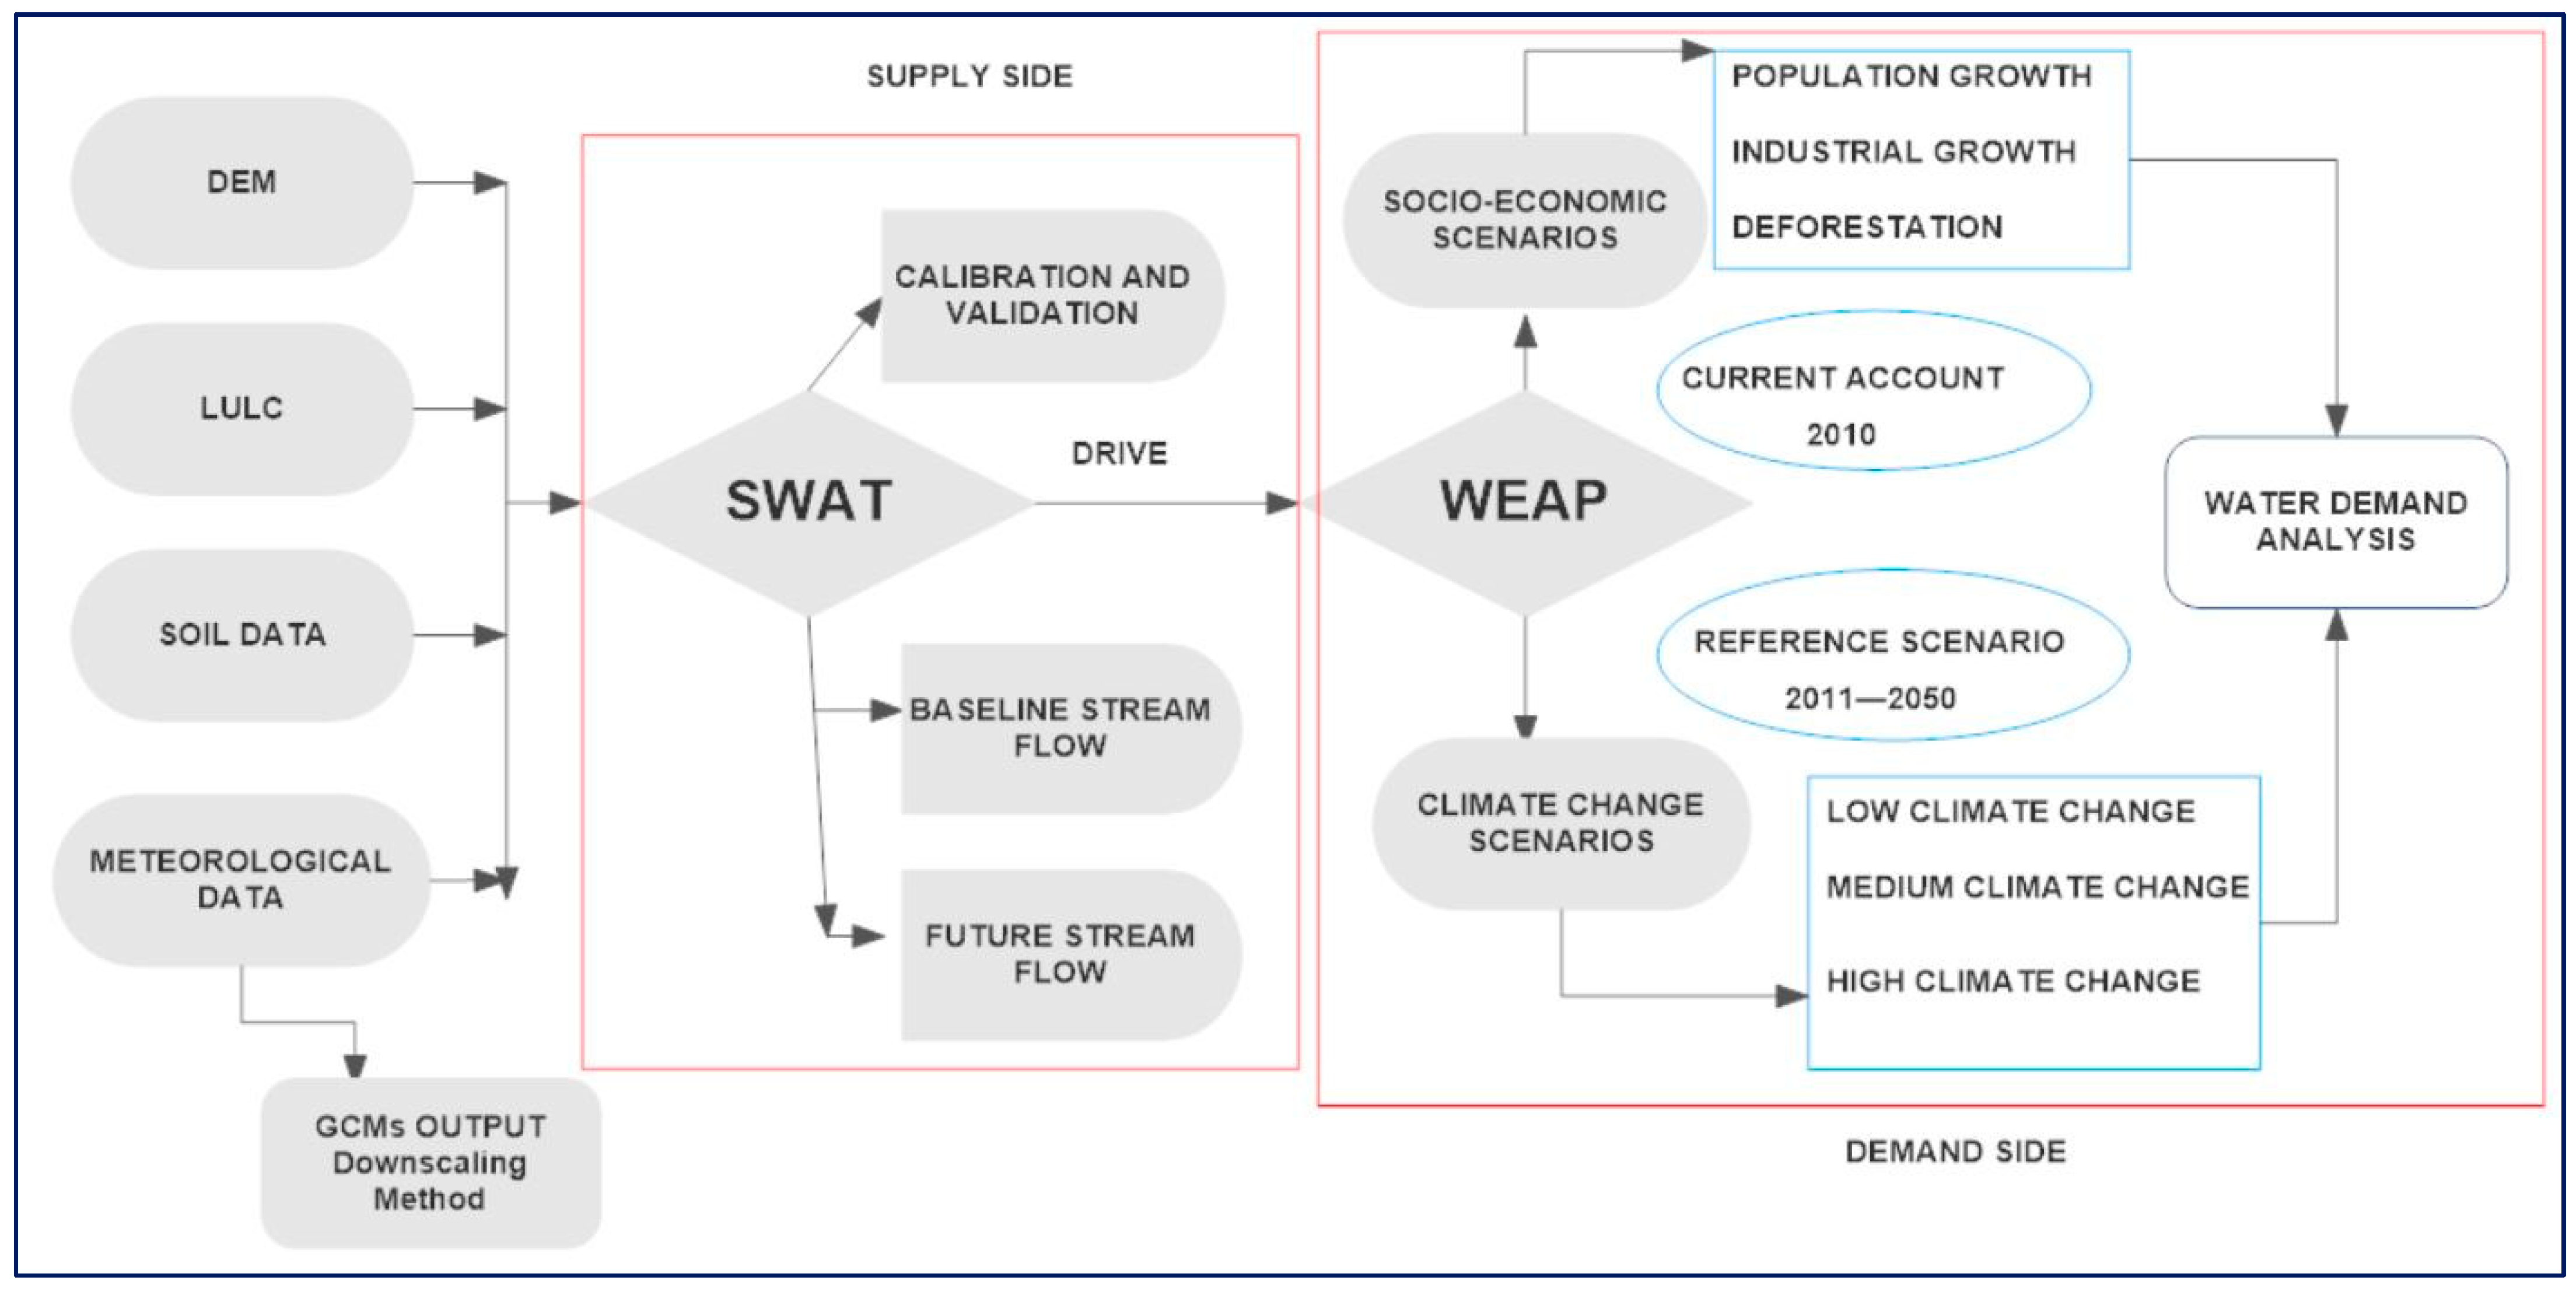
2.3. Integrated Hydrological Modeling Development

The combined SWAT–WEAP approach (shown in Figure 2) was used in this study to evaluate comprehensive water resource management options. The Soil and Water Assessment Tool (SWAT) is a physically based semi-distributed basin model [52]. The SWAT model uses the soil conservation services (SCS) approach and simulates hydrological processes, such as surface runoff, snowmelt runoff, lateral flow, and drainage into a river basin, in addition to water balance and streamflow [53,54,55]. The SWAT hydrological model is based on the basic water balance equation:
S W t o t a l = S W 0   + t = 1 t ( R d Q s E a W s e e p Q g w )
where S W t o t a l   is the total soil water content, S W 0   is the initial day soil water, t is the time in days, R d is the daily rainfall, Q s is the surface run-off, E a is the actual evapotranspiration, W s e e p is the quantity of water seep into the vadose zone on day t, and Q g w is the return flow on day t.
The Water Evaluation and Planning (WEAP) software, developed by the Stockholm Environment Institute (SEI), is a practical semi-theoretical, semi-distributed, and deterministic water resource planning tool that incorporates both water supply and water demand issues, in addition to water quality and the conservation of ecosystems, as required by an integrated approach to basin management [56,57]. The WEAP model was used to simulate both the hydrological processes and the anthropogenic activities of water resources to analyze the availability of water in the basin. The WEAP model has been implemented at national and international levels because it offers a flexible and comprehensive policy analysis framework, in addition to a method for managing water supply and demand. The WEAP model uses five methods to simulate daily or monthly catchment processes. For this study, the soil moisture method was selected because it allows characterization of the impacts of land use and soil types on these processes [27,31]. WEAP simulates water supply and demand based on scenarios, such as demographic changes or water policies for a user-required period. These hypothetical predictions (or scenarios) are compared to the current year. Generally, the baseline is the year for which all the input data required by the WEAP model, including streamflow, climate, demographic, and land use/land cover, are available. It represents the actual condition in the catchment, also known as the current account. The baseline year was chosen because the model needs a current water availability value to be used to assess current and future water availability in different socio-economic, climate, or management scenarios [58]. The integrated approach was applied to simulate the future water resource status (2010–2050) by combining various water resource management options and climate change scenarios.

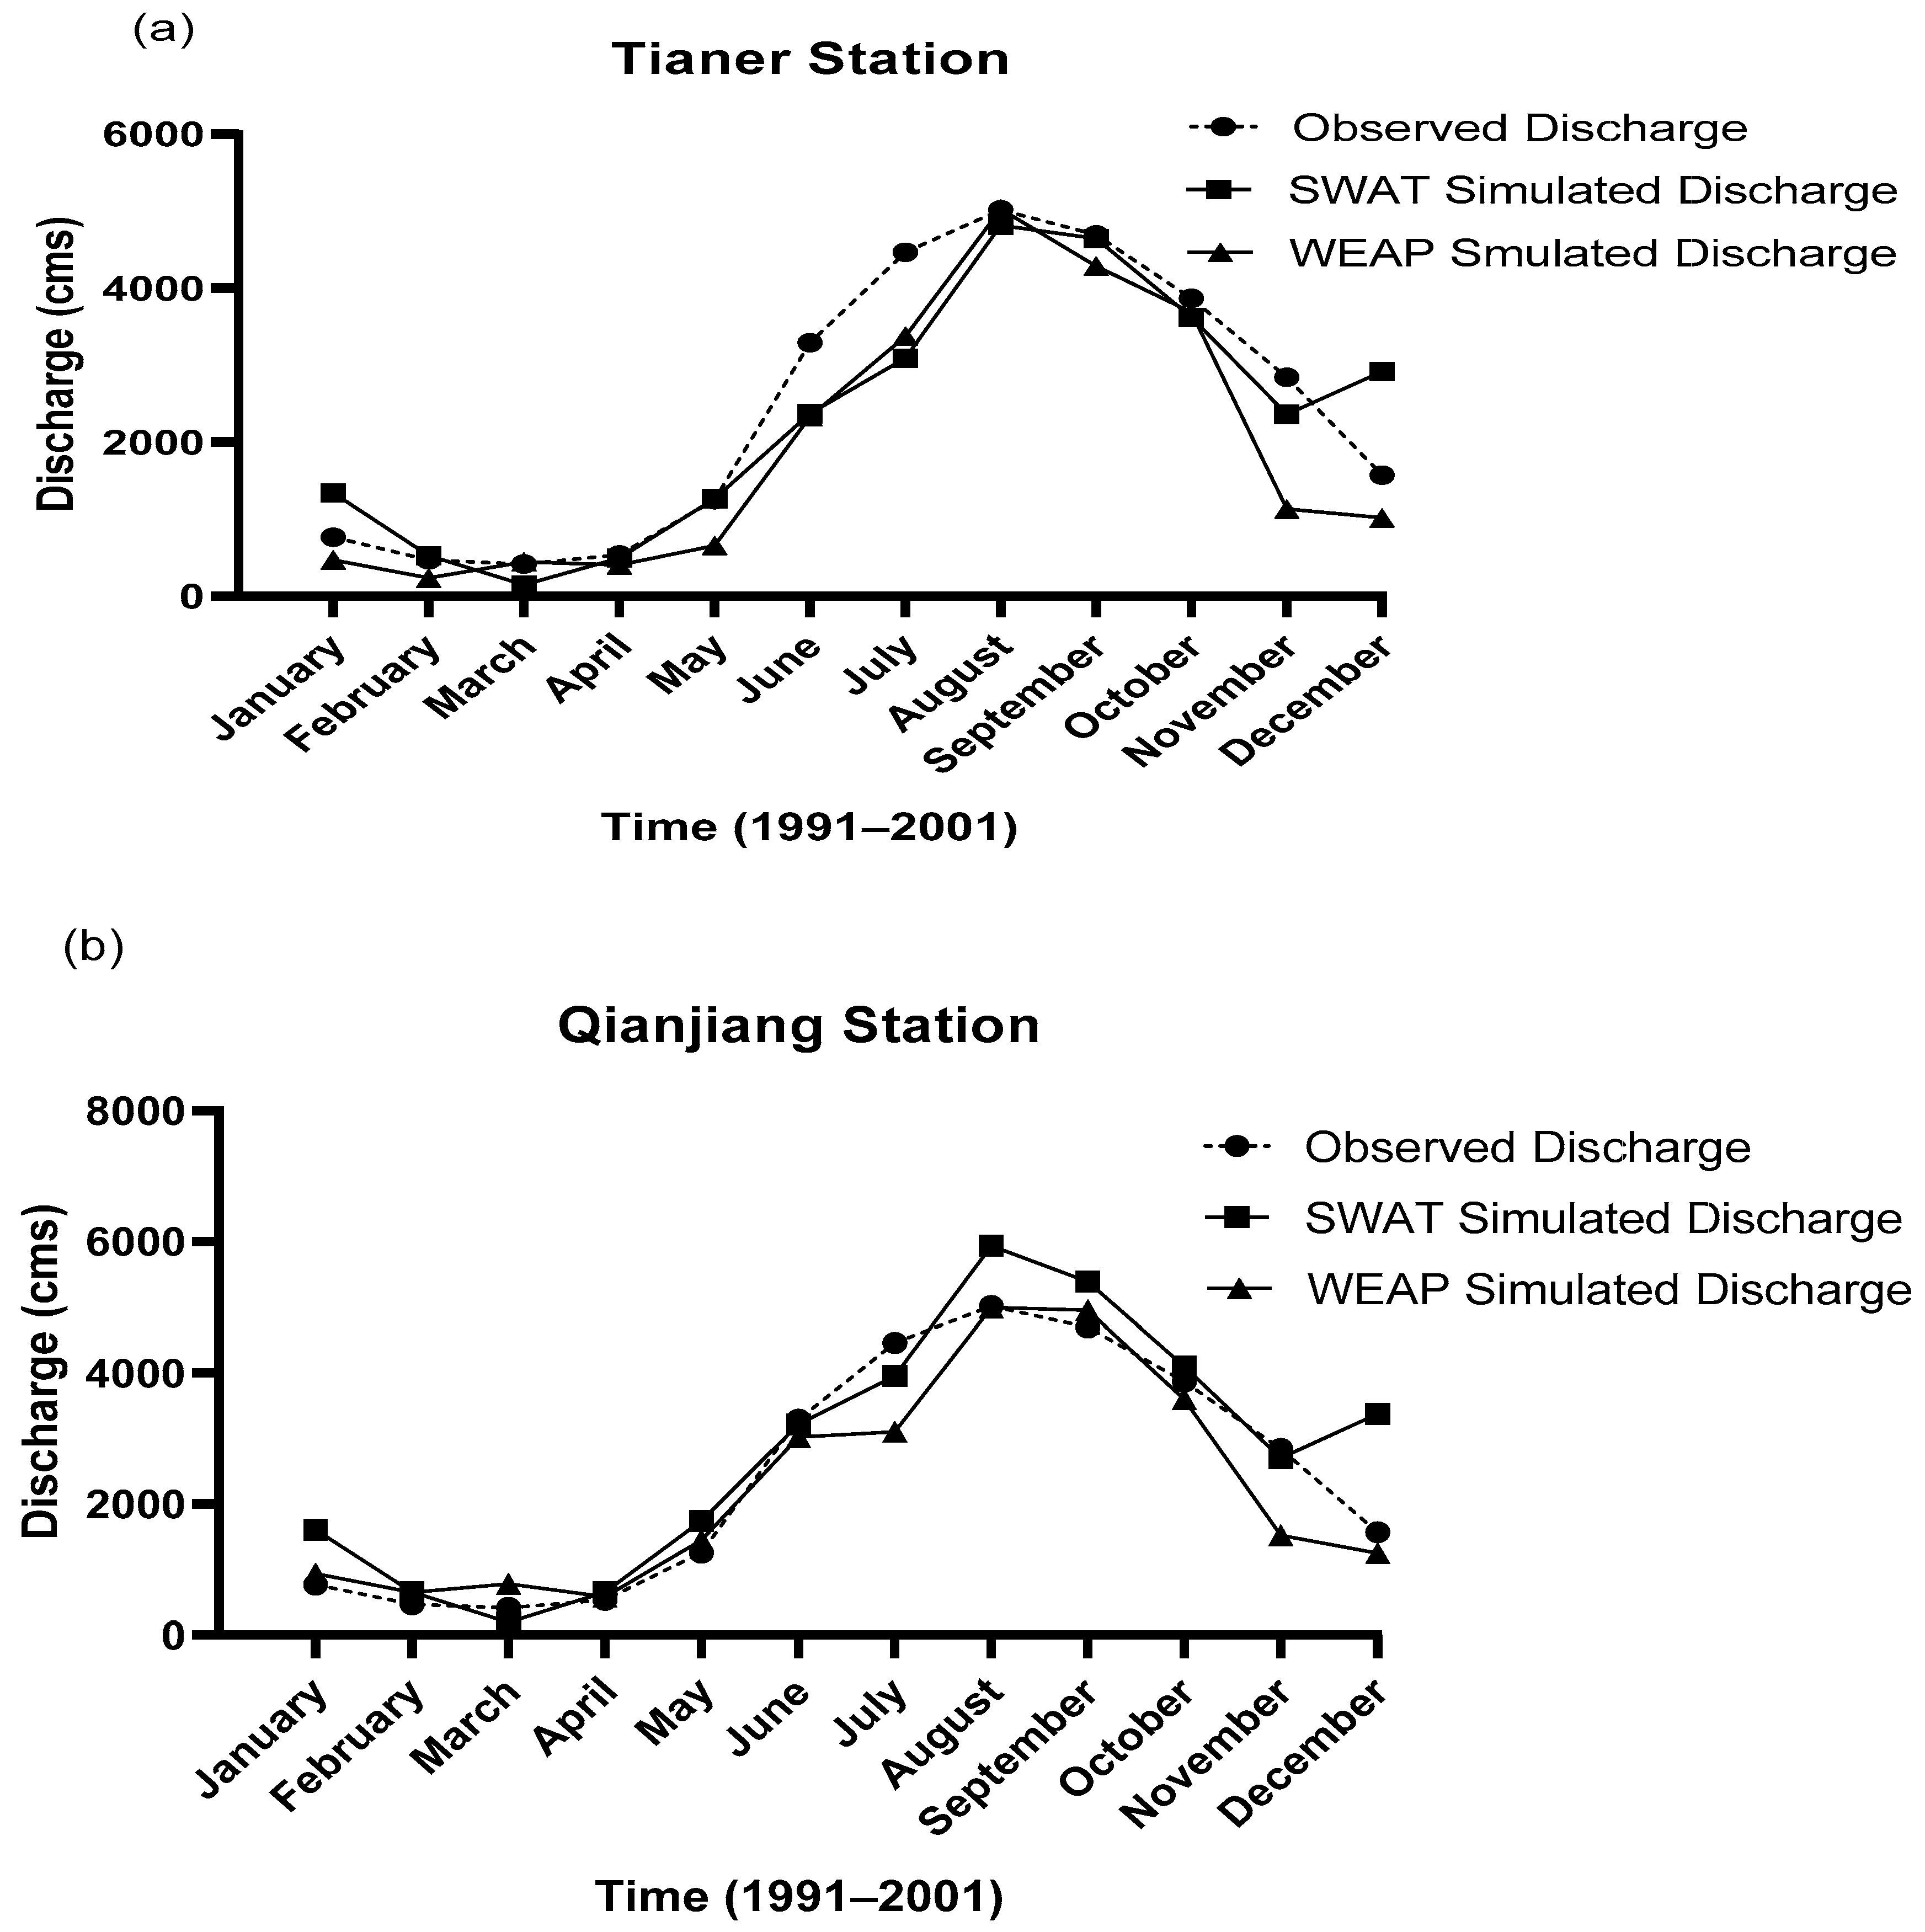
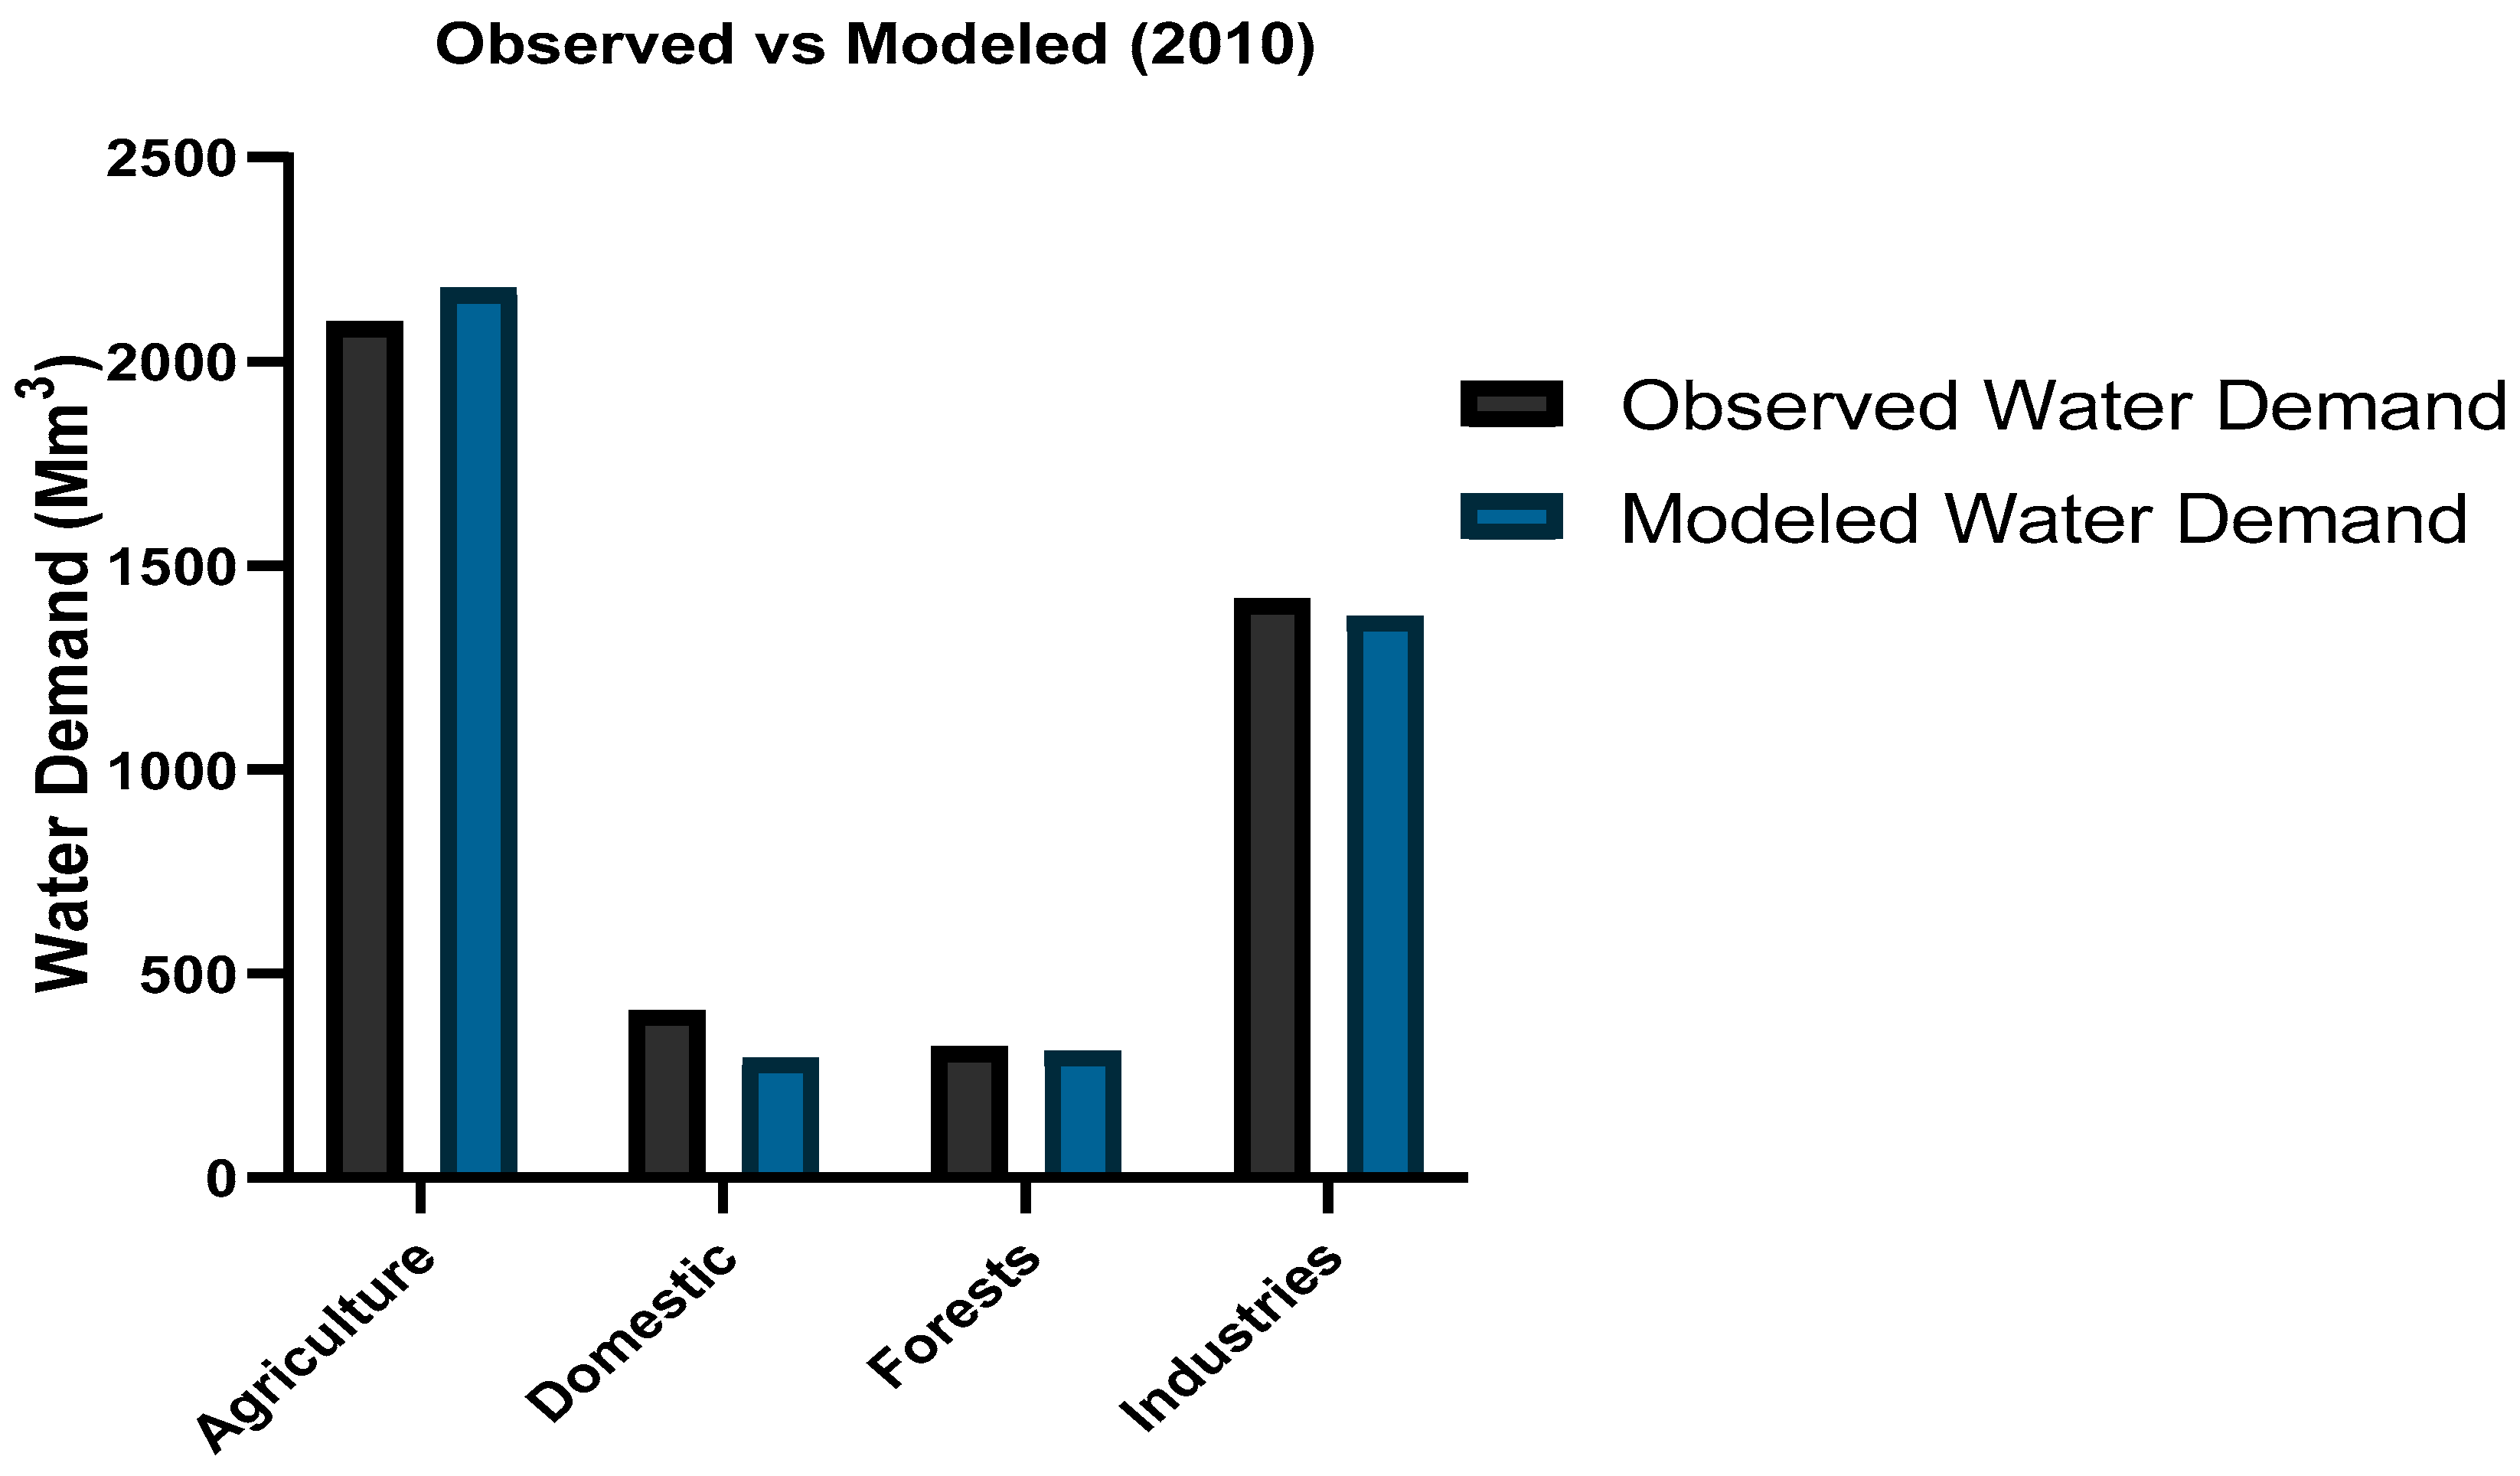
2.4. Model Calibration and Validation

This study calibrated and validated the SWAT model using the SWAT-CUP (Soil and Water Assessment Tool-Calibration and Uncertainty Programme). The observed streamflow data were used for calibration and validation purposes at the Qianjiang and Tianer hydrological stations, calibrated for a period of 7 years (1991–1997) and validated for 1998–2001 from the available streamflow data presented in Figure 3a,b. A future climate scenario was generated and embedded in the SWAT model and used to drive the SWAT model to simulate tributary streaming under various climate change scenarios. The simulated discharge output of SWAT was used to drive the WEAP model. The calibration and validation procedure of the WEAP model was carried out using the PEST (Parameter Estimation) routine. PEST is a nonlinear estimator of parameters and is considered a specific calibration method. Responsive parameter adjustment is undertaken by trial and error to determine the best value for a parameter. Hydrological output must be checked using objective functions.

Statistical Performance Indices

Hydrological model performance must be validated using objective functions. This study used (R2, Nash–Sutcliffe efficiency (NSE), percent bias (PBIAS)) to evaluate the statistical performance of the SWAT and WEAP model, as presented in Table 2 and Table 3. R2 is the measurement of the co-relation between simulated and observed values, known as the coefficient of determination. The R2 varies from 0 to 1, where approaching 1 means better performance. R2 can be calculated as follows:
R 2 = [ i = 1 n ( Q m , i Q m ) ( Q s , i Q s ) ] ² i = 1 n ( Q m , i Q m ) ² i = 1 n ( Q s , i Q s ) ²
where Q m ,   Q s are initially measured and simulated discharge, respectively.
Nash–Sutcliffe efficiency (NSE) is a normalized dimensionless statistic that defines the relative magnitude of residual variance compared to the measured data variance [59]. NSE can be measured by the following equation:
N S E = 1 i = 1 n ( Q o Q s   ) i ² i = 1 n ( Q o , i Q m e a n ) ²
where n is the total number of observations, Qo,i and Qs,i are the observed and simulated discharge at the ith observation, respectively, and Qmean is the mean observed data over the simulation period. NSE value ranges from −∞ to 1, with an optimal value of 1 [60].
PBIAS (percent bias) calculates the average tendency of simulated values to be larger or smaller than observed values [60]. PBIAS with a smaller magnitude shows better model performance. PBIAS can be represented as follows:
P B I A S = i = 1 n ( Q o b s   Q s i m ) i = 1 n Q o b s , i * 100
where Q is discharge and the optimal value of PBIAS is zero. A positive PBIAS value indicates an underestimation of the model and negative values represent overestimation.

2.5. Scenario Development

In this study, the model was designed to simulate different socio-economic and climate change scenarios:
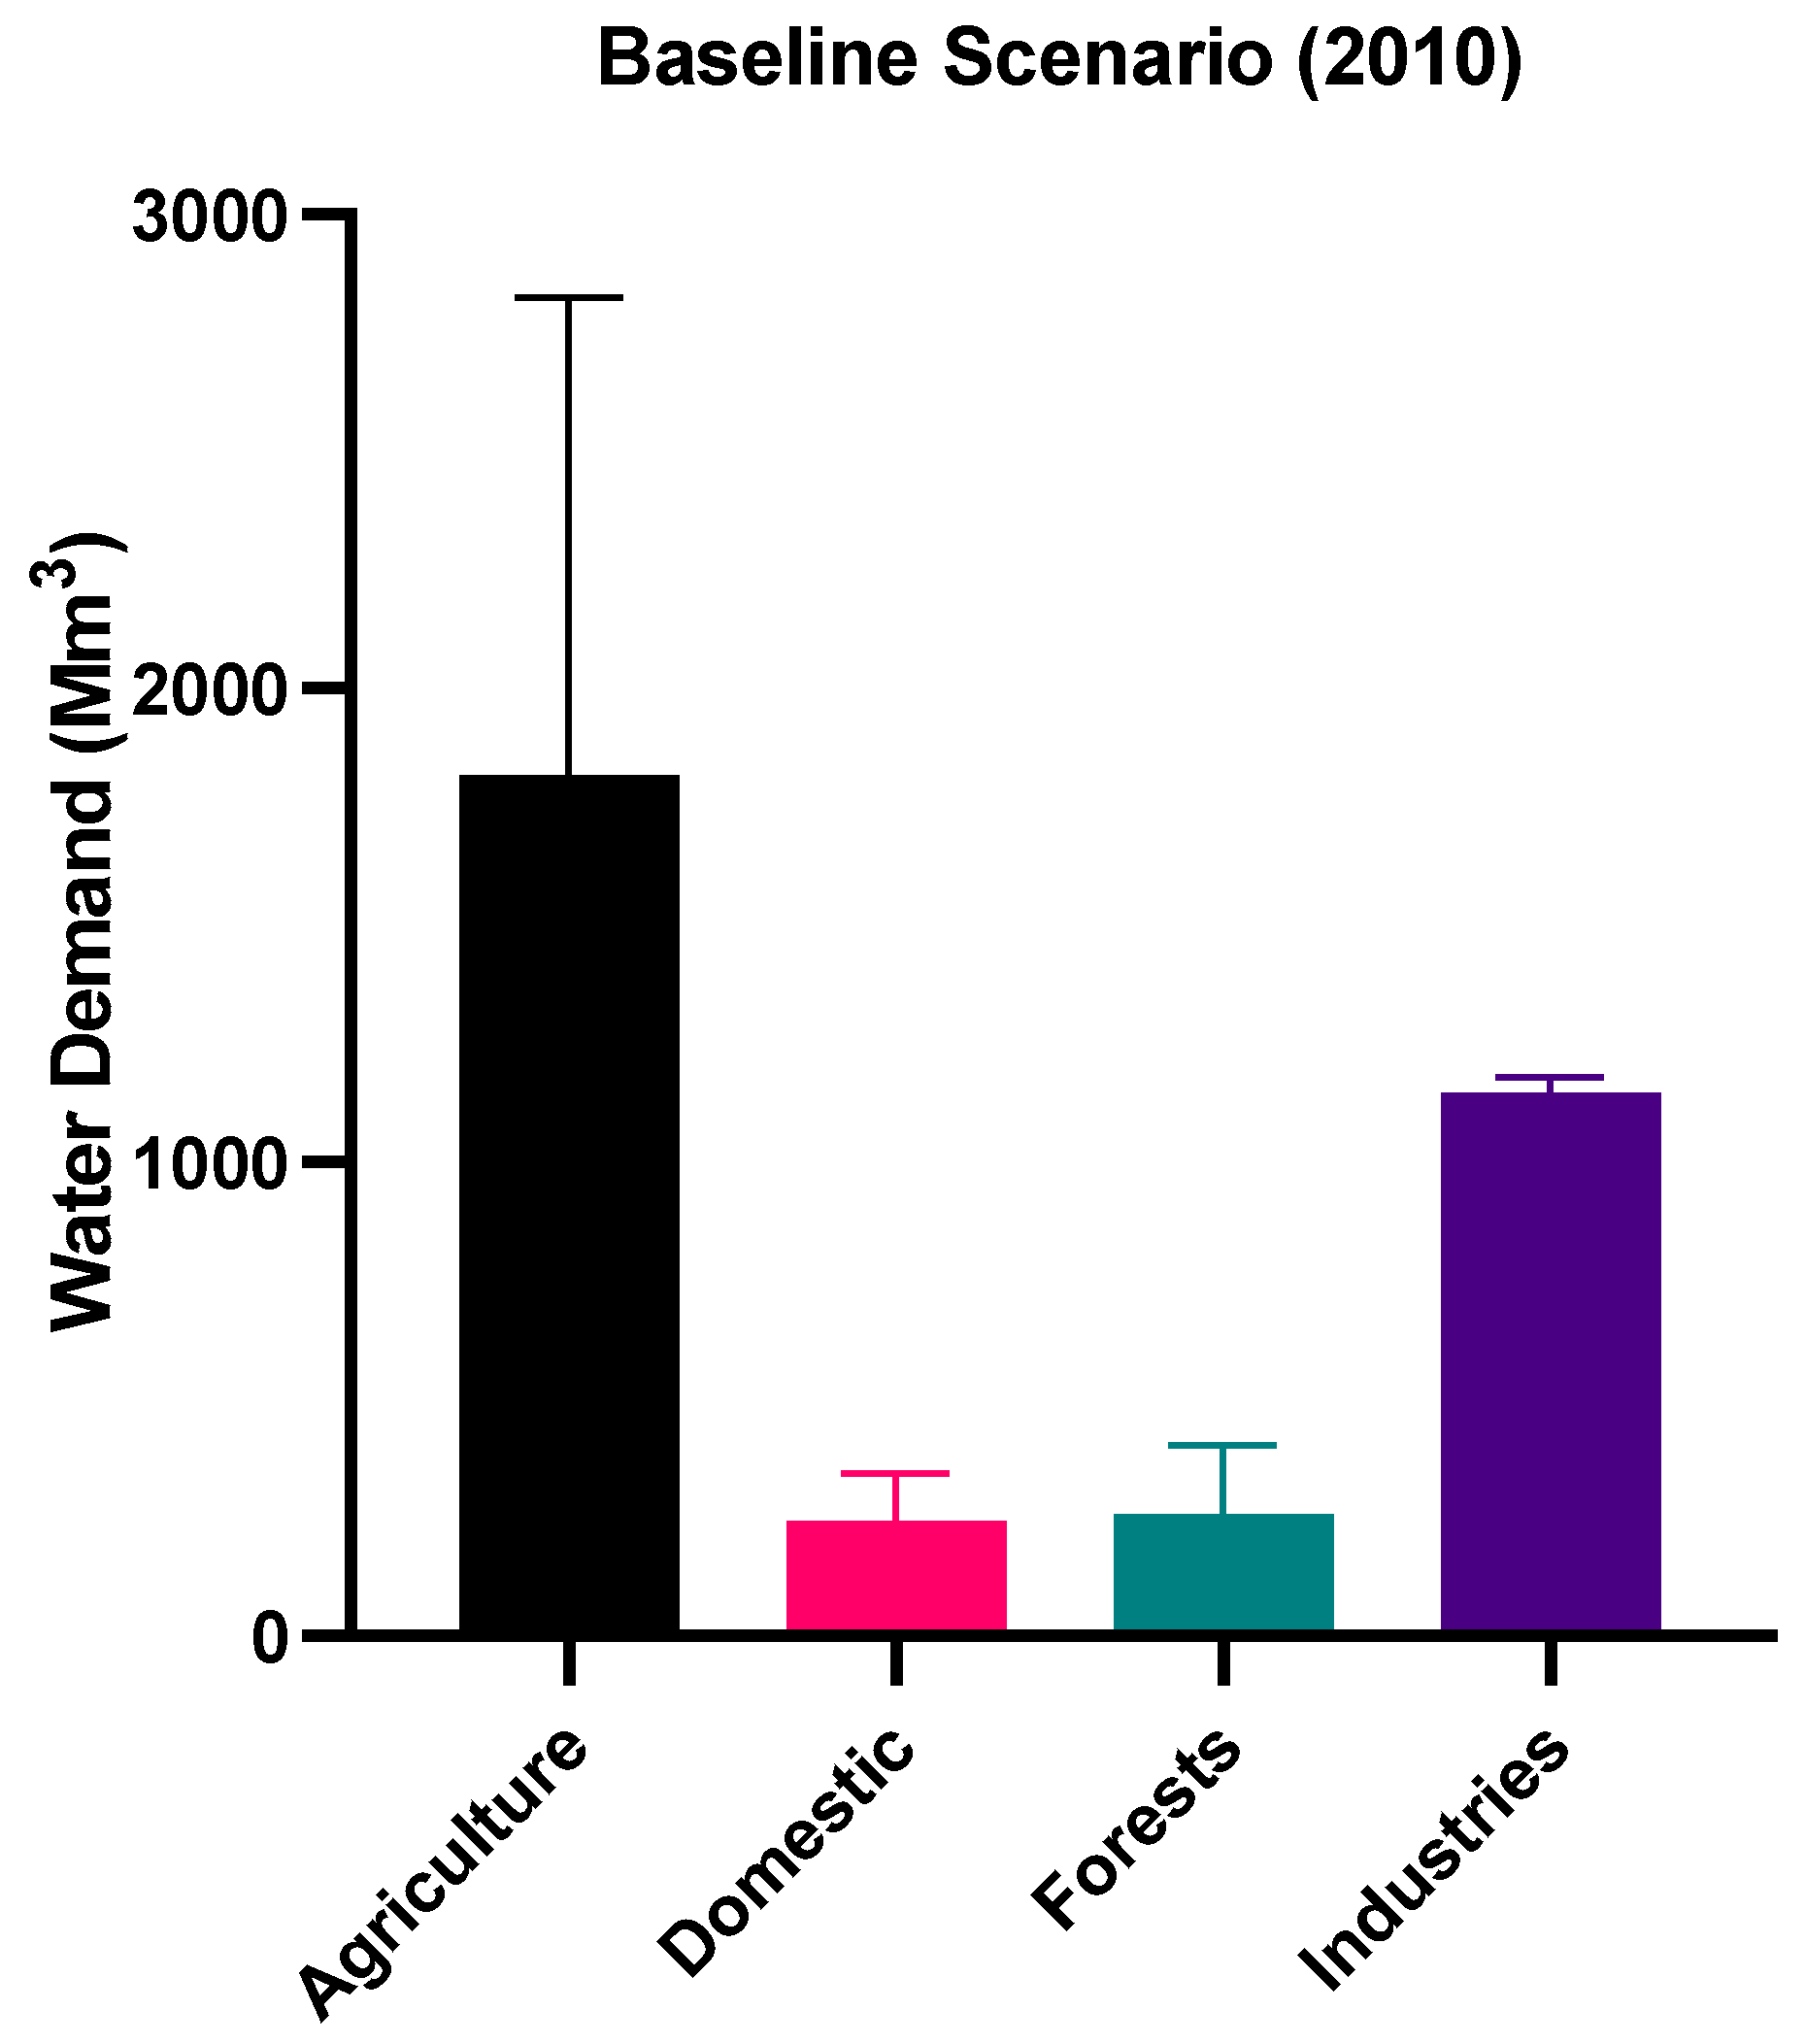
  • Baseline scenario (2010).
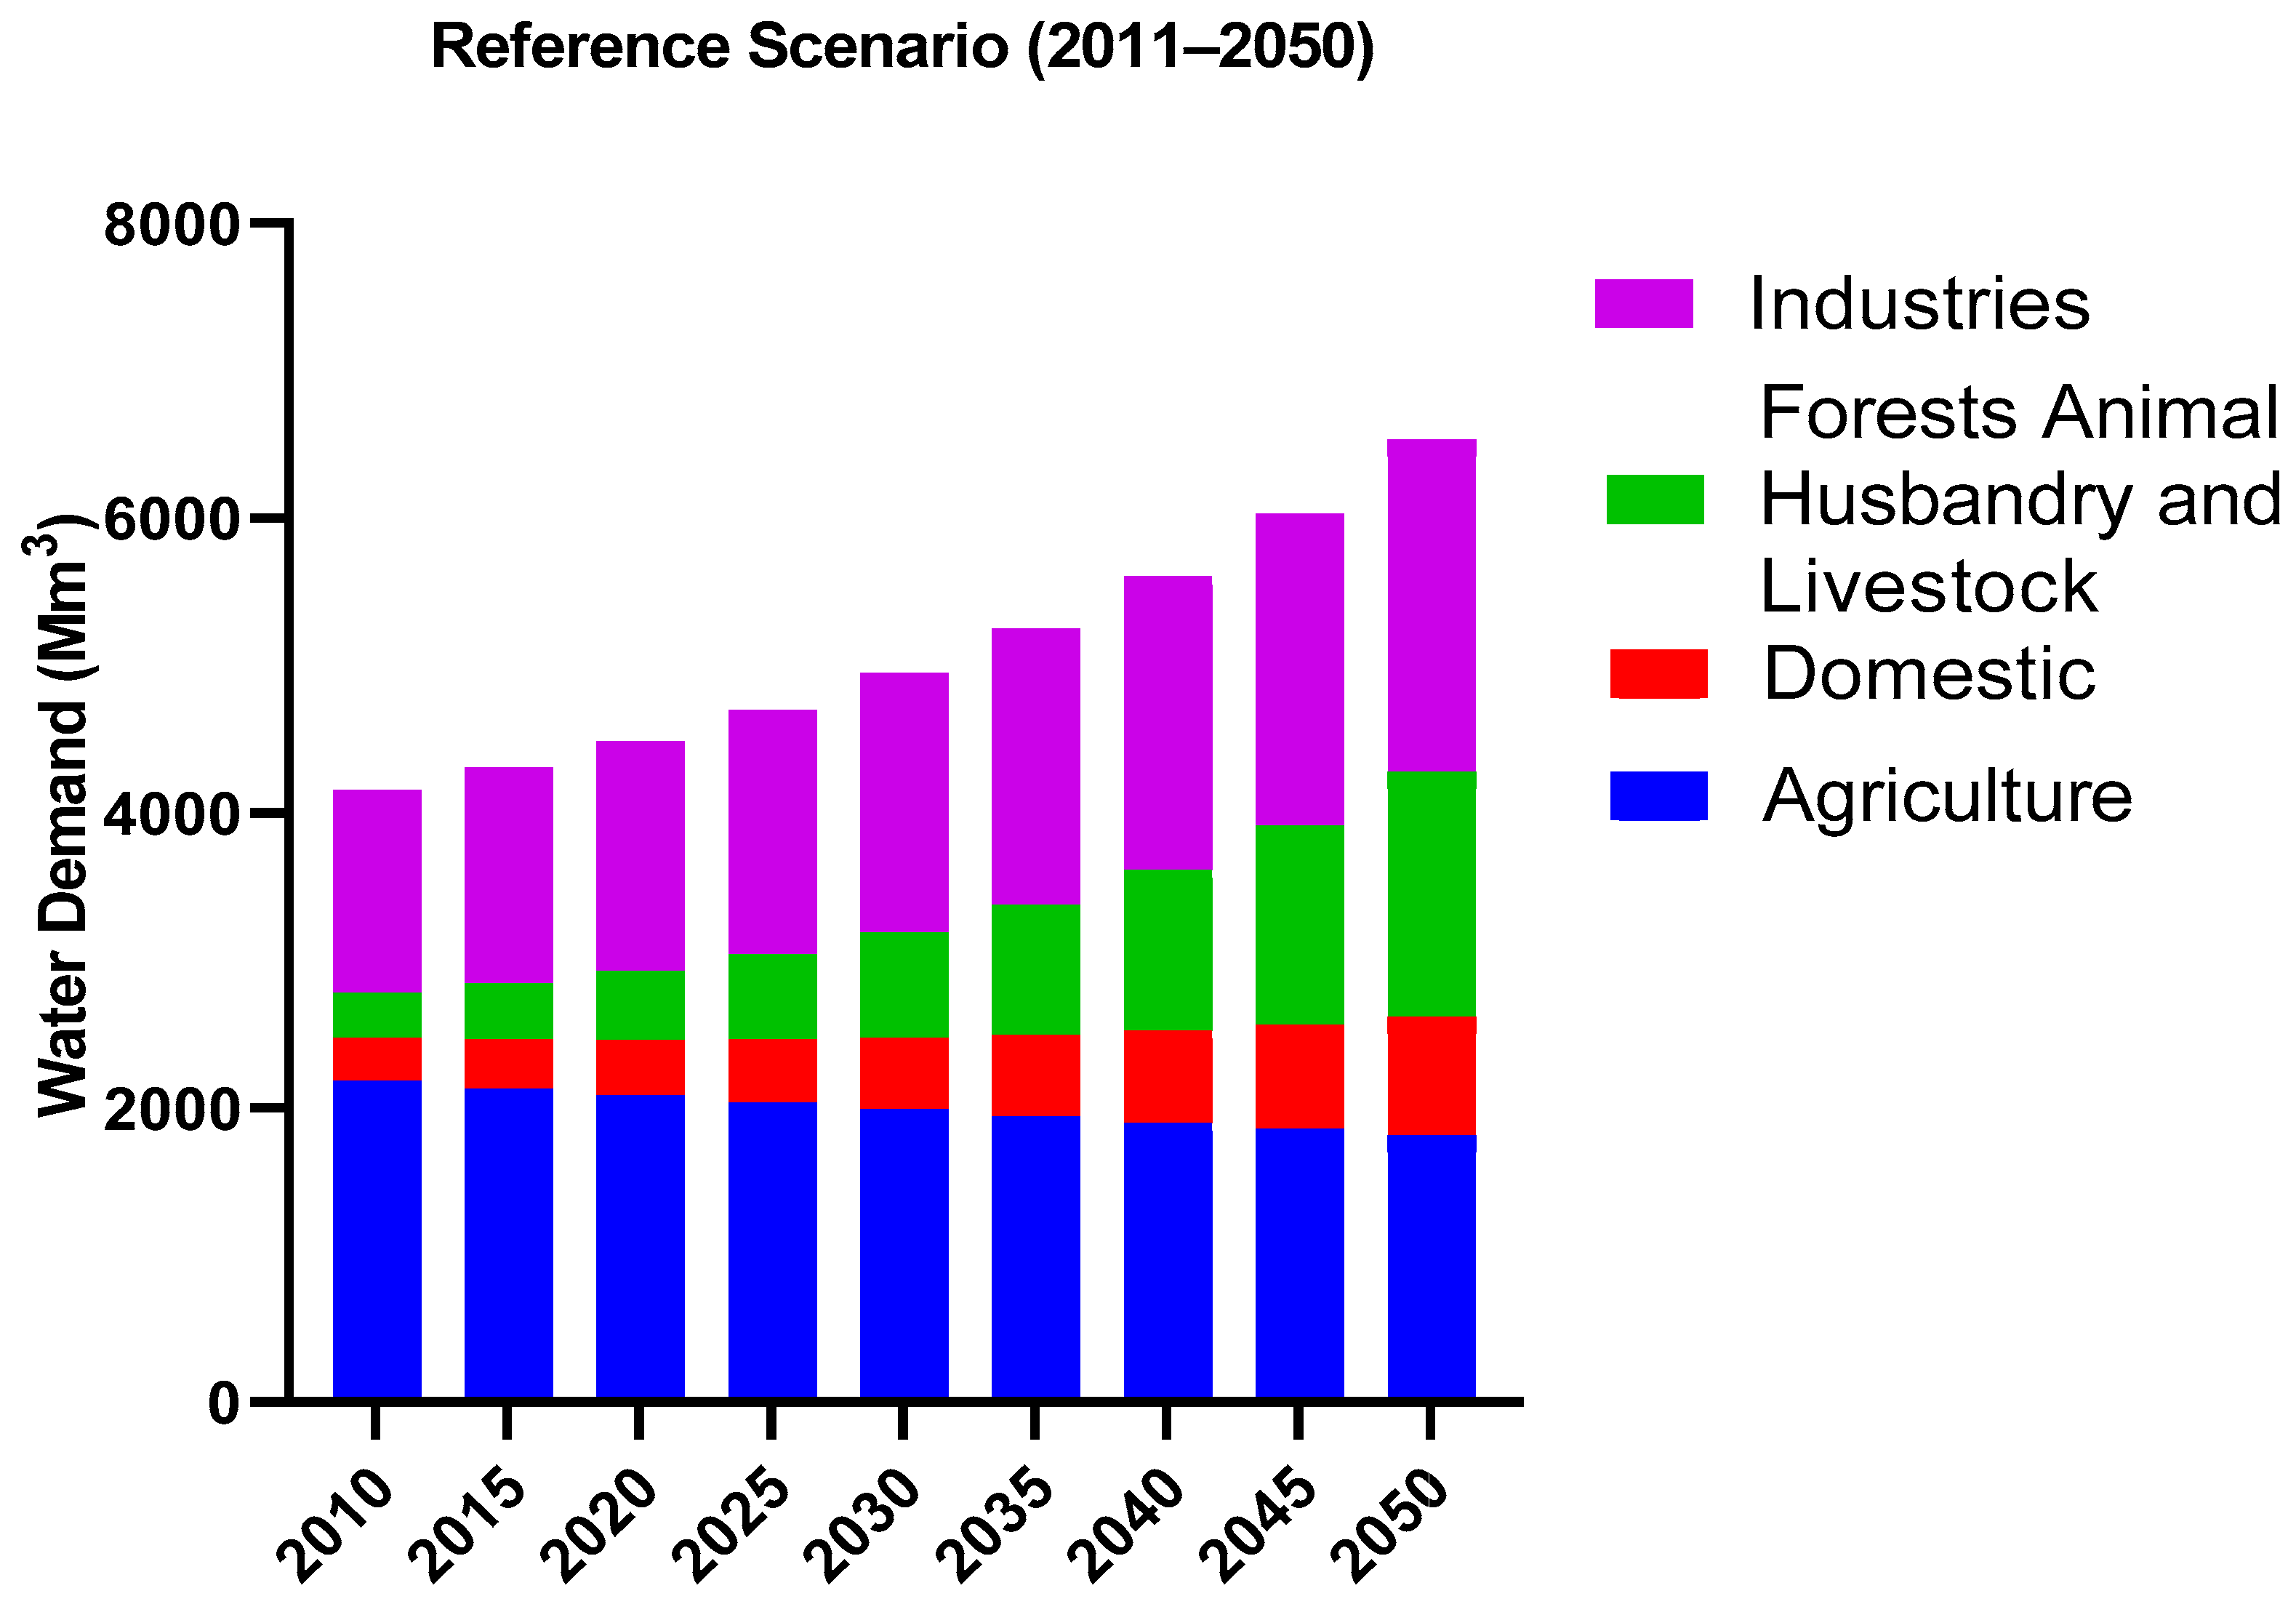
  • Reference scenario.
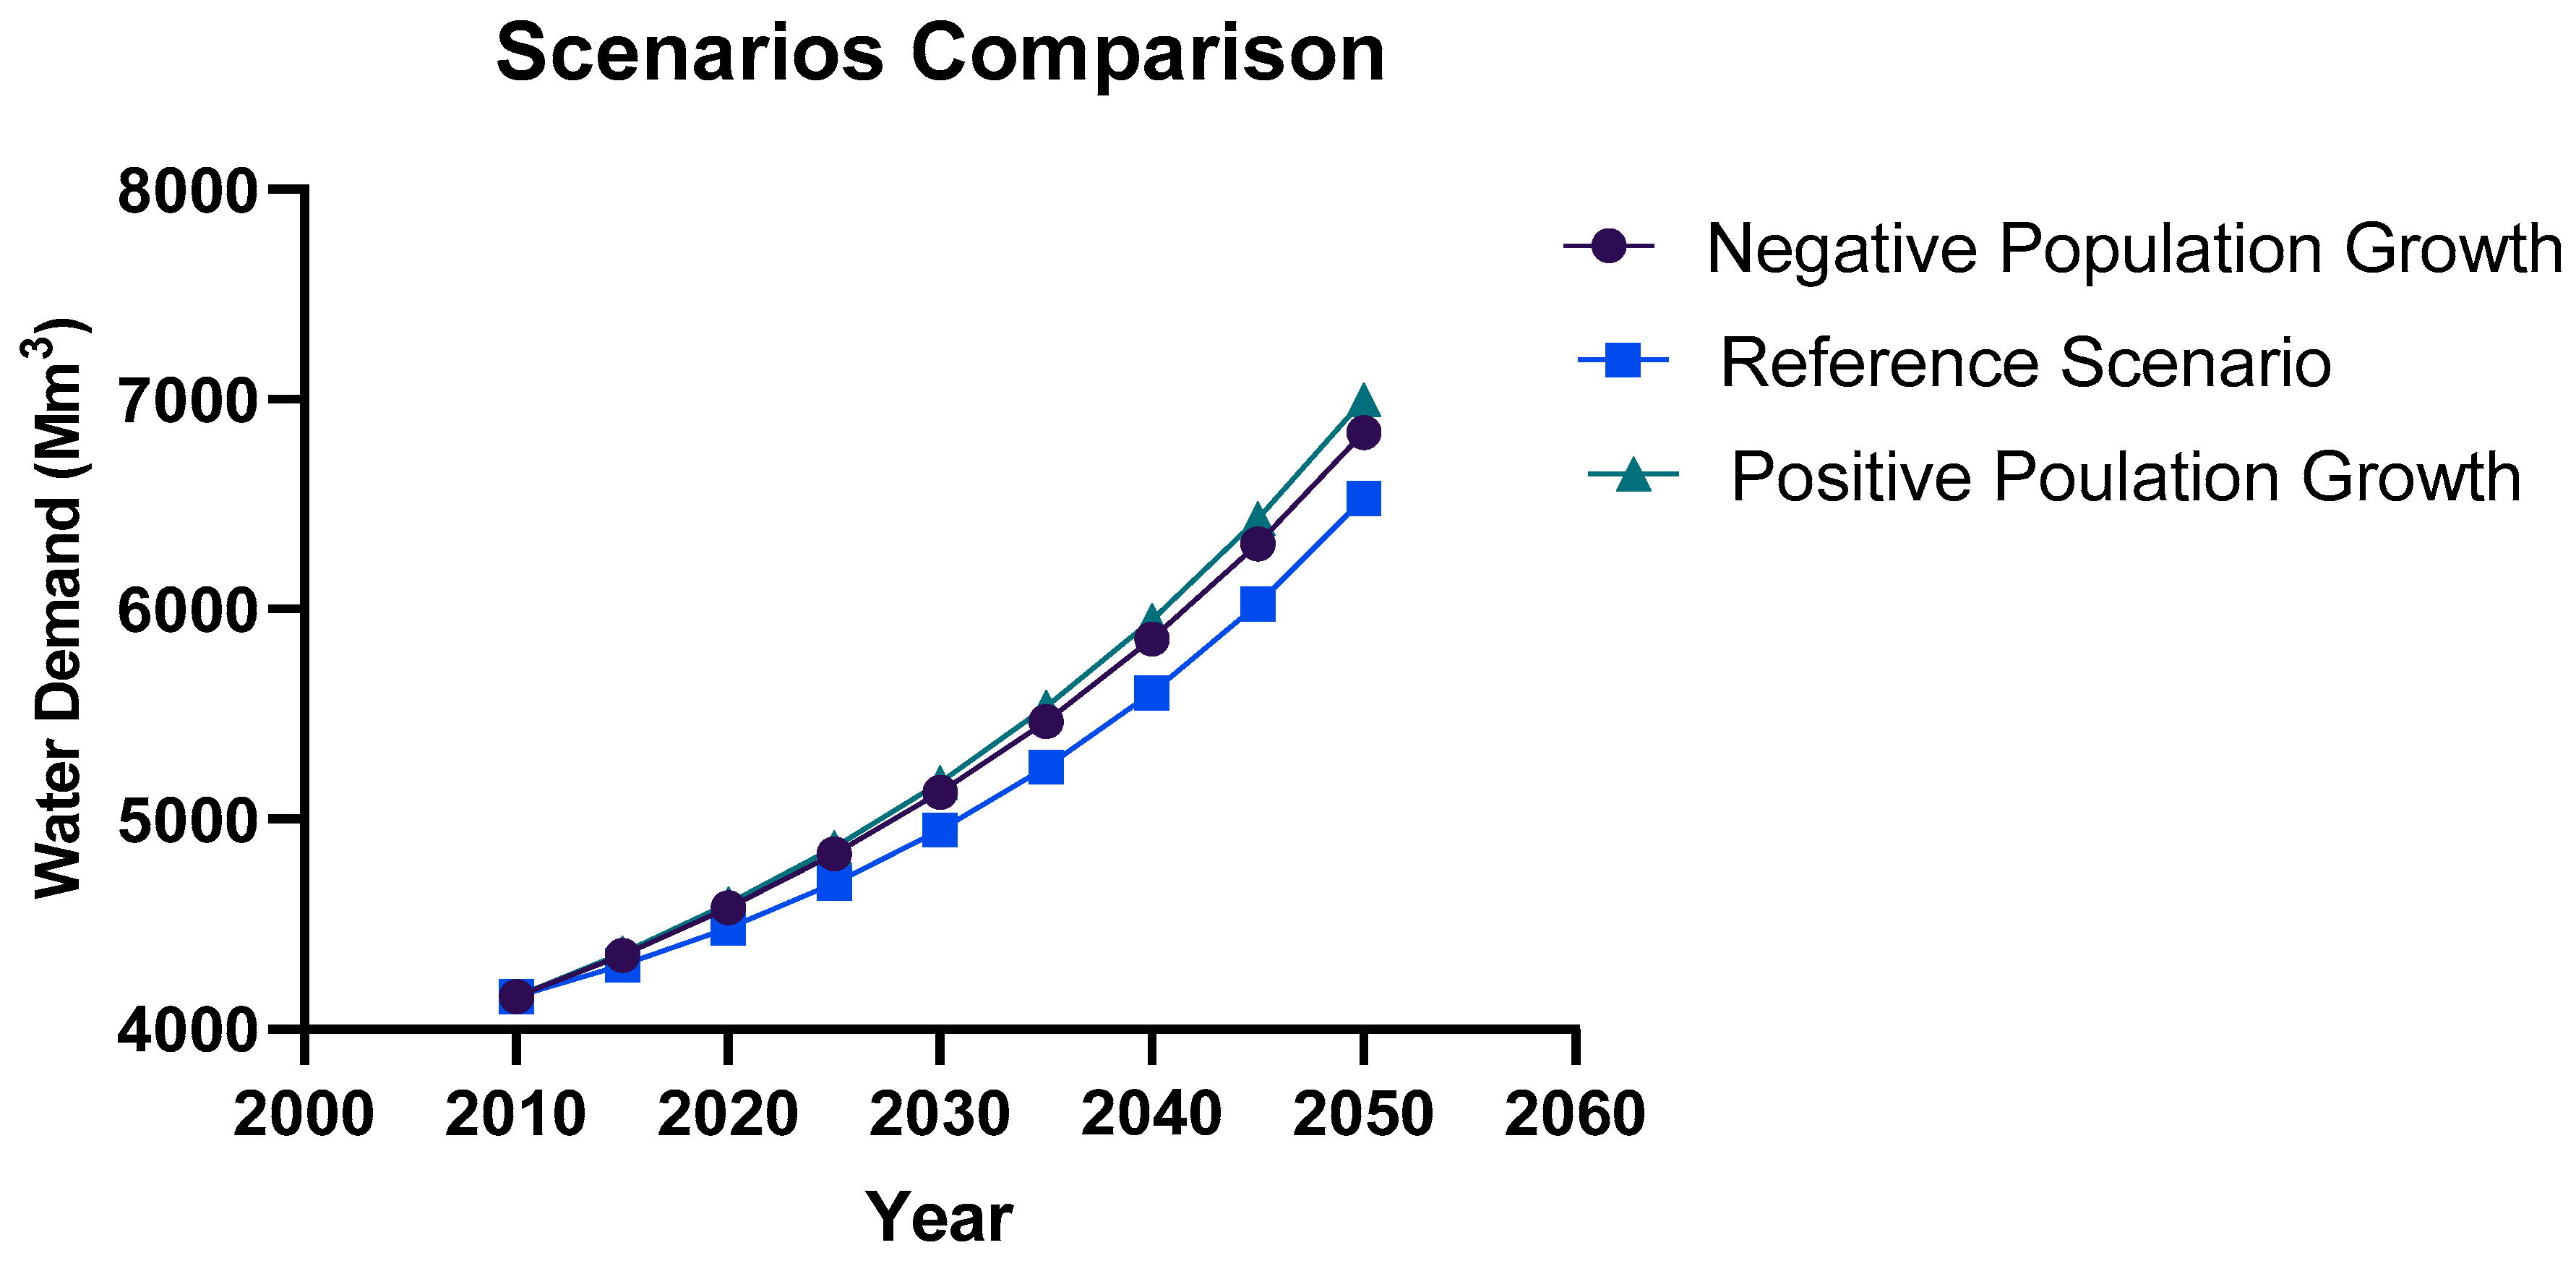
  • Population growth scenario.
  • Deforestation scenario.
  • Industrial growth scenario.
  • Low Climate change extended scenario (RCP-2.6).
  • Medium Climate change extended scenario (RCP-4.5).
  • High Climate change extended scenario (RCP-8.5).
Future climate change impacts were evaluated by comparing WEAP outputs between the reference and climate change extended scenarios. The baseline scenario considers the current account and sets the year as 2010, which provides actual water demand and supply for the system. The socio-economic reference-based scenario includes the current account data in the entire model and projected the outputs (2011–2050). The reference scenario represents the current actual situation that is modelled and projected under current year (2010) situations and conditions, considering assumptions of population growth rate, land use, and unit consumption.
The climate change extended scenario was designed by replacing climatic outputs by RCP outputs. The projections made by the climate models are not consistent with the “real” natural conditions, due to uncertainty and data errors in the models. CMIP5 results recently tried to fill this gap with finer model resolution and climate change scenarios. The projected precipitation and discharge generated by the SWAT model are shown in Figure 4 and indicate that there will be a slight increase in precipitation and discharge over HRB. The simulation results of SWAT model will be reflected in water demand for various sectors.

3. Results

3.1. Baseline Scenario

Current water use was estimated based on current water supply and demand estimates for the year 2010. The reference scenario had four types of sectoral demand: agricultural, domestic, forests (including animal husbandry and livestock), and industries (including construction and fire water demand). Based on annual water use, the demand site data were established as 44,283 L per person annually for domestic purposes, including urban and rural. The total population according to the 2010 census was 6,350,000 in Hongshui River Basin (HRB). The total land area of agriculture was of 4,820,373 hectares, with 451.97 m3 consumption per hectare annually. Forest area was 6,189,570 hectares, with 49.30 m3 consumption per hectare annually.
Figure 5 shows the monthly water demand for 2010 (current account) for the agriculture, domestic, forests, and industrial sectors with total demand of 4155 million cubic meters (Mm3). Agriculture is the main sector of the basin with the highest annual water demand (2179 Mm3) in the current year, followed by domestic demand of 292 Mm3, forests demand of 309 Mm3, and industries sector water demand of 1375 Mm3. Modeled water demand and observed water demand for the current year 2010 (Figure 6) showed acceptable values.

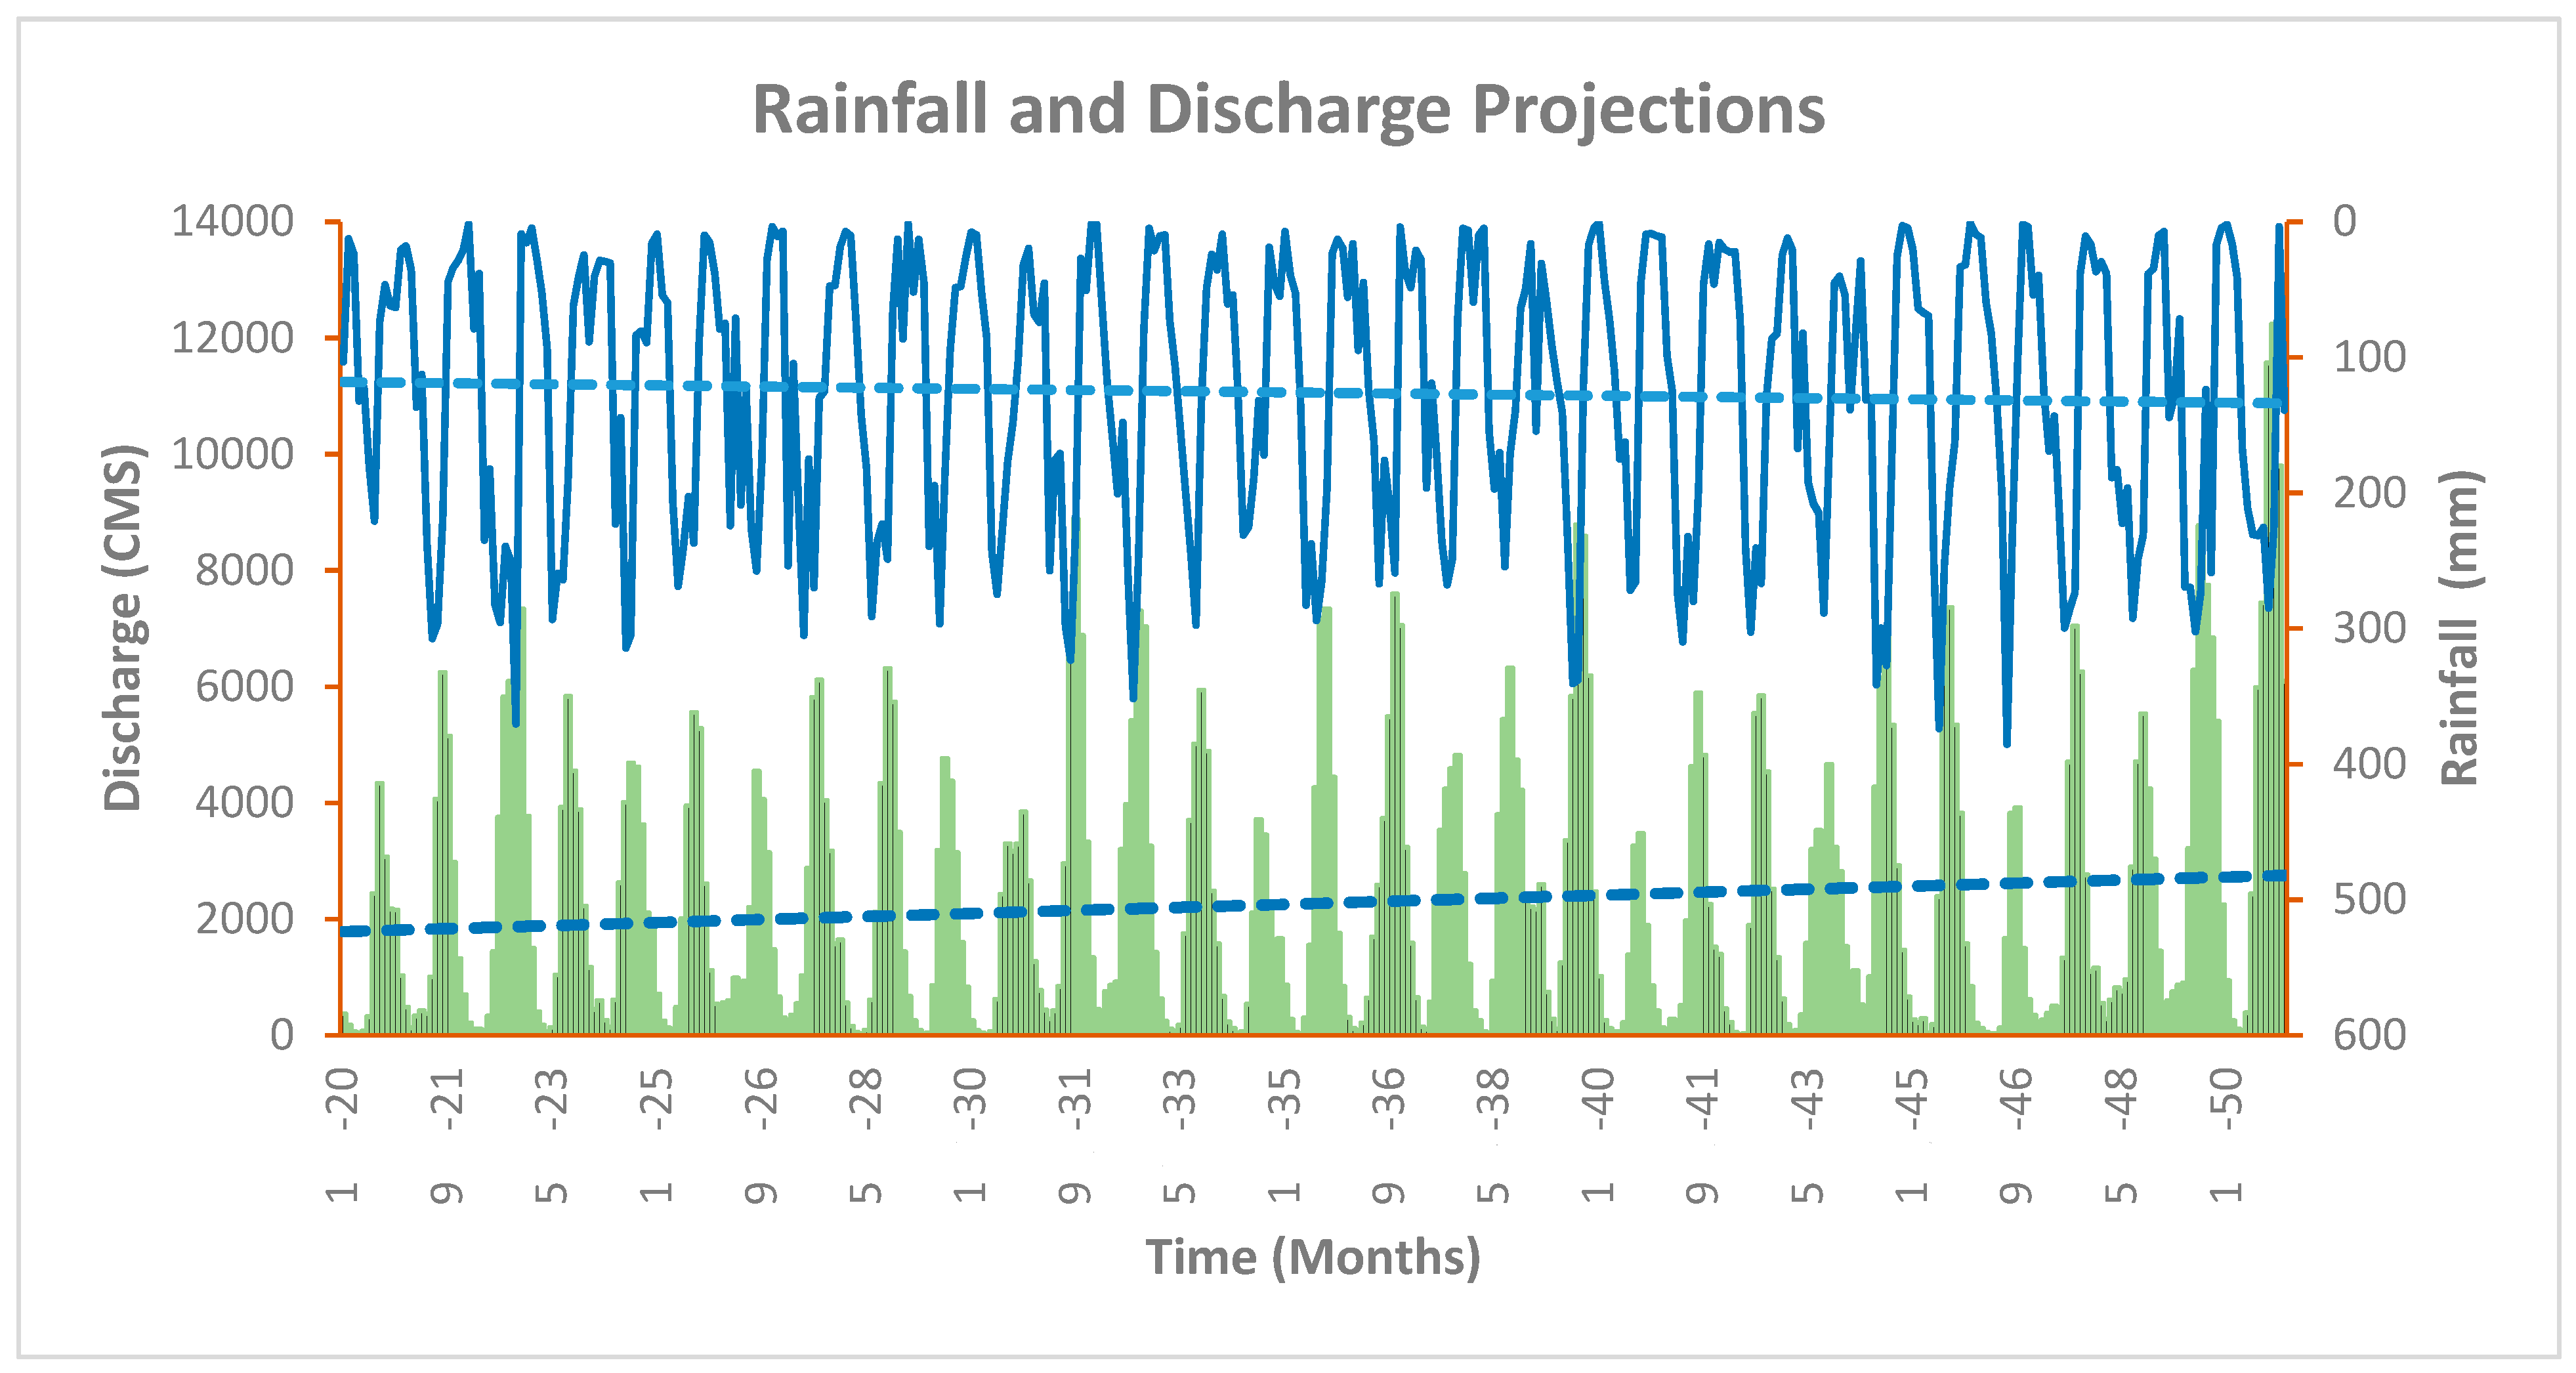
3.2. Reference Scenario

The reference scenario is the basic concept in the WEAP model, which can be used to manage various scenarios and reflects the actual role. In this model, the reference scenario was structured as a baseline scenario with population growth of 0.59% as per 2010 census data, and a 0.46% reduction in agriculture water consumption per year, due to advanced irrigation water techniques, 4.29% increase in forests, animal husbandry and livestock water consumption, and 1.24% increase in industrial water consumption based on previous years’ data.
The overall outcome obtained from the reference scenario is shown in Figure 7. Based on the overall result, the value of unmet demand is zero. Therefore, water availability under the reference scenario (based on the previous population growth rate of 0.59 percent) is indicated to be reasonably sufficient. Figure 7 shows the projected water demand for the period 2010–2050. From the results, it was projected that agriculture water demand will likely decrease 49.70 Mm3 in 2015, 48.52 Mm3 in 2020, 47.41 Mm3 in 2025, 46.33 Mm3 in 2030, 45.28 Mm3 in 2035, 44.25 Mm3 in 2040, 43.24 Mm3 in 2045, and 42.25 Mm3 in 2050. Domestic demand will likely increase by 59 Mm3 every five years and overall domestic demand will likely increased by 513.34 Mm3 during 2010–2050. Industries and forestry, animal husbandry and livestock will likely have the highest water demand, with an average increase of 148 Mm3 every five years, and livestock sector consumption will likely undergo an average increase of 105 Mm3 every five years until 2050. The total water demand until 2050 will likely be 208 billion cubic meters (Bm3), as shown in Table 4, with a breakdown of 39 percent for agriculture, 9.90 percent for forestry, animal husbandry, and livestock, 16.2 percent for domestic, and 34.87 percent for the industries sector.

3.3. Population Growth Scenario

A new scenario was introduced to predict the effect of potential situations on the model. The new scenario was generated to evaluate the impacts of positive and negative population growth rate for the Hongshui River Basin. This scenario also included a linear increase of 0.5% in agriculture area. The scenario was used to investigate the impact of a positive population growth rate ranging from 0.59% to 0.80% and a negative population growth rate ranging from 0.59% to 0.30%. Figure 8 shows the projections of water demand based on both positive and negative population growth scenarios. Water demand under positive population growth will likely be 218 Bm3, which is 10 Bm3 more than under the reference scenario. Negative population growth results in a slight increase in projected water demand because a linear increase in agriculture area was added. The total water demand for this scenario was projected to be 215 Bm3, which is 7 Bm3 more than in the reference scenario. It was noted that, in the scenario of a 0.50% increase in agriculture area and 0.80% increase in population, no unmet water demand was projected, implying that the water supplied each year will be sufficient.

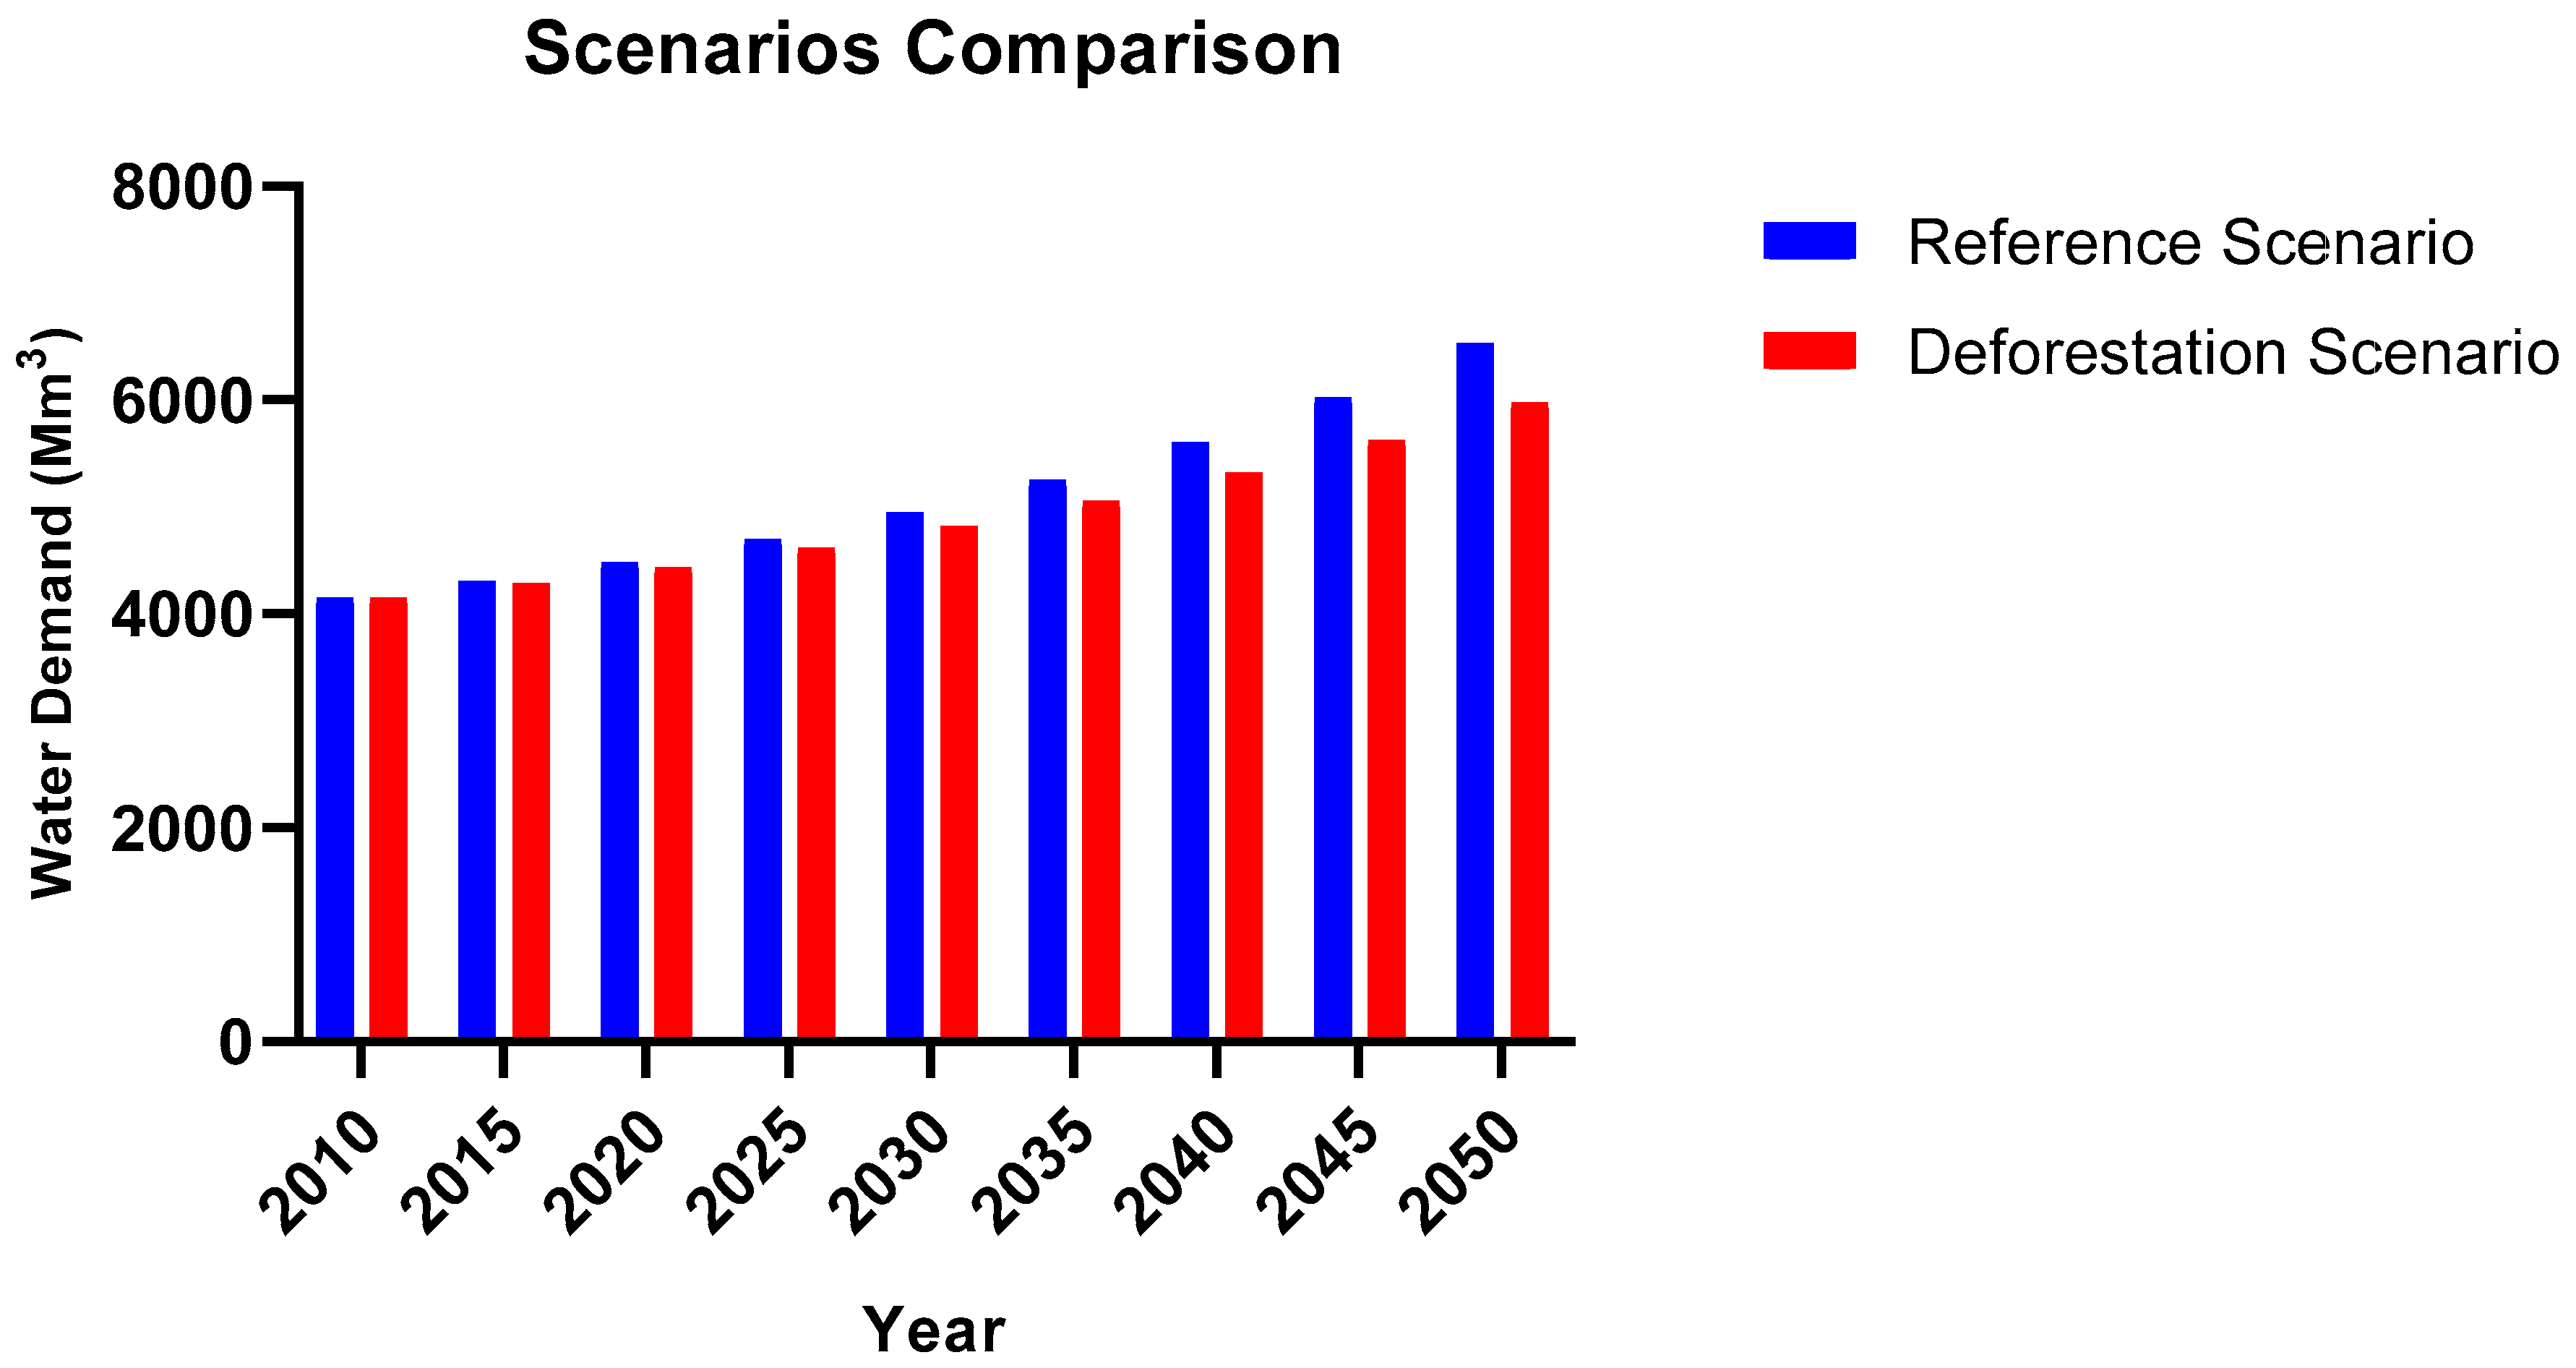
3.4. Deforestation Scenario

Results of the deforestation scenario, shown in Figure 9, indicate a 4% decrease in total water demand. The forest area was linearly reduced by 1%, and this reduction in area will decrease the water demand stress. Future deforestation in the Hongshui River Basin is possible because of population expansion and rapid industrialization. (Table 5 shows the water demand for forests, animal husbandry, and livestock, for reference and deforestation scenarios.
The total water demand projected for forests, animal husbandry, and livestock were 25,796 Mm3 for the deforestation scenario and 33,159 Mm3 for the reference scenario, which represents a 22% reduction.

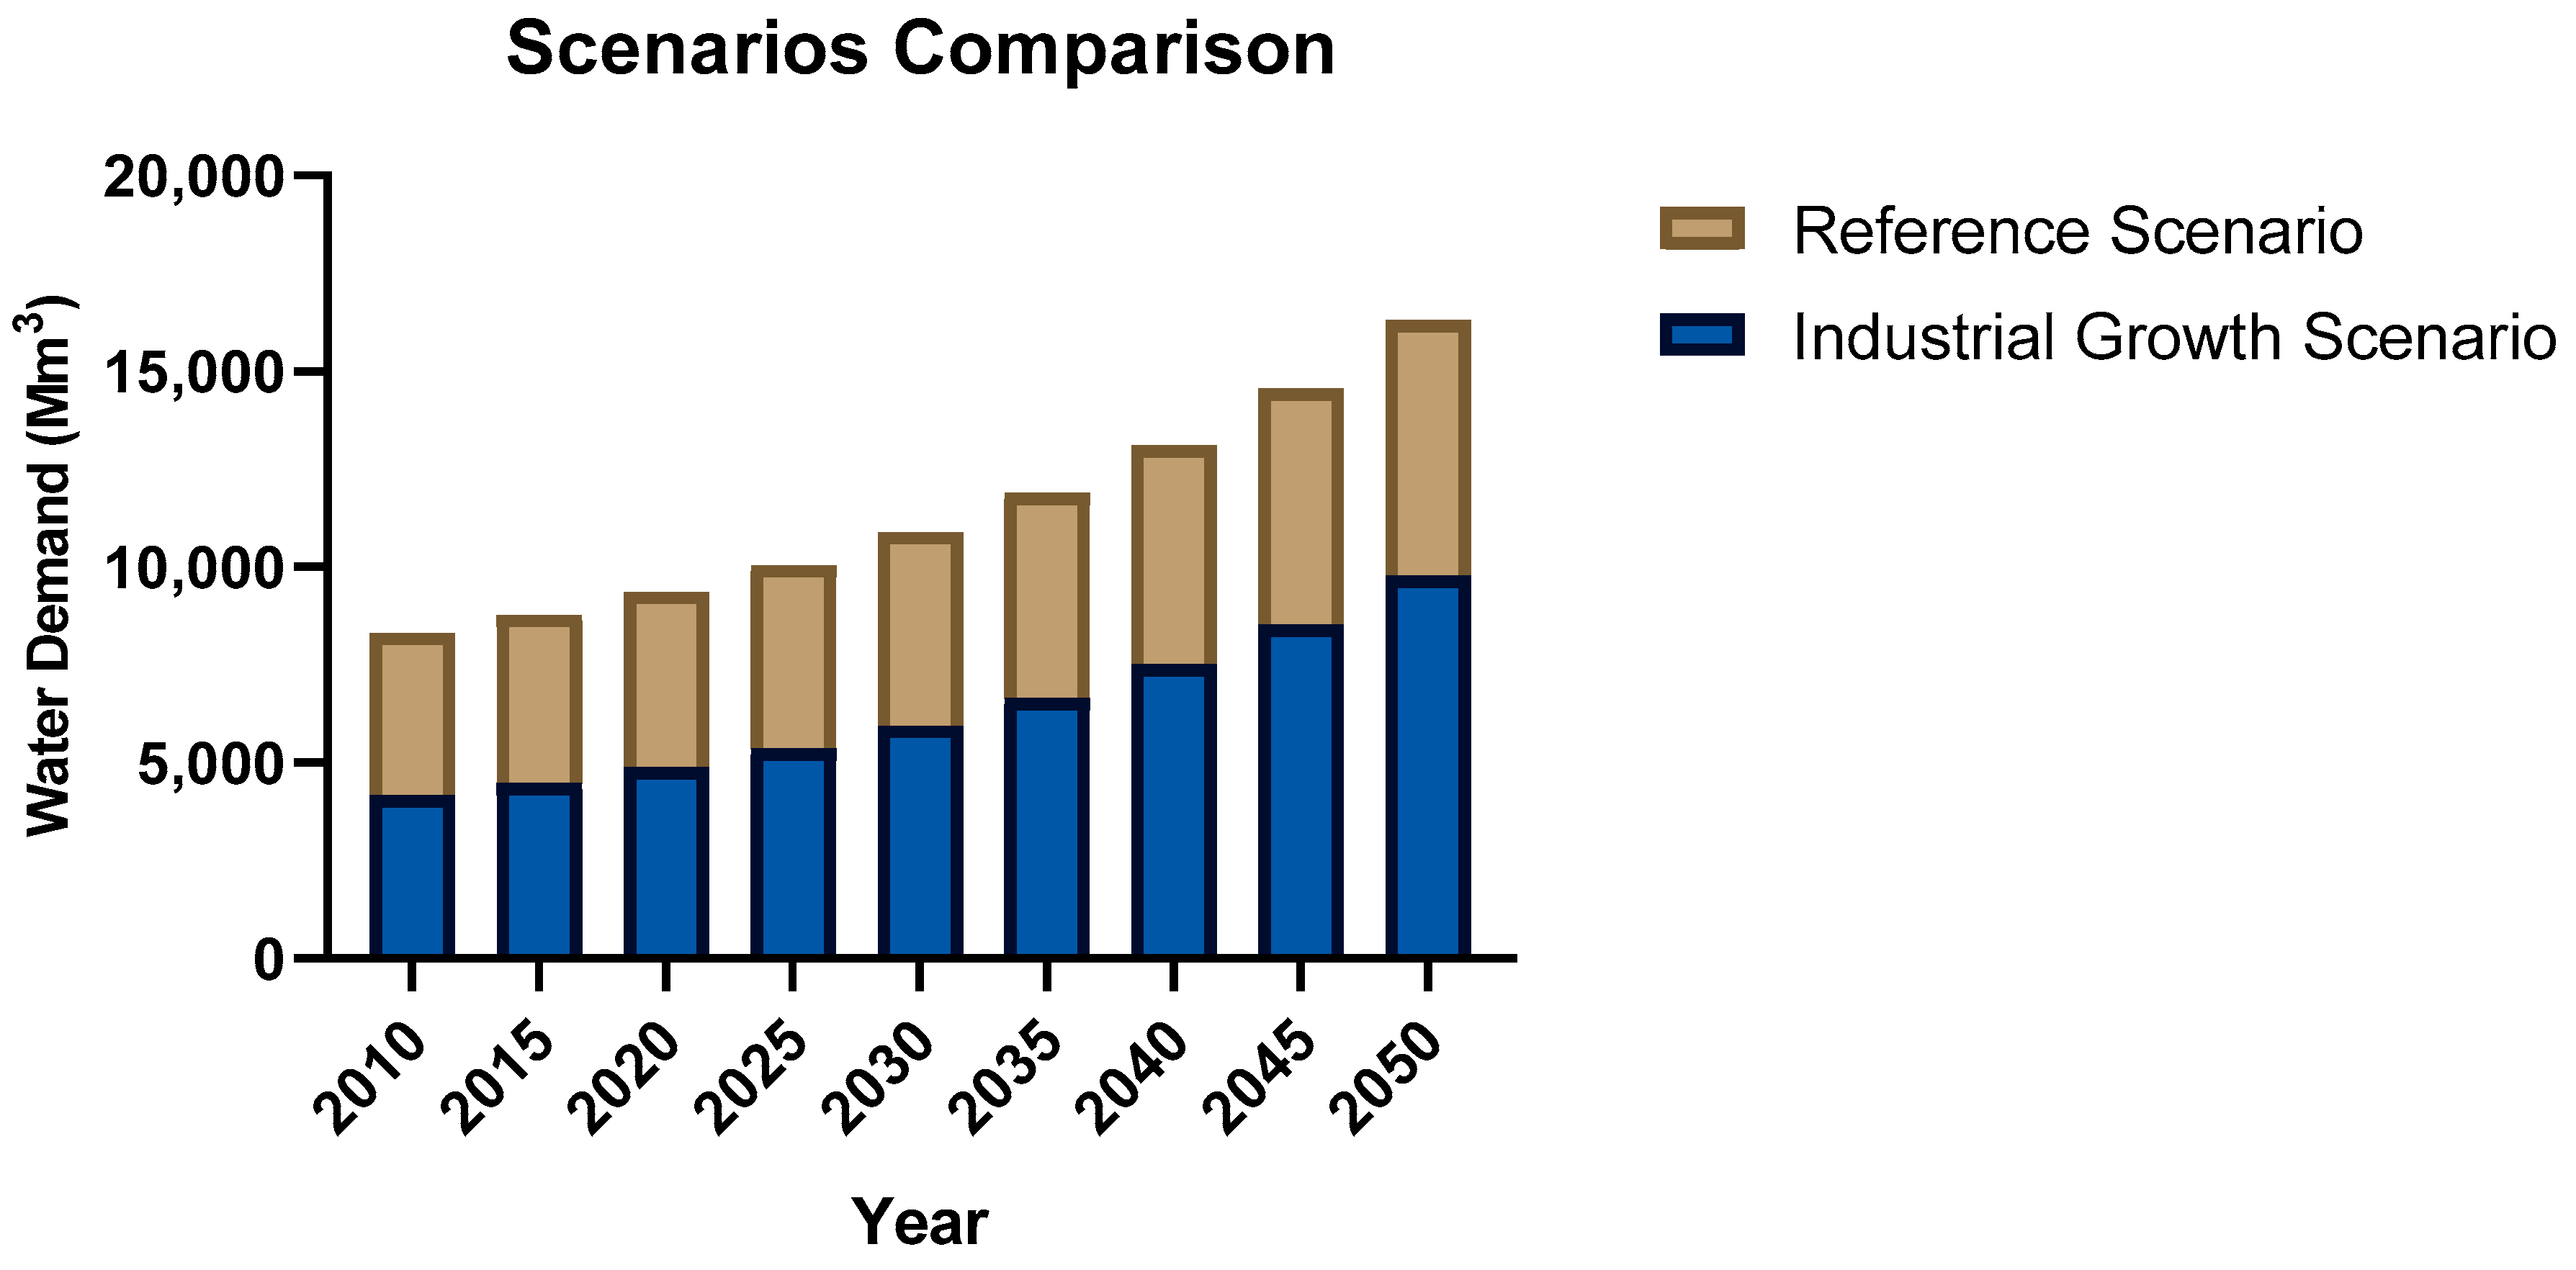
3.5. Industrial Growth Scenario

Industrial water, which also includes construction and fire water, is the second-highest category of water consumption, following agriculture water consumption. This scenario provides important insight into the impact of industrialization on future water demand. The reference scenario included a 1.24% increase in water consumption until 2050. A further 2.5% increase in water consumption and a 1% linear increase in industrial sector area, due to rapid urbanization was added to this new scenario.
The total water demand projected for the industrial growth scenario was 258 Bm3, which is 19.6% more than in the reference scenario, as presented in Figure 10. The total water demand projected for industries will be 122 Bm3 for the industrial growth scenario and 73 Bm3 for the reference scenario, representing a 41% increase.

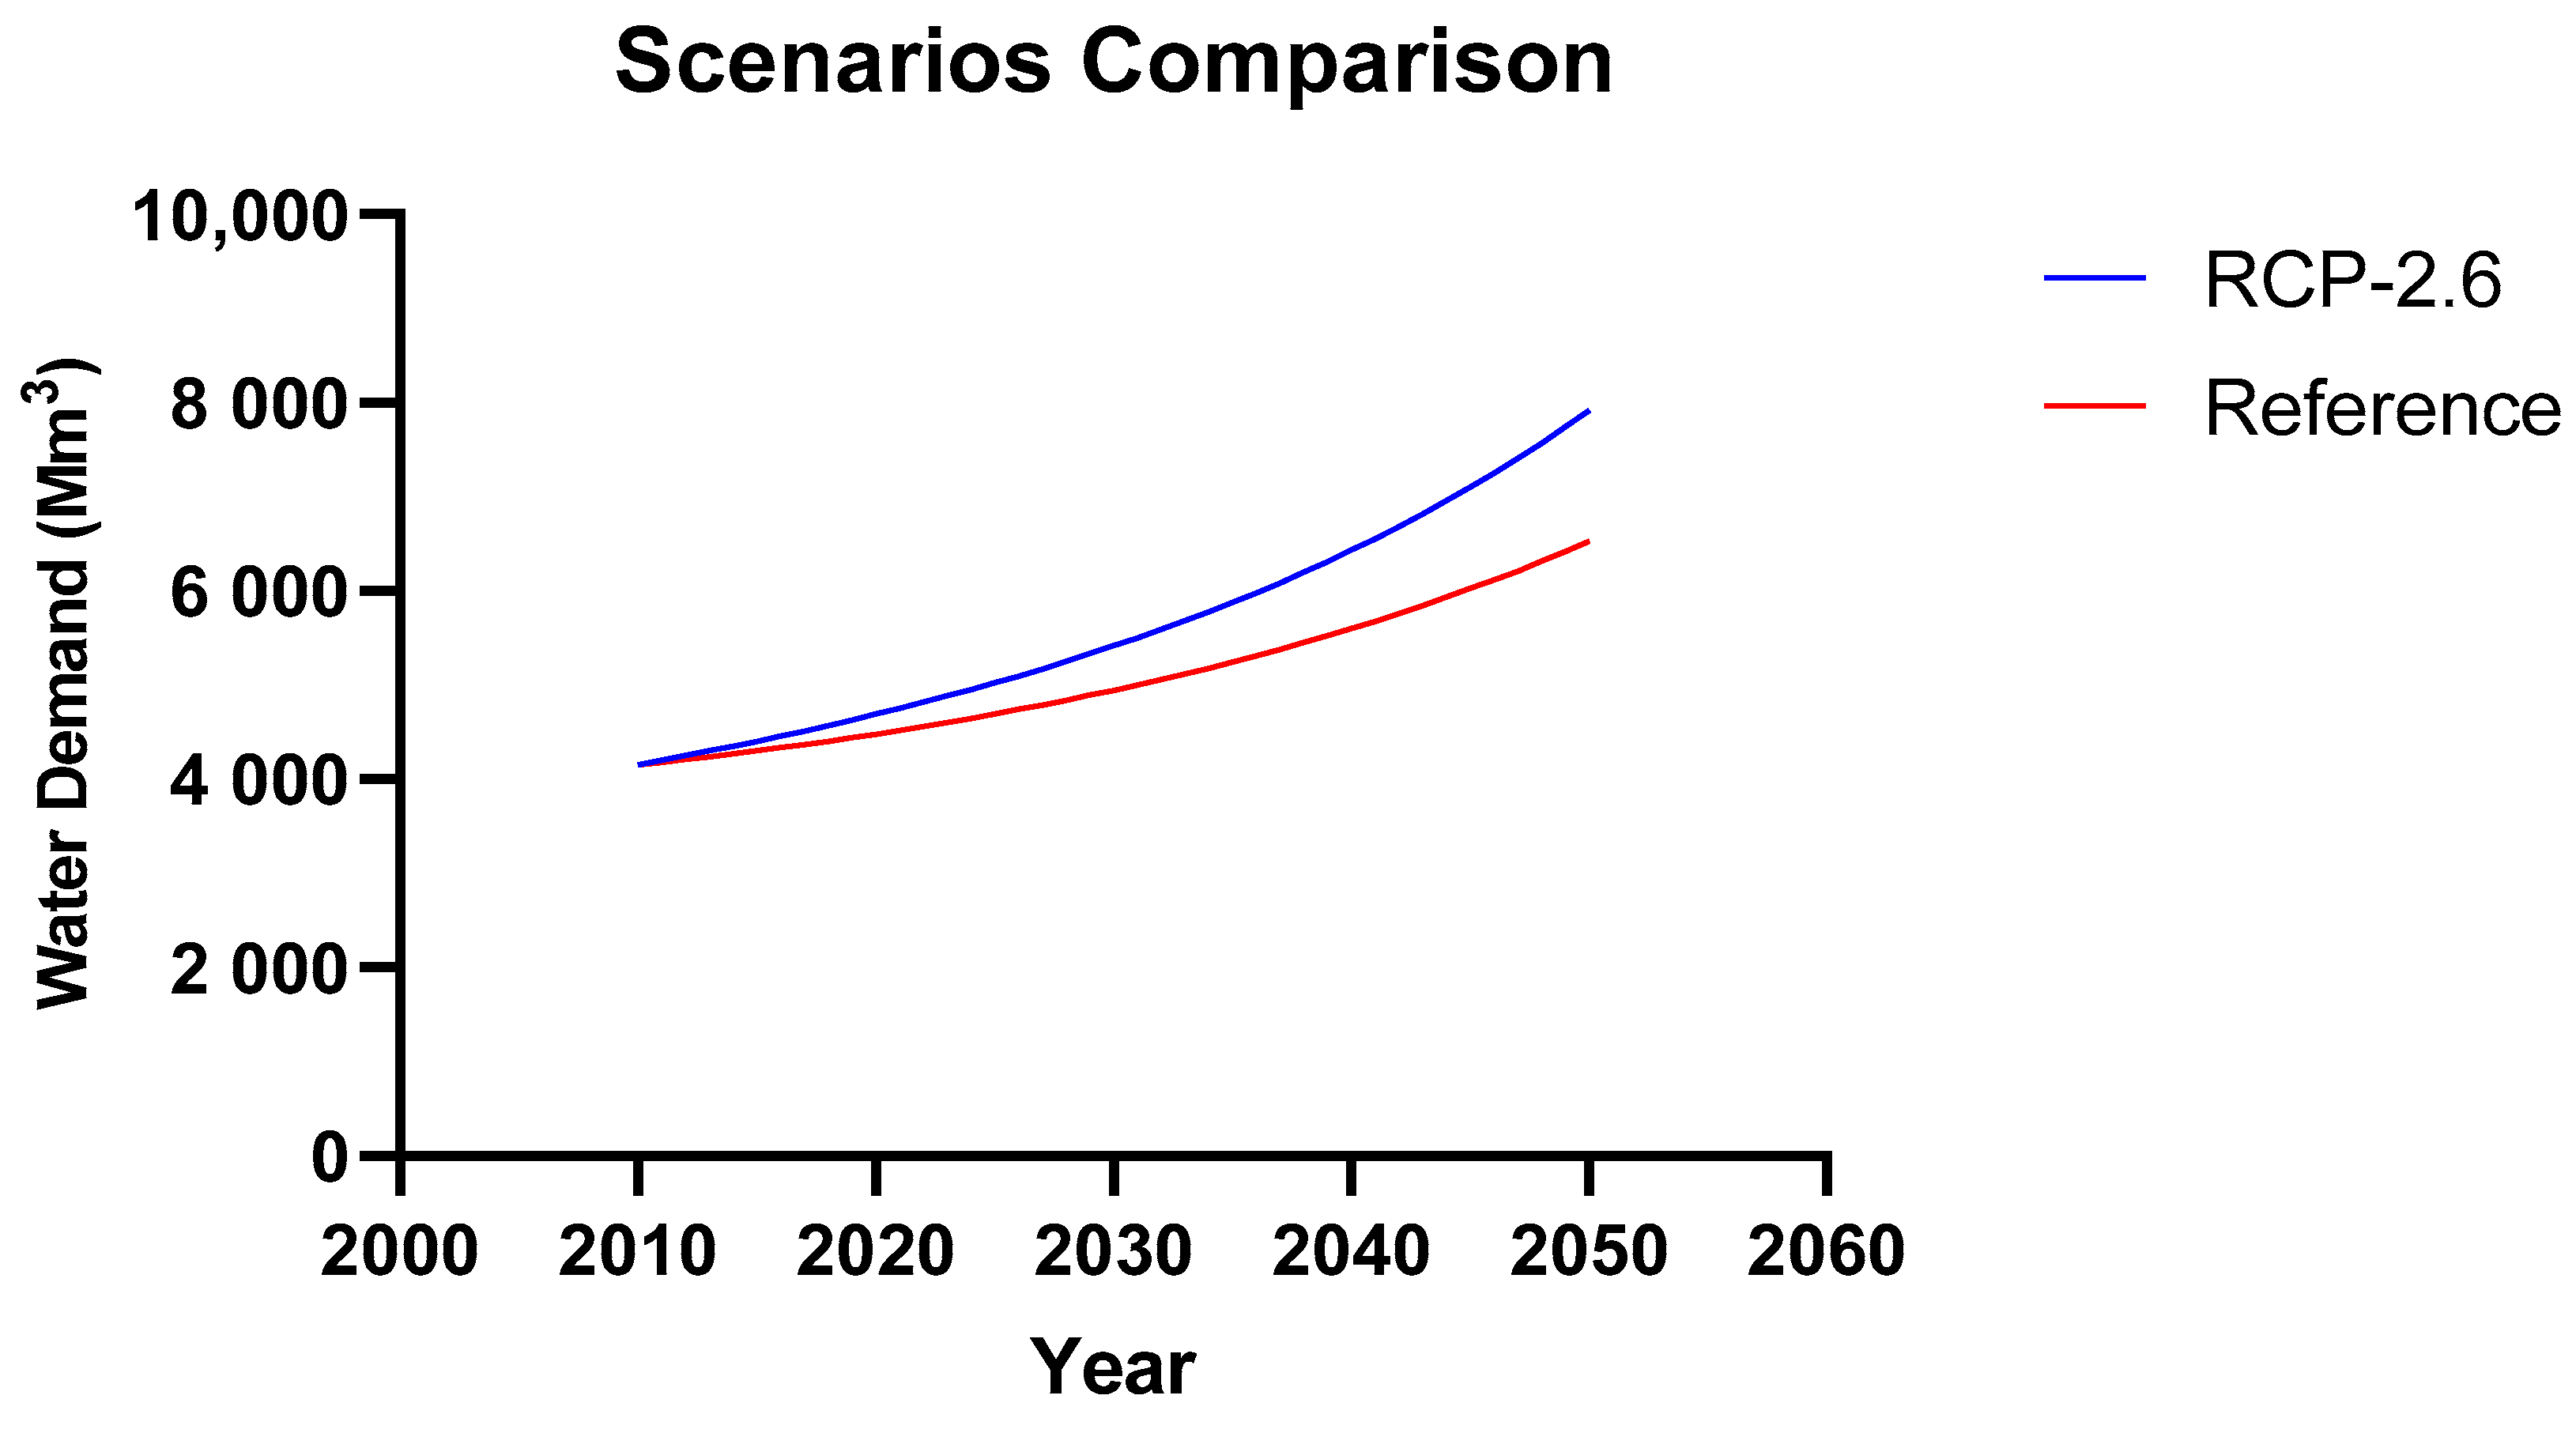
3.6. Low Climate Change Extended Scenario (RCP-2.6)

Climate change scenarios are those scenarios developed by the Coupled Model Intercomparison Project Phase 5 (CMIP5) based on an unprecedented level of information on which to base projections, including new Earth system models with a more complete representation of force, new Representative Concentration Pathways (RCP) scenarios, and more output available for analysis. Global precipitation would certainly increase with increasing global mean surface temperature in the long term. Global mean precipitation will increase at a slower rate per degree Celsius than atmospheric water vapor. For scenarios other than RCP2.6, it will most likely rise by 1 to 3 percent °C−1. The CMIP5 models’ sensitivities for RCP2.6 range from 0.5 to 4 percent °C−1 at the end of the 21st century [61]. This scenario included statistically downscaled precipitation and temperature data of five GCMs, and the addition of streamflow data generated by the SWAT model was embedded in the WEAP model to project future water demand under the RCP-2.6 scenario.
The WEAP model predicted an increase in future water demand in the Hongshui River Basin according to the low emission scenario RCP-2.6. This scenario requires ambitious greenhouse gas emissions reductions and assumes a population of 9 billion at the end of 2100, an increase in croplands due to bio-energy production, and more intensive animal husbandry. In this scenario we considered these factors and results show an increase in water demand from domestic, agriculture, and forests, animal husbandry, and livestock sectors. The total water demand would likely increase under the low emission scenario RCP-2.6, as shown in Figure 11, to 231 Bm3, whereas in the reference scenario the total water demand was 208 Bm3 with zero unmet water demand.

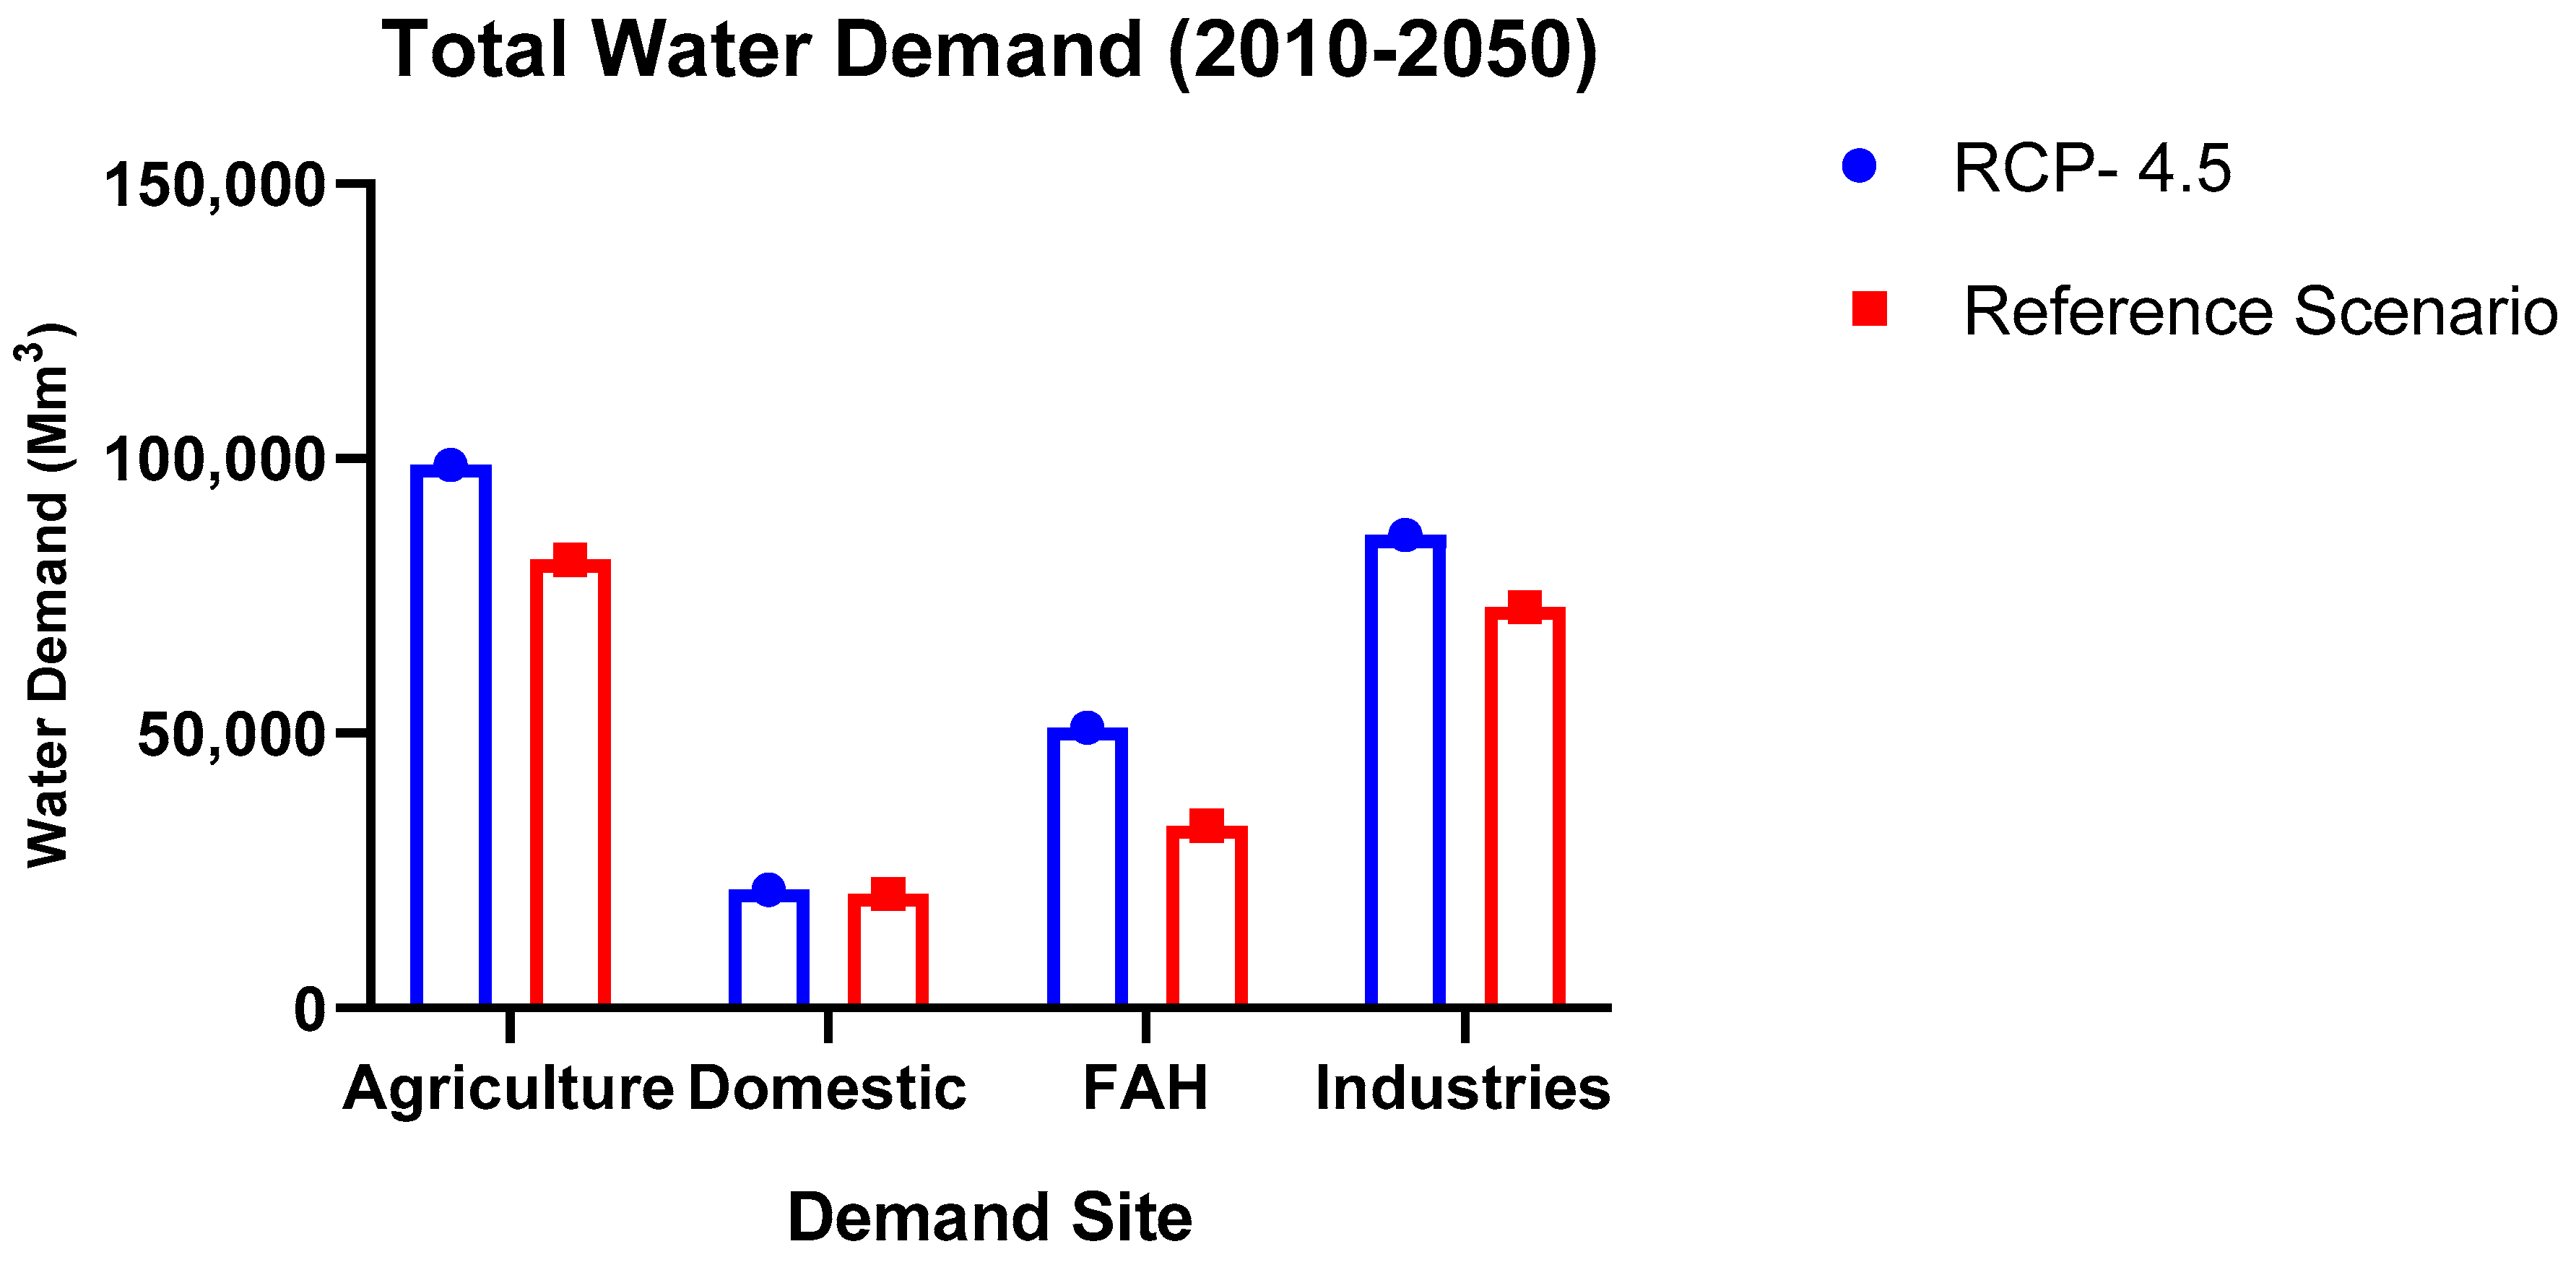
3.7. Medium Climate Change Extended Scenario (RCP-4.5)

RCP-4.5 is an intermediate emission scenario encompassing relatively ambitious emissions reductions, and the assumed outlook is consistent with strong reforestation, decreasing use of croplands and grasslands due to yield increases, and dietary changes and stringent climate policies. This study analyzed the ensemble output of five GCMs under RCP-4.5 and the WEAP model predicted an increase in all demand sectors.
This scenario included an increase in all demand sectors consistent with RCP-4.5 features. The total water demand was 258 Bm3, which is 24% more than in the reference scenario, as summarized in Figure 12 for each demand site. The maximum percentage projected changes were 54% in forests, animal, and husbandry, and 18% in the agriculture sector, to ensure the future food security.

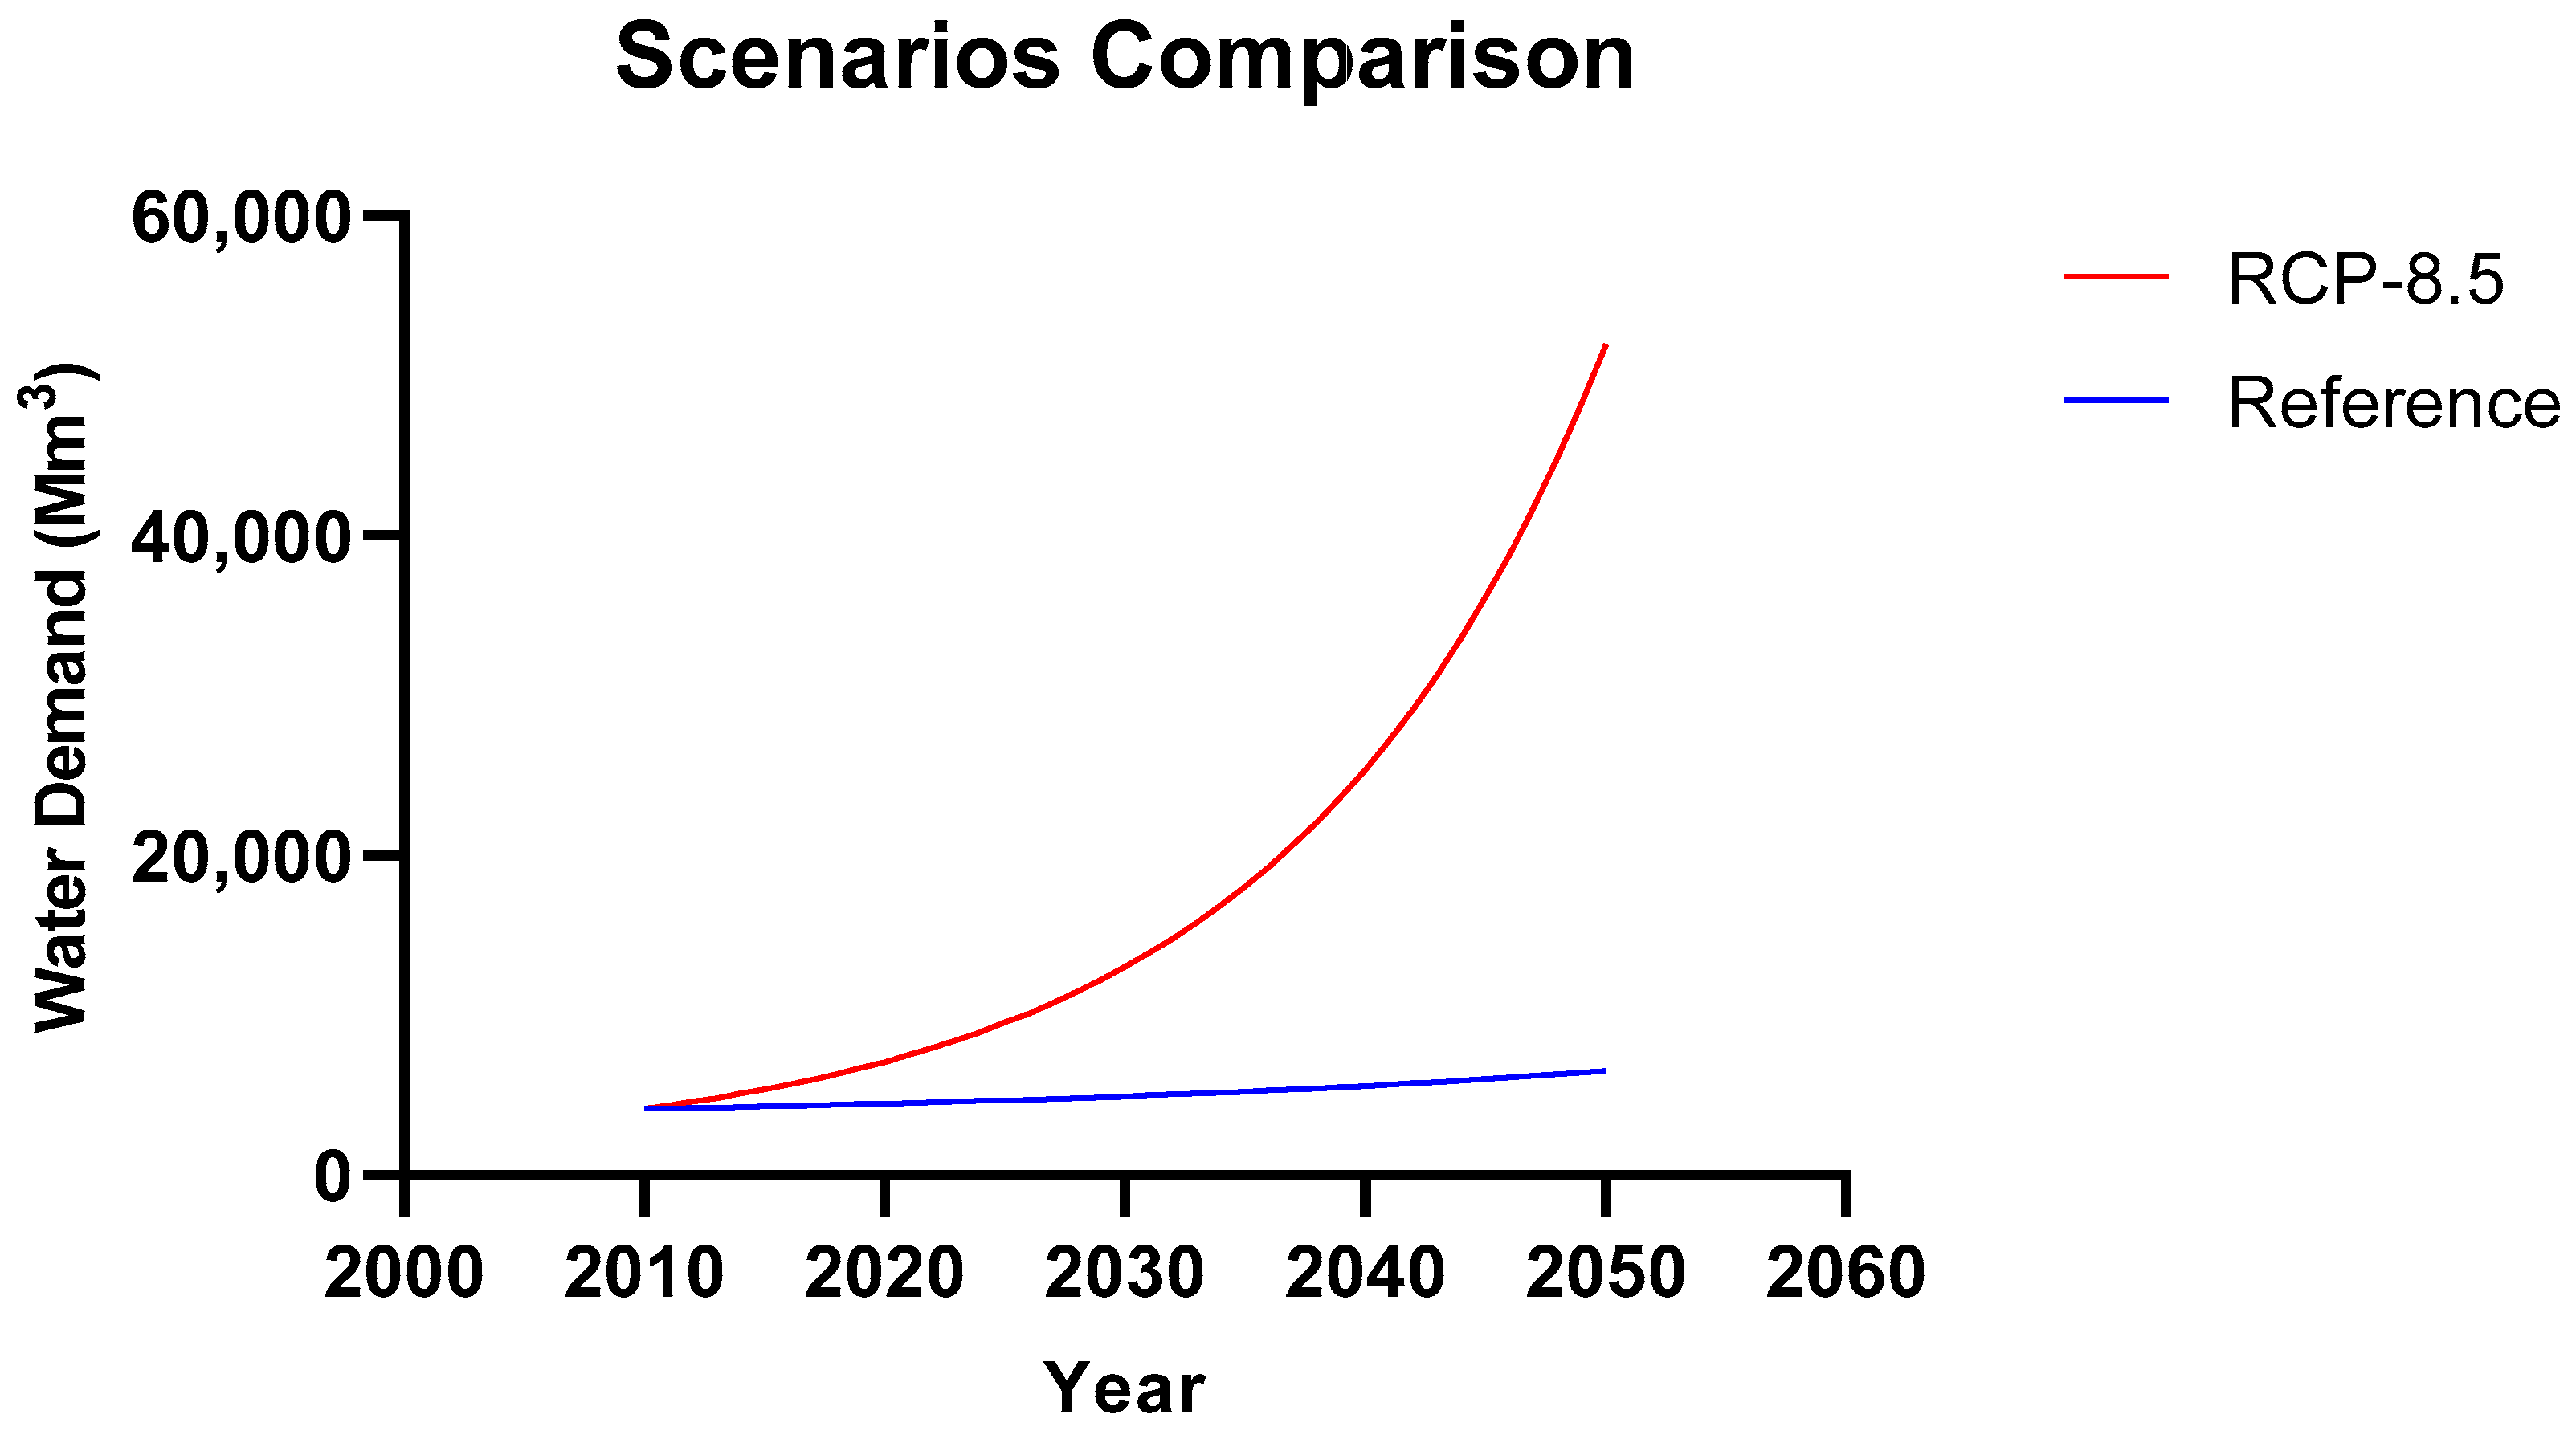
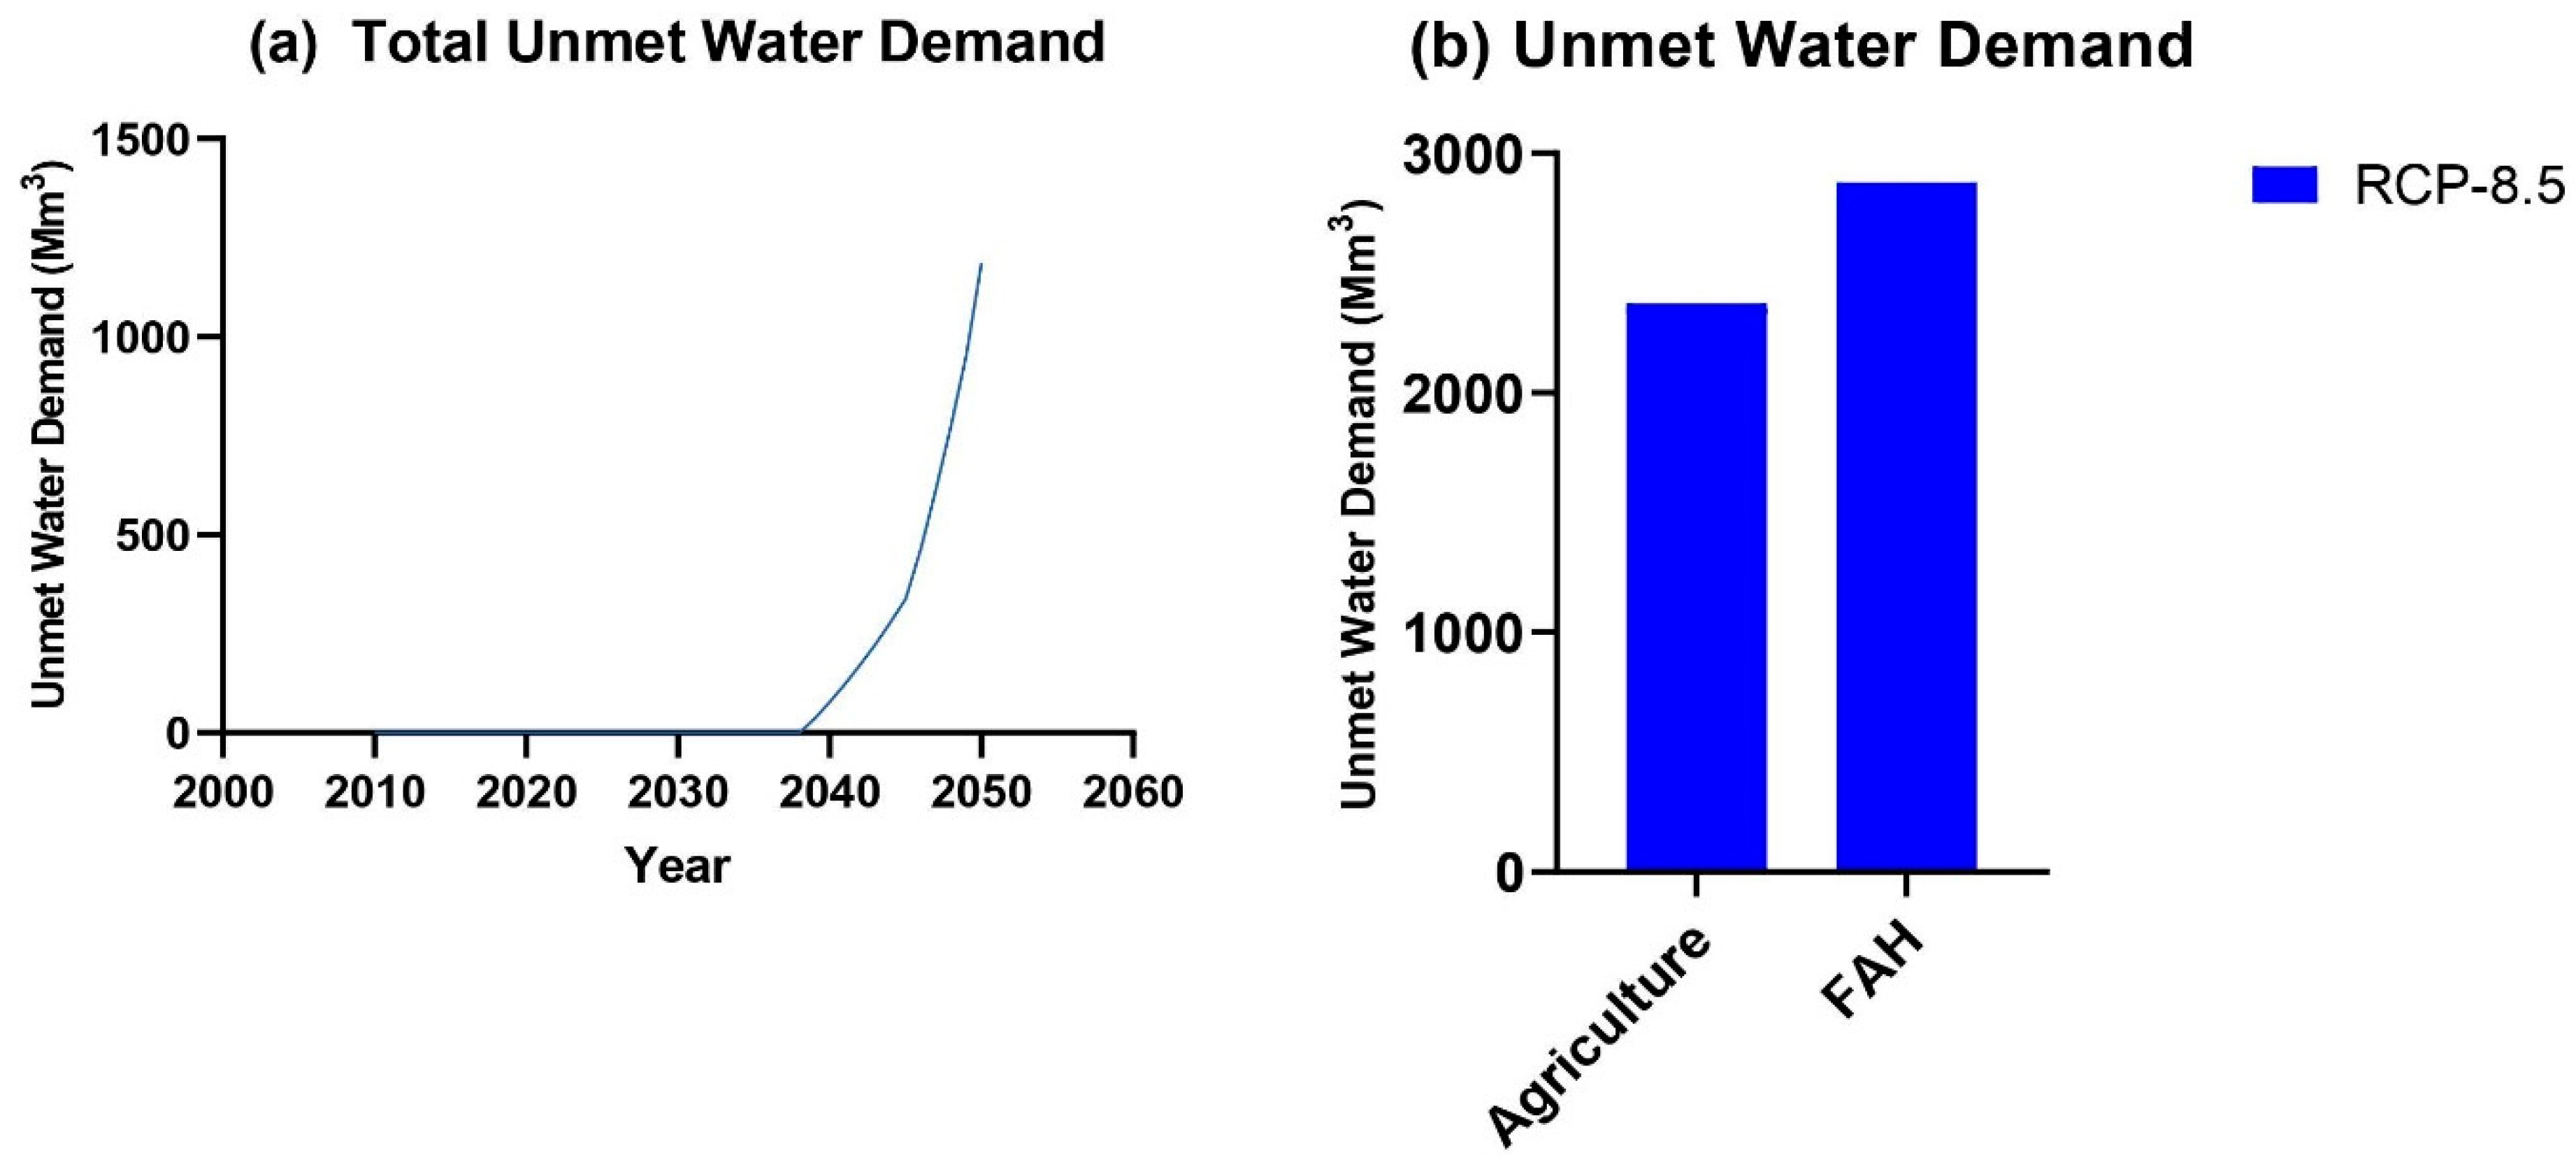
3.8. High Climate Change Extended Scenario (RCP-8.5)

This scenario included the features of the RCP-8.5 high emission scenario. This RCP is consistent with a scenario of no future policy changes to reduce emissions. The scenario also assumes a global population of 12 billion by 2100, increased use of croplands and grassland, driven by an increase in population, a threefold increase in carbon dioxide emissions compared to current levels, and high energy intensity and high resilience on fossil fuels.
This scenario projected a significant amount of water demand as a result of the lack of implementation of new climate change policies, which leads to high methane and carbon emissions. The total water demand projected for RCP-8.5 will likely jump to 734 Bm3, which is approximately three times higher than in the reference scenario, as shown in Figure 13.
RCP-8.5 projections showed a likely significant increase in water demand in industries, and forests, animal, and husbandry, followed by agriculture, as shown in Figure 14, resulting in large quantities of carbon and methane emissions. The total water demand (2010–2050) projected by RCP-8.5 for the agriculture sector was 171 Bm3; for forests, animal, and husbandry, projected demand was 100 Bm3; and for industries, projected demand was 442 Bm3, which is five times higher than in the reference scenario.
The total unmet water demand projected for RCP-8.5, as shown in Figure 15, was 5428 Mm3 in the period from 2039 to 2050. Forests, animal, and husbandry will likely undergo the highest unmet water demand, of 2876 Mm3, followed by the unmet water demand of the agricultural sector of 2372 Mm3.

4. Discussion

This study assessed the water demand focused on various socioeconomic, management, and climate change scenarios for sustainable availability of future water resources in Hongshui River Basin (HRB), China. To establish a sustainable water supply–demand system, we considered the current water supply–demand system in the study area and determined the potential impacts of climate change impacts of extreme drivers of demand for HRB water resources. Based on the current supply–demand situation, supply- and demand-side management scenarios were applied in the model to optimize the water management system to achieve better results. In this study, a reference scenario was constructed based on the current water demand and supply in the Hongshui River Basin, which was estimated to be 4,155 Mm3. Similar studies were conducted by Matchett and Fleskes [62,63,64] using the WEAP model to analyze future water demand based on current and reference scenarios. In the current study, the total water demand for the reference scenario in 2050 was projected to be 55% more than current year water demand. Based on the reference scenario, water demand will increase by 38% for domestic, 60% for industries and 63% for forests, animal husbandry, and livestock. Similar results were reported by Asghar, et al. [65], who concluded that, based on the reference scenario, water demand in the central Indus Basin will increase by 11% for domestic and 55% for agriculture and livestock sectors. A similar study conducted on water demand in West Ethiopia’s Didessa sub-basin found the existing water demand was 74 Mm3. Their study findings will help solve water management issues in the basin [66]. Another similar study conducted in the Mae Kong Basin in Thailand estimated an average unmet demands for agriculture of 62 and 17 Mm3 under differing climate change scenarios [67]. In the current study, the WEAP model was also used to analyze external drivers (population growth, agricultural growth, deforestation, industrialization, and climate change), which place significant stress on the existing water supply system. These demands intensify water scarcity in the catchment, particularly downstream, and encourage water resource managers to implement water management policies in the Hongshui River Basin (HRB). An efficient management approach must be implemented based on the results of this report. A comparative analysis was designed to consider alternative efficient strategies for water security in the basin.
The integrated SWAT–WEAP methodology was applied in an efficient way to evaluate the technical management of water resources. This study shows that the HRB’s high water management pressure stems predominantly from demand in agriculture and industry. The reference scenario has a negative effect on the HRB supply system, via rising water demand, which is expected to double by 2050. This rapid rise in demand is not only due to anthropogenic activities, but also to changes in rainfall and seasonal variation. Socio-economic scenarios, including population growth (positive and negative growth), industrial growth and deforestation scenarios, were analyzed in this study. Each of these socio-economic scenarios would likely result in an increase in water demand and zero unmet water demand. The available water will likely be sufficient for two cities (He chi and Laibin) in the basin for the period 2010–2050. Because downstream cities are more populated and support large industries, they may face water shortages, which will be covered in future studies. Touseef, Chen, Masud, Khan, Yang, Shahzad, Ijaz and Wang [9] concluded that the water yield is likely to decline by 30 percent for the future period (2020–2050) under all future scenarios, which supports the finding that water demand will likely increase. Sufficient water is likely to be available until 2050 in the socio-economic scenario and two climate change scenarios because major drought is not projected in the Xijiang River Basin. The Xijiang Basin likely underwent three significant cycles of hydrological drought (from the 1950s to the mid-1960s, during the late 1980s, and from the mid-1990s to the beginning of 2010) and two periods of drought relief (from the late 1960s to the mid-1980s, and the late 1990s to the early 2000s) [68]. Another study found that there will be growing pressure on the water supplies of Binhai New Area (BHNA), China, and numerous suggestions have been submitted to aid policymakers in water management to meet the potential water demand in the region [69]. A similar study conducted at Songhua River Basin, Northeastern China, concluded that the implementation of the WEAP model indicated a maximum decrease in water flows of 24% in potential climate change scenarios before the end of the 21st century. The drought indicators showed that serious to extreme drought events are likely to be most evident in 2059, 2060, and 2085, and mild to moderate drought events may occur in the study area in the remaining years [70].
The current study also modelled water demand using an ensemble of five GCMs under three RCPs: the low climate scenario (RCP-2.6), medium climate scenario (RCP-4.5) and high climate scenario (RCP-8.5). The results showed that water demand will likely increase under all climate change scenarios. The total water demand projected under low and medium climate scenarios was 231 and 258 Bm3, respectively, which represented increases in water demand of 11% and 24% compared to the reference scenario. The higher climate change scenario (RCP-8.5) will significantly increase water demand, by threefold relative to the reference water demand. Thus, it is important to implement policies to maintain the temperature rise and emissions, thereby lowering their effect and reducing water demand. Industrial policies will be important to ensure future water demands can be met. The water availability in Hongshui River Basin (HRB) will likely be sufficient for the two adjacent cities until 2050, but this finding will not uniformly apply to downstream cities. Further study will be required to analyze the water demand beyond 2050 and for downstream cities. The current results are supported by Wang, et al. [71], who summarized that the A1B scenario will increase water scarcity in river basins in the north of China, but the water situation will improve in river basins in Southern China. The results of another study differed slightly from our findings and showed that total water demand will increase in most basins of China, but with a declining share of agriculture, mainly due to commercial, domestic, and urban competition. In general, water availability for agriculture will decrease in southern China and remain stable in northern China [72].

5. Conclusions

This study integrated two models, the SWAT model for future climate prediction, and the WEAP model for the simulation of water supply and demand in the Hongshui River Basin (HRB), to evaluate the impacts of climate change and socio-economic scenarios. The results of the SWAT model showed that, in the HRB, temperature, precipitation, and water discharge will increase slightly until 2050. The WEAP model was developed and showed that the two major drivers of future water shortages in the basin will be climate variables and socio-economic factors. This study analyzed three socio-economic and three climate change scenarios. The results indicated that agriculture and industries are the major factors that will place pressure on the water resources in the future. Domestic water is sufficient for two cities located in the basin (He chi and Laibin) until 2050. A total unmet water demand of 5 Bm3 would likely occur in the basin under RCP-8.5. All scenarios showed an increase in water demand. Therefore, we propose that better long-term management policies should be implemented in the watershed to ensure the sustainability of water resources. We also propose to use a range of GCMs with the latest RCPs, in addition to the five examined here, in future research on the Hongshui River Basin. These studies will help explain the uncertainties of modelling and simulation. Nonetheless, for research into future climate change scenarios and hydrological trials in this area, the high-resolution climate data used in this study performed well. Based on the results of the analysis of the socio-economic and climate changes scenarios, the study has high significance for water management and stakeholders of water supplies.

Author Contributions

Muhammad Touseef devised the idea, performed the analysis, designed the study, and wrote the paper. Lihua Chen provided technical support and supervision, and Wenzhe Yang helped in data collection. All authors have read and agreed to the published version of the manuscript.

Funding

This study is supported by the National Key Research and Development Program of China [2017YFC0405900], the National Natural Science Foundation of China [52069002, 51669003], Innovation Project of Guangxi Graduate Education [YCSW2019047] and the Guangxi Key R&D Program [AB16380284].

Acknowledgments

The authors would like to thank the National Meteorological Information Centre (NMIC) of the China Meteorological Administration (CMA) for the great help and support to data exchange. We are grateful to SEI for the WEAP software license granted.

Conflicts of Interest

The authors declare no conflict of interest.

References

  1. Ahmadaali, J.; Barani, G.-A.; Qaderi, K.; Hessari, B. Analysis of the Effects of Water Management Strategies and Climate Change on the Environmental and Agricultural Sustainability of Urmia Lake Basin, Iran. Water 2018, 10, 160. [Google Scholar] [CrossRef] [Green Version]
  2. Chanapathi, T.; Thatikonda, S.; Raghavan, S. Analysis of rainfall extremes and water yield of Krishna river basin under future climate scenarios. J. Hydrol. Reg. Stud. 2018, 19, 287–306. [Google Scholar] [CrossRef]
  3. Anil, A.P.; Ramesh, H. Analysis of climate trend and effect of land use land cover change on Harangi streamflow, South India: A case study. Sustain. Water Resour. Manag. 2017, 3, 257–267. [Google Scholar] [CrossRef]
  4. Lambin, E.F.; Geist, H.J.; Lepers, E. Dynamics of land-use and land-cover change in tropical regions. Annu. Rev. Environ. Resour. 2003, 28, 205–241. [Google Scholar] [CrossRef] [Green Version]
  5. Yan, Z.W.; Wang, J.; Xia, J.J.; Feng, J.M. Review of recent studies of the climatic effects of urbanization in China. Adv. Clim. Chang. Res. 2016, 7, 154–168. [Google Scholar] [CrossRef]
  6. Chen, Y.; Takeuchi, K.; Xu, C.; Chen, Y.; Xu, Z. Regional climate change and its effects on river runoff in the Tarim Basin, China. Hydrol. Process. 2006, 20, 2207–2216. [Google Scholar] [CrossRef]
  7. Kiparsky, M.; Joyce, B.; Purkey, D.; Young, C. Potential impacts of climate warming on water supply reliability in the Tuolumne and Merced river basins, California. PLoS ONE 2014, 9, e84946. [Google Scholar] [CrossRef]
  8. Javadinejad, S.; Hannah, D.; Ostad-Ali-Askari, K.; Krause, S.; Zalewski, M.; Boogaard, F. The Impact of Future Climate Change and Human Activities on Hydro-climatological Drought, Analysis and Projections: Using CMIP5 Climate Model Simulations. Water Conserv. Sci. Eng. 2019, 4, 71–88. [Google Scholar] [CrossRef]
  9. Touseef, M.; Chen, L.; Masud, T.; Khan, A.; Yang, K.; Shahzad, A.; Ijaz, M.W.; Wang, Y. Assessment of the Future Climate Change Projections on Streamflow Hydrology and Water Availability over Upper Xijiang River Basin, China. Appl. Sci. 2020, 10, 3671. [Google Scholar] [CrossRef]
  10. Touseef, M.; Chen, L.; Yang, K.; Chen, Y. Long-Term Rainfall Trends and Future Projections over Xijiang River Basin, China. Adv. Meteorol. 2020, 2020. Available online: https://doi.org/10.1155/2020/6852148. (accessed on 21 February 2021).
  11. Zhu, D.H.; Das, S.; Ren, Q.W. Hydrological Appraisal of Climate Change Impacts on the Water Resources of the Xijiang Basin, South China. Water 2017, 9, 793. [Google Scholar] [CrossRef] [Green Version]
  12. Zhang, Y.; You, Q.; Chen, C.; Ge, J. Impacts of climate change on streamflows under RCP scenarios: A case study in Xin River Basin, China. Atmos. Res. 2016, 178, 521–534. [Google Scholar] [CrossRef]
  13. Crosbie, R.S.; Pickett, T.; Mpelasoka, F.S.; Hodgson, G.; Charles, S.P.; Barron, O.V. An assessment of the climate change impacts on groundwater recharge at a continental scale using a probabilistic approach with an ensemble of GCMs. Clim. Chang. 2013, 117, 41–53. [Google Scholar] [CrossRef]
  14. Thompson, J.; Green, A.; Kingston, D.; Gosling, S. Assessment of uncertainty in river flow projections for the Mekong River using multiple GCMs and hydrological models. J. Hydrol. 2013, 486, 1–30. [Google Scholar] [CrossRef]
  15. Ficklin, D.L.; Stewart, I.T.; Maurer, E.P. Climate change impacts on streamflow and subbasin-scale hydrology in the Upper Colorado River Basin. PLoS ONE 2013, 8, e71297. [Google Scholar] [CrossRef] [PubMed]
  16. Kingston, D.; Thompson, J.R.; Kite, G. Uncertainty in climate change projections of discharge for the Mekong River Basin. Hydrol. Earth Syst. Sci. 2011, 15, 1459–1471. [Google Scholar] [CrossRef] [Green Version]
  17. Ren, G.; Zhou, Y.; Chu, Z.; Zhou, J.; Zhang, A.; Guo, J.; Liu, X. Urbanization effects on observed surface air temperature trends in North China. J. Clim. 2008, 21, 1333–1348. [Google Scholar] [CrossRef] [Green Version]
  18. Han, Z.; Long, D.; Fang, Y.; Hou, A.; Hong, Y. Impacts of climate change and human activities on the flow regime of the dammed Lancang River in Southwest China. J. Hydrol. 2019, 570, 96–105. [Google Scholar] [CrossRef]
  19. Tao, H.; Gemmer, M.; Bai, Y.; Su, B.; Mao, W. Trends of streamflow in the Tarim River Basin during the past 50years: Human impact or climate change? J. Hydrol. 2011, 400, 1–9. [Google Scholar] [CrossRef]
  20. Huang, Y.; Ma, Y.; Liu, T.; Luo, M. Climate Change Impacts on Extreme Flows Under IPCC RCP Scenarios in the Mountainous Kaidu Watershed, Tarim River Basin. Sustainability 2020, 12, 2090. [Google Scholar] [CrossRef] [Green Version]
  21. Chang, J.; Wang, Y.; Istanbulluoglu, E.; Bai, T.; Huang, Q.; Yang, D.; Huang, S. Impact of climate change and human activities on runoff in the Weihe River Basin, China. Quat. Int. 2015, 380, 169–179. [Google Scholar] [CrossRef]
  22. Gao, P.; Geissen, V.; Ritsema, C.; Mu, X.-M.; Wang, F. Impact of climate change and anthropogenic activities on stream flow and sediment discharge in the Wei River basin, China. Hydrol. Earth Syst. Sci. 2013, 17, 961. [Google Scholar] [CrossRef] [Green Version]
  23. Zuo, D.; Xu, Z.; Wu, W.; Zhao, J.; Zhao, F. Identification of streamflow response to climate change and human activities in the Wei River Basin, China. Water Resour. Manag. 2014, 28, 833–851. [Google Scholar] [CrossRef]
  24. Sun, G.; McNulty, S.G.; Moore Myers, J.A.; Cohen, E.C. Impacts of multiple stresses on water demand and supply across the Southeastern United States 1. JAWRA J. Am. Water Resour. Assoc. 2008, 44, 1441–1457. [Google Scholar] [CrossRef]
  25. Lee, K.S.; Chung, E.-S.; Kim, Y.-O. Integrated watershed management for mitigating streamflow depletion in an urbanized watershed in Korea. Phys. Chem. Earth Parts A/B/C 2008, 33, 382–394. [Google Scholar] [CrossRef]
  26. Qi, H.; Altinakar, M.S. A conceptual framework of agricultural land use planning with BMP for integrated watershed management. J. Environ. Manag. 2011, 92, 149–155. [Google Scholar] [CrossRef] [PubMed]
  27. Yates, D.; Sieber, J.; Purkey, D.; Huber-Lee, A. WEAP21—A demand-, priority-, and preference-driven water planning model: part 1: model characteristics. Water Int. 2005, 30, 487–500. [Google Scholar] [CrossRef]
  28. Vicuña, S.; Garreaud, R.D.; McPhee, J. Climate change impacts on the hydrology of a snowmelt driven basin in semiarid Chile. Clim. Chang. 2011, 105, 469–488. [Google Scholar] [CrossRef]
  29. Bhave, A.G.; Mishra, A.; Raghuwanshi, N.S. A combined bottom-up and top-down approach for assessment of climate change adaptation options. J. Hydrol. 2014, 518, 150–161. [Google Scholar] [CrossRef]
  30. Rochdane, S.; Reichert, B.; Messouli, M.; Babqiqi, A.; Khebiza, M.Y. Climate change impacts on water supply and demand in Rheraya Watershed (Morocco), with potential adaptation strategies. Water 2012, 4, 28–44. [Google Scholar] [CrossRef] [Green Version]
  31. Amin, A.; Iqbal, J.; Asghar, A.; Ribbe, L. Analysis of current and future water demands in the Upper Indus Basin under IPCC climate and socio-economic scenarios using a hydro-economic WEAP model. Water 2018, 10, 537. [Google Scholar] [CrossRef] [Green Version]
  32. Rajeevan, U.; Mishra, B.K. Sustainable management of the groundwater resource of Jaffna, Sri Lanka with the participation of households: Insights from a study on household water consumption and management. Groundw. Sustain. Dev. 2020, 10, 100280. [Google Scholar] [CrossRef]
  33. Liang, Z.M.; Tang, T.T.; Li, B.Q.; Liu, T.; Wang, J.; Hu, Y.M. Long-term streamflow forecasting using SWAT through the integration of the random forests precipitation generator: case study of Danjiangkou Reservoir. Hydrol. Res. 2018, 49, 1513–1527. [Google Scholar] [CrossRef] [Green Version]
  34. Easton, Z.M.; Fuka, D.R.; White, E.D.; Collick, A.S.; Biruk Ashagre, B.; McCartney, M.; Awulachew, S.B.; Ahmed, A.A.; Steenhuis, T.S. A multi basin SWAT model analysis of runoff and sedimentation in the Blue Nile, Ethiopia. Hydrol. Earth Syst. Sci. 2010, 14, 1827–1841. [Google Scholar] [CrossRef] [Green Version]
  35. Hao, L.; Sun, G.; Liu, Y.; Qian, H. Integrated modeling of water supply and demand under management options and climate change scenarios in Chifeng City, China. JAWRA J. Am. Water Resour. Assoc. 2015, 51, 655–671. [Google Scholar] [CrossRef]
  36. Lin, W.; Zhang, L.; Du, D.; Yang, L.; Lin, H.; Zhang, Y.; Li, J. Quantification of land use/land cover changes in Pearl River Delta and its impact on regional climate in summer using numerical modeling. Reg. Environ. Chang. 2009, 9, 75–82. [Google Scholar] [CrossRef]
  37. Seto, K.C.; Woodcock, C.; Song, C.; Huang, X.; Lu, J.; Kaufmann, R. Monitoring land-use change in the Pearl River Delta using Landsat TM. Int. J. Remote Sens. 2002, 23, 1985–2004. [Google Scholar] [CrossRef]
  38. Huang, Y.; Wang, H.; Xiao, W.H.; Chen, L.H.; Zhou, Y.Y.; Song, X.Y.; Wang, H.J. Contributions of climate change and anthropogenic activities to runoff change in the Hongshui River, Southwest China. IOP Conf. Ser. Earth Environ. Sci. 2018, 191, 012143. [Google Scholar] [CrossRef]
  39. Guo, H.; Hu, Q.; Jiang, T.J.J.o.H. Annual and seasonal streamflow responses to climate and land-cover changes in the Poyang Lake basin, China. J. Hydrol. 2008, 355, 106–122. [Google Scholar] [CrossRef]
  40. Huang, Y.; Wang, H.; Xiao, W.; Chen, L.-H.; Yan, D.-H.; Zhou, Y.-Y.; Jiang, D.-C.; Yang, M.-Z. Spatial and Temporal Variability in the Precipitation Concentration in the Upper Reaches of the Hongshui River Basin, Southwestern China. Adv. Meteorol. 2018, 2018, 4329757. [Google Scholar] [CrossRef] [Green Version]
  41. Zhang, S.; Lu, X.X.; Higgitt, D.L.; Chen, C.-T.A.; Han, J.; Sun, H. Recent changes of water discharge and sediment load in the Zhujiang (Pearl River) Basin, China. Glob. Planet Chang. 2008, 60, 365–380. [Google Scholar] [CrossRef]
  42. Fischer, T.; Gemmer, M.; Su, B.; Scholten, T.J.H.; Sciences, E.S. Hydrological long-term dry and wet periods in the Xijiang River basin, South China. J. Hydrol. 2013, 17, 135–148. [Google Scholar] [CrossRef] [Green Version]
  43. (CGIAR-CSI), C. Shuttle Radar Topography Mission Digital Elevation Model (SRTM-DEM). Available online: http://srtm.csi.cgiar.org/ (accessed on 12 July 2020).
  44. FAO. Food and Agriculture Organization (FAO). Available online: http://www.fao.org/nr/land/soils/digital-soil-map-of-the-world/en/ (accessed on 12 July 2020).
  45. European Space Agency, Climate Change Initiative CCI-LC. Available online: http://maps.elie.ucl.ac.be/CCI/viewer/download.php (accessed on 12 July 2020).
  46. Githui, F.; Gitau, W.; Mutua, F.; Bauwens, W. Climate change impact on SWAT simulated streamflow in western Kenya. Int. J. Climatol. A J. R. Meteorol. Soc. 2009, 29, 1823–1834. [Google Scholar] [CrossRef]
  47. Hempel, S.; Frieler, K.; Warszawski, L.; Schewe, J.; Piontek, F.J.E.S.D. A trend-preserving bias correction–the ISI-MIP approach. Earth Syst. Dyn. 2013, 4, 219–236. [Google Scholar] [CrossRef] [Green Version]
  48. Vaghefi, S.A.; Abbaspour, K. Climate Change Toolkit (CCT) User Guide. 2019. Available online: https://www.researchgate.net/publication/318299245_A_toolkit_for_climate_change_analysis_and_pattern_recognition_for_extreme_weather_conditions_-_Case_study_California-Baja_California_Peninsula (accessed on 21 February 2021).
  49. Vaghefi, S.A.; Keykhai, M.; Jahanbakhshi, F.; Sheikholeslami, J.; Ahmadi, A.; Yang, H.; Abbaspour, K.C. The future of extreme climate in Iran. Sci. Rep. 2019, 9, 1464. [Google Scholar] [CrossRef] [Green Version]
  50. Abbaspour, K.C.; Faramarzi, M.; Ghasemi, S.S.; Yang, H. Assessing the impact of climate change on water resources in Iran. Water Resour. Res. 2009, 45, 10. [Google Scholar] [CrossRef] [Green Version]
  51. WCRP’s Working Group on Coupled Modelling (WGCM). Available online: https://pcmdi.llnl.gov/mips/cmip5/ (accessed on 12 July 2020).
  52. Arnold, J.G.; Moriasi, D.N.; Gassman, P.W.; Abbaspour, K.C.; White, M.J.; Srinivasan, R.; Santhi, C.; Harmel, R.; Van Griensven, A.; Van Liew, M.W. SWAT: Model use, calibration, and validation. Trans. Asabe 2012, 55, 1491–1508. [Google Scholar] [CrossRef]
  53. Rostamian, R.; Jaleh, A.; Afyuni, M.; Mousavi, S.F.; Heidarpour, M.; Jalalian, A.; Abbaspour, K.C. Application of a SWAT model for estimating runoff and sediment in two mountainous basins in central Iran. Hydrol. Sci. J. 2010, 53, 977–988. [Google Scholar] [CrossRef]
  54. Wang, Y.J.; Meng, X.Y.; Liu, Z.H.; Ji, X.N. Snowmelt Runoff Analysis under Generated Climate Change Scenarios for the Juntanghu River Basin, in Xinjiang, China. Tecnología y Ciencias del Agua 2016, 7, 41–54. [Google Scholar]
  55. Dhami, B.; Himanshu, S.K.; Pandey, A.; Gautam, A.K. Evaluation of the SWAT model for water balance study of a mountainous snowfed river basin of Nepal. Environ. Earth Sci. 2018, 77, 1–20. [Google Scholar] [CrossRef]
  56. Abrishamchi, A.; Alizadeh, H.; Tajrishy, M.; Abrishamchi, A. Water resources management scenario analysis in Karkheh River Basin, Iran, using WEAP model. Hydrol. Sci. Technol. 2007, 13, 1. [Google Scholar]
  57. Hamlat, A.; Errih, M.; Guidoum, A. Simulation of water resources management scenarios in western Algeria watersheds using WEAP model. Arab. J. Geosci. 2012, 6, 2225–2236. [Google Scholar] [CrossRef]
  58. Esteve, P.; Varela-Ortega, C.; Blanco-Gutiérrez, I.; Downing, T.E. A hydro-economic model for the assessment of climate change impacts and adaptation in irrigated agriculture. Ecol. Econ. 2015, 120, 49–58. [Google Scholar] [CrossRef] [Green Version]
  59. Nash, J.E.; Sutcliffe, J.V. River flow forecasting through conceptual models part I—A discussion of principles. J. Hydrol. 1970, 10, 282–290. [Google Scholar] [CrossRef]
  60. Gupta, H.V.; Sorooshian, S.; Yapo, P.O. Status of automatic calibration for hydrologic models: Comparison with multilevel expert calibration. J. Hydrol. Eng. 1999, 4, 135–143. [Google Scholar] [CrossRef]
  61. Collins, M.; Knutti, R.; Arblaster, J.; Dufresne, J.L.; Fichefet, T.; Friedlingstein, P.; Gao, X. Long-term Climate Change: Projections, Commitments and Irreversibility. In Geological and Atmospheric Sciences Reports; 2013; Available online: https://www.ipcc.ch/site/assets/uploads/2018/02/WG1AR5_Chapter12_FINAL.pdf (accessed on 21 February 2021).
  62. Matchett, E.L.; Fleskes, J.P. Projected impacts of climate, urbanization, water management, and wetland restoration on waterbird habitat in California’s Central Valley. PLoS ONE 2017, 12, e0169780. [Google Scholar] [CrossRef] [PubMed]
  63. Null, S.E.; Viers, J.H.; Mount, J.F. Hydrologic response and watershed sensitivity to climate warming in California’s Sierra Nevada. PLoS ONE 2010, 5, e9932. [Google Scholar] [CrossRef] [Green Version]
  64. Kou, L.; Li, X.; Lin, J.; Kang, J. Simulation of Urban Water Resources in Xiamen Based on a WEAP Model. Water 2018, 10, 732. [Google Scholar] [CrossRef] [Green Version]
  65. Asghar, A.; Iqbal, J.; Amin, A.; Ribbe, L. Integrated hydrological modeling for assessment of water demand and supply under socio-economic and IPCC climate change scenarios using WEAP in Central Indus Basin. J. Water Supply Res. Technol. Aqua 2019, 68, 136–148. [Google Scholar] [CrossRef] [Green Version]
  66. Adgolign, T.B.; Rao, G.V.R.S.; Abbulu, Y. WEAP modeling of surface water resources allocation in Didessa Sub-Basin, West Ethiopia. Sustain. Water Resour. Manag. 2016, 2, 55–70. [Google Scholar] [CrossRef] [Green Version]
  67. Khalil, A.; Rittima, A.; Phankamolsil, Y. The projected changes in water status of the Mae Klong Basin, Thailand, using WEAP model. Paddy Water Environ. 2018, 16, 439–455. [Google Scholar] [CrossRef]
  68. Wu, Z.; Lin, Q.; Lu, G.; He, H.; Qu, J.J. Analysis of hydrological drought frequency for the Xijiang River Basin in South China using observed streamflow data. Nat. Hazards 2015, 77, 1655–1677. [Google Scholar] [CrossRef]
  69. Li, X.; Zhao, Y.; Shi, C.; Sha, J.; Wang, Z.-L.; Wang, Y. Application of Water Evaluation and Planning (WEAP) model for water resources management strategy estimation in coastal Binhai New Area, China. Ocean Coast. Manag. 2015, 106, 97–109. [Google Scholar] [CrossRef]
  70. Faiz, M.A.; Liu, D.; Fu, Q.; Uzair, M.; Khan, M.I.; Baig, F.; Li, T.; Cui, S. Stream flow variability and drought severity in the Songhua River Basin, Northeast China. Stoch. Environ. Res. Risk Assess. 2018, 32, 1225–1242. [Google Scholar] [CrossRef]
  71. Wang, J.-X.; Huang, J.-K.; Yan, T.-T. Impacts of Climate Change on Water and Agricultural Production in Ten Large River Basins in China. J. Integr. Agric. 2013, 12, 1267–1278. [Google Scholar] [CrossRef]
  72. Xiong, W.; Holman, I.; Lin, E.; Conway, D.; Jiang, J.; Xu, Y.; Li, Y. Climate change, water availability and future cereal production in China. Agric. Ecosyst. Environ. 2010, 135, 58–69. [Google Scholar] [CrossRef]
Figure 1. A schematic diagram showing the configuration of the Water Evaluation and Planning (WEAP) model in Hongshui River Basin (HRB).
Ijgi 10 00298 g001
Figure 2. Model flowchart that illustrates the integration of the Soil and Water Assessment Tool (SWAT) and Water Evaluation and Planning (WEAP) models.
Ijgi 10 00298 g002
Figure 3. Observed vs. simulated streamflow (monthly) of the Hongshui River Basin during calibration and validation processes: (a) Tianer Station (b) Qianjiang Station.
Ijgi 10 00298 g003
Figure 4. Rainfall (secondary axis) and discharge (primary axis) projections for the period of 2020–2050 in the Hongshui River Basin (HRB).
Ijgi 10 00298 g004
Figure 5. The Total water demand for the baseline (2010) scenario in the Hongshui River Basin (HRB).
Ijgi 10 00298 g005
Figure 6. Observed vs. modeled water demand for the current year 2010.
Ijgi 10 00298 g006
Figure 7. Total water demand for the reference scenario (2011–2050) in the Hongshui River Basin (HRB).
Ijgi 10 00298 g007
Figure 8. Future projections of the total water demand in the HRB under the reference, high population growth, and negative population growth scenarios for the period 2010–2050.
Ijgi 10 00298 g008
Figure 9. Scenario comparison of the total water demand in the HRB under the reference and deforestation scenarios for the period 2010–2050.
Ijgi 10 00298 g009
Figure 10. Annual water demand projections for reference and industrial growth scenarios (2010–2050).
Ijgi 10 00298 g010
Figure 11. The total water demand for the reference scenario and low climate change emission (RCP-2.6) scenario.
Ijgi 10 00298 g011
Figure 12. The total water demand of each demand site for the reference scenario and medium climate change emission (RCP-4.5) scenario.
Ijgi 10 00298 g012
Figure 13. The total water demand for the reference scenario and high climate change emission (RCP-8.5) scenario.
Ijgi 10 00298 g013
Figure 14. Total water demand comparison for each demand site under climate change and reference scenario.
Ijgi 10 00298 g014
Figure 15. (a) Annual unmet total water demand (b) sector unmet water demand under high climate change emission scenario RCP-8.5.
Ijgi 10 00298 g015
Table 1. List of datasets used in the model simulation, with descriptions and sources.
Data TypeResolutionSource
Digital Elevation Model90 mShuttle Radar Topography Mission Digital Elevation Model (SRTM-DEM) http://srtm.csi.cgiar.org/ (accessed on 21 February 2021) [43].
Soil Data5 KmFAO-UNESCO Global Soil Map
http://www.fao.org/nr/land/soils/digital-soil-map-of-the-world/en/ (accessed on 21 February 2021) [44].
Land use300 mLULC 2015 European Space Agency CCI-LC
http://maps.elie.ucl.ac.be/CCI/viewer/download.php (accessed on 21 February 2021) [45].
Climate(Meteorological Data) Global Climate Models (GCMs) CMIP5
https://pcmdi.llnl.gov/mips/cmip5/ [51]
Observed Precipitation and Temperature Data
National Meteorological Information Centre (NMIC) of the China Meteorological Administration (CMA)
Observed Discharge Data
Table 2. Performance criteria of monthly simulated and observed streamflow at Qianjiang hydrological station.
ModelIndicesR2NSEPBIAS
SWATCalibration0.800.795.8
Validation0.790.814.33
WEAPCalibration0.820.78−8.6
Validation0.720.709.3
Table 3. Performance criteria of monthly simulated and observed streamflow at Tianer hydrological station.
ModelIndicesR2NSEPBIAS
SWATCalibration0.780.70−3.6
Validation0.750.807.8
WEAPCalibration0.690.62−10.2
Validation0.710.584.8
Table 4. Projected water demand (million cubic meters, Mm3) for each sector for the reference scenario (2011–2050) based on the current account (2010).
YearAgricultureForestry, Animal Husbandry and LivestockDomesticIndustriesTotal Water Demand
20102178.8291.5309.41375.04154.7
20152129.1330.9381.71462.34304.2
20202080.5375.7471.01555.34482.7
20252033.1426.6581.01654.14695.0
20301986.8484.3716.81759.34947.4
20351941.5549.9884.41871.15247.0
20401897.3624.41091.11990.05602.9
20451854.0708.91346.12116.56025.6
20501811.8804.81660.72251.06528.5
Table 5. Annual water demand (Mm3) for forests, animal husbandry and livestock sector in reference and deforestation scenarios 2010–2050.
Scenario201020152020202520302035204020452050
Deforestation Scenario309.44363.06425.96499.76586.34687.92807.10946.931110.99
Reference309.44381.77471.00581.07716.88884.421091.121346.131660.74
Publisher’s Note: MDPI stays neutral with regard to jurisdictional claims in published maps and institutional affiliations.

