Article

Surveying Reality (SurReal): Software to Simulate Surveying in Virtual Reality

1
Department of Surveying Engineering, Pennsylvania State University, Wilkes-Barre Campus, Dallas, PA 18612, USA
2
Department of Engineering, Pennsylvania State University, Wilkes-Barre Campus, Dallas, PA 18612, USA
3
Department of Computer Science and Engineering, Pennsylvania State University, University Park, State College, PA 16801, USA
*
Author to whom correspondence should be addressed.
ISPRS Int. J. Geo-Inf. 2021, 10(5), 296; https://doi.org/10.3390/ijgi10050296
Submission received: 2 March 2021 / Revised: 21 April 2021 / Accepted: 1 May 2021 / Published: 4 May 2021

Abstract

:
Experiential learning through outdoor labs is an integral component of surveying education. Cancelled labs as a result of weather, the inability to visit a wide variety of terrain location, recent distance education requirements create significant instructional challenges. In this paper, we present a software solution called surveying reality (SurReal); this software allows for students to conduct immersive and interactive virtual reality labs. This paper discusses the development of a virtual differential leveling lab. The developed software faithfully replicates major steps followed in the field and any skills learned in virtual reality are transferable in the physical world. Furthermore, this paper presents a novel technique for leveling multi-legged objects like a tripod on variable terrain. This method relies solely on geometric modeling and does not require physical simulation of the tripod. This increases efficiency and ensures that the user experiences at least 60 frames per second, thus reducing lagging and creating a pleasant experience for the user. We conduct two leveling examples, a three-benchmark loop and a point-to-point leveling line. Both surveys had a misclosure of 1 mm due to observational random errors, which demonstrated that leveling can be conducted with mm-level precision, much like in the physical world.

1. Introduction

Virtual reality (VR) in an educational setting reduces passive learning that students often experience in the classroom. Instead, students using VR engage in active learning, which is more immersive and engaging [1]. VR can be used to address the practical challenges in education, such as physically inaccessible sites, limitations due to liability or hazards, and the high costs associated with site visits [2]. VR has been used as an educational and instructional tool as early as the 1980s (e.g., flight simulations) [3,4]. In higher education, VR was introduced in the 1990s; however, limitations such as high purchase and maintenance cost, physical and psychological discomfort of the users, and poor virtual environment design were the main reasons for prohibiting widespread dissemination [4]. The reduction in the cost of computer and VR hardware, increase of computer power, and photorealistic computer graphics allowed a rapid rise in desktop-based virtual technology in education. However, a major drawback of traditional application is the low level of immersion as the user interacts with the virtual environment via a standard computer monitor, mouse, and keyboard. This limits the presence, experience, and engagement of the user [5]. Several studies for various purposes, such as U.S. army training, medicine, engineering, and elementary education, have found that immersive VR leads to increased learning [6,7,8,9]. In addition, Patel et al. [10] found that, in physical tasks, participants learn more in immersive VR than using 2D video systems. In contrast, other studies found that immersive VR had no significant effect on learning [11,12]. Immersive VR has a significant advantage over desktop-based systems when teaching topics that require special reasoning [13,14,15,16]. The main two types of immersive VR are (i) cave automatic virtual environments, where the walls of a room are covered with displays and the user wears 3D glasses; and (ii) head mounted displays (HMDs), where the user wears a display device to see the virtual environment and touch controllers or gloves to interact with it. The high cost of the former prohibits its widespread use [2]. Only in recent years, since the founding of Oculus in 2012, has widespread VR accessibility become feasible with a large reduction in price and an improved user experience. This has created the opportunity for application in engineering education and related disciplines. For example, immersive VR has supported engineering design [17] in construction engineering. VR has been used for visualization, safety training, training of the use of equipment such as cranes [18], geohazard visualization and assessment [19], simulating of a marine engine room for training marine engineers [20], and training for beginners on radiation shielding in nuclear engineering [21]. Furthermore, immersive VR has found applications in geography, geosciences, and spatial sciences [22,23]. Some recent examples include the use of VR to conduct virtual field trips to outcrop sites and take measurements about the rock characteristics (e.g., thickness or rocks layers) [24,25], studying the internal system of volcanos [26], and a serious game of a moon base to motivate and support space research [27].
Previous virtual implementations of surveying tasks were desktop-based [28,29,30,31]. For instance, Dib et al. [28] created a differential leveling lab in desktop-based VR to assist student comprehension of concepts and practices. Differential leveling is the process of finding elevation differences between points [32]. This method can be used to establish new vertical control points in surveying. The authors found that virtual learning environments aid students’ declarative and procedural knowledge, which shows great potential of VR technology for surveying engineering education. However, student answers to open-ended questions revealed the limitation of non-immersive VR, as students found that navigation in flying motion was difficult and they would prefer a camera attached at the eye level of the character [28]. Another desktop-based attempt was SimuSurvey and SimuSurvey X, developed by [29,30,31], which simulated manipulation of surveying instruments. Furthermore, the software simulated instrument errors and their interaction, which aided student comprehension of instrument operation and systematic erratic behavior [33]. Assessment of the software in surveying education showed an improvement of student academic performance [34]; however, some of the identified limitations were the inability to read measured data and decision-making of surveying procedures in a 3D environment that includes terrain constraints [34]. In addition, the desktop-based environment created challenges in instrument operation and changing view angles. This is because desktop-based environments cannot mimic hand movement and real instrument operation. The user needs to switch between several viewpoints to navigate through the virtual environment; this is unnatural and cumbersome, reducing realism and the immersion of the virtual lab. Other simpler attempts include software for training students on how to read a leveling rod [35] and control point selection for terrain modeling [36]. In surveying engineering, students must operate complicated instruments with several components. These tasks require hand-eye coordination as well as 3D spatial awareness. The above examples demonstrate the limitations of desktop-based implementation of VR and the need to move into immersive implementations to create a sense of naturalism in navigation and movement. Immersive VR has only recently found its way into surveying engineering [37,38,39]. Bolkas and Chiampi [37] proposed that immersive VR labs can be used to address challenges in first year surveying engineering education related to cancellation of outdoor labs as a result of weather (rain and snow) and the inability to conduct labs in various terrains and sites (e.g., different terrains, cities, and construction sites). The recent coronavirus pandemic pushes universities to remote learning, but also opens the door for implementation of novel remote learning methods. However, there are still some important barriers related to hardware cost to allow for the widespread application of immersive VR for remote learning. Therefore, desktop-based VR is still the most suitable platform for remote learning purposes of surveying labs. The first results in Bolkas et al. [38] of an immersive and interactive leveling lab (a leveling loop) were promising, but despite the positives, the main drawbacks of immersive VR are symptoms of nausea and dizziness for novice users. Their effect tends to subside with time. Levin et al. [39] is another example of immersive VR implementation in surveying. The authors created a topographic exercise to generate contours in a simulated terrain of varying complexity. The contours created by students were compared with reference ones, showing practical aspects of terrain modeling. Their example demonstrates the value of VR to address education challenges; however, the implementation was simple, missing several important parts of the fieldwork, such as centering the tripod, work with tribrach screws, and instrument leveling.
To address these educational challenges, we have developed a virtual reality software solution named SurReal—surveying reality. This software simulates surveying labs in an immersive and interactive virtual environment. The application replicates, to a high degree of fidelity, a differential level instrument, but can also incorporate additional instruments, a variety of terrains, and can be used in a variety of surveying scenarios.
This paper focuses on the technical aspects of the software and the main objective is to present and discuss the main software features, the encountered challenges, and the methods developed to overcome them. Of note is our novel technique that was developed for the positioning of complex objects (like a tripod) on complex surfaces in VR with low computational load. Complex objects are becoming ever present as the intricacy of simulations and games is increasing; therefore, it is important to maintain a low computational load that will not affect the performance of the virtual simulation. This paper is structured into separate sections pertinent to the main features of the software. We then provide demonstrations of our virtual differential leveling labs, i.e., a three-benchmark leveling loop and a point-to-point leveling line. The final section summarizes the main conclusions of this paper and discusses remarks for future work.

2. Materials and Methods

2.1. Development Platform, Hardware, and User Interface

The software is in continuous development using an Agile Software Development methodology. Features and bugs are tracked via Microsoft Planner and tasks are distributed during frequent scrum meetings. A private GitHub code repository facilitates development and versioning. New features are developed in branches before being merged into the master after passing testing. Alpha testing is routinely conducted by team members. Issues and changes are then added to Microsoft Planner before being addressed at the next scrum meeting. Occasionally, surveying students, from outside of the project, use the software and act as a small-scale beta test. This methodology allows us to quickly implement changes and improve the software.
To choose a development platform, we compared the Unity game engine with the Unreal game engine. Both game engines support VR development and have similar feature sets. Unity uses C# and Unreal uses C++. Although both languages are similar, there were significant advantages to C#, such as allowing for faster iteration and being easier to learn. Furthermore, Unity 3D has a more active development community, as it is the most popular game engine for educational and training VR applications [40]. With respect to hardware, we considered the Oculus Rift and HTC Vive. Price points between the Oculus Rift and HTC Vive were similar. We decided on the Oculus Rift after examining both software development kits (SDKs), looking at the documentation, and performing a trial run with both devices. The system requirements of the software are based on the system requirements of Oculus Rift, which can be found in [41].
Interaction with virtual objects can be broken down into two categories: (i) selection and (ii) grabbing. The interaction is controlled through controllers (Figure 1).
Grabbing: This is where the user can physically grab the object by extending their hand, holding it, and dropping it in a new position. This interaction is very intuitive and feels fluid even for new users with no experience in VR (see Figure 1).
Selection: In the real-world, surveyors must adjust tripod legs, screws, and knobs by making fine movements using their fingers. Such movements are difficult to simulate in VR because of tracking limitations; thus, a selection and menu method was developed. Oculus provides a very basic form of user interface (UI) control; we, therefore, built a custom UI system to work seamlessly in VR. This system uses a pointer to select UI elements and interact with them. With a basic piece of equipment, the entire object is selected no matter what part the user selects. With more complex objects, which are broken down into standalone individual components, the user can select them and interact with them separately. When the user has an object selected, a menu for that object will appear. We handle menus as a screen on a virtual tablet held in the player’s nondominant hand.
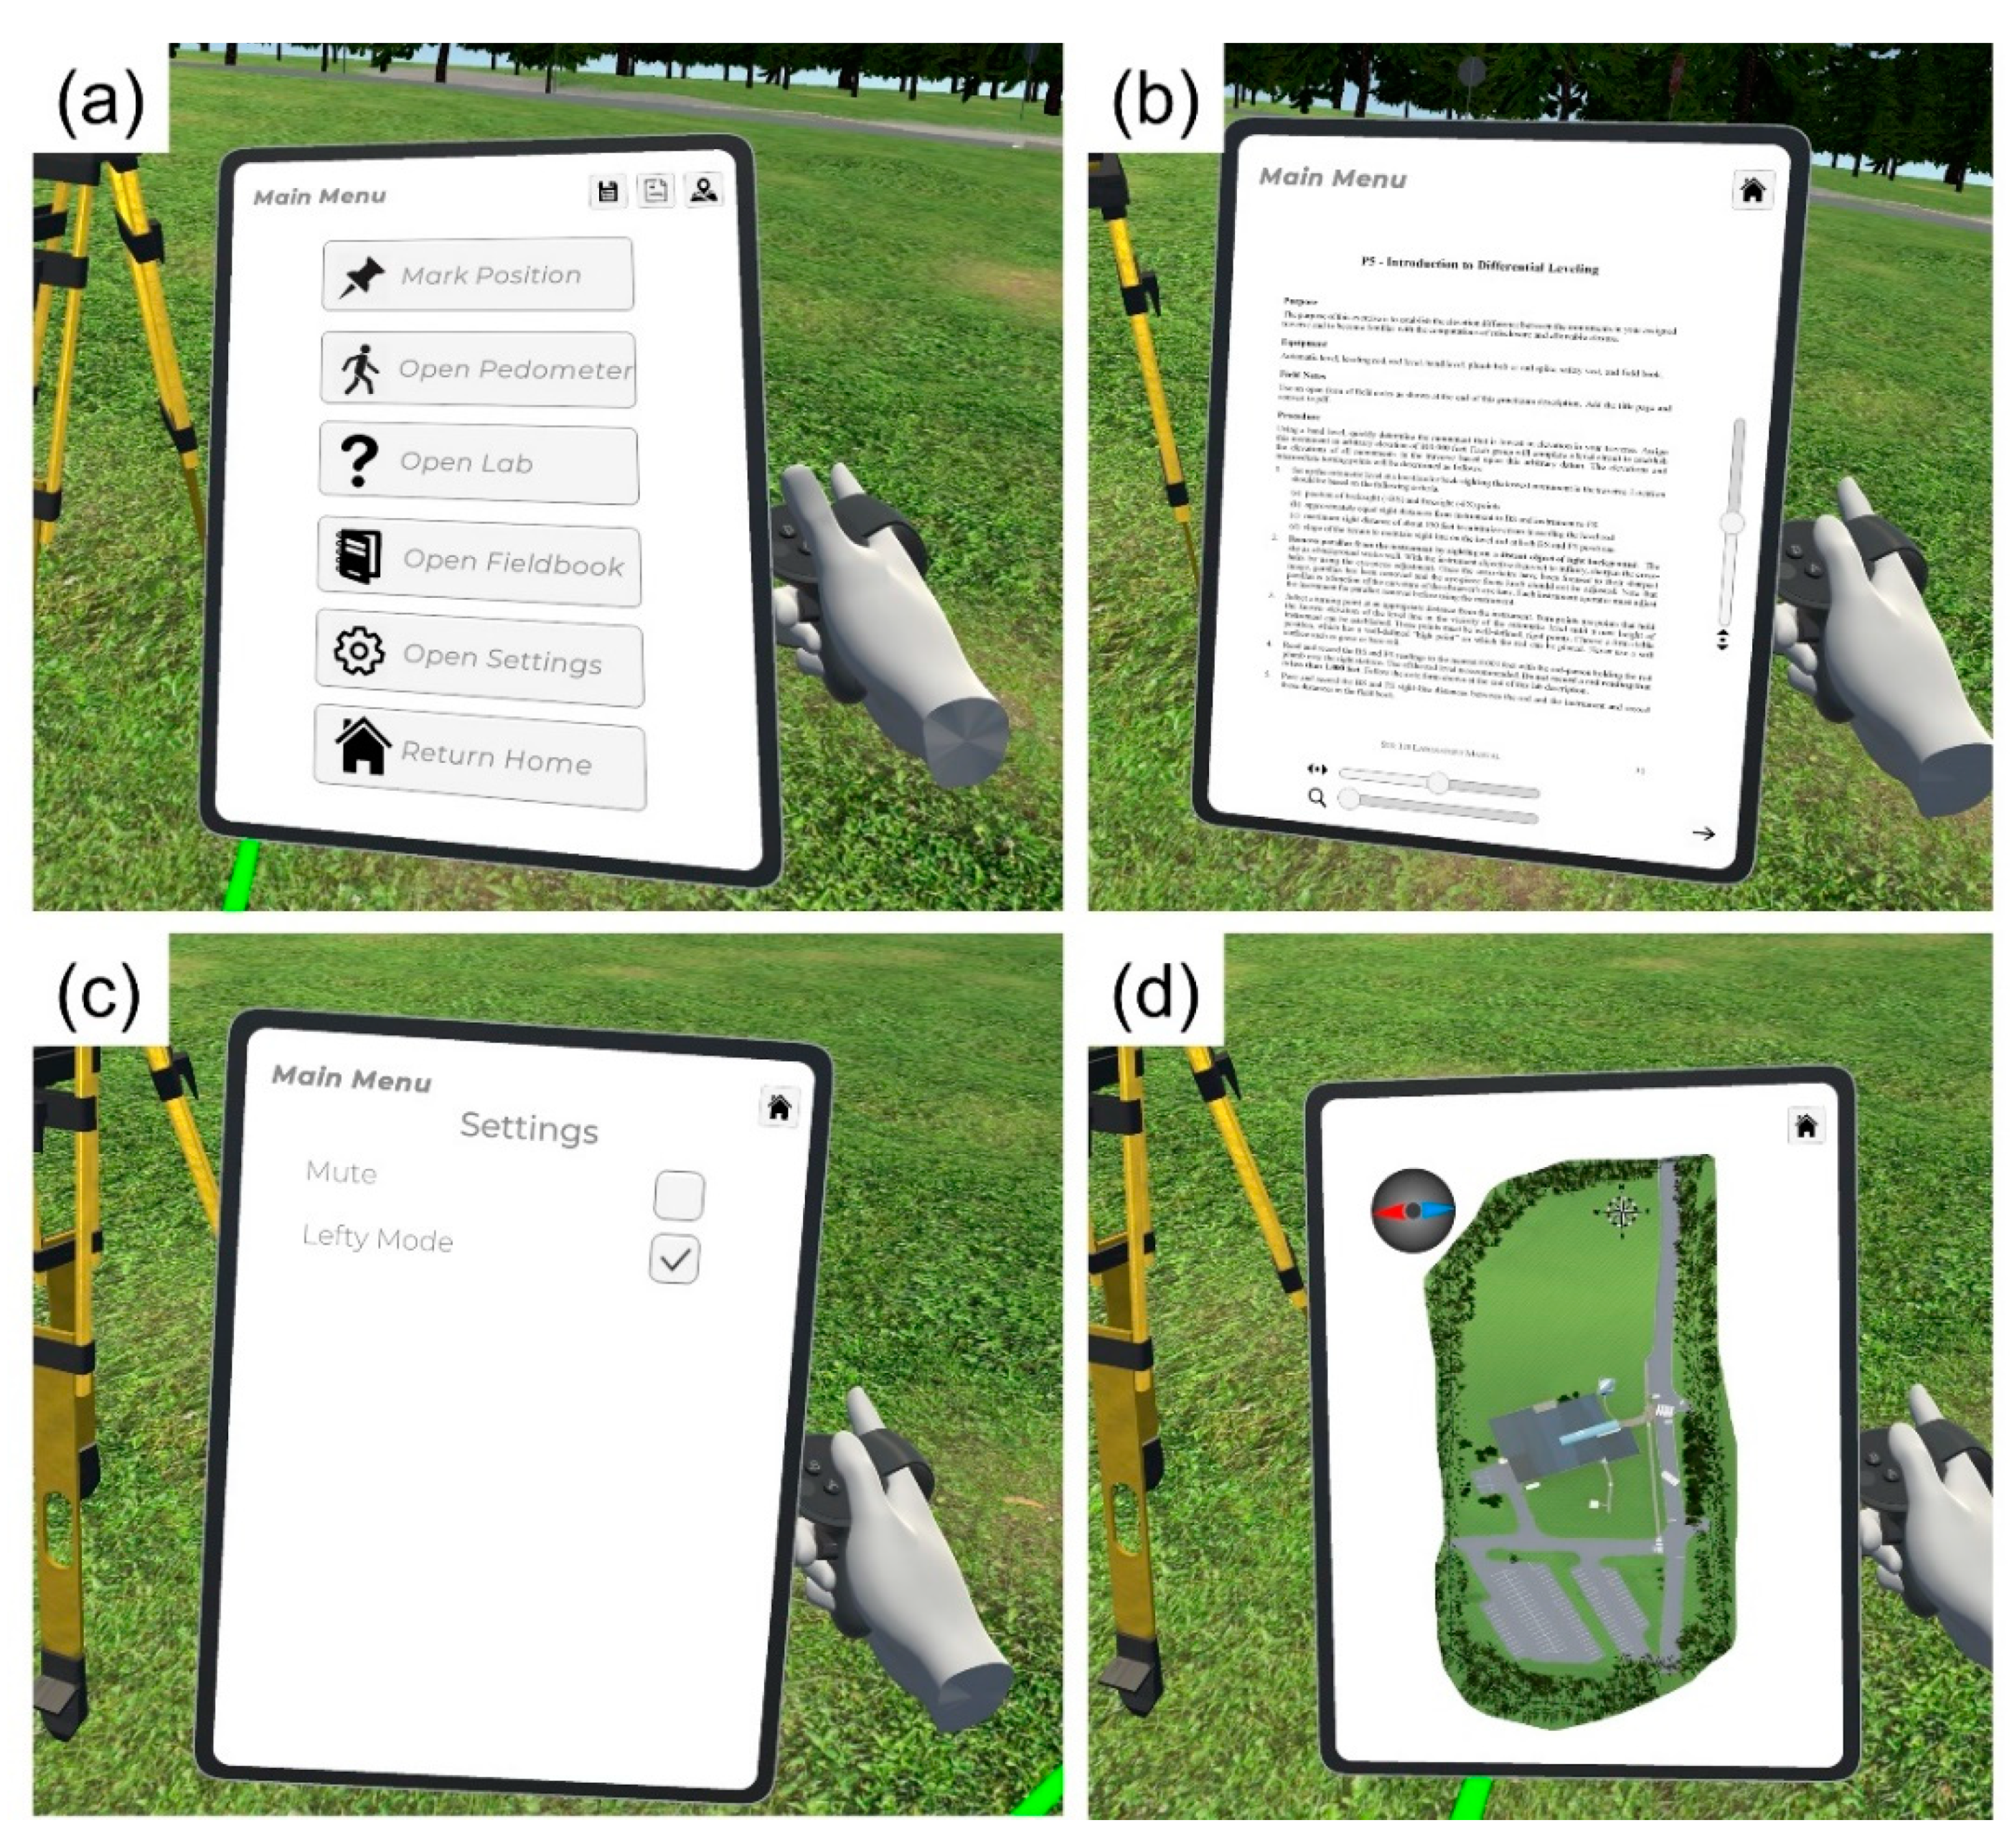
In the main menu of the virtual tablet (Figure 2a), the user can access basic software functions that are useful for the virtual labs: marking the position, which drops a temporary point; open the pedometer for counting paces; and open the lab instructions, which opens a PDF with lab instructions for students (Figure 2b). Students can open the fieldbook to access their notes and make modifications. The “open settings” option allows students to mute ambient sounds of the virtual environment. From settings, the students can select the lefty mode, switching the selection pointer to their left hand (Figure 2c). At the top right corner of the main menu, there are three additional options, i.e., save progress, export a lab report in PDF, and an option to open a map of the area (Figure 2d).

2.2. The Ready Room and Virtual Environment

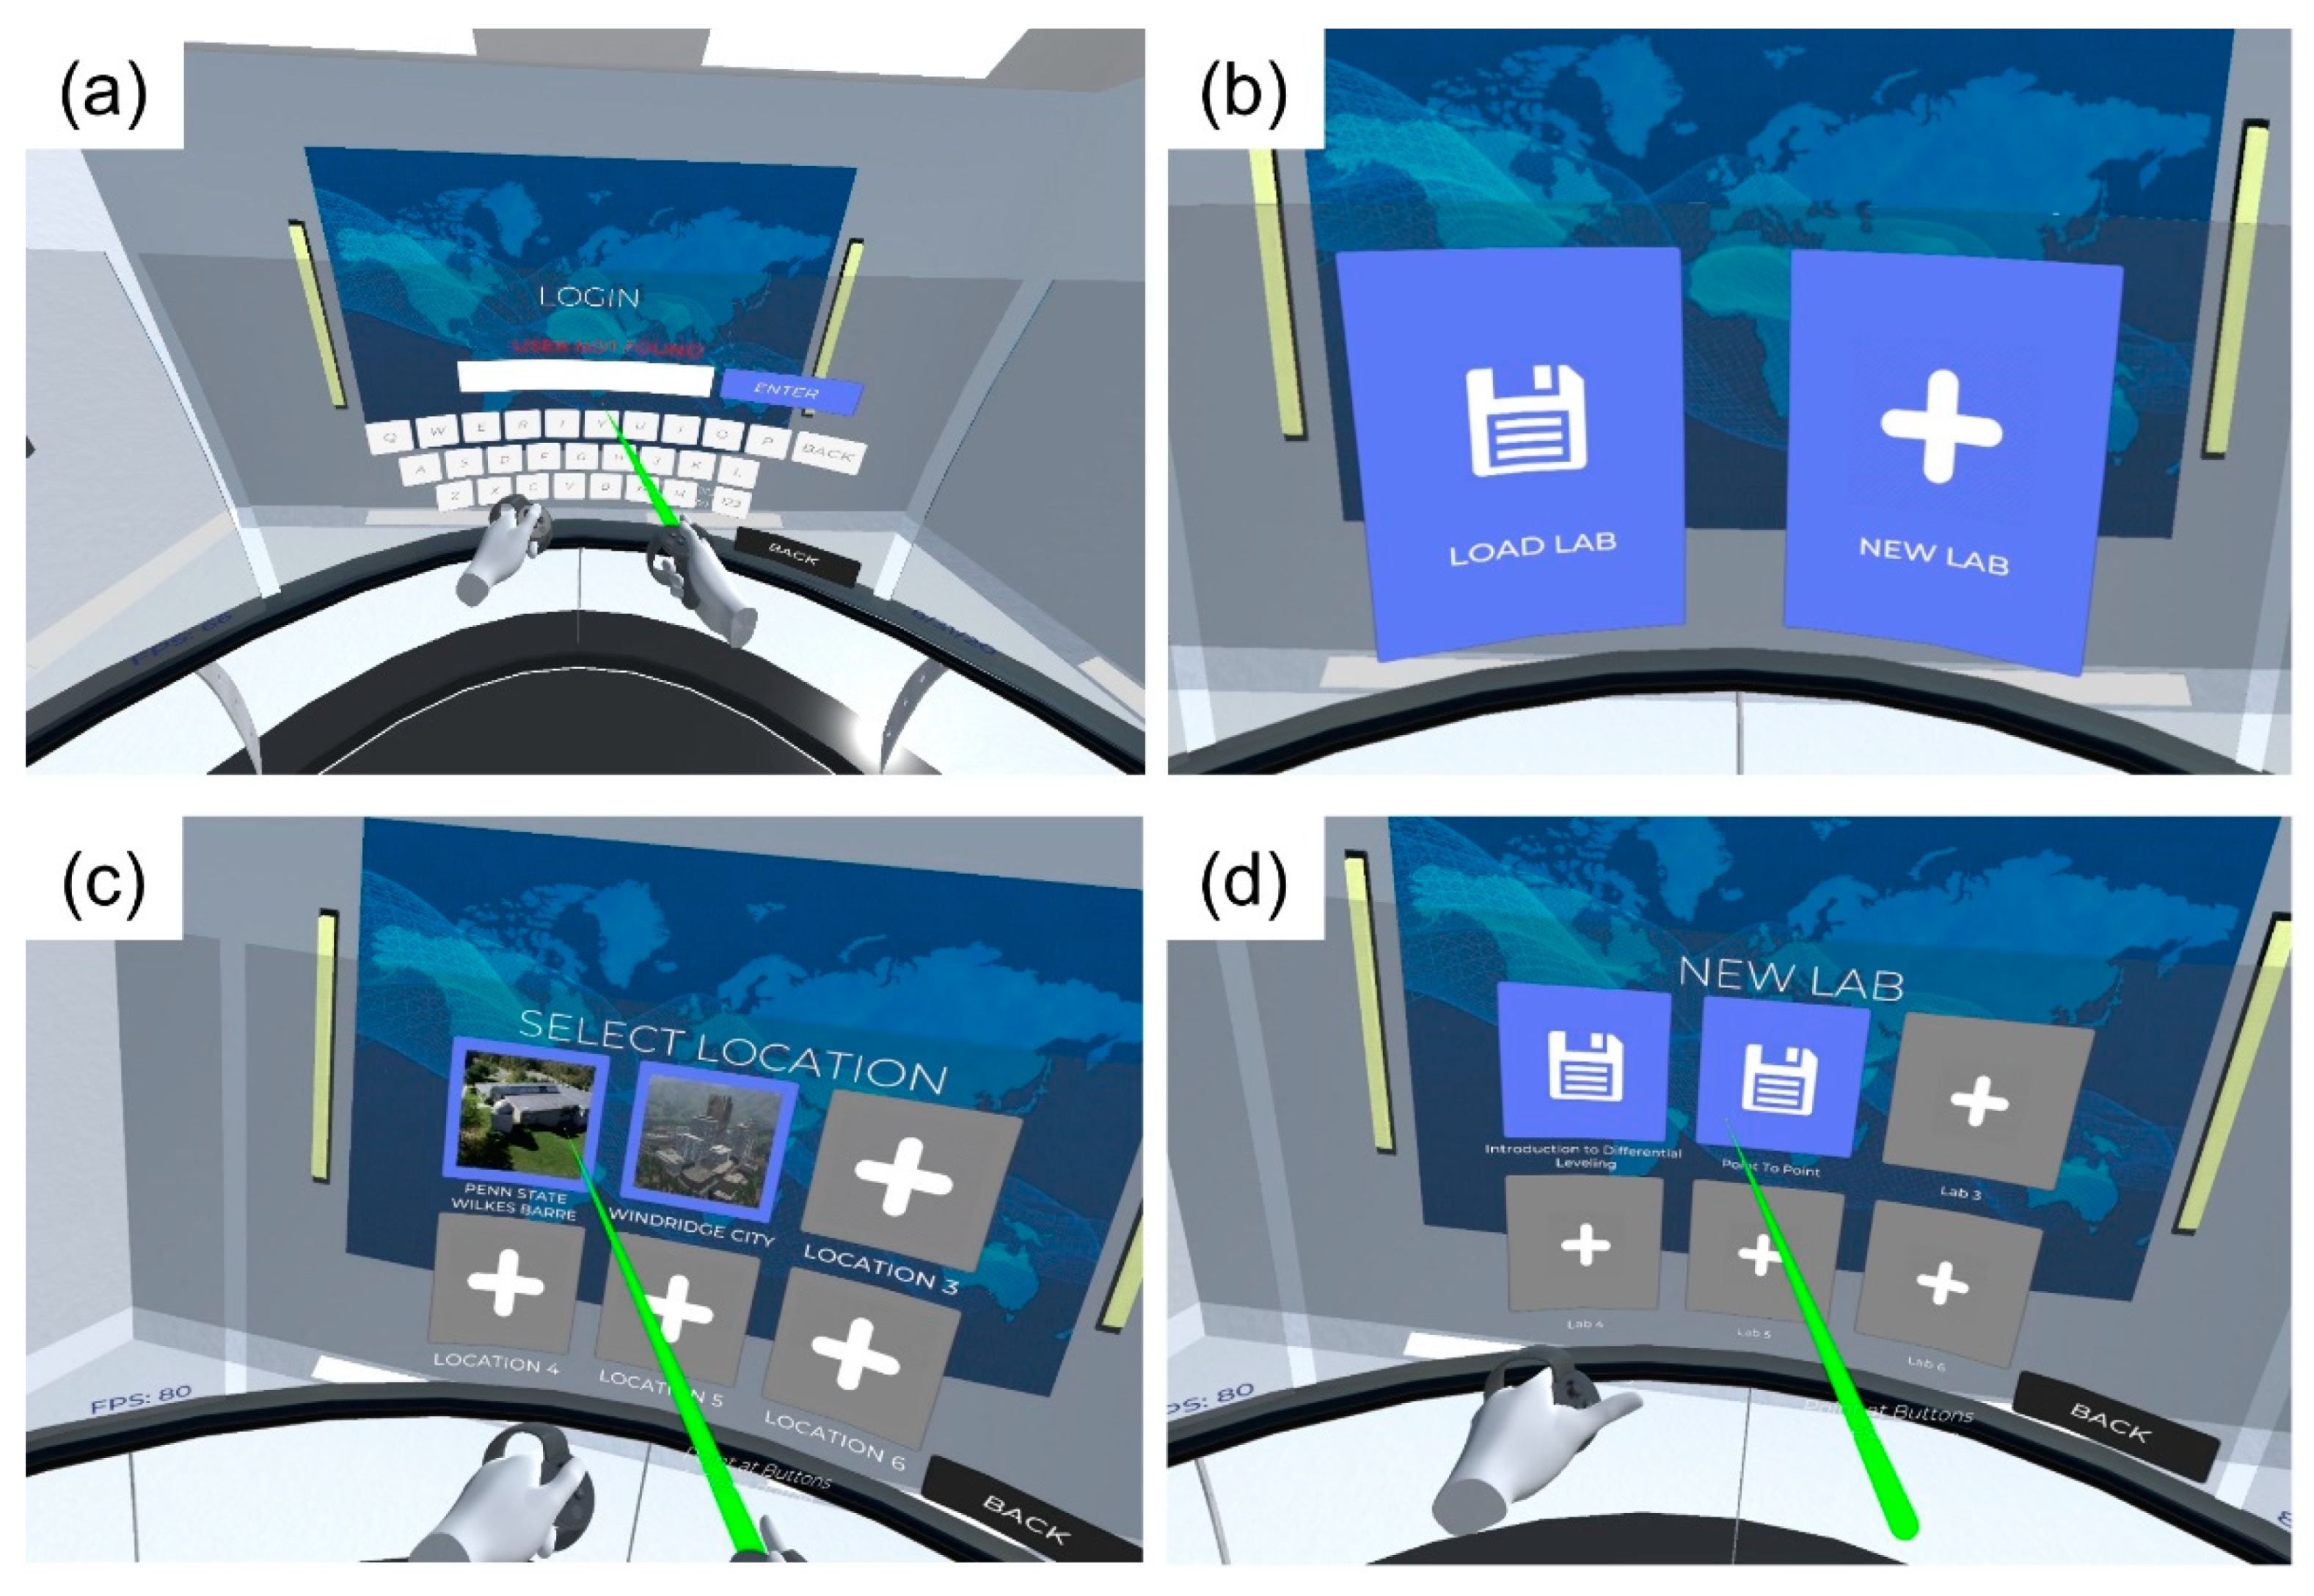
When students start the software application, they are brought into a virtual environment we call the “ready room” (Figure 3). Here, students can log into their account to access the software (Figure 3a). The login options were included to authenticate and authorize the users. In addition, this enables a student to start a lab on one machine and complete it on another (Figure 3b). Through the ready room, students can choose which virtual environment and which lab that they want to use. Currently, we have two leveling labs, the first is a three-benchmark loop and the second is a level line. Our future work will expand the available labs to include additional instruments (e.g., total stations and global navigation satellite system) and more tasks (e.g., setting control and collecting data for topographic mapping).
An integral component of any VR software, game, or application is the virtual environment. Through the environment, users can navigate, explore, and experience the main software features. In VR, the environment is key to create a feeling of “being there”. The first environment we created was a part of the Penn State Wilkes-Barre campus, where surveying students often complete their physical labs. This served as validation for using point cloud technologies, namely aerial photogrammetry from small unmanned aerial systems (sUAS) and terrestrial laser scanning, to create a realistic environment (terrain and objects) [42]. Such technologies capture geometric information at the few cm-level, thus allowing for accurate geometric representation of real scenes in VR. Point cloud technologies have been used to create virtual environments in several disciplines such as in gaming and filmmaking, preservation of cultural heritage, and geoscience for field trips [43,44,45,46,47,48]. Another essential aspect of virtual environments is textures, as they give a sense of realism. To create realistic textures, we used close-up pictures and applied them as materials on the 3D objects [
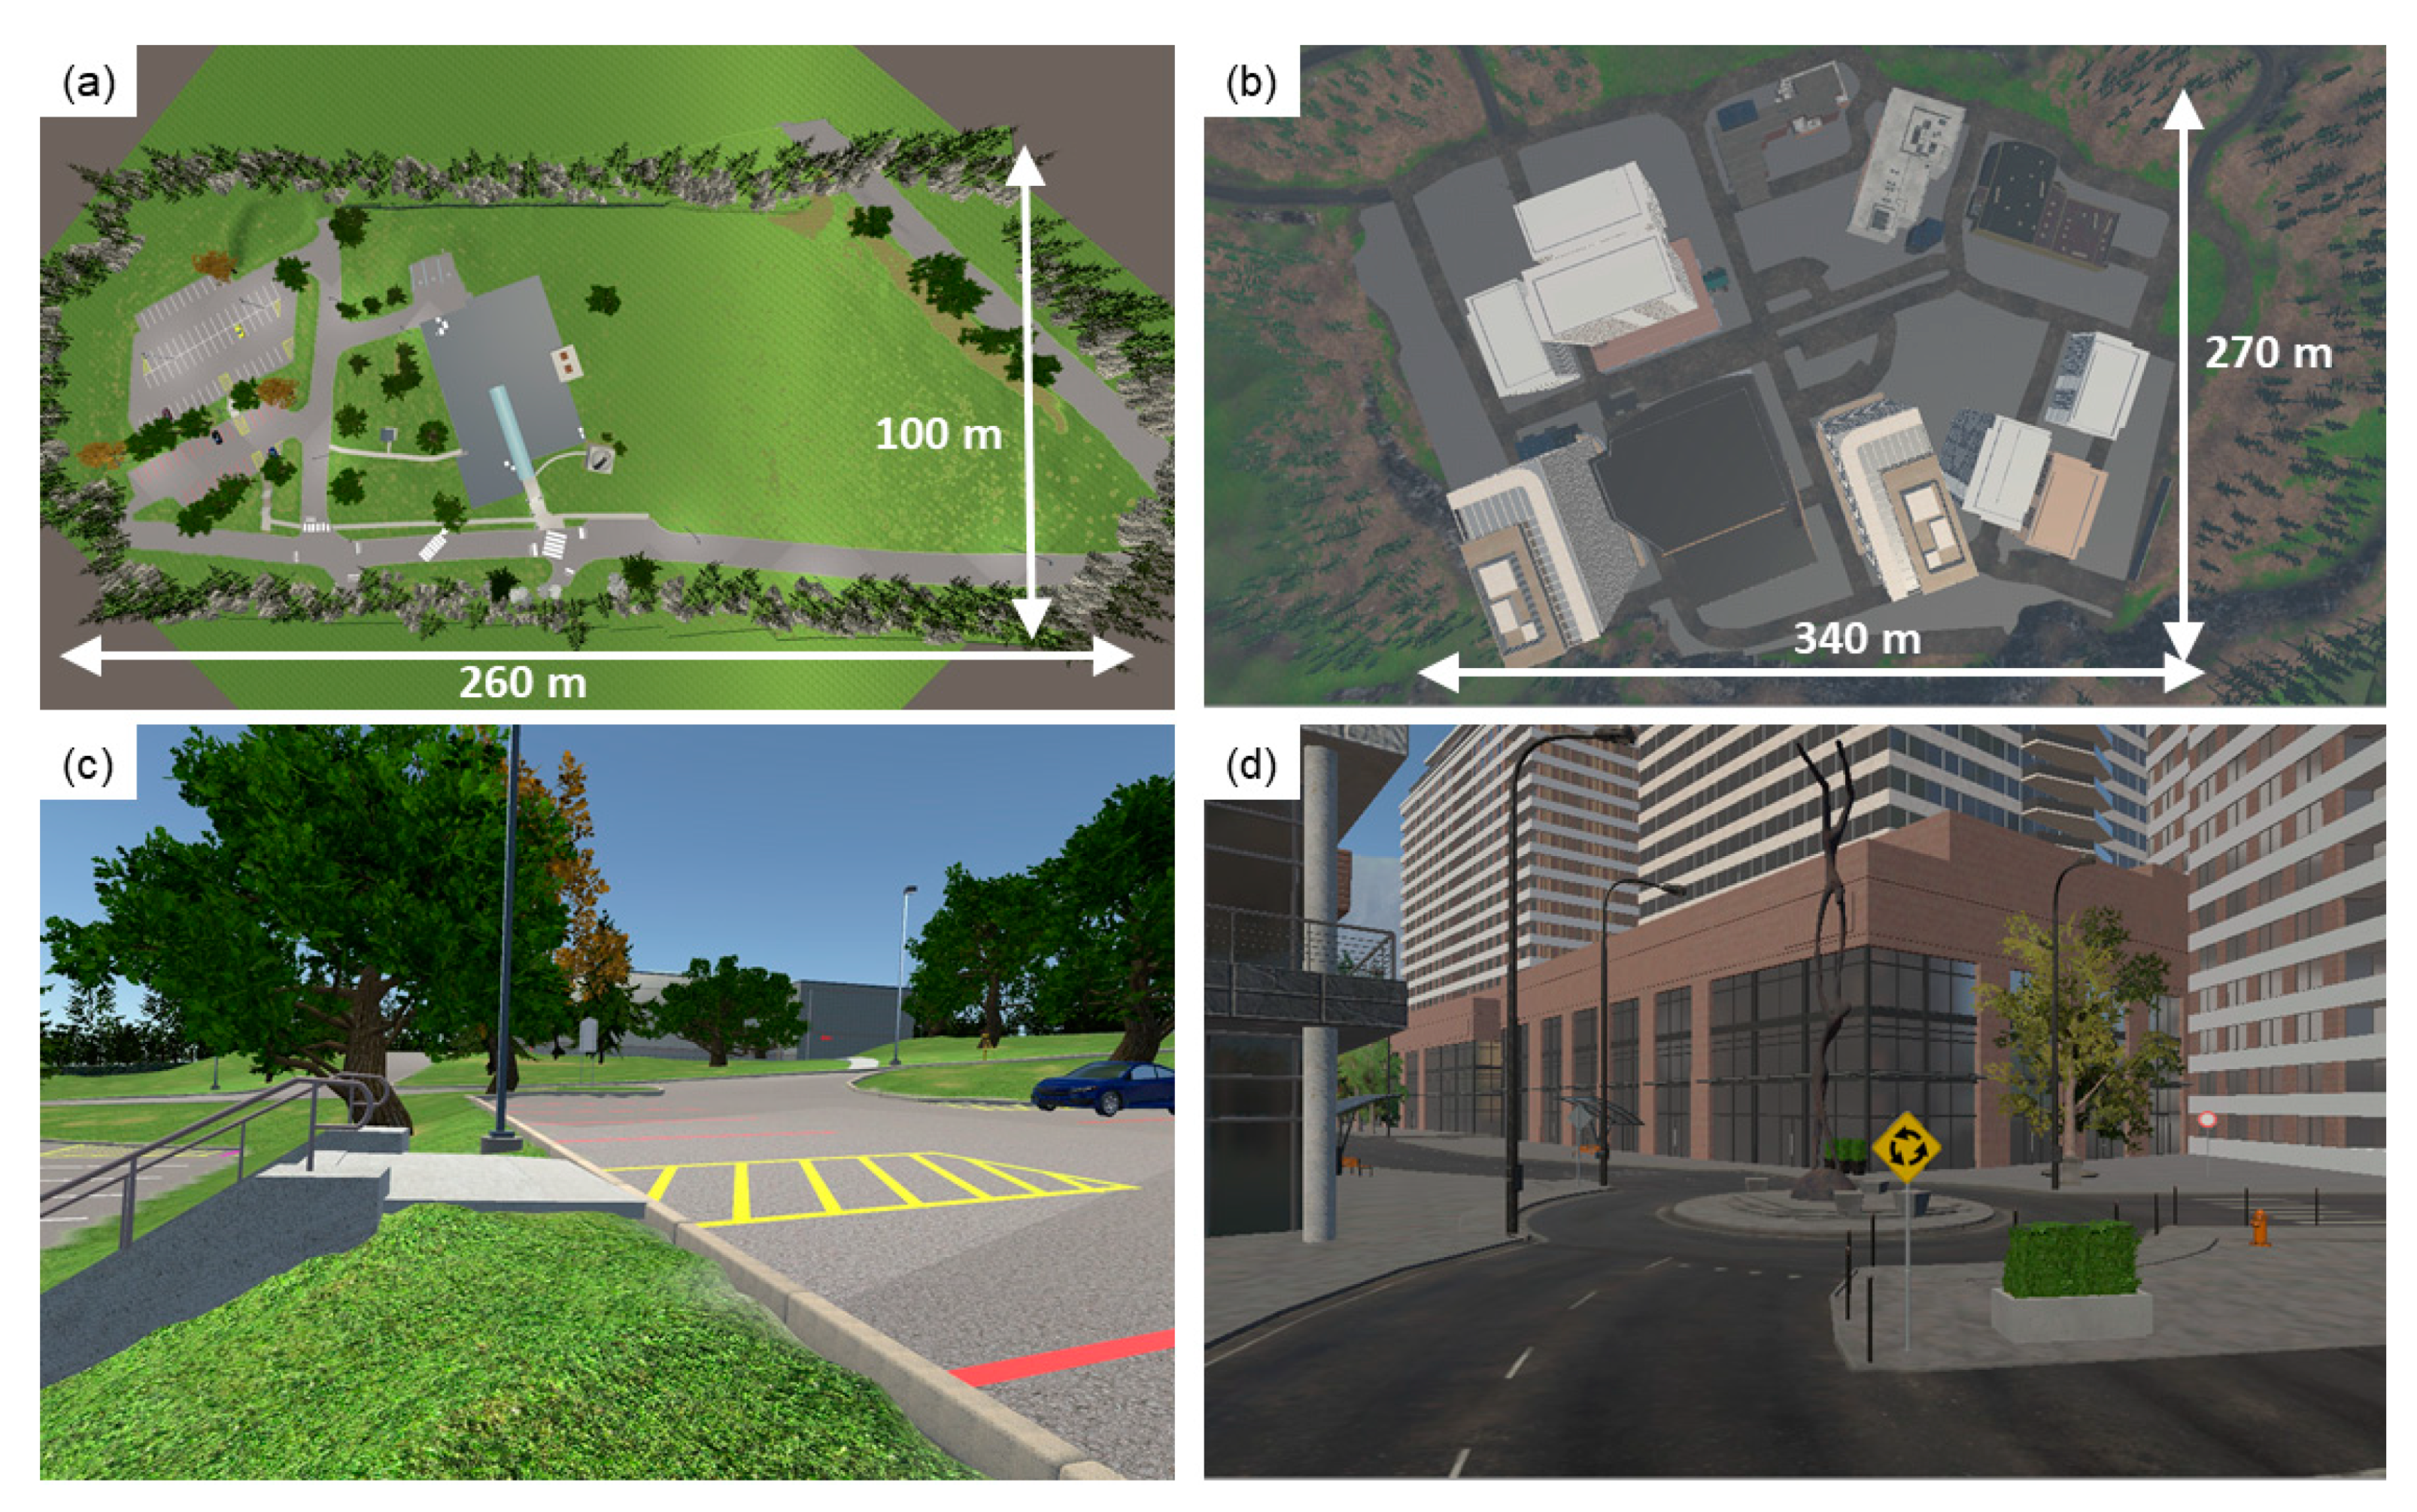
42]. Figure 4 shows an example of the virtual environment. The second environment available in the current version of the software is the Windridge City [49]. This environment is offered free and ready to use by Unity. We use the Windridge City to simulate urban surveys within the software. The software can support several environments and labs, and more environments with different terrains will be added in the future.

2.3. The Leveling Rod

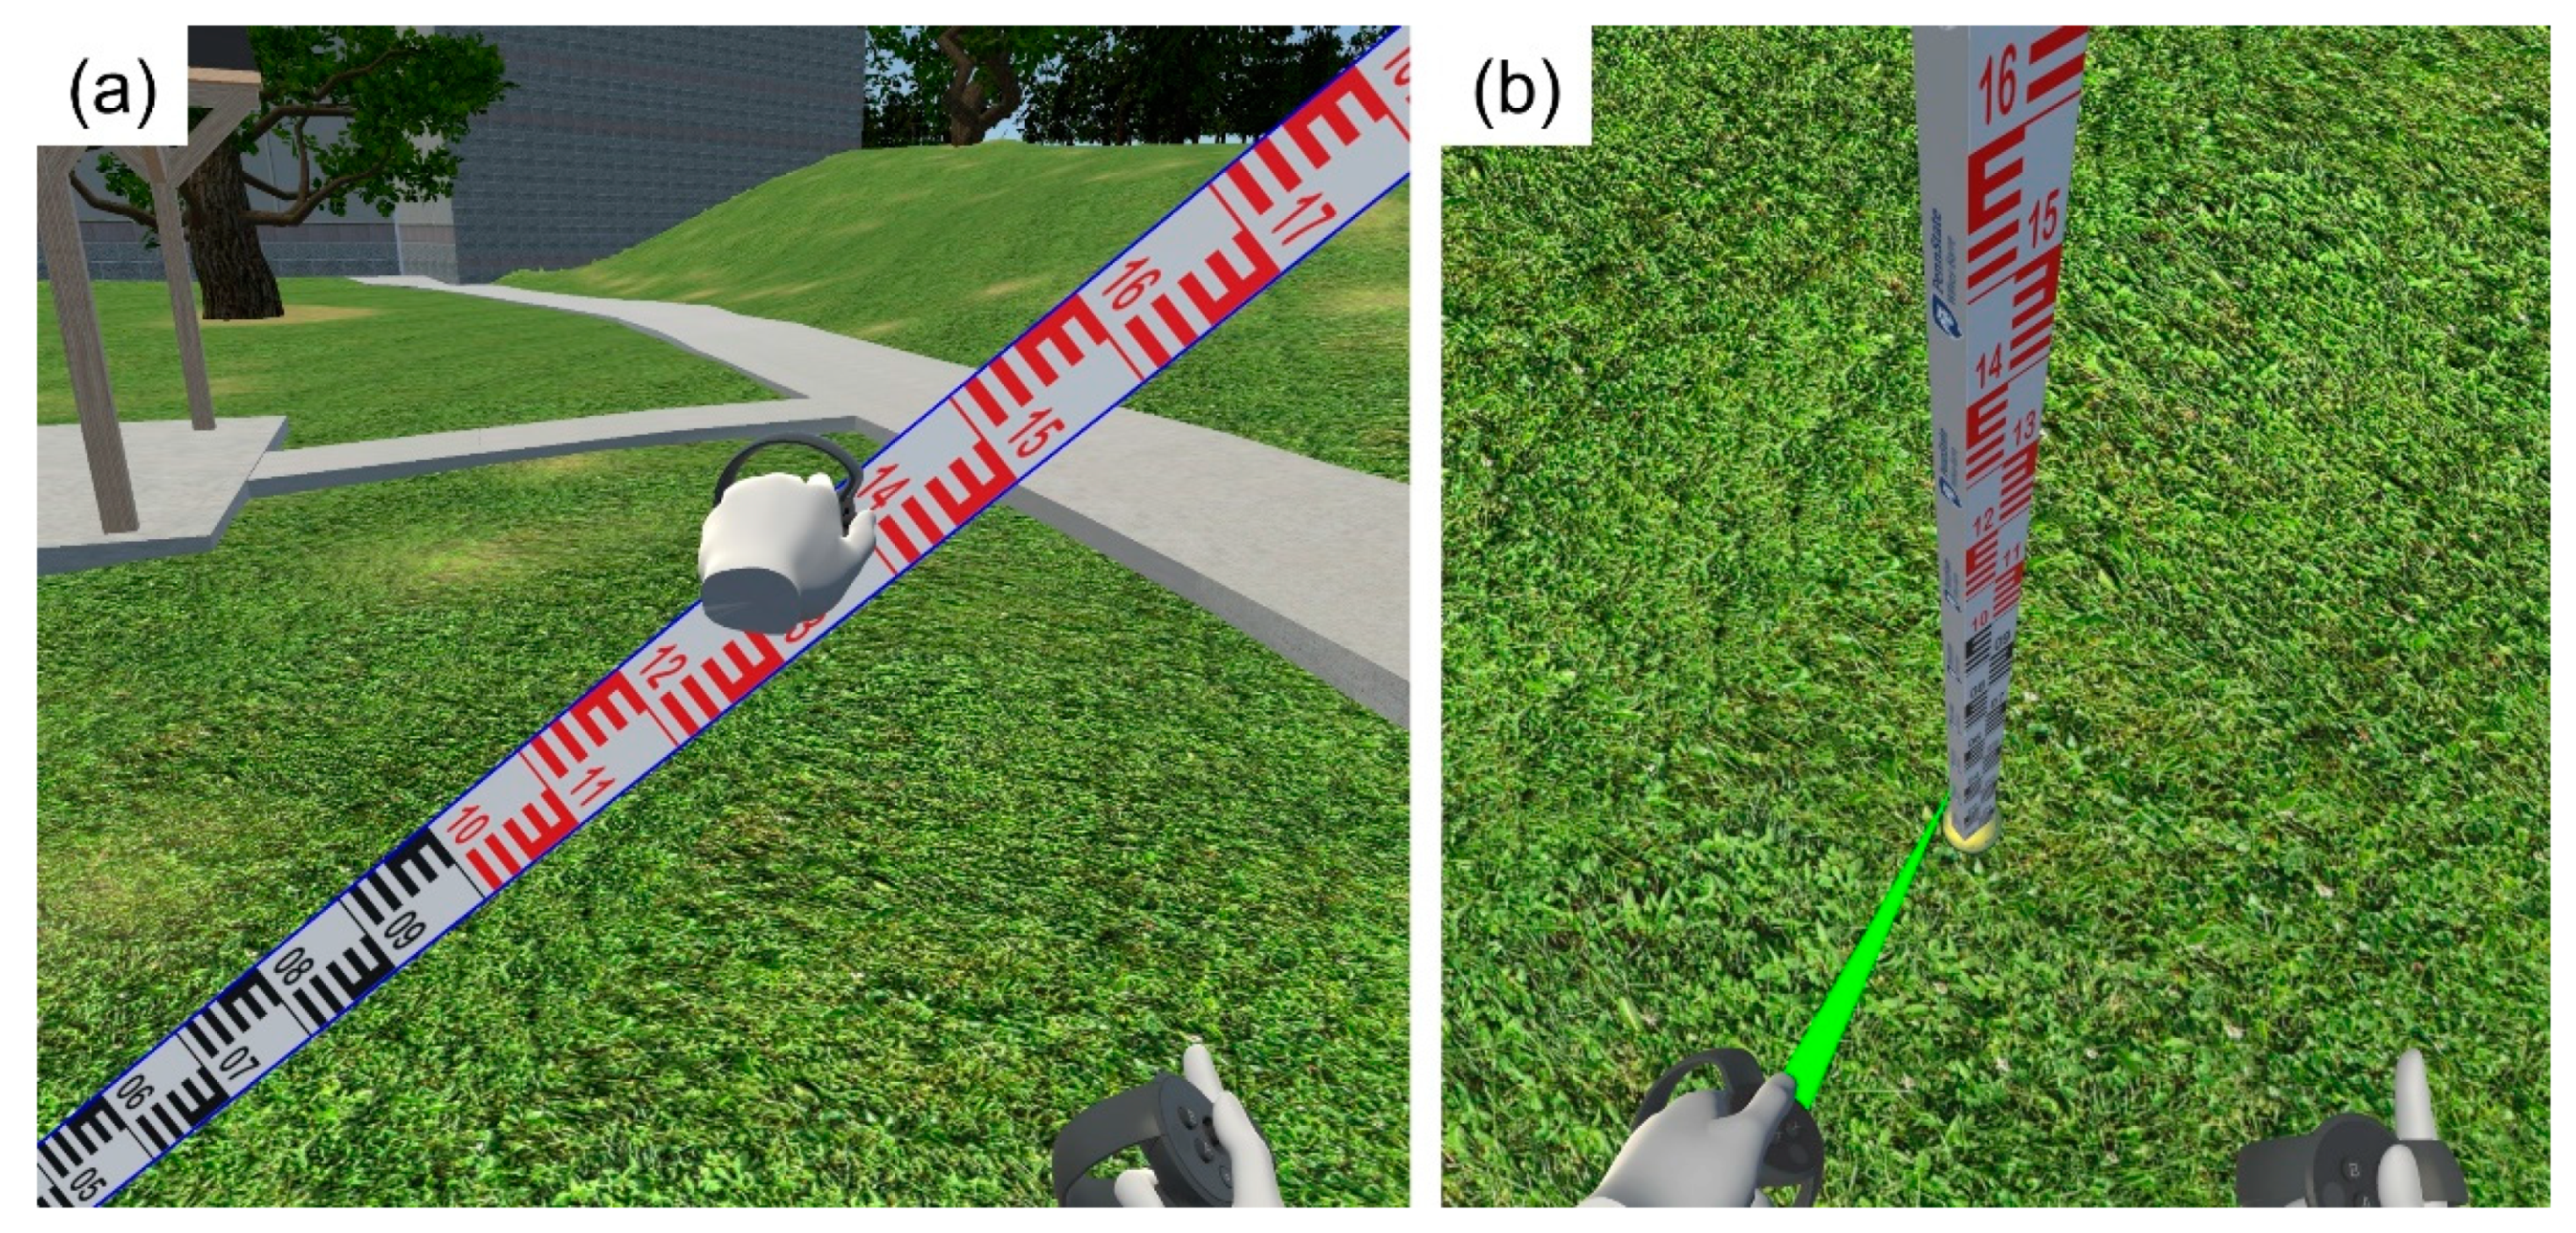
For the leveling rod, markings were created in Photoshop and turned into a texture in Unity. The user can grab and drop the rod in any location. In early versions of the software, the user had to perform a trial-and-error approach to achieve precise centering on a location (e.g., surveying monument or turning point), and centering was difficult, time-consuming, and counterproductive. To simplify this approach, we allow the rod to snap precisely on monuments or turning points when the rod touches the monument or turning point.
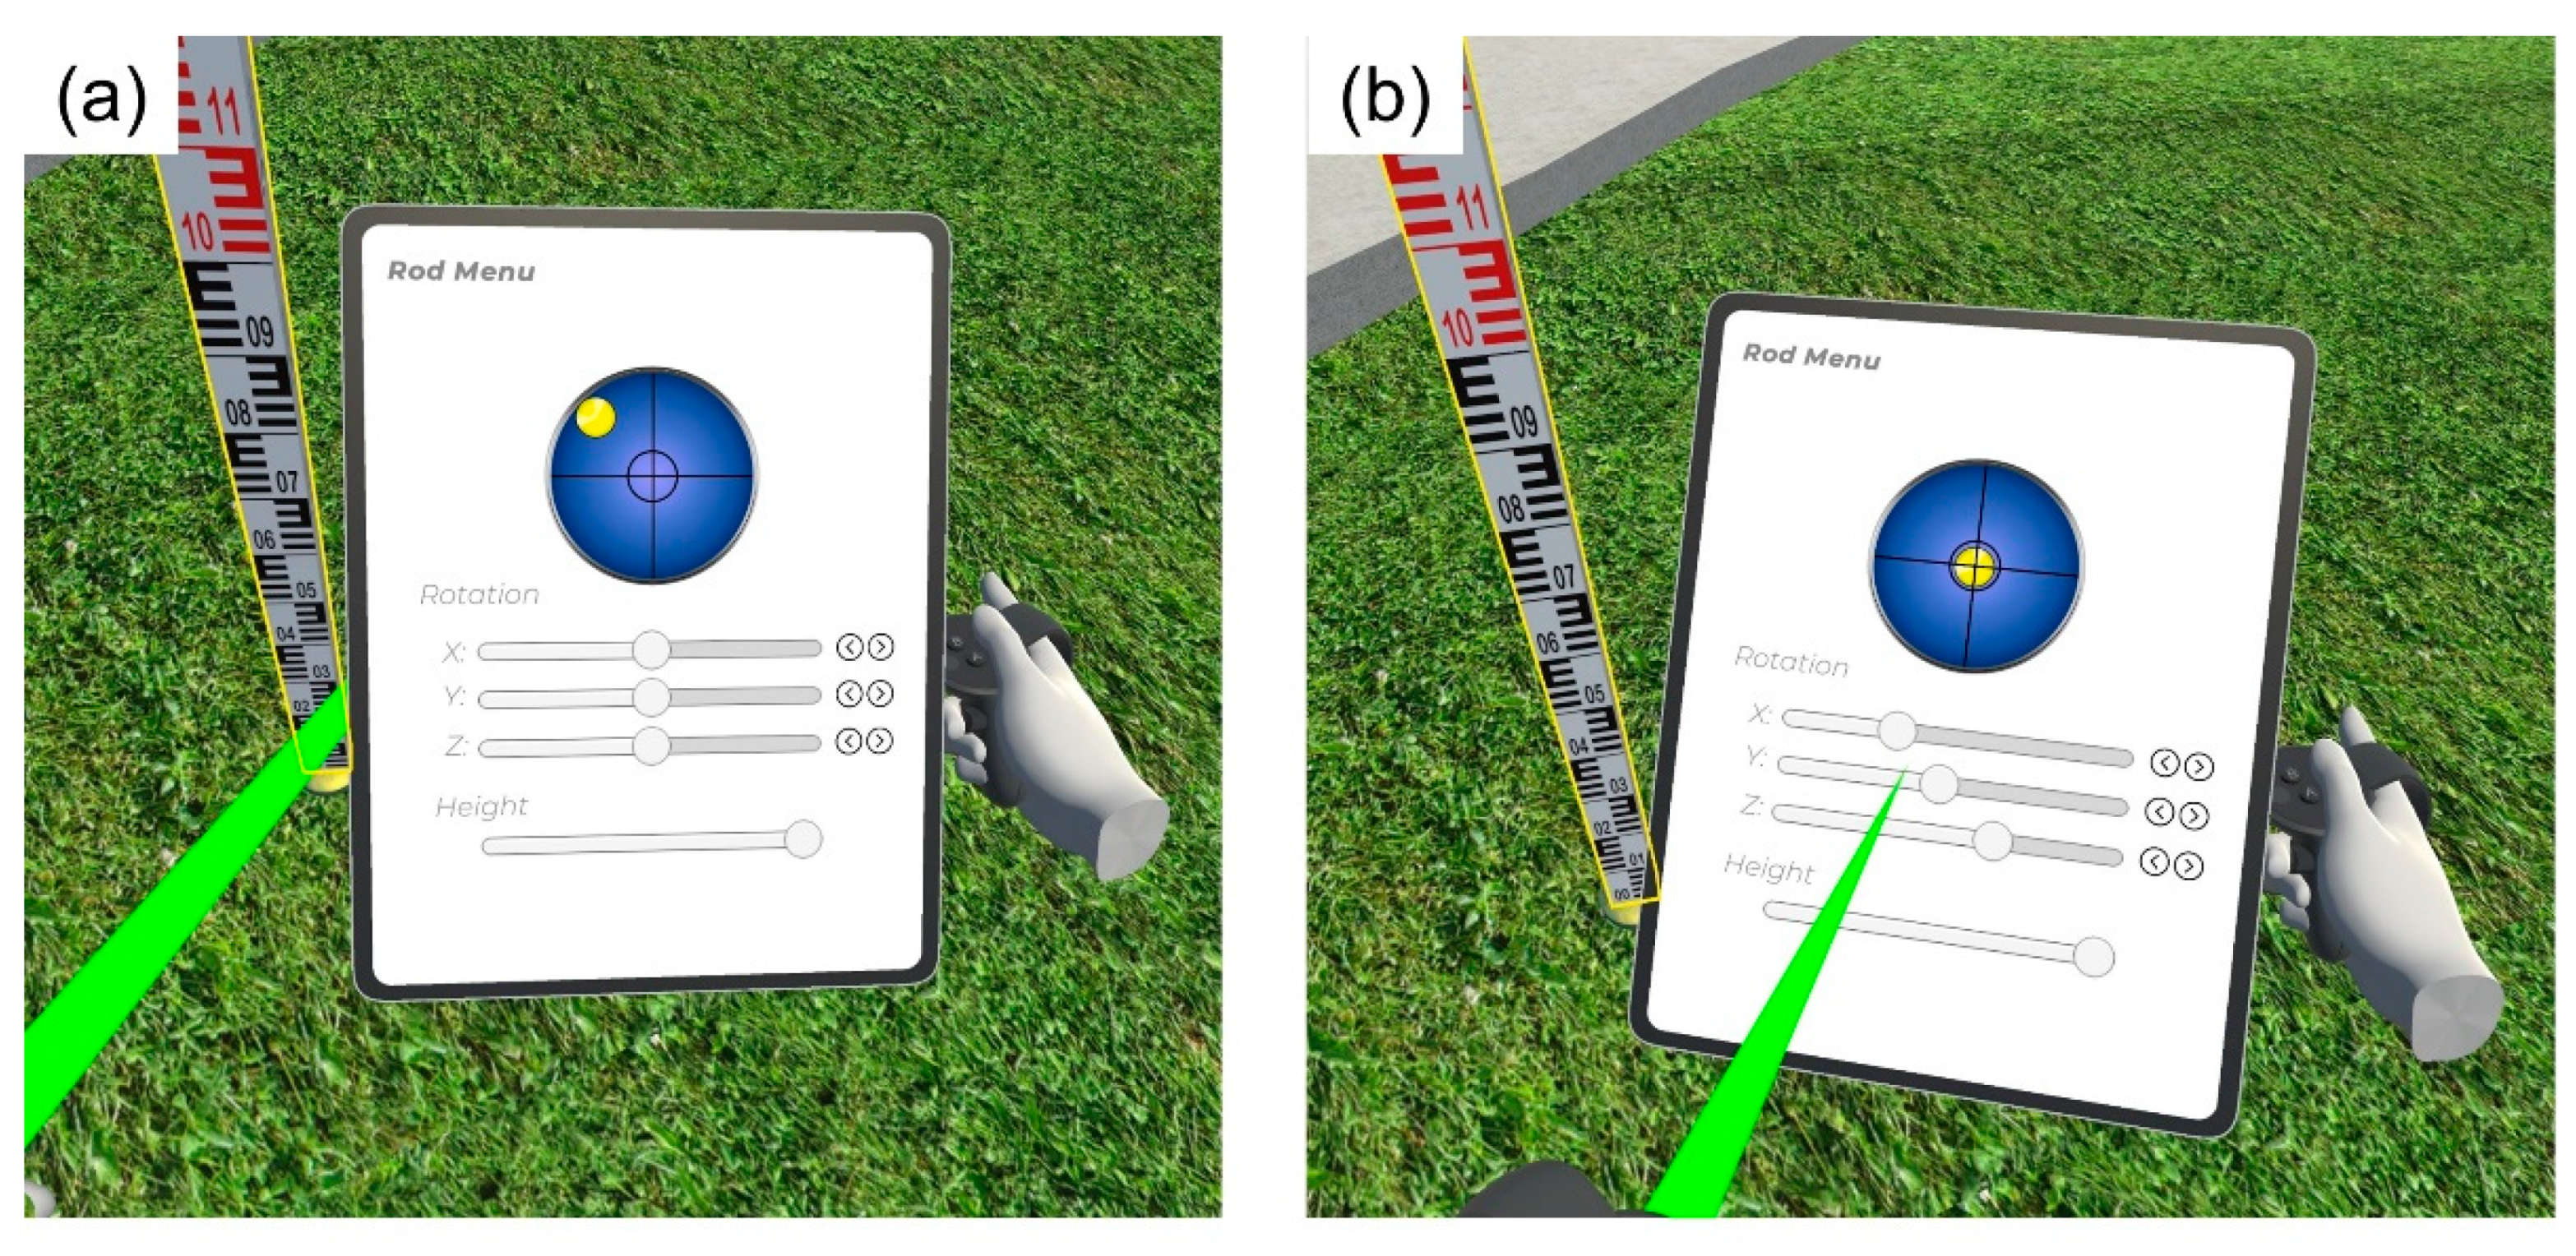
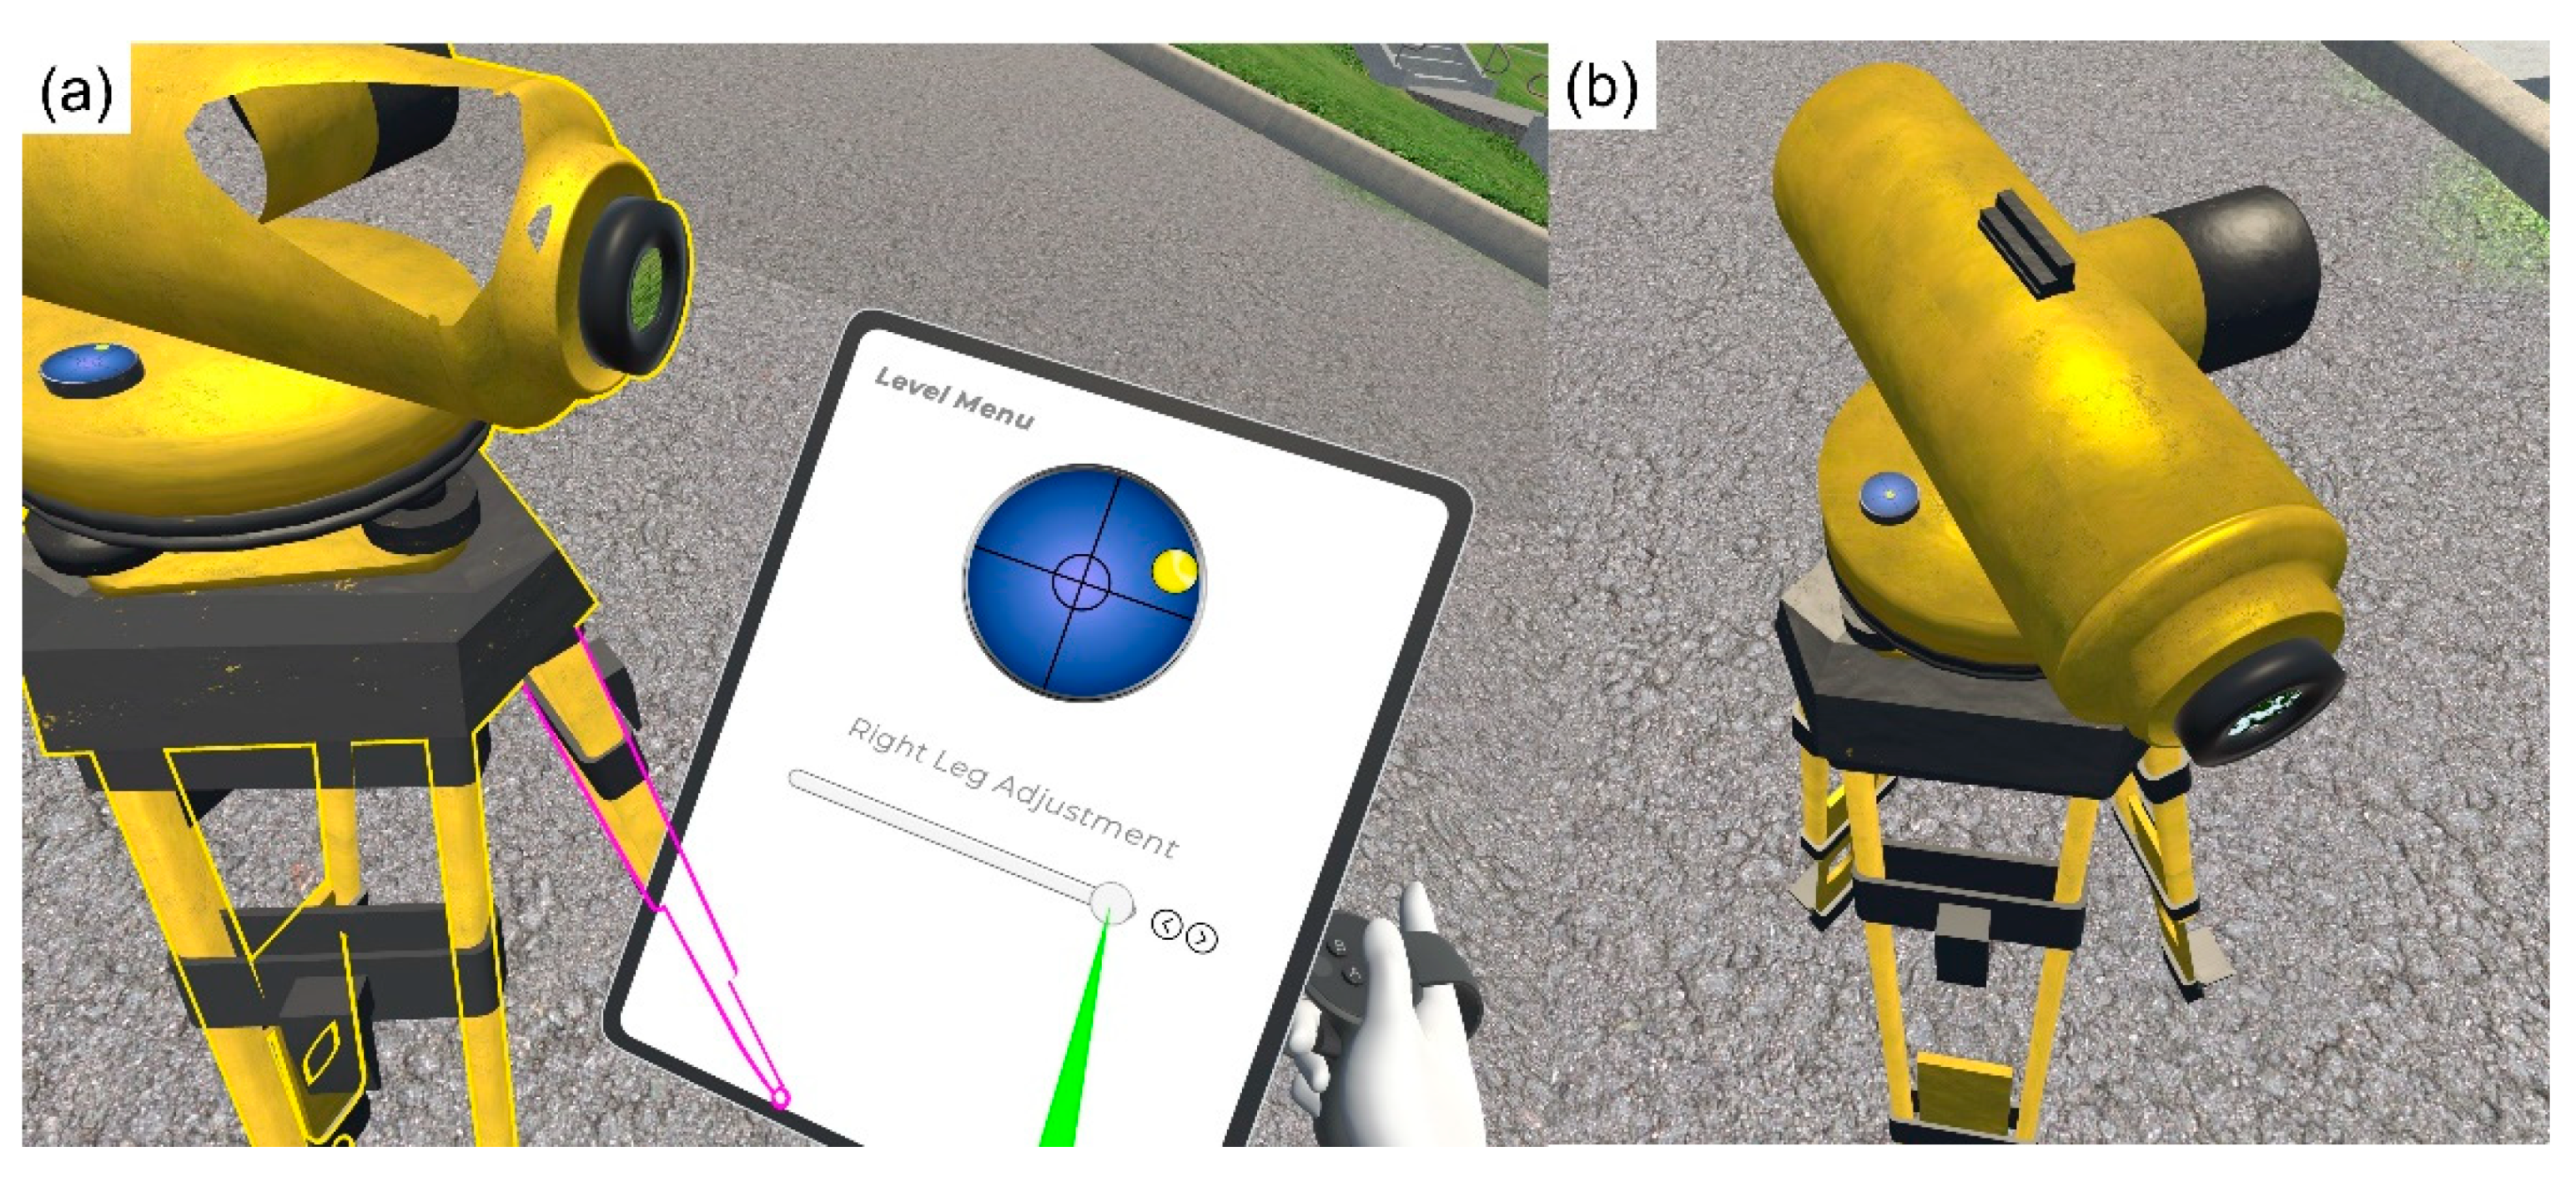
In real life, a surveyor will hold the rod with a circular bubble attached to it, trying to level it. Such a hand movement cannot be replicated with high accuracy in VR; therefore, a different approach using the virtual tablet was followed. By selecting the rod, the user can see a menu with three axes on the virtual tablet and see the leveling state of the rod (Figure 5a). The virtual bubble moves out of the edges of the circular vial when the rod is leveled to within 1° (the circular vial ranges from −1° to +1°). There are two controls in each axis. The first control moves a slider that allows for coarse rotations for approximate leveling of the rod. Then, using the arrow buttons, the user applies finer rotations for precise leveling of the rod. The fine arrows make changes of 0.01° (36′′) each time. This allows for leveling the rod within 30′′ to 1′ in most cases. Figure 5b shows an example of the rod being leveled. With this workaround, students understand that they have to level the rod before moving to the next lab step, thus maintaining this specific learning objective. Finally, the user can expand and collapse the rod as needed in one-meter intervals up to five meters (see “Height” slider in Figure 5).

2.4. The Differential Level Functions

For the differential level instrument, we created a model based on a Topcon AT-G3 instrument. This instrument is attached to the tripod, because, in differential leveling, centering is not necessary, and in the field, surveyors often transport the differential level instrument mounted on the tripod. As with the rod, the user can reach towards any tripod leg grab and move the tripod and instrument to a different location.
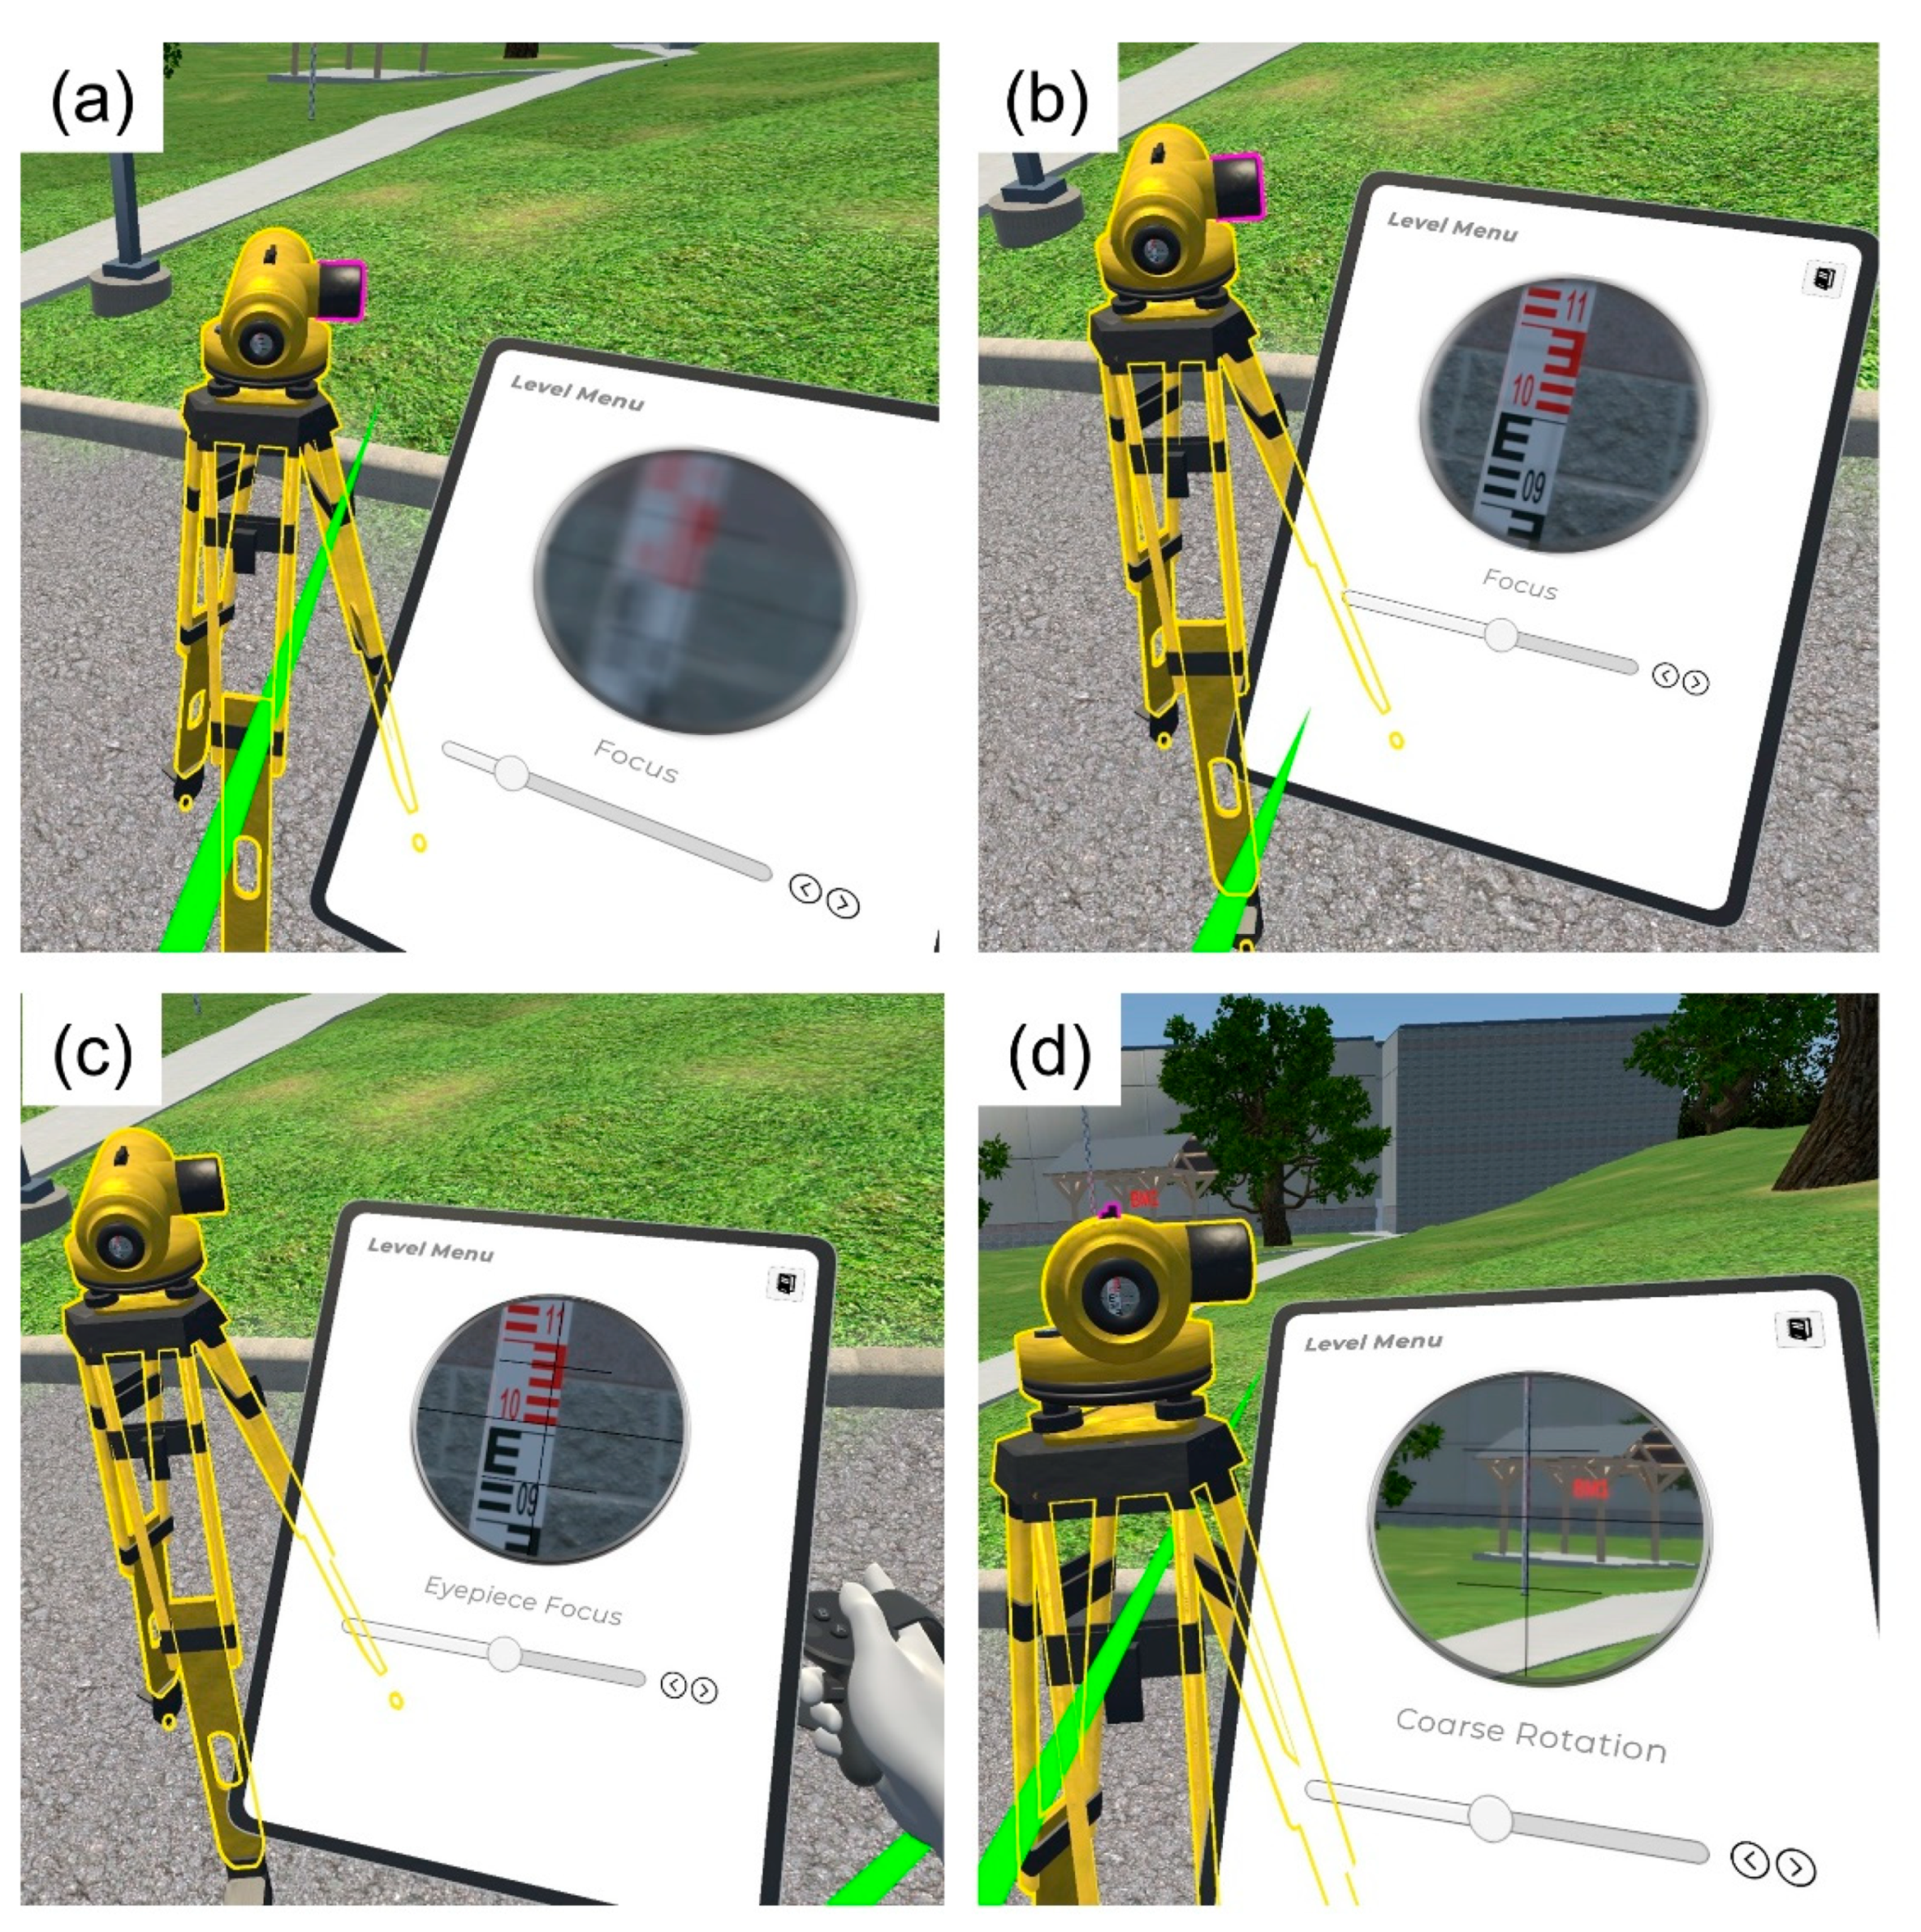
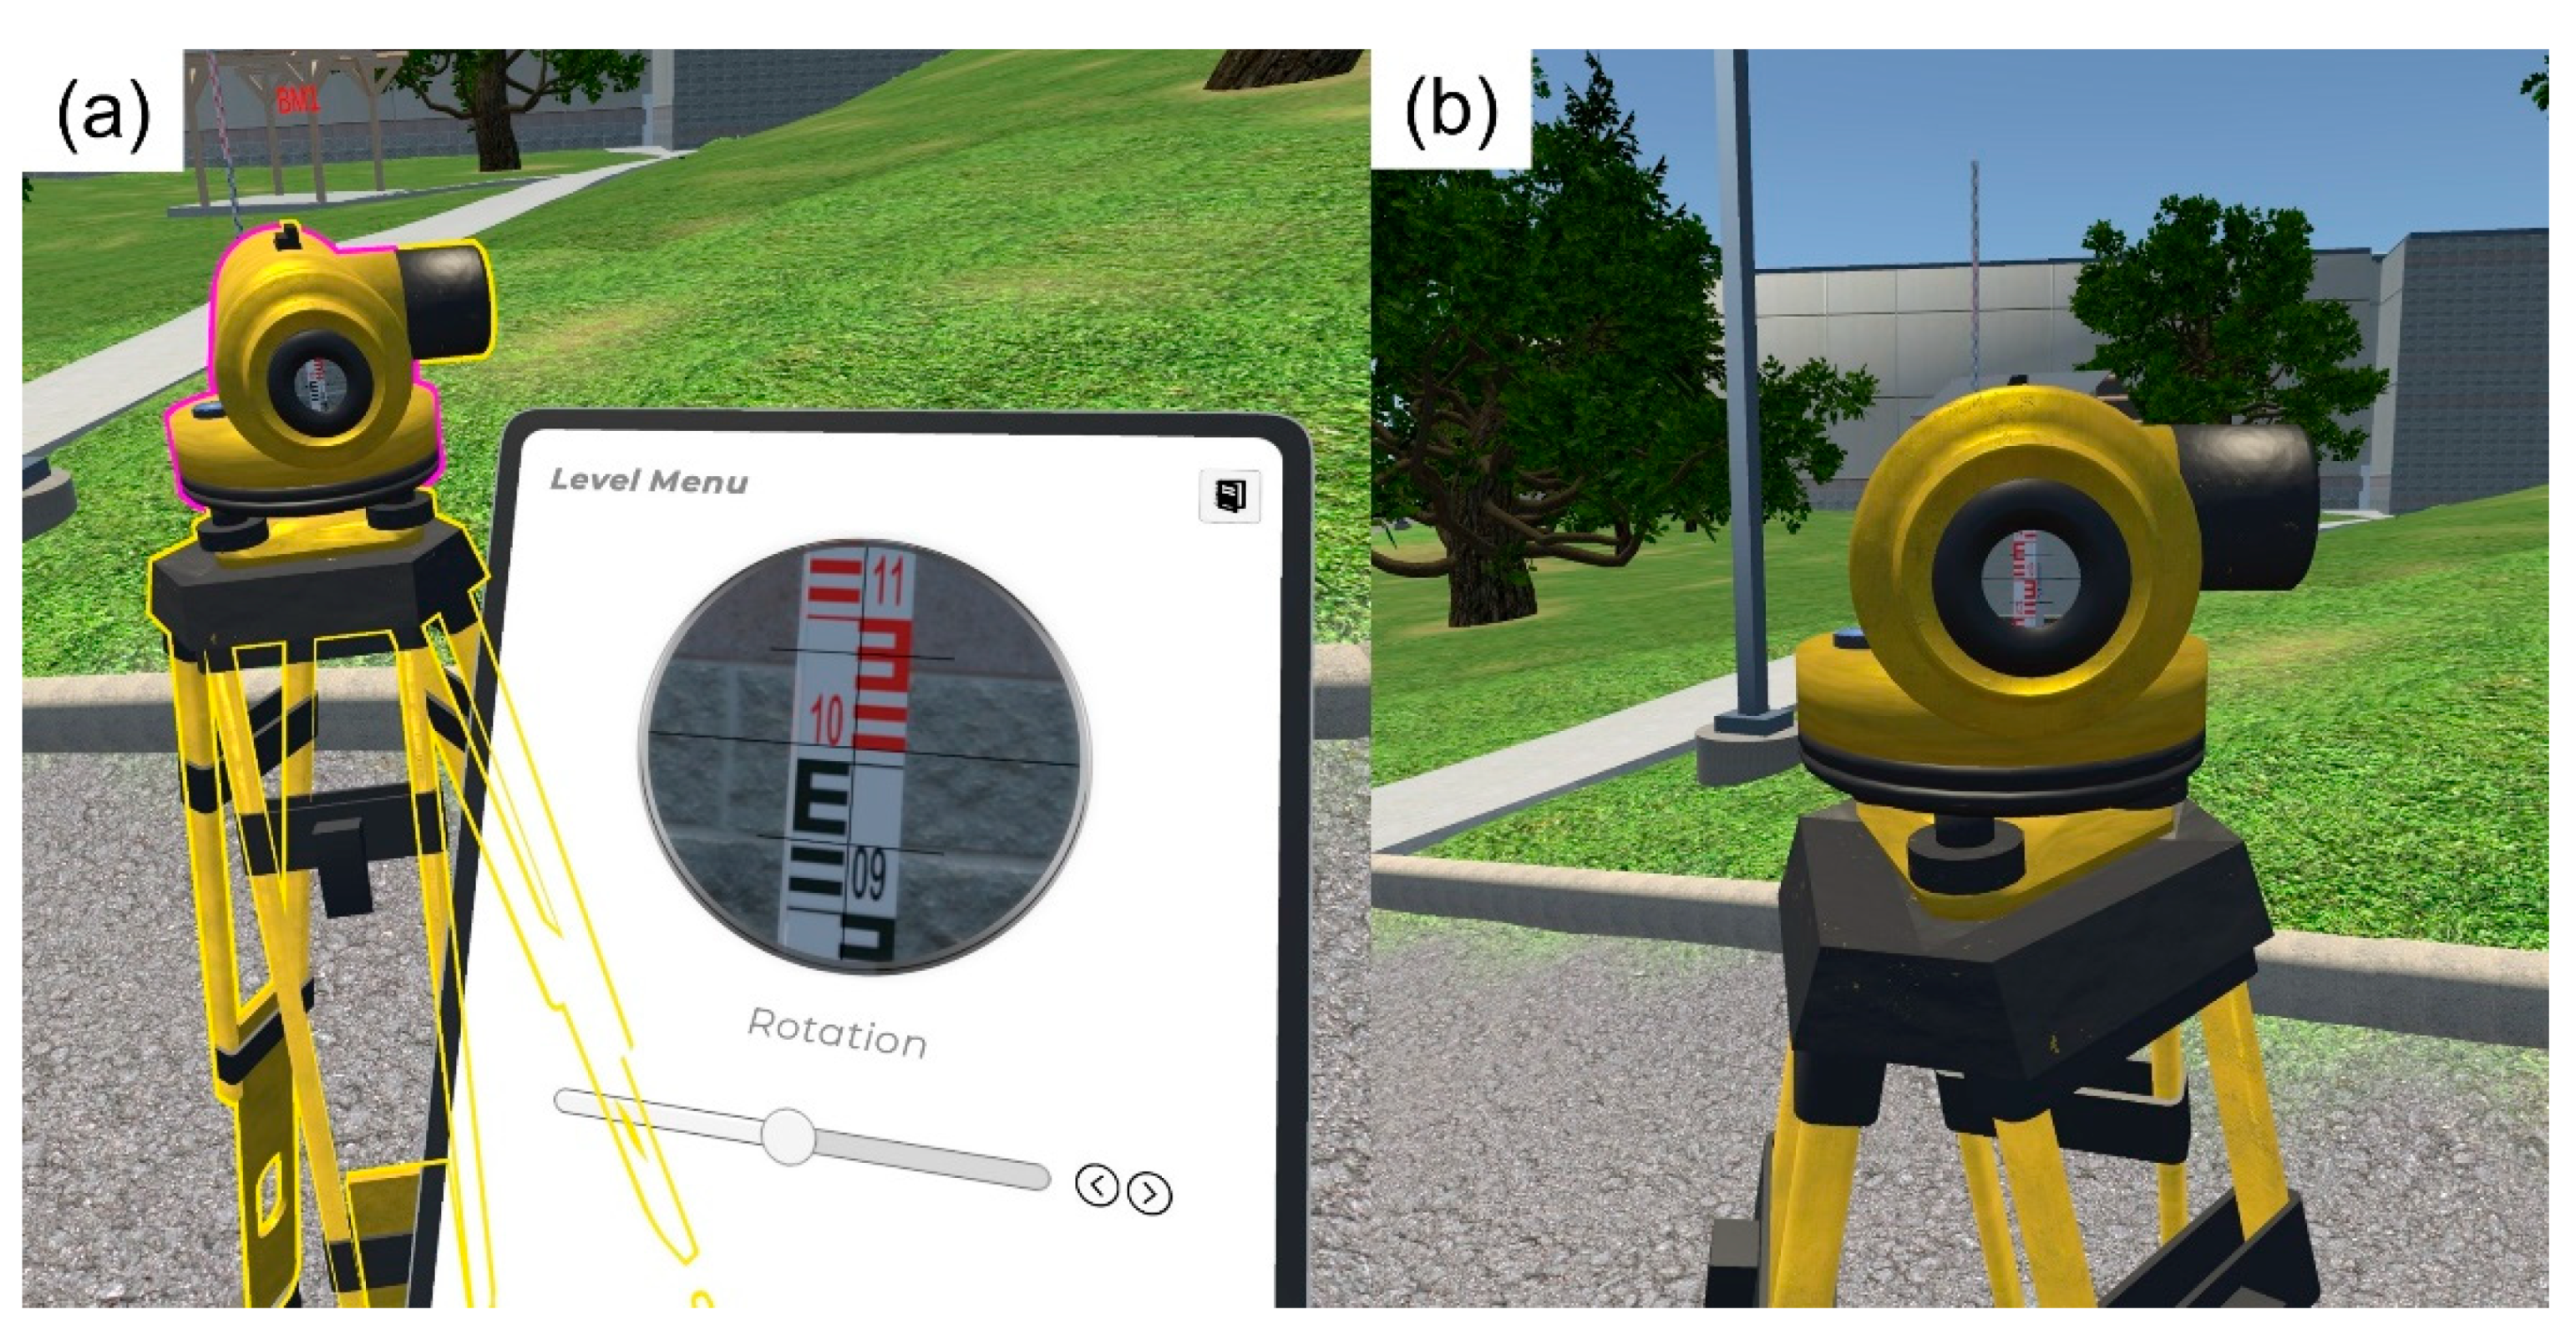
Most components in the tripod and level are selectable, giving them separate functionality, namely, these are tripod legs, tribrach screws, telescope, peep sight, focus knob, and eyepiece. As with the rod, these individual components are controlled via the virtual tablet. The instrument focus is simulated through blurring of the picture with a distance-dependent component and a focus capability from 0 to 150 m. Figure 6a,b show the instrument view before and after focusing. Note that, in Figure 6b, the crosshair is still blurry. The user needs to select the eyepiece and focus the crosshair (Figure 6c). Then, by selecting the peep sight, the user has a coarse rotation of the instrument (Figure 6d), which allows the user to approximately aim towards the rod. The field of view of this coarse rotation is 20°. The student can then select the main body of the instrument, which brings the fine rotation view and allows for precise aiming (
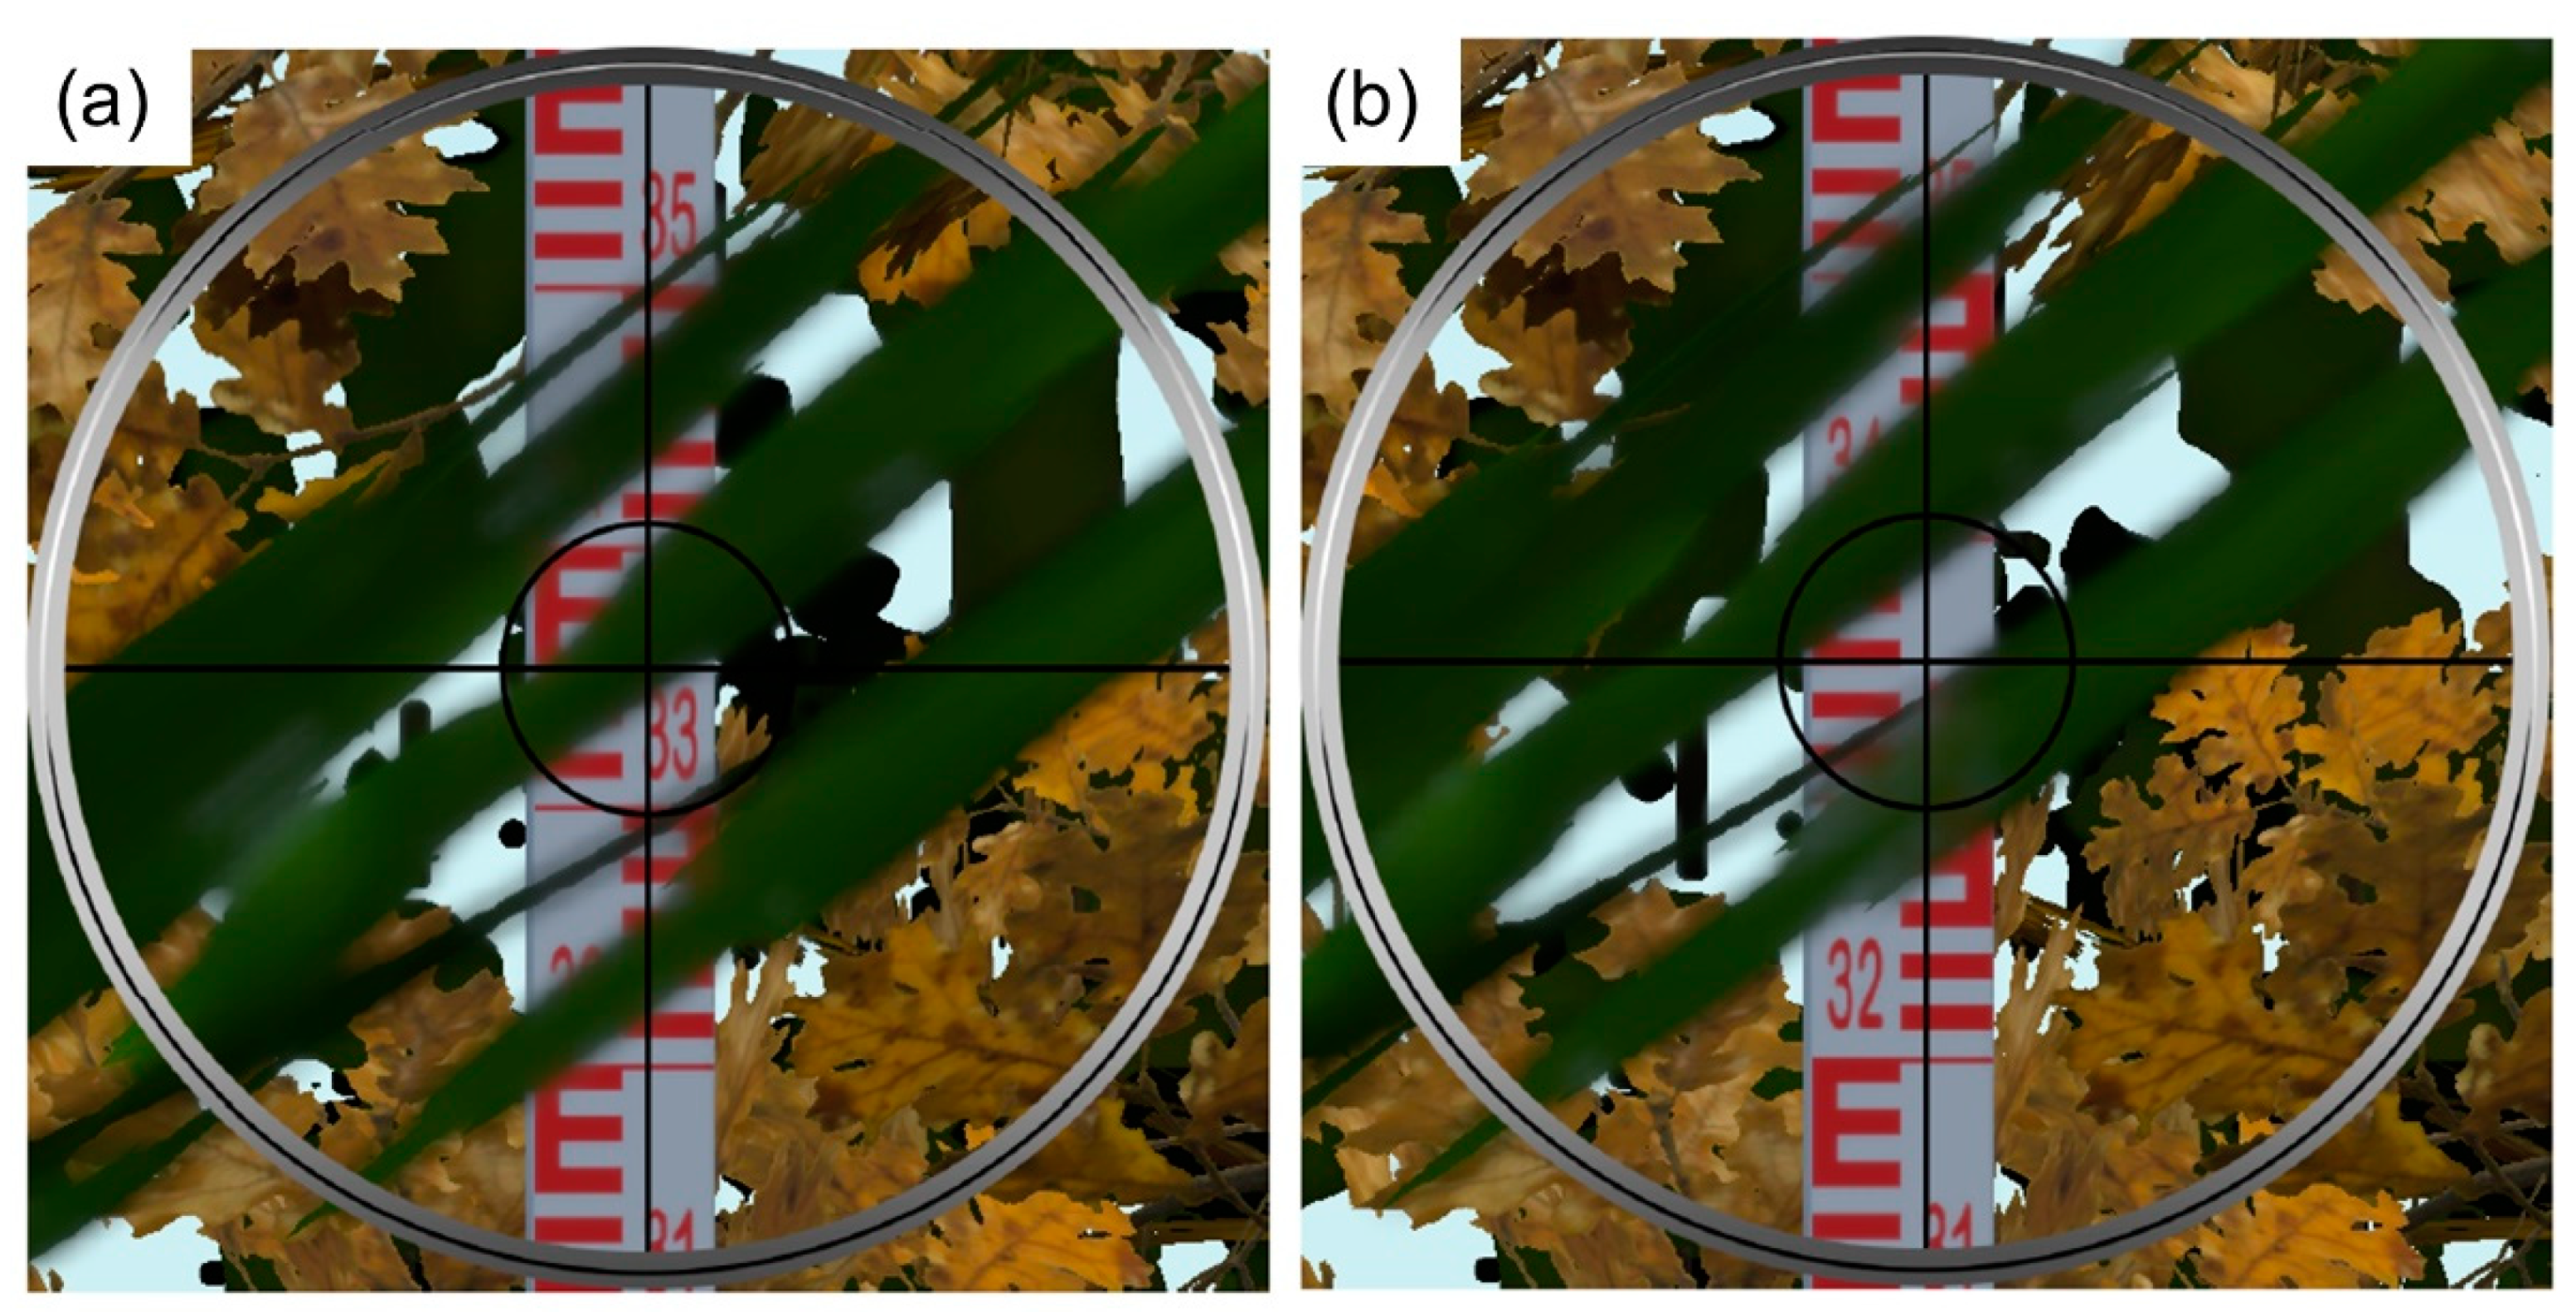
Figure 7a). The field of view in the fine view is 1°30′, similar to the Topcon instrument used as the model. The user can go towards the instrument and lean towards the telescope to make a measurement (
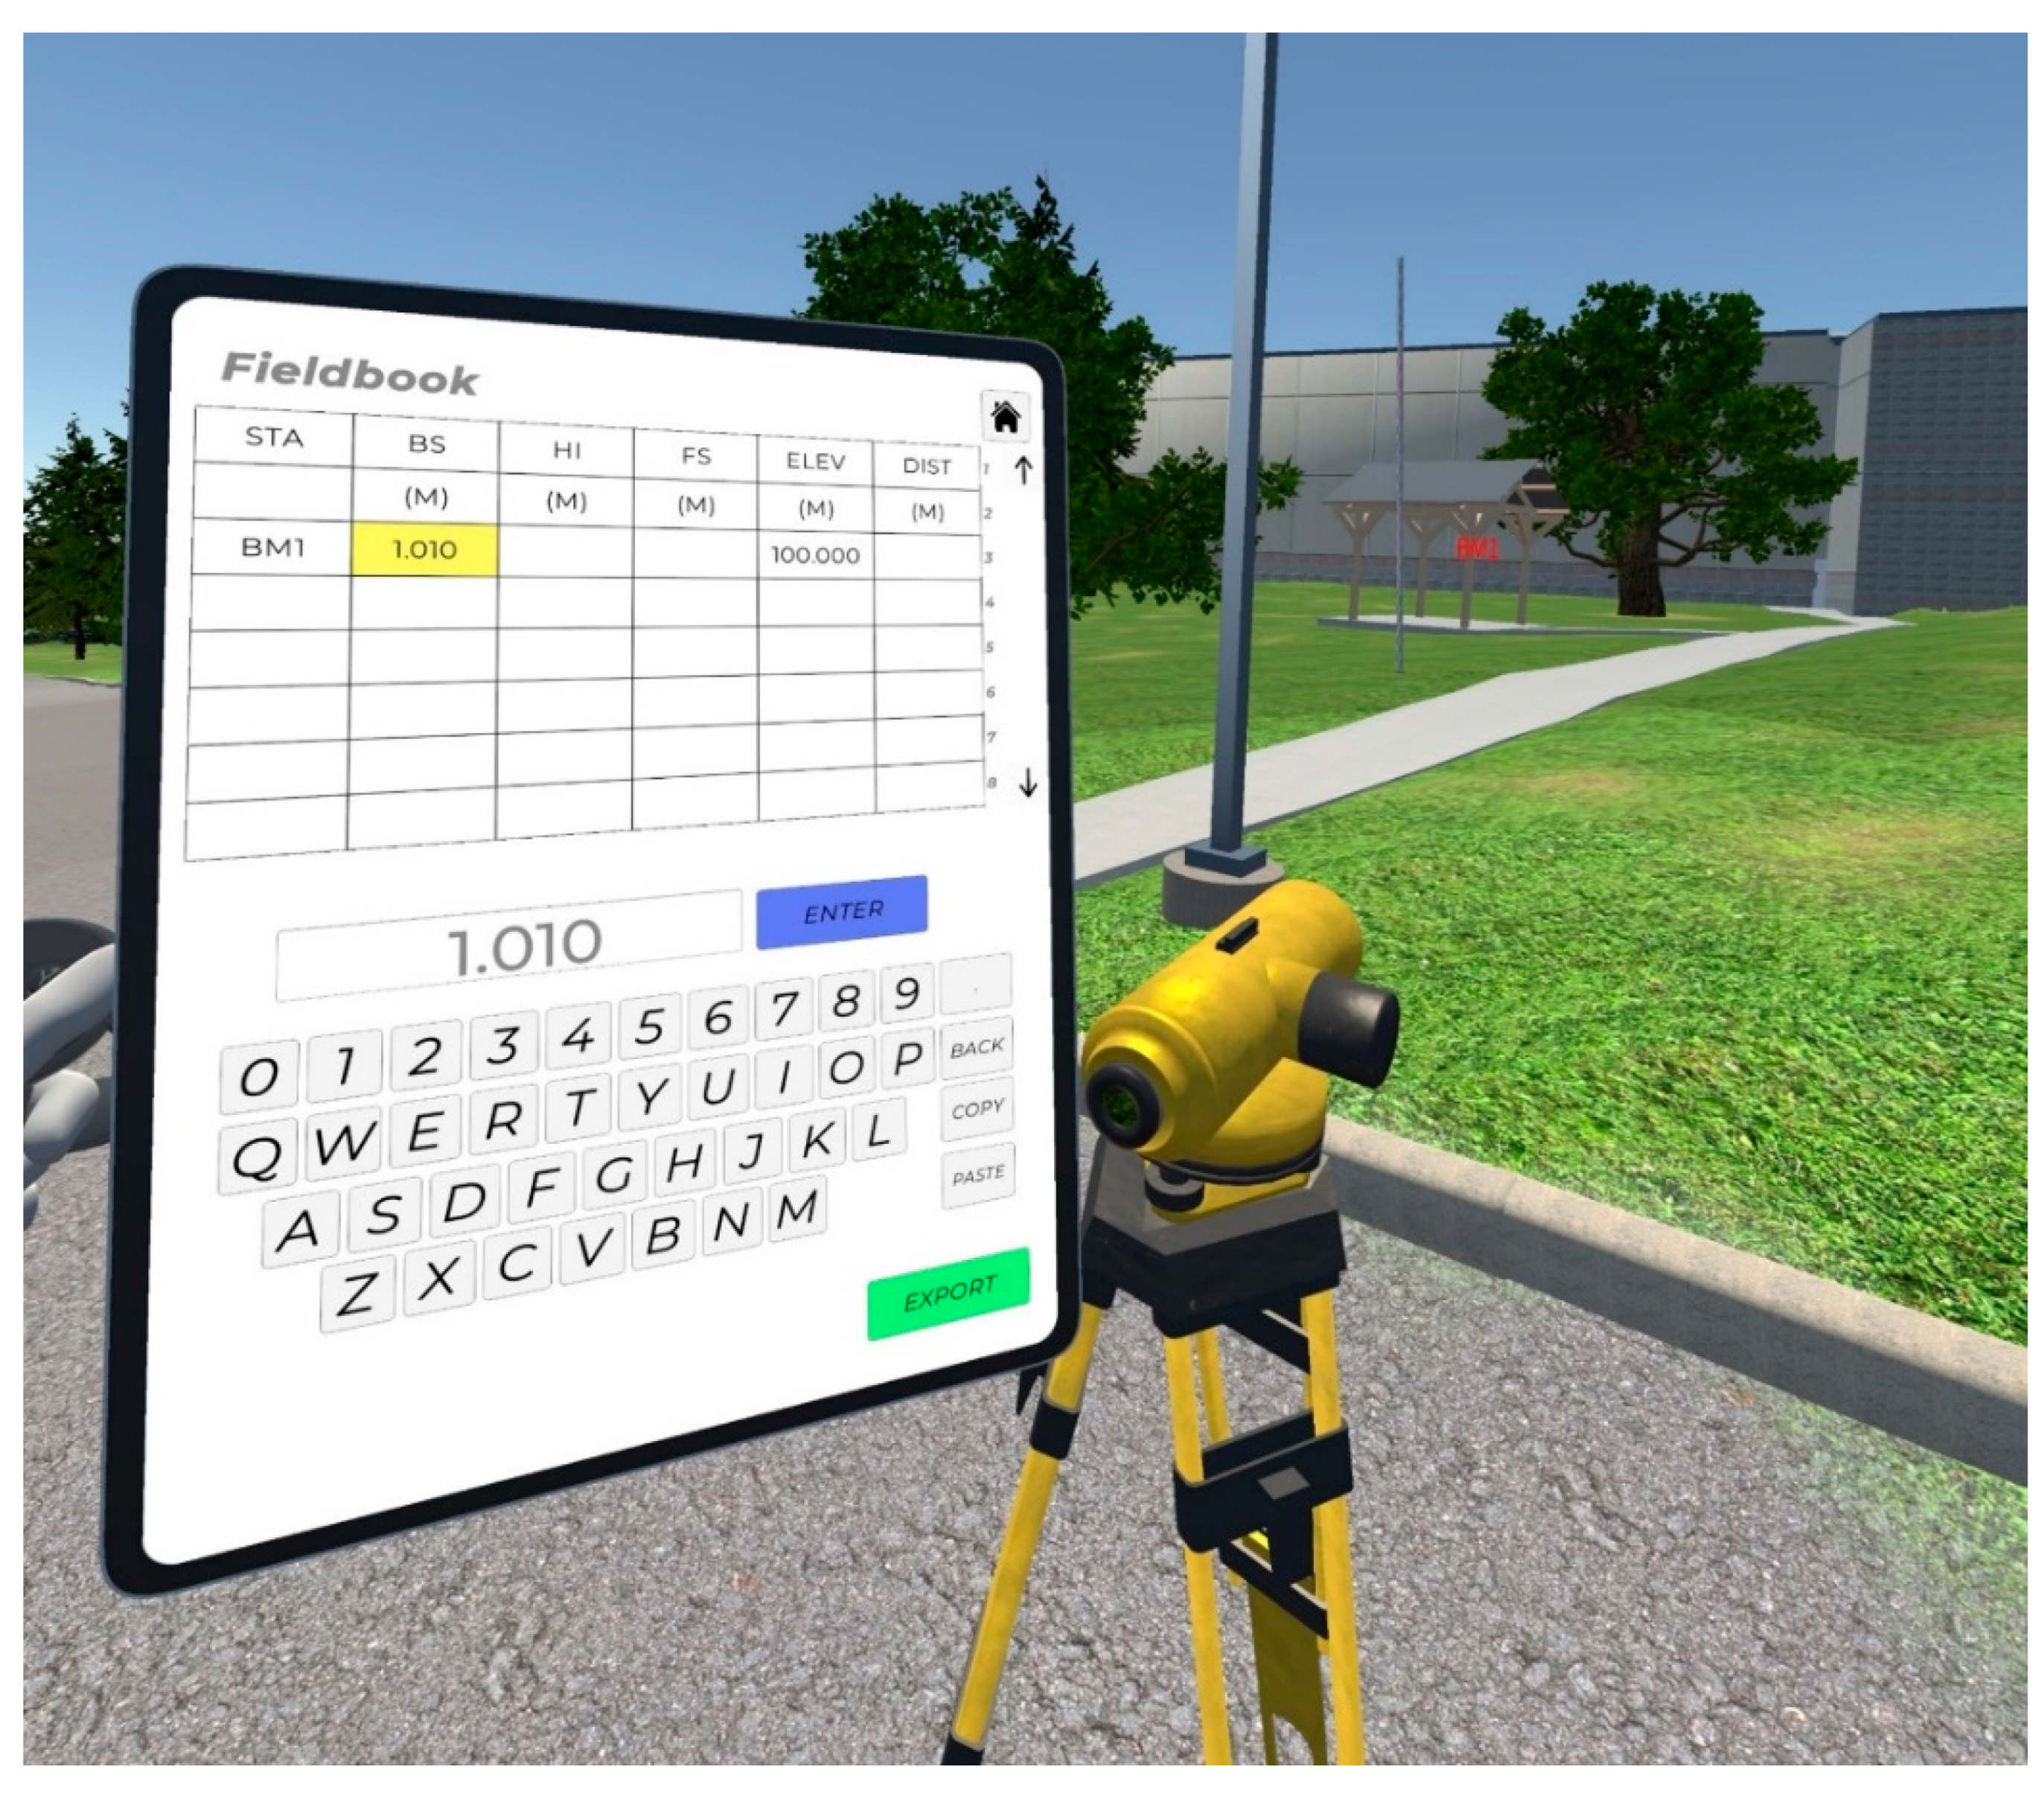
Figure 7b). However, reading the rod by leaning towards the instrument can be difficult in VR because of clipping (when the camera intersects the object); therefore, users can make observations using the projected telescope view on the virtual tablet. For recording measurements, students have a virtual fieldbook. The virtual fieldbook is set up like a typical spreadsheet with numerous cells that are selectable (Figure 8). When they are finished with a lab, they are able to press an export button (see bottom right corner in Figure 8) and have the entire fieldbook exported in CSV format for use elsewhere.
The tripod legs and tribrach screws control the leveling of the instrument. As movement of tripod legs and tribrach screws is associated with terrain undulations, a technique had to be developed to position the entire device based on the leg lengths as well as the terrain it was resting on. The following subsection goes into depth on the efficient technique we developed that is used to calculate the proper position and rotation of the differential level instrument.

2.5. Efficient Tripod Positioning

When simulating 3D objects in VR, low polygon objects are simple to render, while complex objects such as water are much more resource-intensive to simulate. A naive approach is to fully simulate these objects as physical entities (with mass, velocity, and position parameters) in a physics engine. This physical simulation takes up vast amounts of compute resources, and the cost grows exponentially as more complexity is introduced [50,51]. This either slows the 3D game or requires a powerful computer, especially when an object is being tracked in real time [50,52]. Tracking a complex 3D object necessitates finding its position and rotation with respect to the reference frame in the virtual world. These are increasingly difficult to calculate as more complex shapes are placed on more complex surfaces. This process can be cut down dramatically if the entire process of physical simulation is eliminated. We have developed a novel technique for the positioning of complex objects on complex surfaces without the use of large amounts of computational overhead. Going forward, it is assumed we are talking about objects with no unique physical characteristics such as bounciness or slipperiness where a physical simulation would be inevitable. We seek to implement this process while maintaining a smooth and immersive experience to retain the benefits of VR [6,7,8,9].
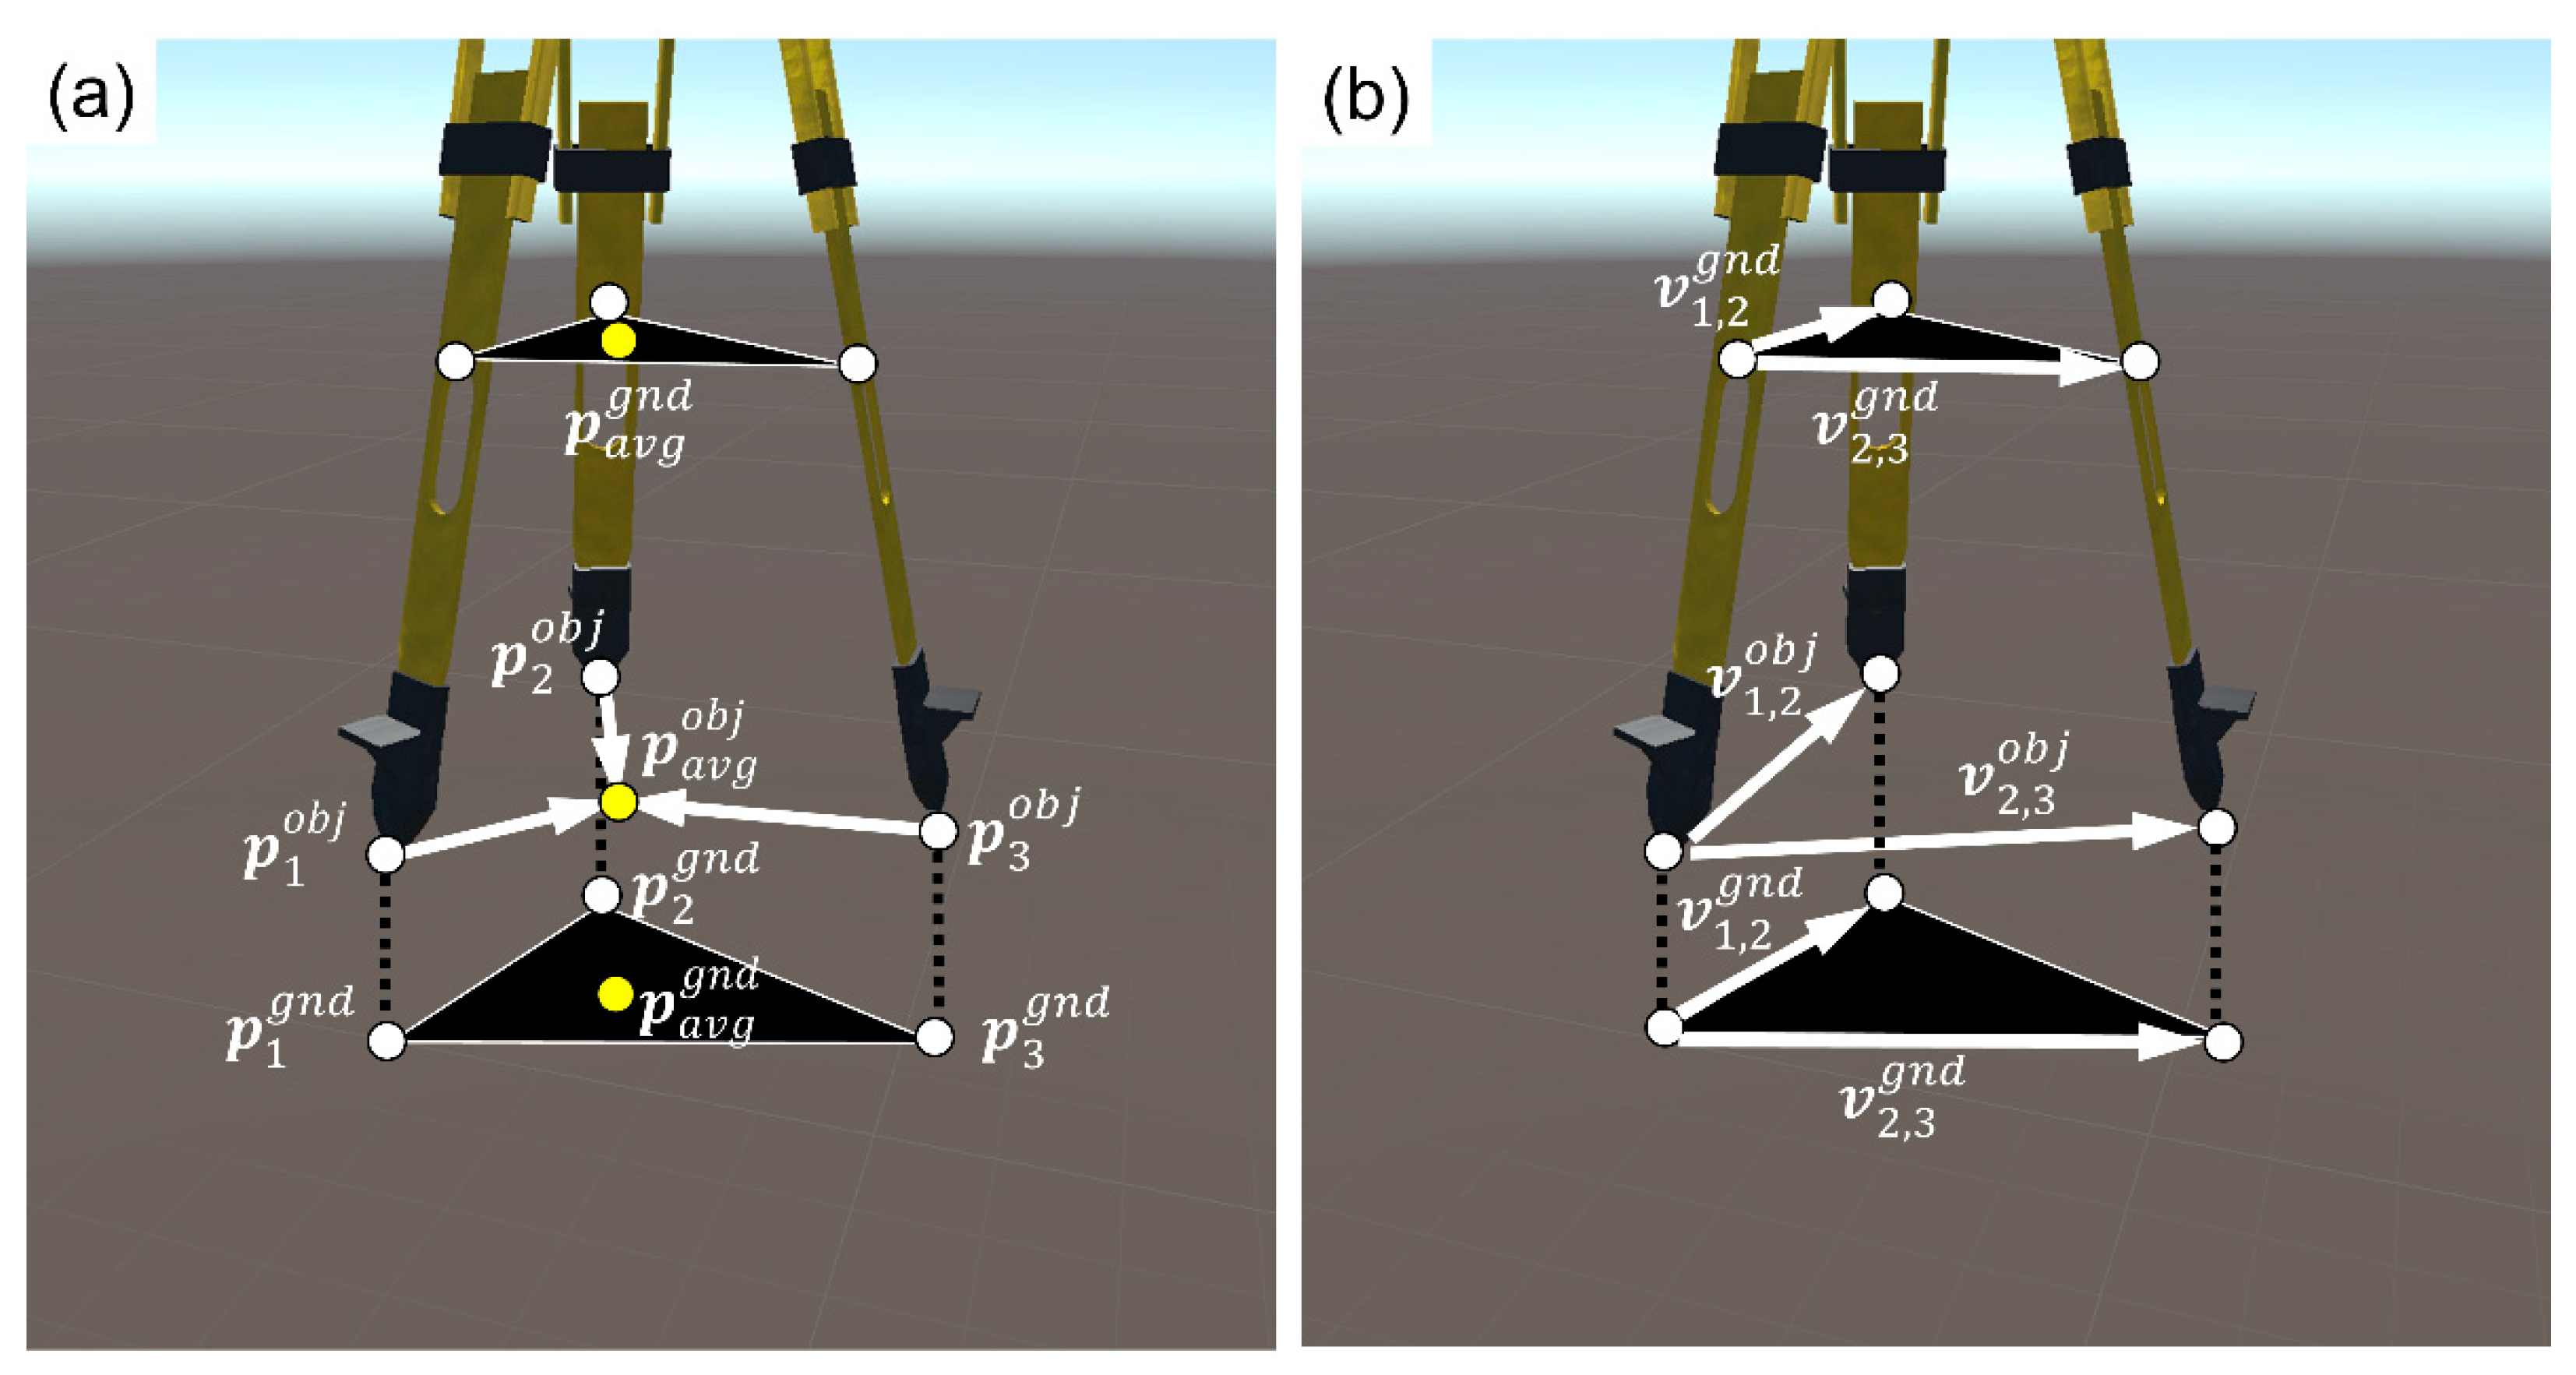
Our technique was originally developed for use with a tripod of varying length legs, and as a result, it works on any object with varying length legs or support points. The technique can be extended to objects with an unlimited finite number of supporting points, on any type of varying terrain. The process can be broken down into two main phases, the positioning phase and the rotating phase. To position the object, it is necessary to know the endpoint positions of each of the supports, for instance, the positions of the ends of the tripod legs. Given these points, we can then find an average point from these support points, where the object should rest (Figure 9a). We also need to find the corresponding ground point below the tripod, which is calculated from the intersection of the tripod legs with the ground (when the tripod intersects the ground) or the extension of the tripod legs, following the vertical direction, and the apparent intersection of them with the ground (when the tripod is on the air) (Figure 9a). The average three dimensional vectors are found as follows:
p a v g o b j = [ i = 1 n x i o b j n ,   i = 1 n y i o b j n ,   i = 1 n z i o b j n ]
p a v g g n d = [ i = 1 n x i g n d n ,   i = 1 n y i g n d n ,   i = 1 n z i g n d n ]
where p a v g o b j is the average three-dimensional vector of the object (tripod) calculated at the support points (endpoints of the tripod legs); n is the number of support points; and x i o b j , y i o b j , and z i o b j are the coordinates of the i th support point. p a v g g n d is the average three-dimensional vector of the ground, calculated as the intersection between the support points and ground or their apparent intersection in the case where the tripod is being held on the air. Terms x i g n d , y i g n d , and z i g n d are the corresponding ground coordinates of the i th support point.
By aligning p a v g o b j to p a v g g n d , we can position the object (tripod) to the ground. The next step is to align the normals that are formed by the support points and their intersection to the ground. We first get a normal of the object’s average point perpendicular to the hyperplane of the supporting points. Similarly, we can get a normal of the ground’s average point perpendicular to the hyperplane at the intersection of the supporting points with the ground. A hyperplane is formed by simply taking two vectors between the endpoints, as shown in Figure 10b. The vectors of the object hyperplane can be found using the following formulas:
v 1 , 2 o b j = p 1 o b j p 2 o b j
v 1 , 3 o b j = p 1 o b j p 3 o b j
where v 1 , 2 o b j and v 1 , 3 o b j are the hyperplane vectors for the object and p 1 o b j = [ x 1 o b j y 1 o b j z 1 o b j ] T , p 2 o b j = [ x 2 o b j y 2 o b j z 2 o b j ] T , and p 3 o b j = [ x 3 o b j y 3 o b j z 3 o b j ] T are the position vectors of the endpoints. For the ground hyperplane, we similarly have the following:
v 1 , 2 g n d = p 1 g n d p 2 g n d
v 1 , 3 g n d = p 1 g n d p 3 g n d
where v 1 , 2 g n d and v 1 , 3 g n d are the hyperplane vectors for the ground and p 1 g n d = [ x 1 g n d y 1 g n d z 1 g n d ] T , p 2 g n d = [ x 2 g n d y 2 g n d z 2 g n d ] T , and p 3 g n d = [ x 3 g n d y 3 g n d z 3 g n d ] T are the position vectors of the points formed by the intersection of the supporting endpoints to the ground.
We can get the normal of this hyperplane by taking the cross product of these two vectors and finding the object normal and ground normal:
n = ( v 1 , 2 o b j × v 1 , 3 o b j )
g = ( v 1 , 2 g n d × v 1 , 3 g n d )
where n is the object normal and g 
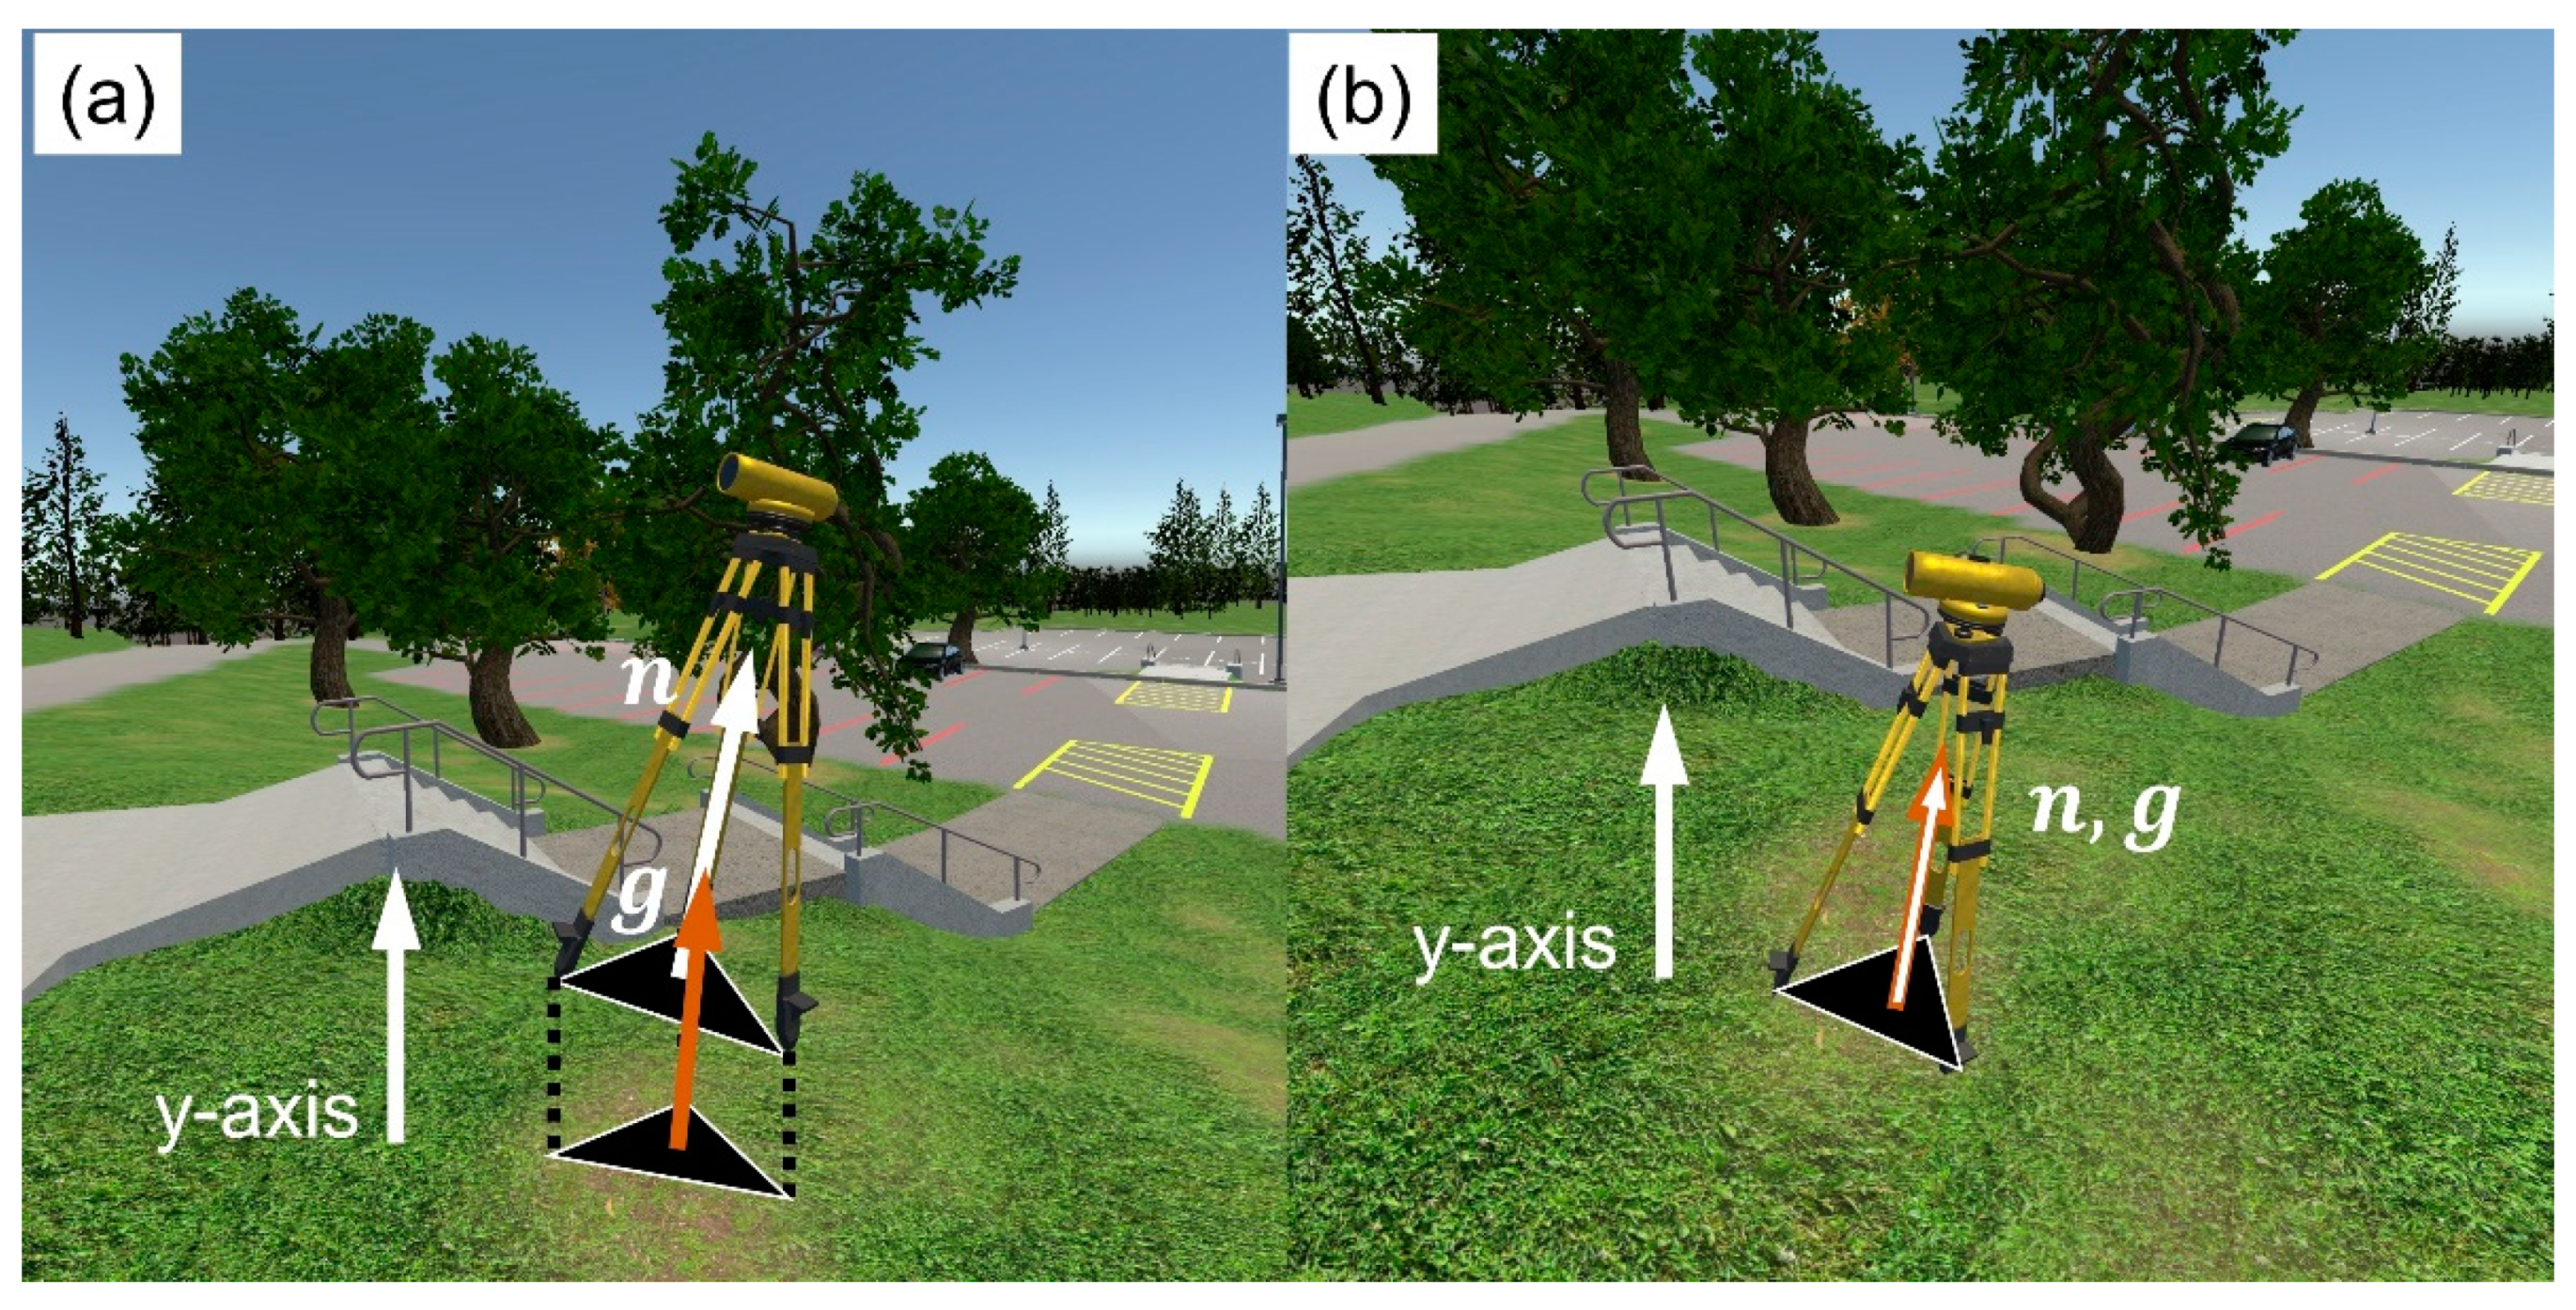
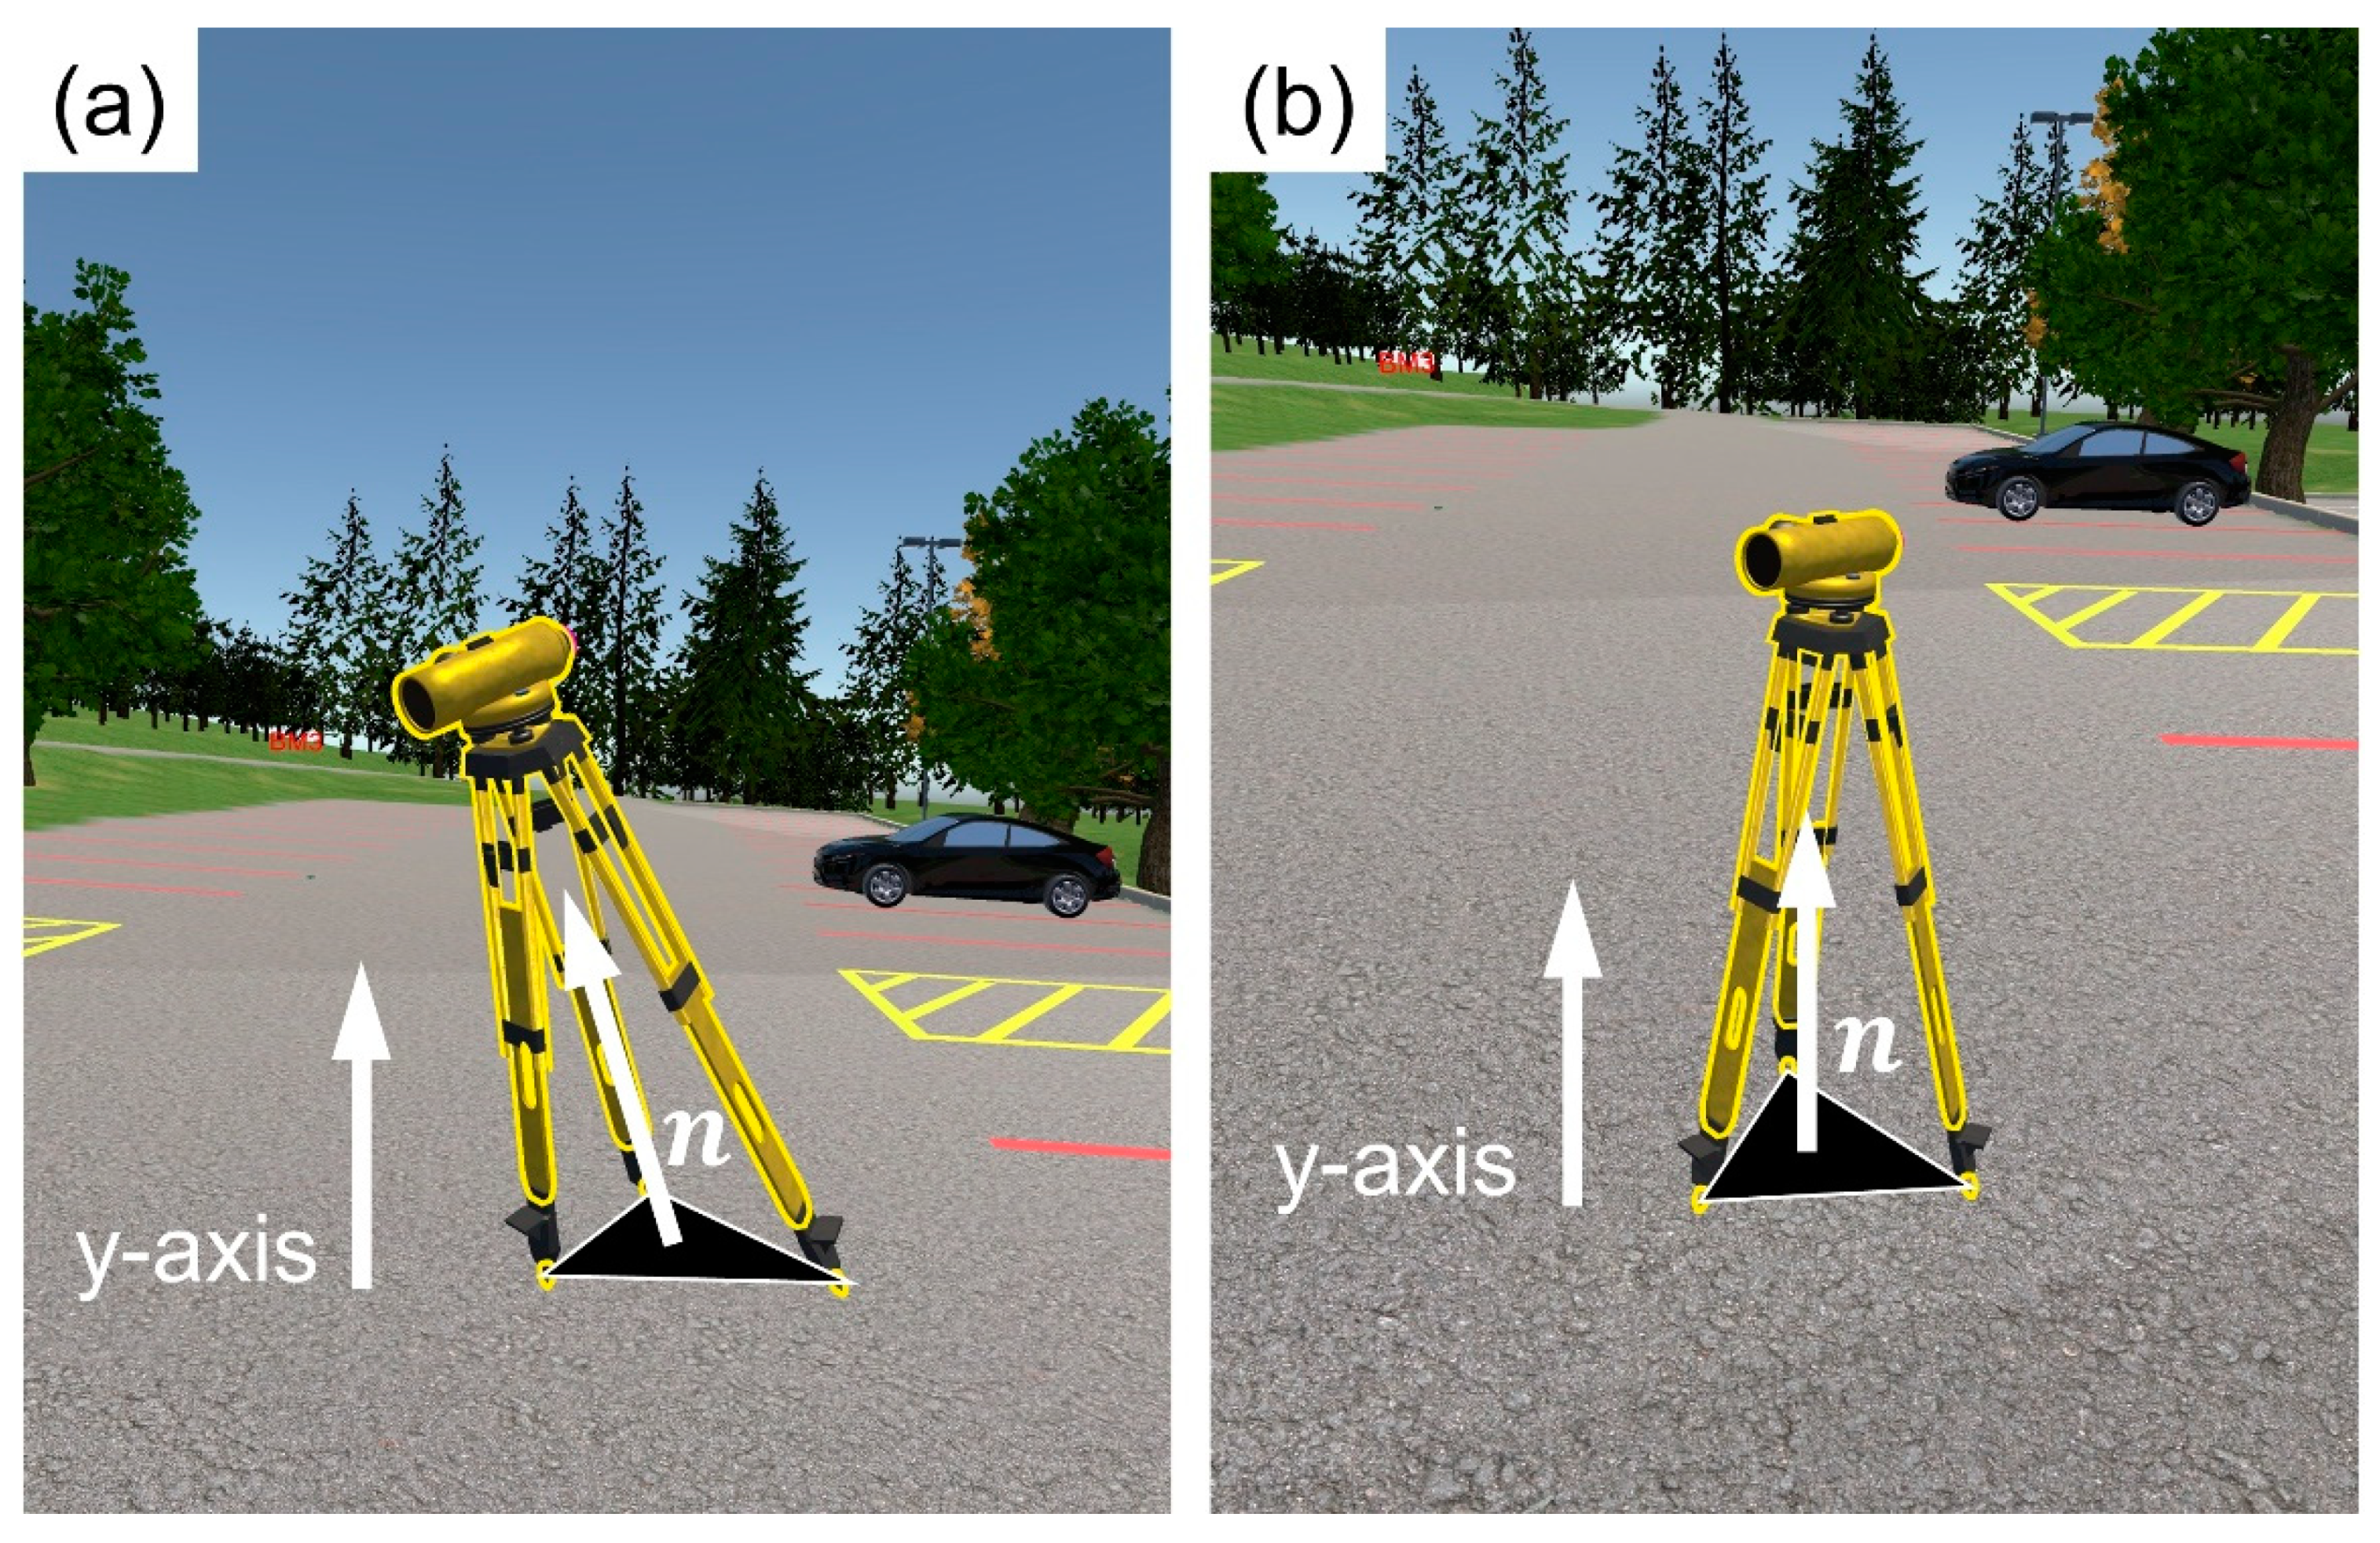
is the ground normal. If the support points are at equal height on flat terrain, then the object normal points directly in the up direction. In addition, if the support points move (e.g., when the tripod leg is extended), this object normal moves as well. The rotation of the tripod can be achieved if we simply align the object and ground normal vectors. The rotation angles are found as follows:
a = cos 1 ( n · g | n | | g | )
where a is a vector of the three rotation angles. When the object is rotated along the x-axis and z-axis angles (the y-axis rotation along the up and down direction is discarded), the support points become aligned with the ground, which completes the process. Figure 10a shows an example of the object and ground normals when the tripod is held in the air, and Figure 10b shows that the two normals align when the user drops the tripod.

2.6. Leveling of the Differential Level

2.6.1. Virtual Circular Bubble

When the user is making efforts to adjust tripod legs and screws, it is important to provide them with the same way of feedback in real time via a virtual circular bubble (Figure 11). The bubble is controlled directly from the rotation of the telescope’s vertical axis with respect to the up direction (y-axis in Unity). In the physical world, the up direction would correspond to a plumb line. To provide the circular bubble feedback to the user, we take the x-axis and z-axis rotation values and map these values onto a circle using the square to circle formulas:
X = u   1 ( v 2 2 )
Z = v   1 ( u 2 2 )
where X and Z are the corresponding cartesian coordinates to plot the bubble in the circle of Figure 11, and u and v are the rotation angles with respect to the x-axis and z-axis, respectively. The local circular bubble space is rotated when the instrument is rotated about the y-axis, which gives an accurate representation of the rotation of the equipment and bubble system, much like in the real world (Figure 11). The u and v rotation angles include the rough rotation of the tripod (coarse leveling) and the precise rotation of the tribrach screws (precise leveling) as follows:
u = u + u
v = v + v
where u and v are the rotation angles of the object normal (tripod movement) when the tripod is rotated about the y-axis, and u and v are the rotation angles of the telescope (tribrach movement) when the instrument is rotated about the y-axis.

2.6.2. Rough Leveling (Tripod Legs)

Rough leveling of the instrument commences when the user adjusts the tripod legs, which roughly aligns the object normal with the “up” direction ( u and v rotation angles from Equations 12 and 13). Then, the tribrach screws are used to achieve precise leveling of the instrument, which aligns the telescope axis, which is perpendicular to the telescope’s collimation axis, with the up direction (y-axis). The user can select each individual tripod leg (e.g., Figure 11). Using the sliding bars and fine control arrows (Figure 11a), the user can expand or collapse each leg by about 50 cm to achieve approximate/coarse leveling. The coarse circular vial depicts an area that ranges from −3° to +3°, and the fine arrow buttons change the rotation by 1′. Therefore, after this step, the instrument will be a few degrees to a few minutes from being leveled.

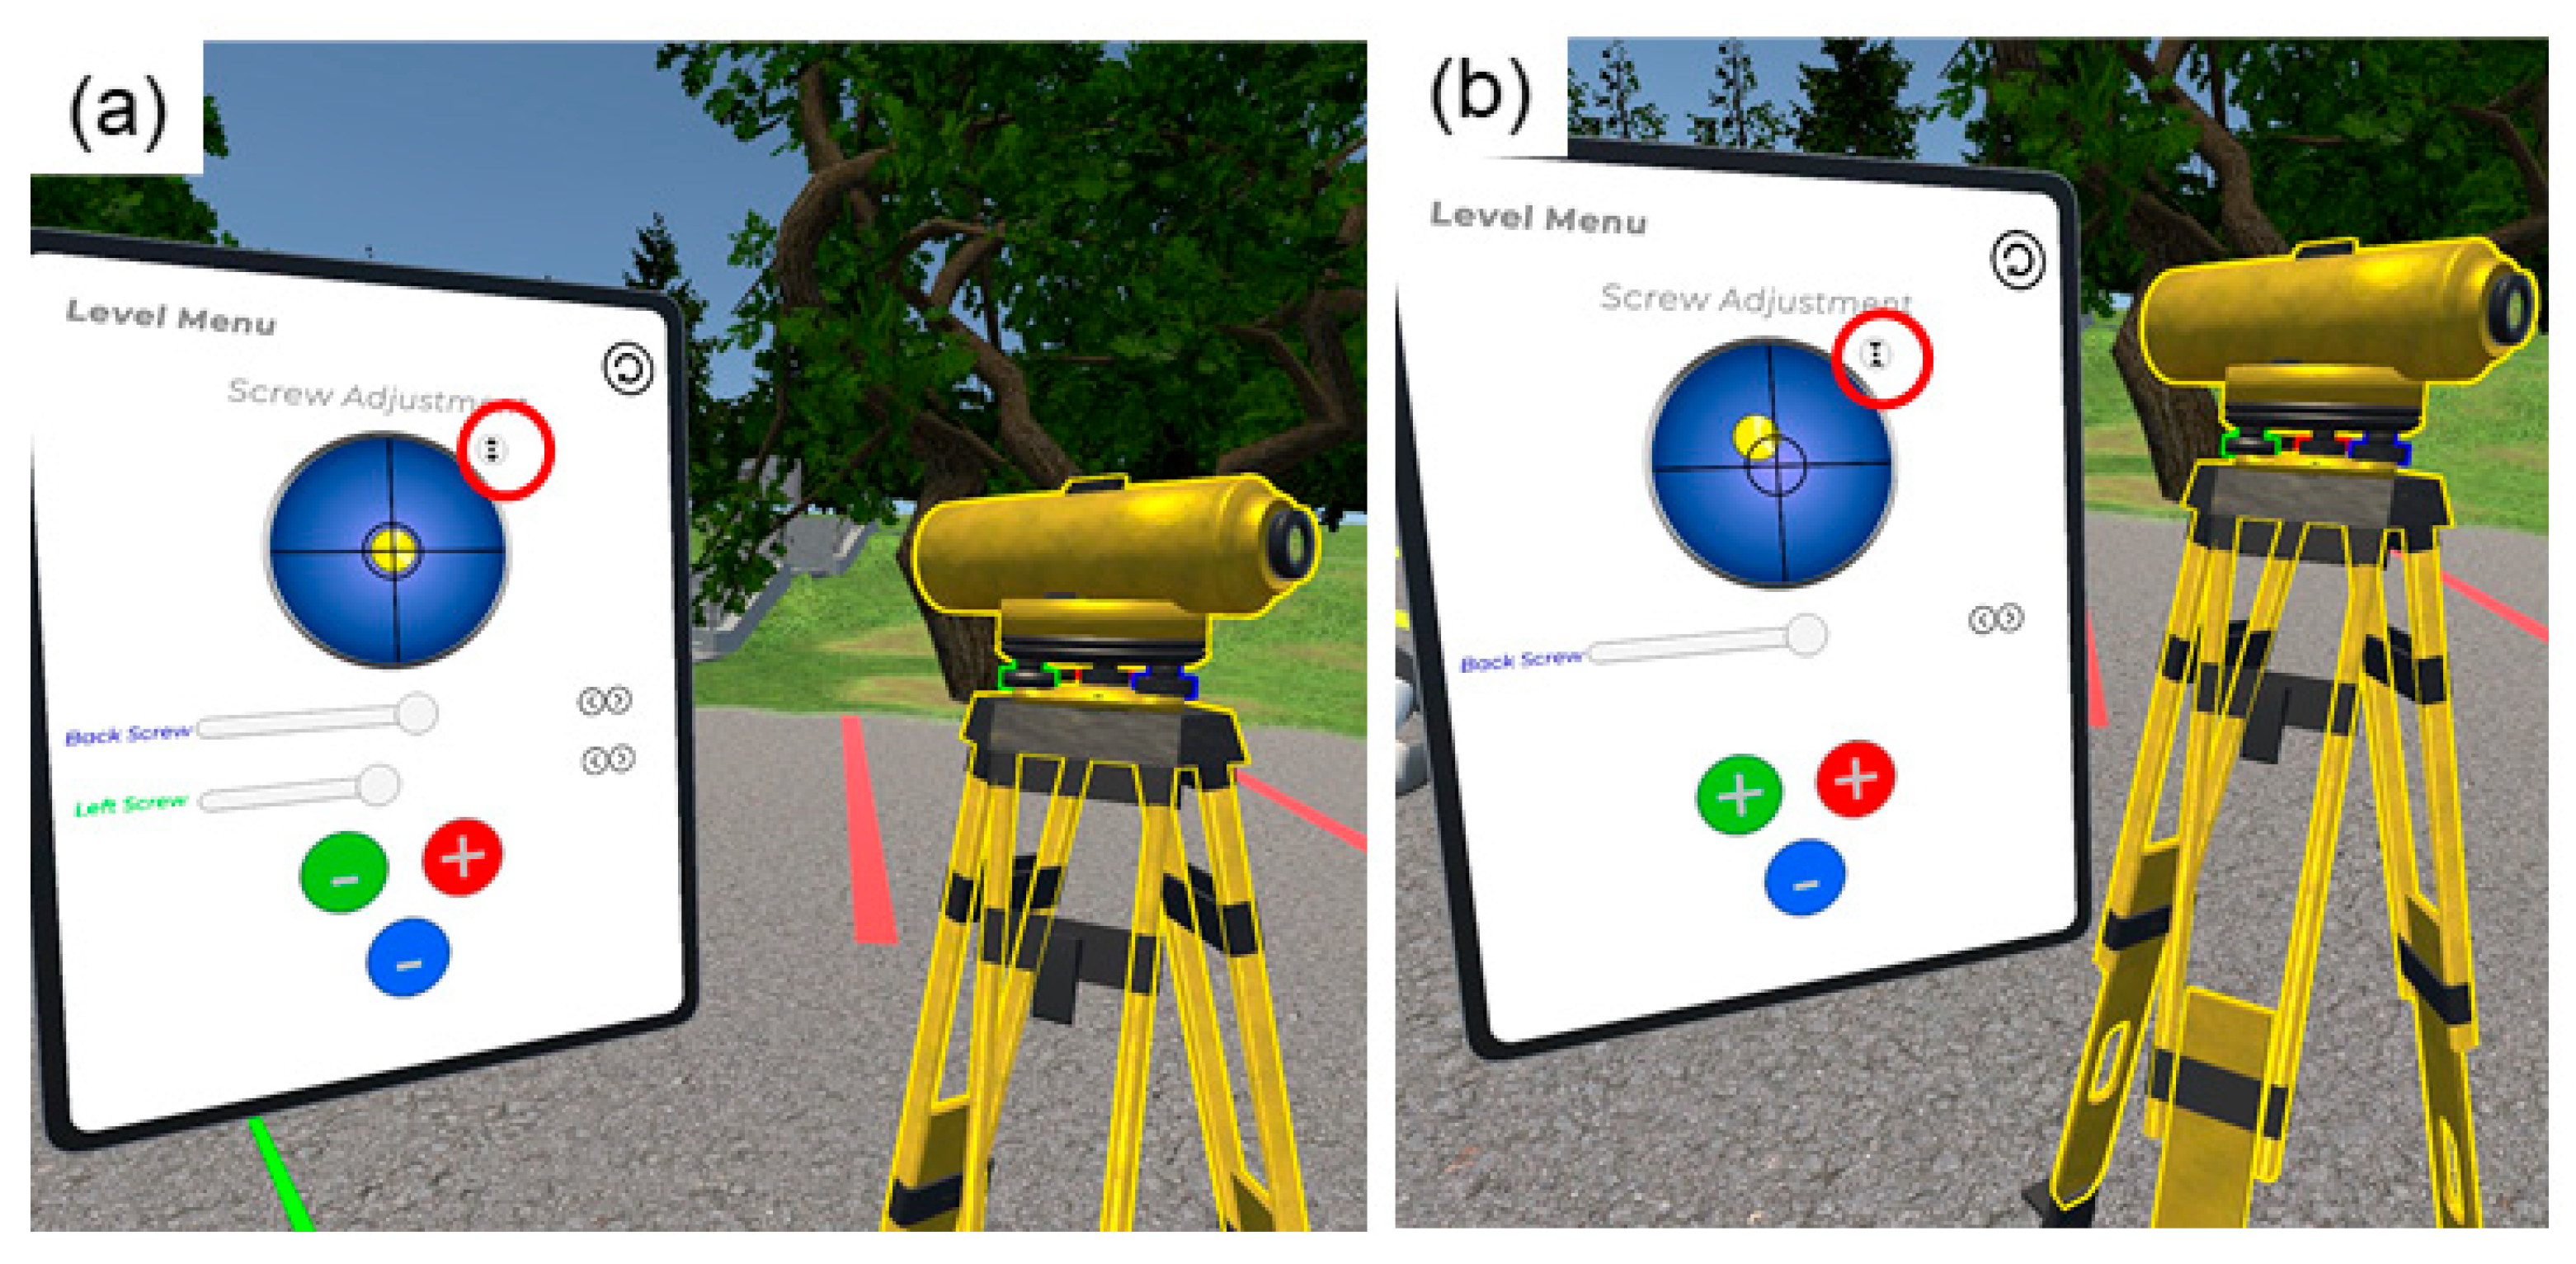
2.6.3. Precise Leveling (Screw Rotation)

The tribrach screws create a fine rotation between the telescope’s vertical axis and the up direction. In the physical world, the rotation of the screws translates to a physical change in the height of the tribrach screws. In VR, when the user rotates the screws, the telescope is relatively rotated with respect to the screws. The screws’ “pseudo heights” vary from −1 to 1 (unitless). Then, we can assign a rotational range of values to those values. In this implementation, we have assigned −1 to correspond to a rotation of −3° and 1 to correspond to a rotation of +3°. By changing this correspondence, we can increase or decrease the allowable tilt of the telescope. We map the three “pseudo height” values of the screws to the x- and z-axis rotation of the telescope. Recall that, in Unity, the y-axis corresponds to the up axis. We do this mapping by using the left screw for the positive x-axis rotation and half of the negative z-axis rotation (assuming the front is facing in the positive x-axis direction), the right screw as the negative x-axis rotation and half of the negative z-axis rotation, and the back screw as the positive z-axis rotation. The actual formulas for finding the rotation values are as follows:
u = l 2 r 2
v = b ( l 2 + r 2 )
where u is the x-axis rotation of the telescope in degrees, v is the z-axis rotation of the telescope in degrees, b is the back screw height, l is the left screw height, and r is the right screw height. For example, in our implementation, if the left screw is moved by 0.5 and right screw remains 0, then the u value becomes 0.25, which, in degrees, corresponds to 0.75°. With the back screw also at 0, the v value becomes −0.25, which, in degrees, corresponds to −0.75°. The combination of screw and leg adjustments by the user leads to a leveled instrument as in real-life surveying.

3. Results and Discussion

3.1. Efficient Tripod Positioning

In surveying, the legs on the tripod are adjusted to level the instrument based on the encountered ground shape. The positioning must be recalculated in every frame to give a smooth transition. For a pleasant and optimal VR experience, the rate of switch, called frames per second (FPS), should be maintained at least at 60 FPS [53], while Oculus recommends 90 FPS [54]. Figure 12 shows a performance comparison when a full physics simulation of the tripod legs is used (Figure 12a) versus our technique (Figure 12b). The dark green color shows the execution time allocation due to rendering, the blue is our code implemented with physics, the orange is other related physics functions in Unity, and the light green is background functions of Unity. When the full simulation is used, frames routinely spike to 66 ms, which corresponds to 15 FPS and results in unpleasant lag. The process using our technique takes far less than 10 ms, maintaining 60 FPS. Therefore, our approach does not create any additional burden. We found this performance improvement to be vital to the simulation, as smooth adjustments of different pieces of equipment would not be possible without it. The computer system used for this simulation had an Intel i7-8700 CPU (3.2 GHz), 64 GB of RAM, and a NVIDIA GeFORCE GTX 1060 6GB GPU.

3.2. Leveling of the Differential Level Instrument

Figure 13 shows the tripod roughly leveled (within ±3°) and the object normal roughly aligned with the y-axis after manipulation of the tripod legs in VR. Next, the user moves to precise leveling using the tribrach screws. To make manipulation of tribrach screws more realistic, we color coded the tribrach screws, and restricted the user to select up to two screws at a time (Figure 14a). The plus signs add a corresponding tribrach screw to the level menu and the minus signs remove them. For example, in Figure 14a, the green and blue screws have been added. This resembles the main leveling technique used by surveyors of moving the two tribrach screws first and then the third one separately. In this example, the third screw is the red one. In earlier versions of the software [38], the circular level vial in Figure 14a depicted a range of −1° to +1°, and the fine arrow buttons changed the rotation by 0.01° (36′′). For leveling operations, this is not sufficient to achieve high leveling accuracy, as automatic levels are equipped with compensators that often allow leveling to within ±0.3′′ and can achieve accuracies of about 1 mm in 1 km [32]. This was changed to a two-step approach for the tribrach screws. The ranges in the circular level vials in Figure 14a were made the same as the tripod legs, thus the vial now depicts a range of −3° to +3°, and the fine arrow buttons change the rotation by 1′. Then, by selecting a toggle button, the user moves to a second, zoomed/precise, circular vial screen that allows precise leveling (Figure 14b). In this second screen, the vial depicts a range of −3′ to +3′ and the fine arrow buttons change the rotation by 1′′. This means that the instrument can now be leveled to within 1′′ by the users, which corresponds to an error of 0.5 mm at 100 m. Students are not expected to conduct level loops that are longer than 100–200 m, as that would necessitate very large virtual environments and spending more than 20–30 min in VR. This can increase nausea symptoms [55,56,57] and, therefore, this level of precision is sufficient for most surveying virtual labs. It is also worth noting that we can add a small “fixed” tilt to the telescope and replicate the collimation error [38]. This is a great addition for demonstration purposes and creating special labs with a focus on balancing the backsight and foresight distances or with a focus on calibration of level instruments and estimation of the collimation correction.

3.3. Instructional Feedback

In such experiential learning settings, after the completion of surveying labs, it is important for students to check their achieved accuracy and identify any mistakes during data collection. Through reflection and discussion with the instructor, the students can gain experience, improve their skills, and make connections between theory with practice. In physical labs, it is often difficult for instructors to provide meaningful feedback, as information about the instrument’s condition during a measurement is not often available. In addition, students often make mistakes in their observations, which leads to large misclosures (i.e., the survey does not meet the accuracy requirements), but it is often impossible for the instructor and students to identify blunder measurements in leveling. Virtual reality can address these challenges as the instrument’s condition during a measurement is known, and we can mathematically derive the true measurements that students should observe.
The PDF lab report is an important instruction tool of the software, as it provides meaningful feedback to students. Every time the user accesses the fieldbook to record a measurement, we capture the conditions of the environment. Specifically, we capture the time of how much off-level is the rod, how much off-level is the instrument, the distance between the instrument and rod, the true rod measurement, the elevation difference between the instrument and the rod, and the focus state of the instrument, as well as a screenshot of the rod and the fieldbook. Thus, students can compare actual and observed measurements, understand their errors, and identify mistakes in their surveying procedures.
Figure 15a shows a real case example, where the user recorded a measurement, but did not accurately level the instrument. The recorded measurement is 0.496 m. The user realized it and went back to relevel both the rods and instrument (Figure 15b). The recorded measurement is now 0.482 m. In addition, we see that the true measurement (the measurement that the user should have observed for the given leveling state of the instrument and rod) is within 1 mm of the observed measurement. This kind of feedback is unattainable during physical labs and can help students reflect on their mistakes and improve their surveying skills as well as comprehend theoretical concepts in greater depth.

3.4. Virtual Leveling Examples

We provide two comprehensive leveling examples to demonstrate how differential leveling can be done in VR. Figure 16a shows the leveling exercise for the first example, which is a three-benchmark loop. The figure shows the benchmark (BM) location and the instrument setup locations. The differential level instrument is set up in the “setup” locations, and the rod is set up in the “BM” locations. We start at setup 1, where we get a backsight measurement to BM1 and a foresight measurement to BM2. In the second setup, we get a backsight measurement to BM2 and a foresight measurement to BM3. Then, in the third setup, we get a backsight measurement to BM3 and a foresight measurement to BM1. Getting a final foresight measurement back to BM1 completes the level loop, and allows the surveyor to get a misclosure, as the sum of backsights minus the sum of the foresights should be zero. The second exercise is using the city environment (Figure 16b). The lab starts from BM1 and closes to BM2 with a requirement to place a temporary benchmark (TPBM1) at the corner of the street. In this case, we know the elevations of both BM1 and BM2; therefore, we can get a misclosure and check the accuracy of the survey. Note that, in the physical world, the surveyors need to balance the backsight and foresight distances to within few meters (i.e., setup the instrument approximately in the middle of the backsight and foresight BMs) to reduce the collimation error of the instrument [32], which was not simulated in our implementations. Both examples are simple and designed considering that users should not spend more than 20–30 min in VR. The three-benchmark loop example took 35 min to complete, and the point-to-point level line took 20 min to complete. A recording of the city lab can be found at this link: https://psu.mediaspace.kaltura.com/media/Dimitrios+Bolkas%27s+Personal+Meeting+Room/1_5lt5lgxx (accessed on 21 April 2021).
Table 1 shows the fieldbook measurements for the three-benchmark loop as well as the true measurements. Note that the true measurement corresponds to the middle crosshair reading at a given leveling state of the instrument. It does not take into account any error introduced as a result of misleveling of the instrument and rod. Therefore, the true measurements in Table 1 correspond to the measurements that the user should have observed based on the existing leveling state of the instrument and rod. The actual height differences between a backsight and foresight point can be retrieved from the PDF report, as in each measurement, we capture the height difference between the p a v g o b j and the base of the leveling rod. The achieved misclosure from this trial is −0.001 m. A comparison between the observed and true measurements shows that the user was always within 1 mm. The misclosure using the true measurements was zero, which also indicates that the instrument was always leveled accurately. Any deviation from zero in the misclosure of the true measurement indicates misleveling errors (either of the rod or instrument). The leveling rod was always leveled with an accuracy of 1′ or better and leveling of the instrument was always within 0′′ to 2′′. Therefore, this −0.001 m misclosure corresponds to random observational errors. In the three-benchmark loop example, the backsight and foresight distances have been balanced well, with the exception of the first setup owing to the uneven terrain and the fact that the user had to go closer to the backsight rod to ensure a measurement. The distances, converted from virtual paces, are within 1 m of the actual distances, showing that the virtual pacing tool is sufficient to support virtual leveling procedures. Of note is that, in the third setup, there is a tree that somewhat blocks the view in the backsight measurement of BM 3. The user here does not have many options, because, owing to the high elevation difference between BM 3 and BM 1 (about 2.4 m), we would need to add another setup up or the user would end up reading the rod too high (rod readings of 4 m to 5 m). This is not a good field practice as higher errors can be introduced. In the first attempt, the rod was not readable because the tree leaves were blocking the view. Therefore, the user had to slightly move the rod and relevel the instrument. The leaves were still blocking part of the rod, but recording a measurement was possible, as the leaves moved under the virtual wind at certain times (Figure 17). The measurement in this case was 3.351 m. This highlights that surveying labs in immersive and interactive VR can be very realistic and students can experience challenges that are often encountered in the field.
Table 2 shows the corresponding results for the second example (point-to-point/level line) in the city environment. The terrain of the city environment is relatively flat, which is also highlighted by the recorded backsight and foresight measurements. The main outcome here is to help students understand the hazards in the city environment and acknowledge that instrument setups should be on the sidewalk for safety (Figure 15b). The true elevation difference between BM 1 and BM 2 that we are trying to observe is −0.153 m. As shown in Table 2, this value was also found using the true measurements from the output report. The observed difference was −0.154 m, which also indicates a 0.001 m difference due to observational errors. The height of the temporary benchmark, after distributing the misclosure, was found to be 341.579 m. As with the previous example, the rod was leveled with an accuracy of better than 1′ and the instrument with an accuracy of 1′′.

4. Conclusions

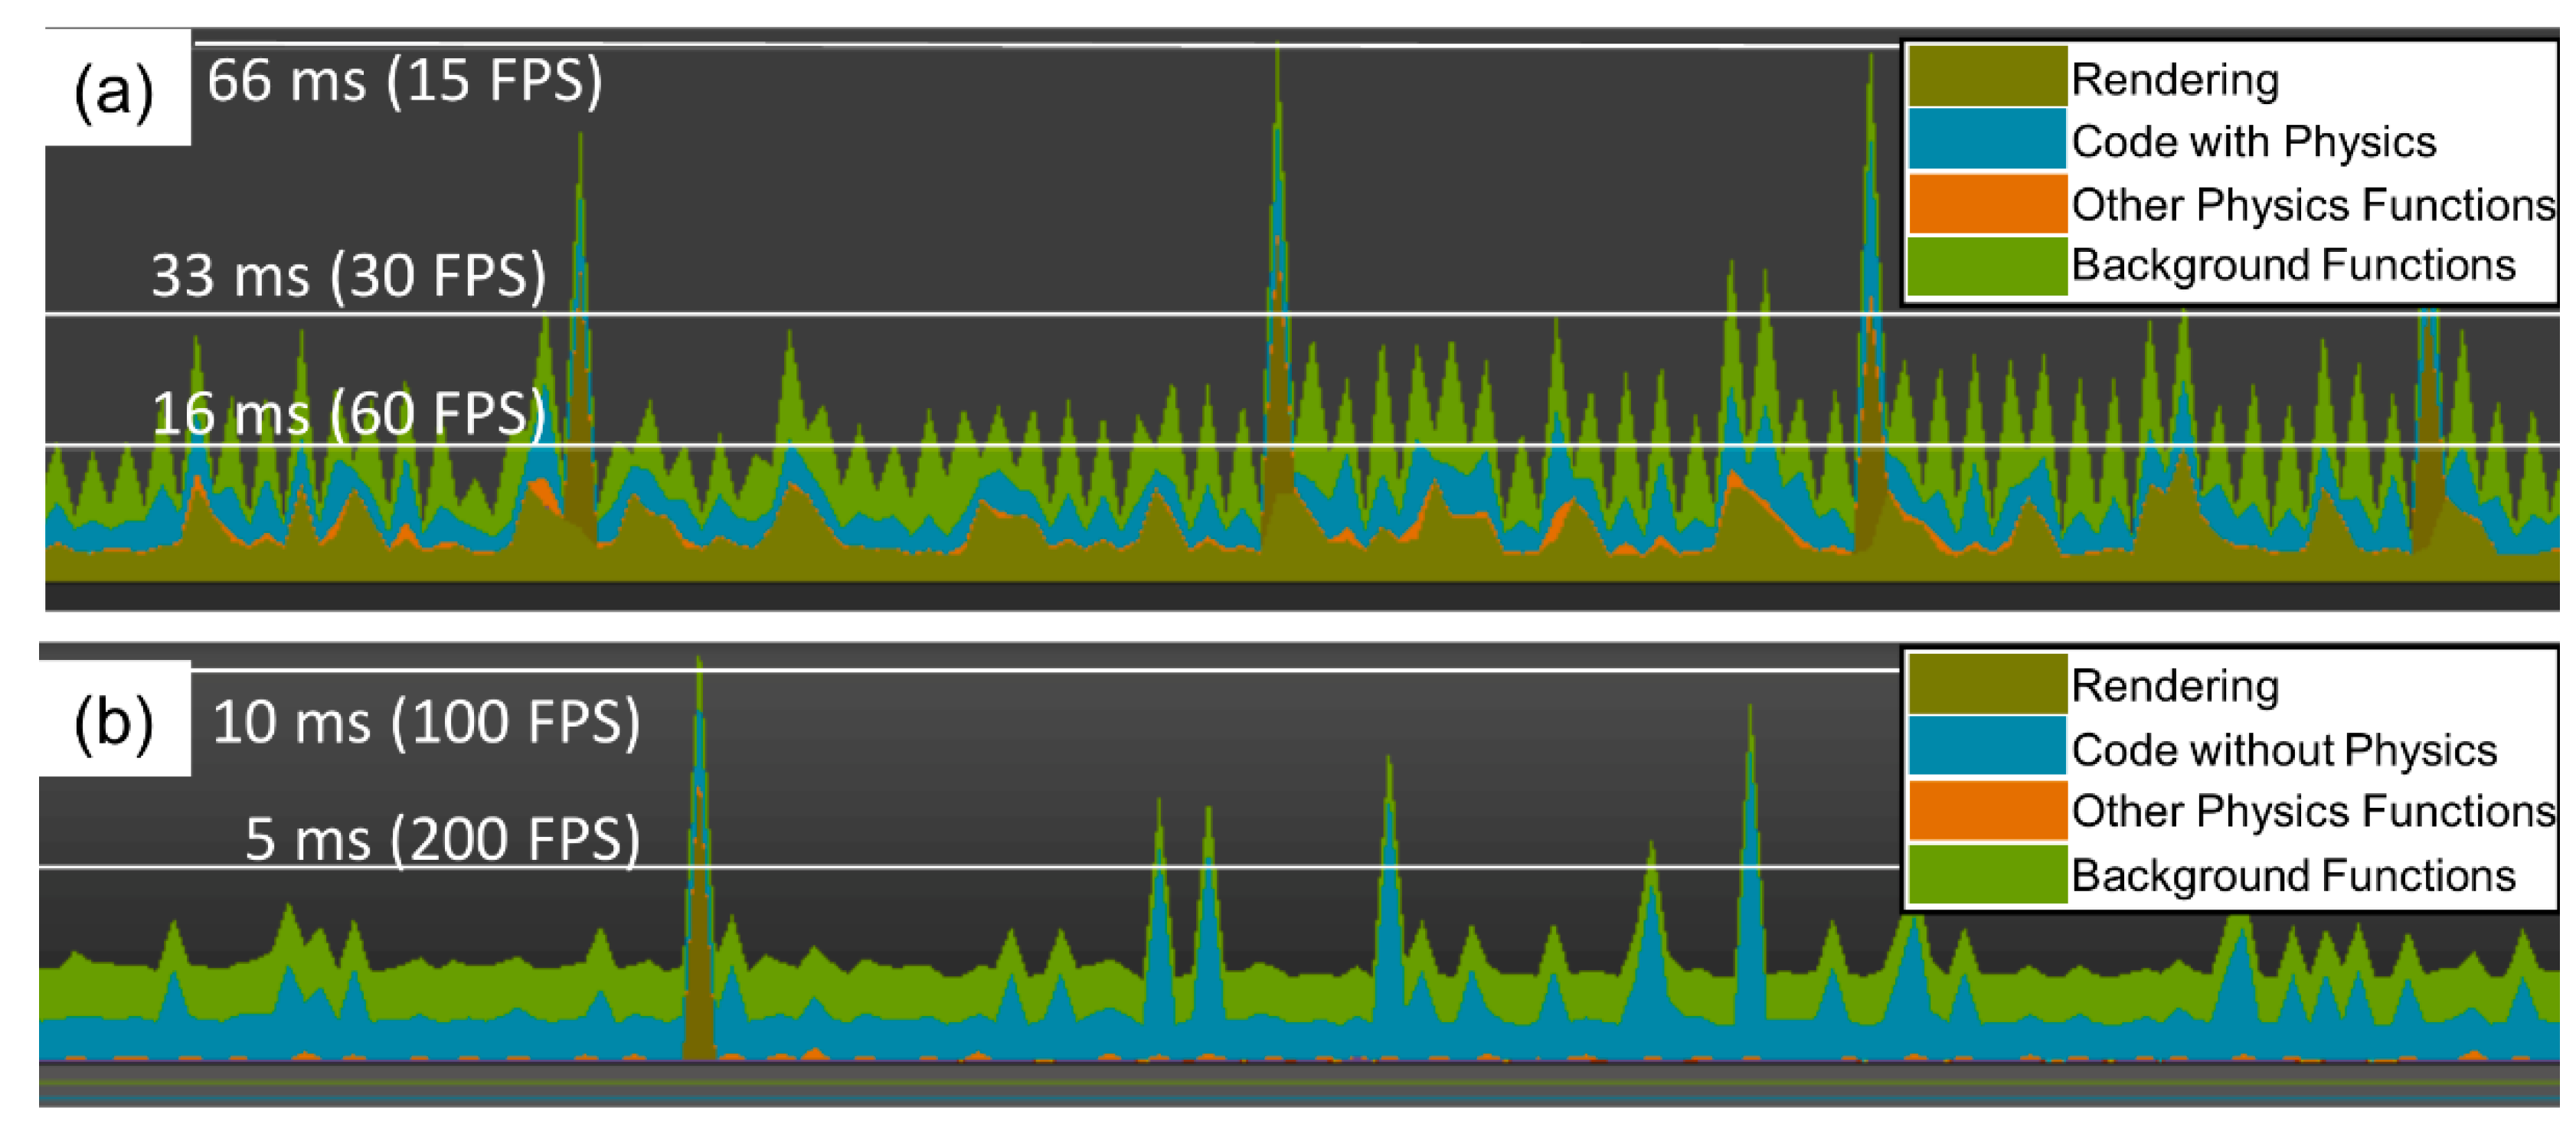
We presented a new VR simulation for surveying engineering activities. Specifically, we demonstrated its efficacy in the field of surveying by conducting academic labs in VR. The leveling simulation is immersive and interactive, giving students a first-person experience. The students can conduct virtual leveling much like in the physical world. They can grab, move, center, and level a leveling rod. They can grab, move, and level a differential level instrument. Even simple, but important instrument functions, such as instrument and eyepiece focusing, were replicated. In terms of leveling, students adjust tripod legs to achieve coarse leveling, before moving to adjusting the tribrach screws to achieve precise leveling. This faithfully replicates the leveling process that students encounter in the physical world. In addition, students can record measurements in a virtual fieldbook. Virtual replication of the differential level instrument proved to be the most difficult task, as it had to match its real-world counterpart to a level of accuracy where the student would be able to pick up skills in the simulation and transfer them to the real world. The equipment and the landscape had to work smoothly together to create a continuous experience that does not hinder immersion. We developed a novel technique for leveling multi-legged objects on variable terrains. This technique models the geometric changes of the tripod movement and eliminates the physical simulation, which increases efficiency dramatically and ensures that 60 FPS are always maintained, giving a pleasant experience to users.
Through VR, we can create multiple surveying scenarios in several virtual environments; thus, training students in a variety of surveying conditions that many times is difficult (and sometimes impossible) to replicate in the physical world. Such VR labs can be used to support surveying education when labs are cancelled as a result of weather. There are still some barriers with respect to the needed computer hardware to make this software available for remote learning. The authors are working on adapting the software in Oculus Quest 2, which is untethered, and software can be loaded directly to the HMD). However, at this point, some simplifications on the virtual environment and textures might be necessary.
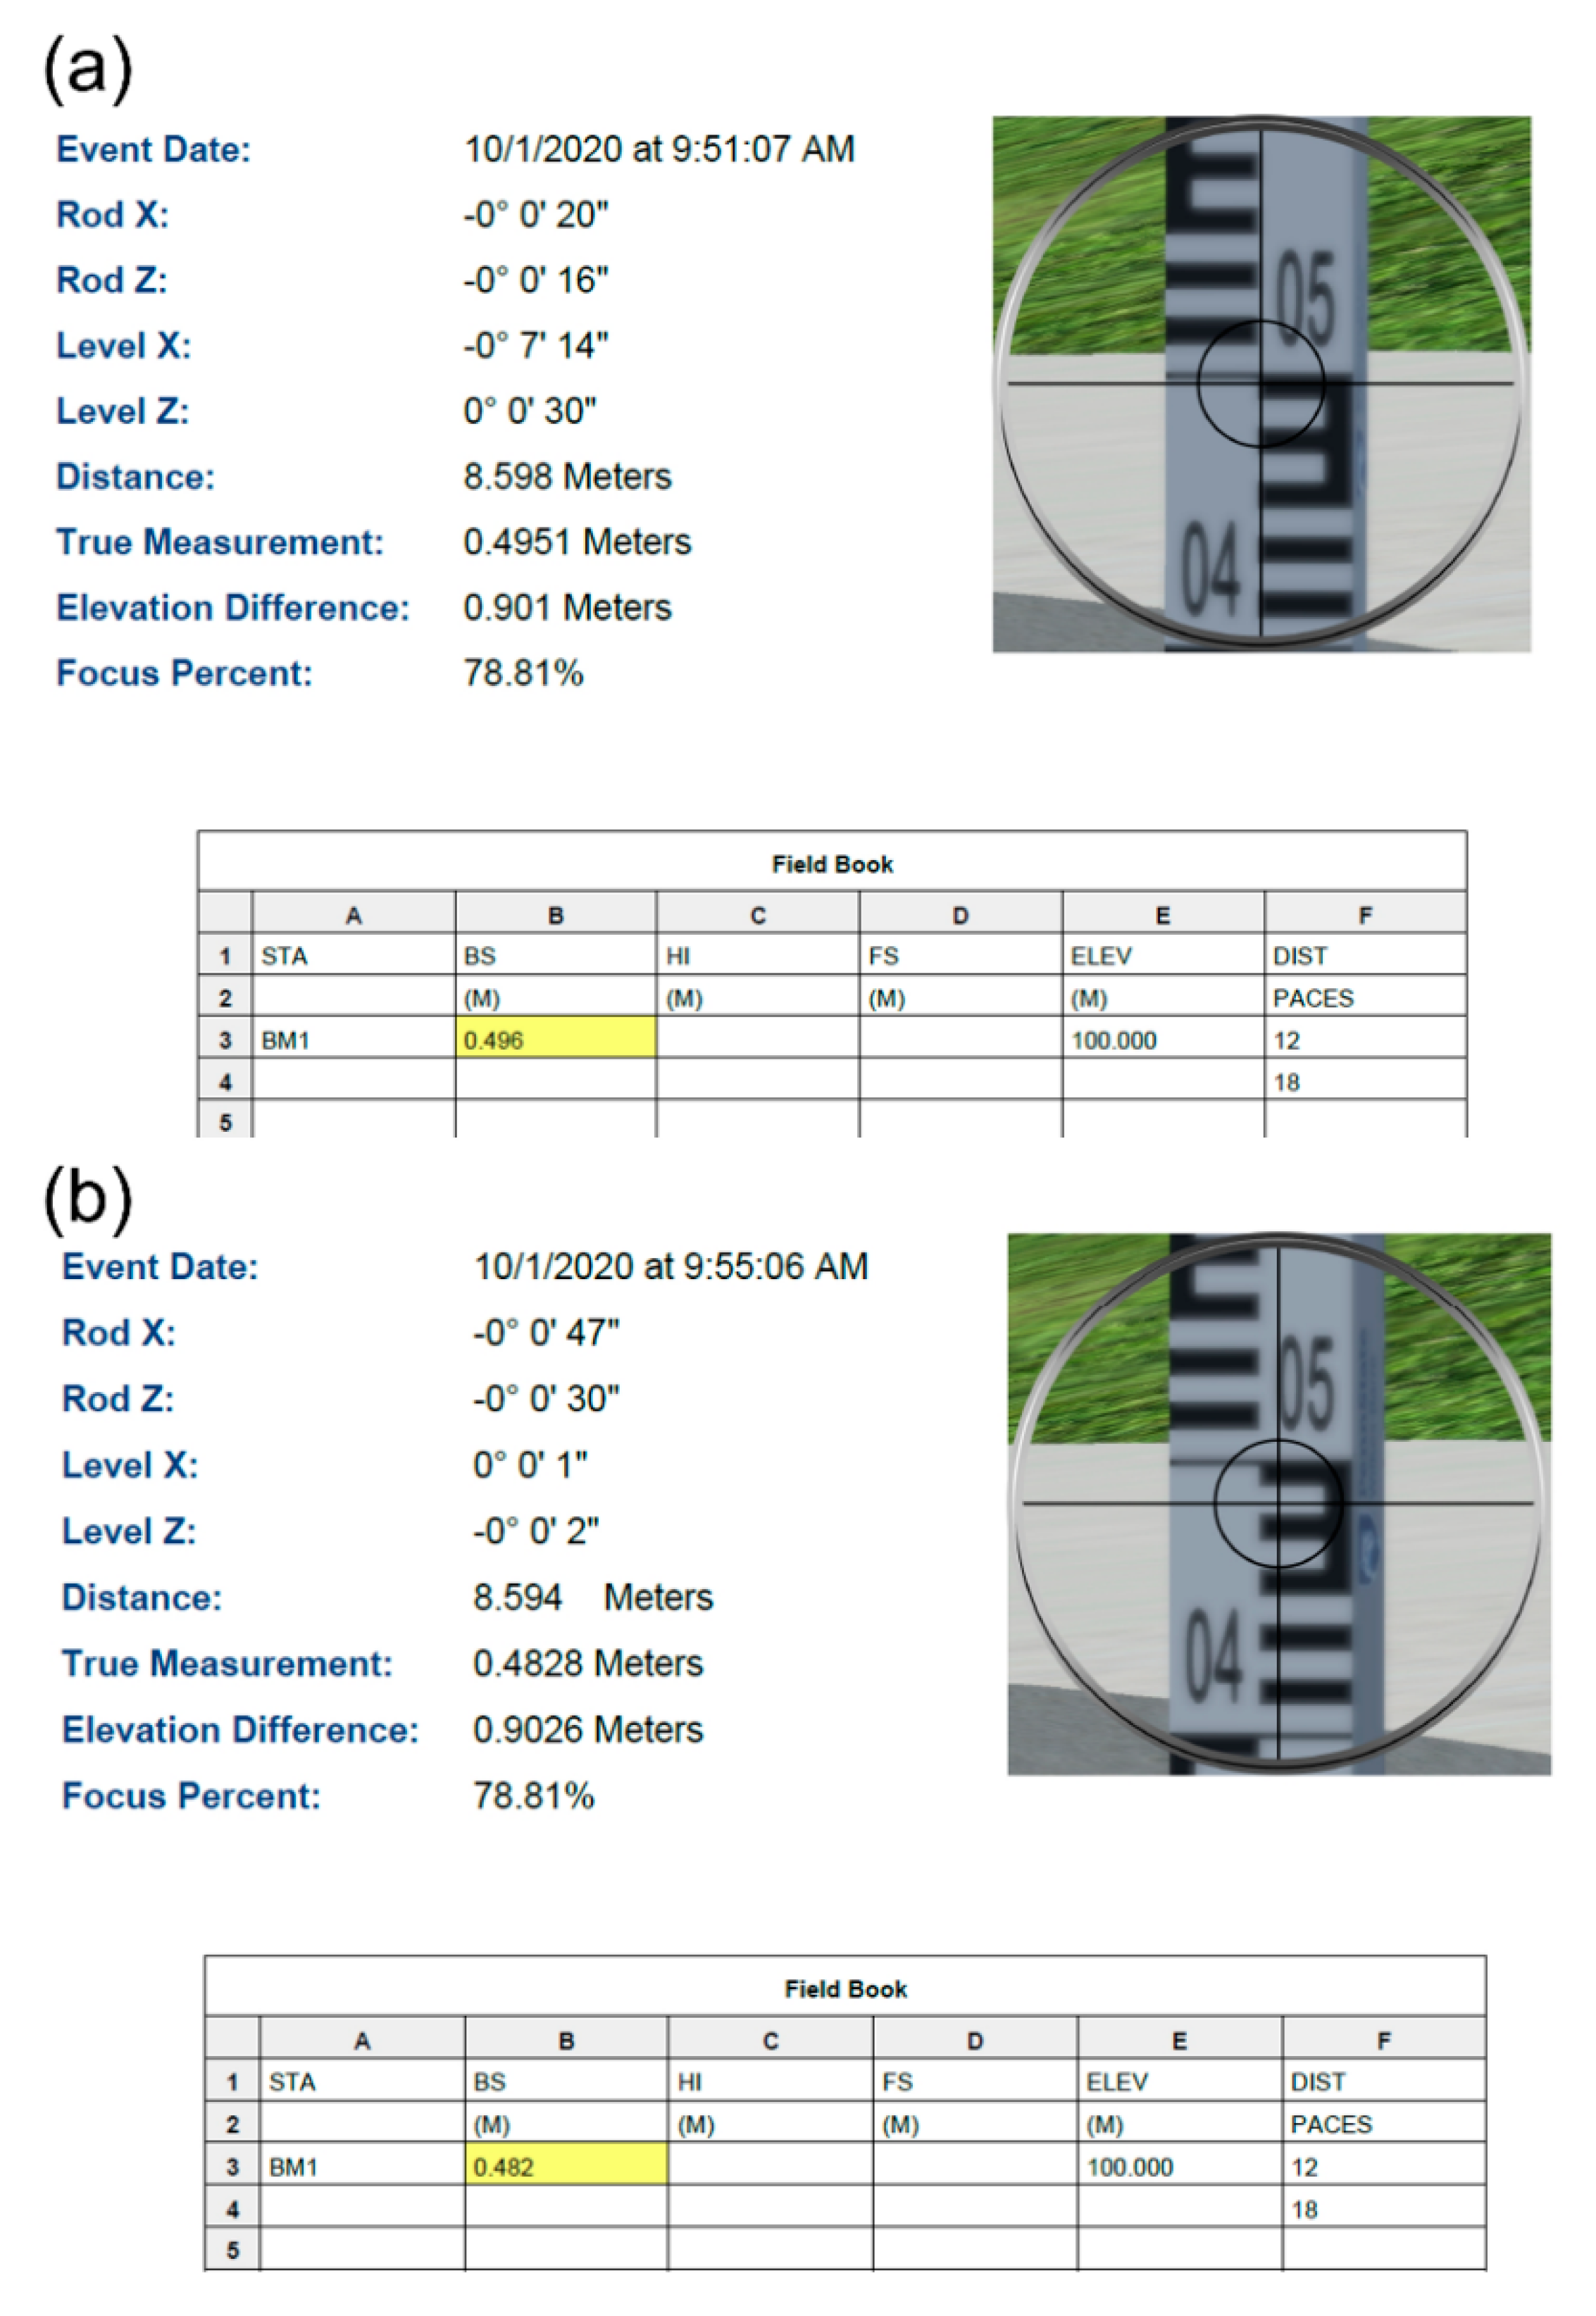
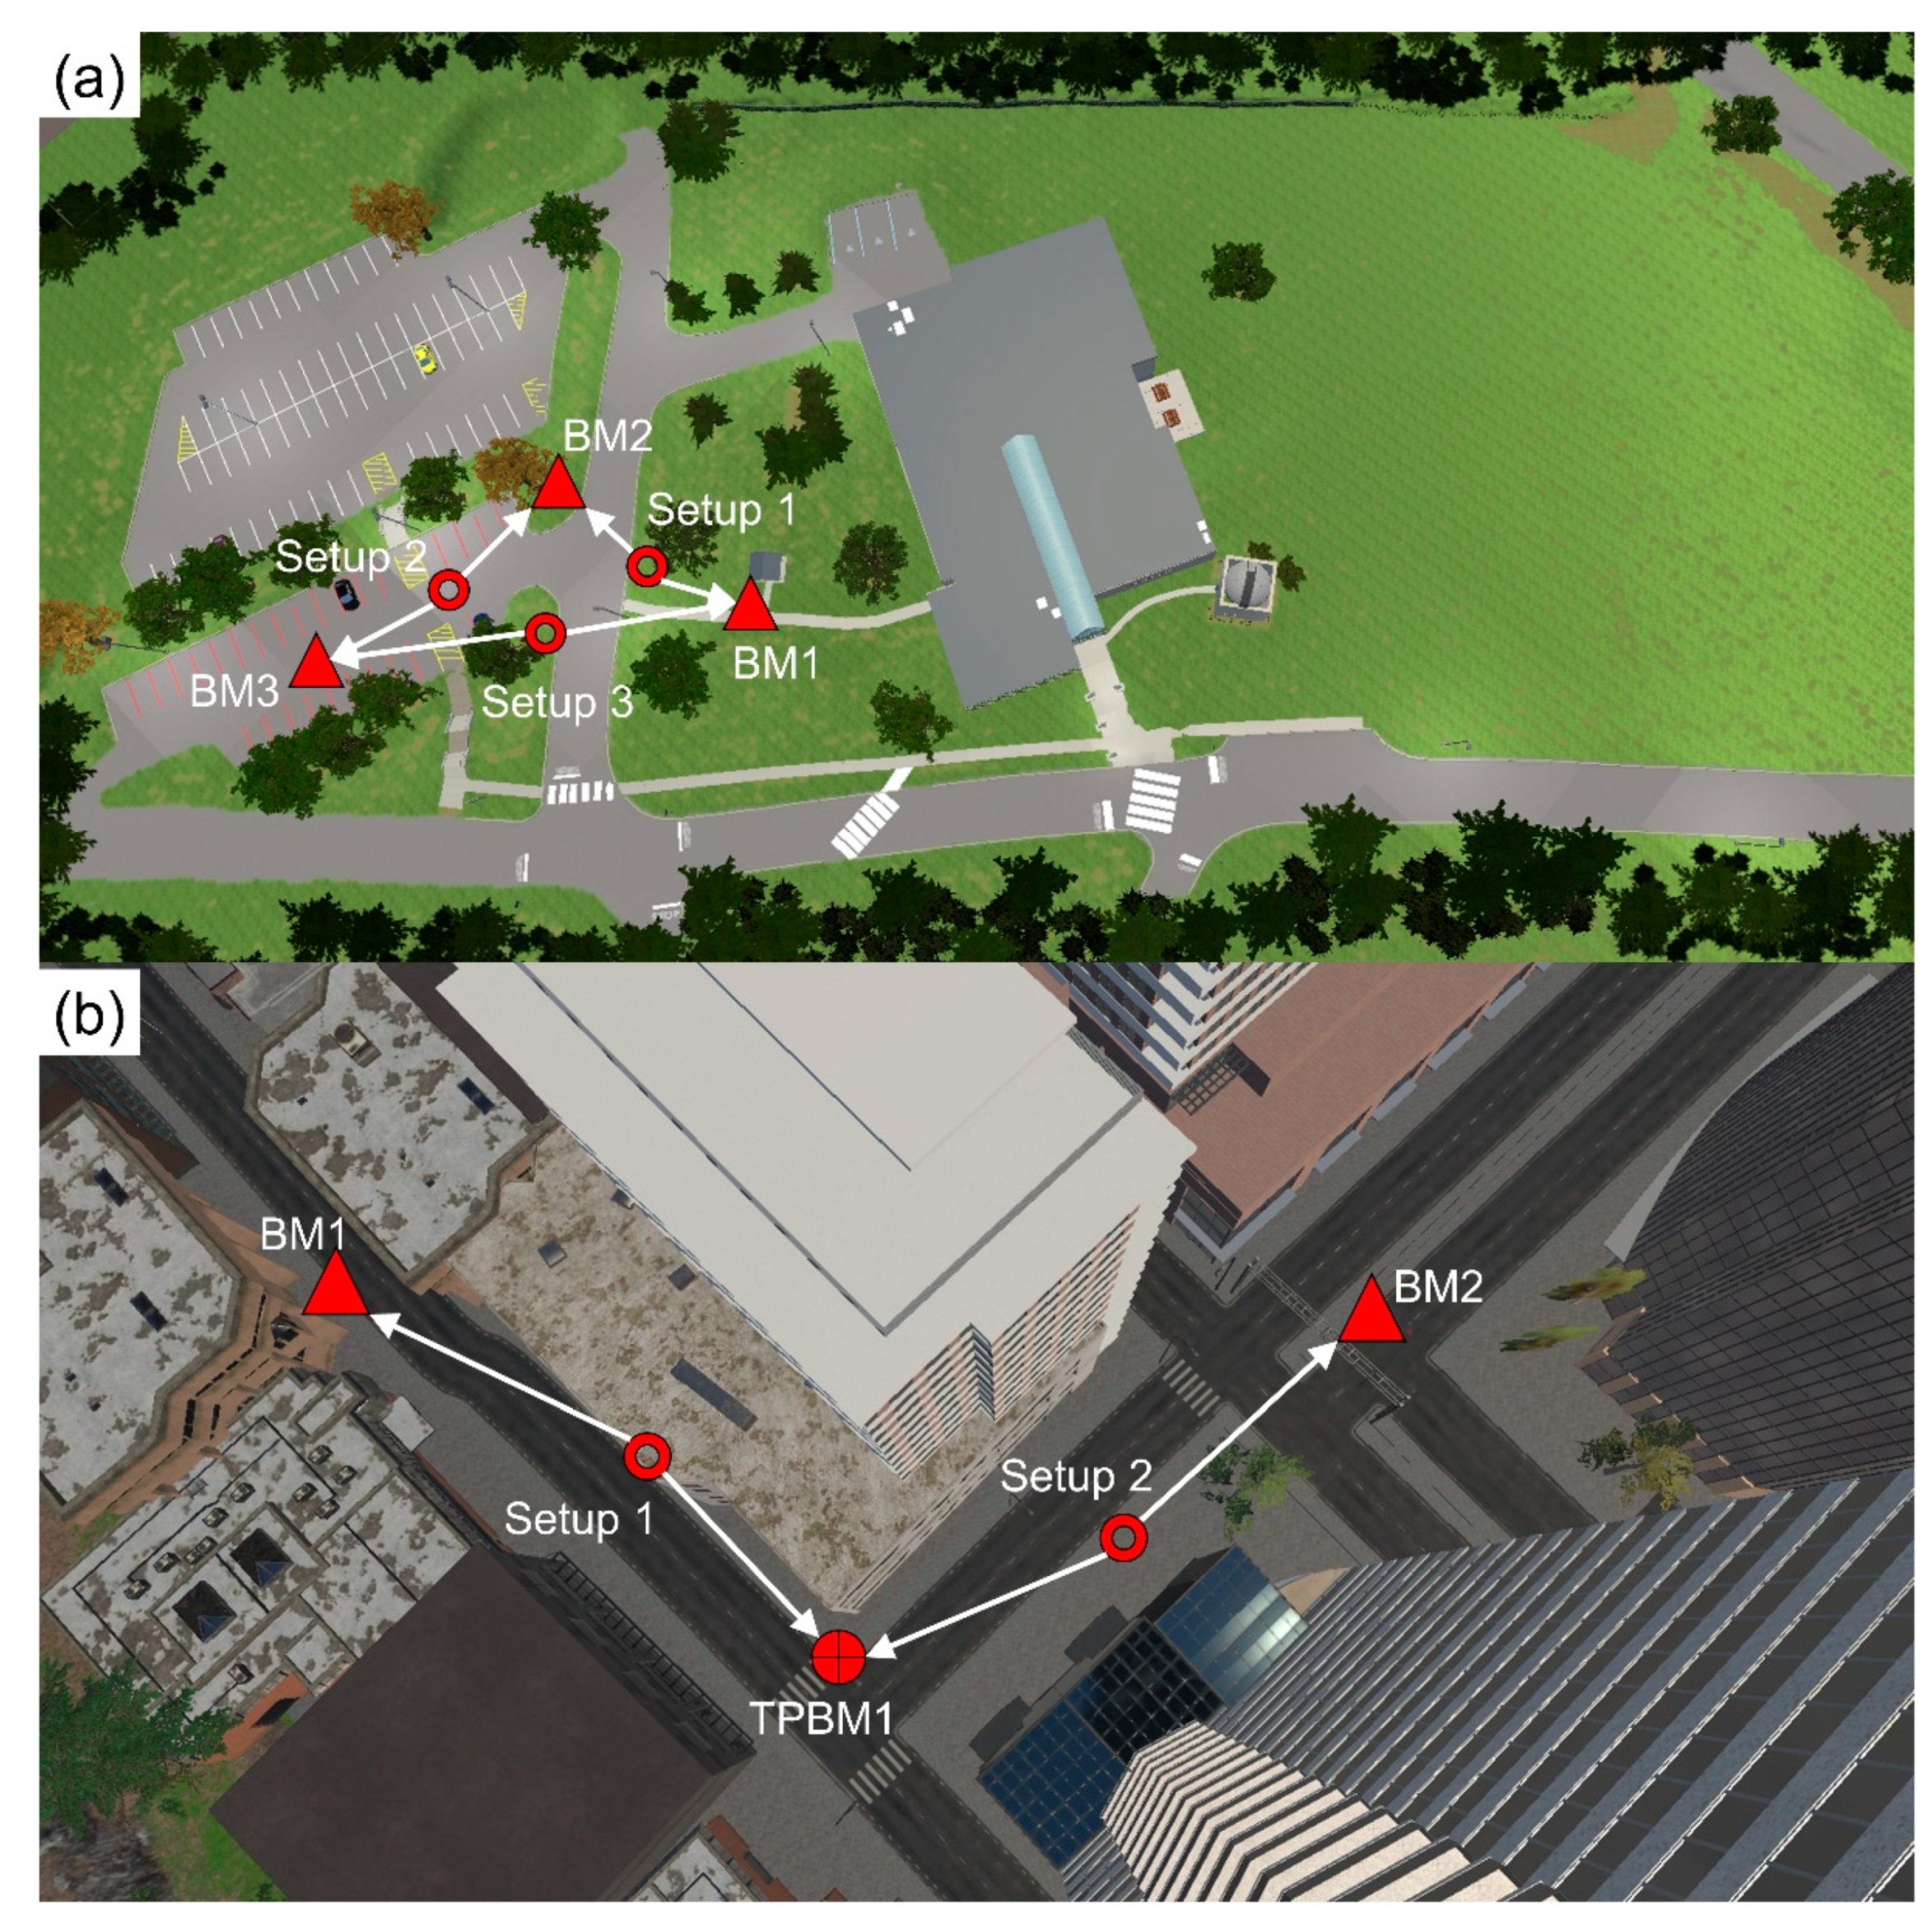
We conducted two differential leveling labs as a demonstration, a three-benchmark loop and a point-to-point leveling line. In both cases, the misclosure was 1 mm, which is due to observational random errors. This shows that leveling activities can be faithfully replicated in VR with the same precision that surveyors can achieve in the physical world. The environment is realistic, creating realistic challenges for users. For example, we showed how tree leaves move with wind and block the view of the instrument to the rod. The output report offers great instructional feedback that is not attainable in real life. The report captures the leveling condition of the instrument and rod, as well as the true measurements that students should have observed. Thus, students can use the output report and, through reflection, they can understand their mistakes and surveying approach, which is important to help them improve their surveying and engineering skills. The paper focused on the technical aspects of the software, while a comprehensive pedagogical implementation and assessment will follow in the future.
The developed labs are single player labs (one student conducts the virtual lab). Although this approach has some advantages, surveying students would never conduct the entire lab on their own. As one student should be at the instrument making and recording observations and a second student should be holding the rod leveled. Therefore, they experience all the steps that are associated with leveling, giving them an overall experience and a different perspective. Future work will focus on developing a collaborative suite that will allow two or more players to co-exist in the environment and conduct surveying labs as a group, exercising their teamwork skills. Existing work on collaborative learning in VR shows great advantages over individual work such as improving learning of outcomes and reducing anxiety related to tasks [58]. Furthermore, the software will be expanded to include more environments and surveying instruments such as total stations and global navigation satellite systems.

Author Contributions

Conceptualization, Dimitrios Bolkas and Jeffrey Chiampi; software, Jeffrey Chiampi, Joseph Fioti, and Donovan Gaffney; formal analysis, Dimitrios Bolkas; writing—original draft preparation, Dimitrios Bolkas; Jeffrey Chiampi and Joseph Fioti; writing—review and editing, Jeffrey Chiampi, Joseph Fioti, and Donovan Gaffney. All authors have read and agreed to the published version of the manuscript.

Funding

This research received no external funding.

Data Availability Statement

The data and software (without the source code) presented in this study are available on request from the corresponding author.

Acknowledgments

Brandi Brace is acknowledged for her assistance with the Unity software. This project has been supported via grants from the following sources: Schreyer Institute for Teaching Excellence of the Pennsylvania State University; the Engineering Technology and Commonwealth Engineering of the Pennsylvania State University; and Chancellor Endowments from Penn State Wilkes-Barre. In addition, we would like to thank our Associate Director of Academic Affairs Lynda Goldstein for her help and support.

Conflicts of Interest

The authors declare no conflict of interest.

References

  1. Lee, E.A.L.; Wong, K.W.; Fung, C.C. How does desktop virtual reality enhance learning outcomes? A structural equation modeling approach. Comput. Educ. 2010, 55, 1424–1442. [Google Scholar]
  2. Freina, L.; Ott, M. A Literature Review on Immersive Virtual Reality in Education: State Of The Art and Perspectives. In Proceedings of the eLearning & Software for Education, Bucharest, Romania, 23–24 April 2015; Volume 1, pp. 10–1007. [Google Scholar]
  3. Hawkins, D.G. Virtual Reality and Passive Simulators: The Future of Fun. In Communication in the Age of Virtual Reality, Hillsdale; Biocca, F., Levy, M.R., Eds.; Erlbaum: Mahwah, NJ, USA, 1995; pp. 159–189. [Google Scholar]
  4. Merchant, Z.; Goetz, E.T.; Cifuentes, L.; Keeney-Kennicutt, W.; Davis, T.J. Effectiveness of virtual reality-based instruction on students’ learning outcomes in K-12 and higher education: A meta-analysis. Comput. Educ. 2014, 70, 29–40. [Google Scholar] [CrossRef]
  5. Bailenson, J.N.; Yee, N.; Blascovich, J.; Beall, A.C.; Lundblad, N.; Jin, M. The use of immersive virtual reality in the learning sciences: Digital transformations of teachers, students, and social context. J. Learn. Sci. 2008, 17, 102–141. [Google Scholar] [CrossRef] [Green Version]
  6. Alhalabi, W.S. Virtual reality systems enhance students’ achievements in engineering education. Behav. Inform. Technol. 2016, 35, 919–925. [Google Scholar] [CrossRef]
  7. Gutierrez, F.; Pierce, J.; Vergara, V.; Coulter, R.; Saland, L.; Caudell, T.; Goldsmith, T.E.; Alverson, D.C. The effect of degree of immersion upon learning performance in virtual reality simulations for medical education. Stud. Health Technol. Inform. 2007, 125, 155–160. [Google Scholar]
  8. Passig, D.; Tzuriel, D.; Eshel-Kedmi, G. Improving children’s cognitive modifiability by dynamic assessment in 3D Immersive Virtual Reality environments. Comput. Educ. 2016, 95, 296–308. [Google Scholar] [CrossRef]
  9. Webster, R. Declarative knowledge acquisition in immersive virtual learning environments. Interact. Learn. Environ. 2016, 24, 1319–1333. [Google Scholar] [CrossRef]
  10. Patel, K.; Bailenson, J.N.; Hack-Jung, S.; Diankov, R.; Bajcsy, R. The effects of fully immersive virtual reality on the learning of physical tasks. In Proceedings of the 9th Annual International Workshop on Presence, Cleveland, OH, USA, 24–26 August 2006; pp. 87–94. [Google Scholar]
  11. Makransky, G.; Terkildsen, T.S.; Mayer, R.E. Adding immersive virtual reality to a science lab simulation causes more presence but less learning. Learn. Instr. 2019, 60, 225–236. [Google Scholar] [CrossRef]
  12. Moreno, R.; Mayer, R.E. Learning science in virtual reality multimedia environments: Role of methods and media. J. Educ. Psychol. 2002, 94, 598. [Google Scholar] [CrossRef]
  13. Adamo-Villani, N.; Wilbur, R.B. Effects of platform (immersive versus non-immersive) on usability and enjoyment of a virtual learning environment for deaf and hearing children. In Proceedings of the 14th Eurographics Symposium on Virtual Environments (EGVE), Eindhoven, The Netherlands, 29–30 May 2008; pp. 8–19. [Google Scholar]
  14. Mikropoulos, T.A. Presence: A unique characteristic in educational virtual environments. Virtual Real. 2006, 10, 197–206. [Google Scholar] [CrossRef]
  15. Mikropoulos, T.A.; Natsis, A. Educational virtual environments: A ten-year review of empirical research (1999–2009). Comput. Educ. 2011, 56, 769–780. [Google Scholar] [CrossRef]
  16. Winn, W.; Windschitl, M.; Fruland, R.; Lee, Y. When does immersion in a virtual environment help students construct understanding. In Proceedings of the 5th International Conference of the Learning Sciences ICLS, Seattle, WA, USA, 23–26 October 2002; Volume 206, pp. 497–503. [Google Scholar]
  17. Wolfartsberger, J. Analyzing the potential of Virtual Reality for engineering design review. Autom. Constr. 2019, 104, 27–37. [Google Scholar] [CrossRef]
  18. Wang, P.; Wu, P.; Wang, J.; Chi, H.L.; Wang, X. A critical review of the use of virtual reality in construction engineering education and training. Int. J. Environ. Res. Public Health 2018, 15, 1204. [Google Scholar] [CrossRef] [PubMed] [Green Version]
  19. Havenith, H.B.; Cerfontaine, P.; Mreyen, A.S. How virtual reality can help visualise and assess geohazards. Int. J. Digit. Earth 2019, 12, 173–189. [Google Scholar] [CrossRef]
  20. Shen, H.; Zhang, J.; Yang, B.; Jia, B. Development of an educational virtual reality training system for marine engineers. Comput. Appl. Eng. Educ. 2019, 27, 580–602. [Google Scholar] [CrossRef]
  21. Hagita, K.; Kodama, Y.; Takada, M. Simplified virtual reality training system for radiation shielding and measurement in nuclear engineering. Prog. Nucl. Energy 2020, 188, 103127. [Google Scholar] [CrossRef]
  22. Stojšić, I.; Džigurski, A.I.; Maričić, O.; Bibić, L.I.; Vučković, S.Đ. Possible application of virtual reality in geography teaching. J. Subject Didact. 2016, 1, 83–96. [Google Scholar]
  23. Çöltekin, A.; Lochhead, I.; Madden, M.; Christophe, S.; Devaux, A.; Pettit, C.; Lock, O.; Shukla, S.; Herman, L.; Stachoň, Z.; et al. Extended reality in spatial sciences: A review of research challenges and future directions. ISPRS Int. J. Geo-Inf. 2020, 9, 439. [Google Scholar] [CrossRef]
  24. Klippel, A.; Zhao, J.; Jackson, K.L.; La Femina, P.; Stubbs, C.; Wetzel, R.; Blair, J.; Wallgrün, J.O.; Oprean, D. Transforming earth science education through immersive experiences: Delivering on a long held promise. J. Educ. Comput. Res. 2019, 57, 1745–1771. [Google Scholar] [CrossRef]
  25. Tibaldi, A.; Bonali, F.L.; Vitello, F.; Delage, E.; Nomikou, P.; Antoniou, V.; Becciani, U.; de Vries, B.V.W.; Krokos, M.; Whitworth, M. Real world–based immersive Virtual Reality for research, teaching and communication in volcanology. Bull. Volcanol. 2020, 82, 1–12. [Google Scholar] [CrossRef]
  26. Zhao, J.; Wallgrün, J.O.; LaFemina, P.C.; Normandeau, J.; Klippel, A. Harnessing the power of immersive virtual reality-visualization and analysis of 3D earth science data sets. Geo-Spat. Inf. Sci. 2019, 22, 237–250. [Google Scholar] [CrossRef]
  27. Sedláček, D.; Okluský, O.; Zara, J. Moon base: A serious game for education. In Proceedings of the 11th International Conference on Virtual Worlds and Games for Serious Applications (VS-Games), Vienna, Austria, 4–6 September 2019; pp. 1–4. [Google Scholar]
  28. Dib, H.; Adamo-Villani, N.; Garver, S. An interactive virtual environment for learning differential leveling: Development and initial findings. Adv. Eng. Educ. 2014, 4, n1. [Google Scholar]
  29. Kang, S.C.; Chuang, S.K.; Shiu, R.S.; Chen, Y.; Hsieh, S.H. SimuSurvey X: An improved virtual surveying instrument running off a game engine. In Proceedings of the 13th International Conference on Computing in Civil and Building Engineering, Nottingham, UK, 30 June–2 July 2010; pp. 1–7. [Google Scholar]
  30. Lu, C.C.; Kang, S.C.; Hsieh, S.H. SimuSurvey: A computer-based simulator for survey training. In Proceedings of the CIB 24th W78 Conference, and 14th EG-ICE Workshop, and 5th ITC@ EDU Workshop: Bringing ITC Knowledge to Work, Maribor, Slovenia, 26–29 June 2007; pp. 743–748. [Google Scholar]
  31. Lu, C.C.; Kang, S.C.; Hsieh, S.H.; Shiu, R.S. Improvement of a computer-based surveyor-training tool using a user-centered approach. Adv. Eng. Inform. 2009, 23, 81–92. [Google Scholar] [CrossRef]
  32. Ghilani, C.D.; Wolf, P.R. Elementary Surveying; Pearson Education: London, UK, 2012. [Google Scholar]
  33. Shiu, R.S.; Kang, S.C.; Han, J.Y.; Hsieh, S.H. Modeling systematic errors for the angle measurement in a virtual surveying instrument. J. Surv. Eng. 2011, 137, 81–90. [Google Scholar] [CrossRef]
  34. Kuo, H.L.; Kang, S.C.; Lu, C.C.; Hsieh, S.H.; Lin, Y.H. Using virtual instruments to teach surveying courses: Application and assessment. Comput. Appl. Eng. Educ. 2011, 19, 411–420. [Google Scholar] [CrossRef]
  35. Castro-Garcia, M.; Perez-Romero, A.M.; Leon-Bonillo, M.J.; Manzano-Agugliaro, F. Developing Topographic Surveying Software to Train Civil Engineers. J. Prof. Issues Eng. Educ. Pract. 2016, 143, 04016013. [Google Scholar] [CrossRef]
  36. Li, C.M.; Yeh, I.C.; Chen, S.F.; Chiang, T.Y.; Lien, L.C. Virtual reality learning system for digital terrain model surveying practice. J. Prof. Issues Eng. Educ. Pract. 2008, 134, 335–345. [Google Scholar] [CrossRef]
  37. Bolkas, D.; Chiampi, J. Enhancing experience and learning of first-year surveying engineering students with immersive virtual reality. In Proceedings of the 11th Annual American Society for Engineering Education (ASEE) First Year Engineering Experience Conference (FYEE), State College, PA, USA, 28–30 July 2019; pp. 28–30. [Google Scholar]
  38. Bolkas, D.; Chiampi, J.; Chapman, J.; Fioti, J.; Pavill, V.F., IV. Creating immersive and interactive surveying laboratories in virtual reality: A differential leveling example. ISPRS Ann. Photogram. Remote Sens. Spat. Inf. Sci. 2020, 5. [Google Scholar] [CrossRef]
  39. Levin, E.; Shults, R.; Habibi, R.; An, Z.; Roland, W. Geospatial Virtual Reality for Cyberlearning in the Field of Topographic Surveying: Moving Towards a Cost-Effective Mobile Solution. ISPRS Int. J. Geo-Inf. 2020, 9, 433. [Google Scholar] [CrossRef]
  40. Checa, D.; Bustillo, A. A review of immersive virtual reality serious games to enhance learning and training. Multimed. Tools Appl. 2020, 79, 5501–5527. [Google Scholar] [CrossRef] [Green Version]
  41. Oculus Rift and Rift S Minimum Requirements and System Specifications. 2020. Available online: https://support.oculus.com/248749509016567/ (accessed on 5 April 2020).
  42. Bolkas, D.; Chiampi, J.; Chapman, J.; Pavill, V.F. Creating a virtual reality environment with a fusion of sUAS and TLS point-clouds. Int. J. Image Data Fusion 2020, 11, 1–26. [Google Scholar] [CrossRef]
  43. Derdaele, J.; Shekhawat, Y.; Vergauwen, M. Exploring past and present: VR reconstruction of the berlin gendarmenmarkt. In Proceedings of the IEEE International Symposium on Mixed and Augmented Reality Adjunct, ISMAR-Adjunct, Munich, Germany, 16–20 October 2018; pp. 287–292. [Google Scholar]
  44. Forte, M. Cyber-Archaeology: Notes on the simulation of the past. Virtual Archaeol. Rev. 2011, 2, 7–18. [Google Scholar] [CrossRef] [Green Version]
  45. Kontogianni, G.; Koutsaftis, C.; Skamantzari, M.; Chrysanthopoulou, C.; Georgopoulos, A. Utilising 3d realistic models in serious games for cultural heritage. Int. J. Comput. Meth. Herit. Sci. 2017, 1, 21–46. [Google Scholar] [CrossRef] [Green Version]
  46. Masrur, A.; Zhao, J.; Wallgrün, J.O.; LaFemina, P.; Klippel, A. Immersive applications for informal and interactive learning for earth science. In Proceedings of the Workshop on Immersive Analytics, Exploring Future Interaction and Visualization Technologies for Data Analytics, Phoenix, AZ, USA, 1 October 2017; pp. 1–5. [Google Scholar]
  47. Tokarev, K. Quixel Megascans: Scanning Materials for Games & Films. 2016. Available online: https://80.lv/articles/quixel-megascans-scanning-materials-for-games-film/ (accessed on 4 October 2020).
  48. Younes, G.; Kahil, R.; Jallad, M.; Asmar, D.; Elhajj, I.; Turkiyyah, G.; Al-Harithy, H. Virtual and augmented reality for rich interaction with cultural heritage sites: A case study from the Roman Theater at Byblos. Digit. Appl. Archaeol. Cult. Herit. 2017, 5, 1–9. [Google Scholar]
  49. Unity Asset Store. Windridge City. 2019. Available online: https://assetstore.unity.com/packages/3d/environments/roadways/windridge-city-132222 (accessed on 4 October 2020).
  50. Boeing, A.; Bräunl, T. Evaluation of real-time physics simulation systems. In Proceedings of the 5th International Conference on Computer Graphics and Interactive Techniques in Australia and Southeast Asia, Perth, Australia, 1–4 December 2007; pp. 281–288. [Google Scholar]
  51. Yeh, T.Y.; Faloutsos, P.; Reinman, G. Enabling real-time physics simulation in future interactive entertainment. In Proceedings of the ACM SIGGRAPH Symposium on Videogames, Boston, MA, USA, 29–30 July 2006; pp. 71–81. [Google Scholar]
  52. Hummel, J.; Wolff, R.; Stein, T.; Gerndt, A.; Kuhlen, T. An evaluation of open source physics engines for use in virtual reality assembly simulations. In Proceedings of the 8th International Symposium on Visual Computing, Rethymnon, Greece, 16–18 July 2012; pp. 346–357. [Google Scholar]
  53. Regan, M.; Pose, R. Priority rendering with a virtual reality address recalculation pipeline. In Proceedings of the 21st Annual Conference on Computer Graphics and Interactive Techniques, Orlando, FL, USA, 24–29 July 1994; pp. 155–162. [Google Scholar]
  54. Oculus. Oculus Rift: Testing and Performance Analysis. Oculus Developers. 2020. Available online: https://developer.oculus.com/documentation/unreal/latest/concepts/unreal-debug-rift/?locale=en_US (accessed on 6 September 2020).
  55. Kennedy, R.S.; Stanney, K.M.; Dunlap, W.P. Duration and exposure to virtual environments: Sickness curves during and across sessions. Presence Teleoperators Virtual 2000, 9, 463–472. [Google Scholar] [CrossRef] [Green Version]
  56. Regan, C. An investigation into nausea and other side-effects of head-coupled immersive virtual reality. Virtual Real. 1995, 1, 17–31. [Google Scholar] [CrossRef]
  57. Stanney, K.M.; Kingdon, K.S.; Graeber, D.; Kennedy, R.S. Human performance in immersive virtual environments: Effects of exposure duration, user control, and scene complexity. Hum. Perform. 2002, 15, 339–366. [Google Scholar]
  58. Šašinka, Č.; Stachoň, Z.; Sedlák, M.; Chmelík, J.; Herman, L.; Kubíček, P.; Šašinková, A.; Doležal, M.; Tejkl, H.; Urbánek, T. Collaborative immersive virtual environments for education in geography. ISPRS Int. J. Geo-Inf. 2019, 8, 3. [Google Scholar]
Figure 1. Example of grabbing, moving, and snapping of the leveling rod on a monument: (a) grabbing the rod; (b) the rod snapped on the surveying monument.
Ijgi 10 00296 g001
Figure 2. Virtual tablet: (a) main menu; (b) lab instructions; (c) settings and lefty mode; (d) virtual map.
Ijgi 10 00296 g002
Figure 3. The virtual reality ready room: (a) log in; (b) load or create a new lab; (c) location selection; (d) lab selection.
Ijgi 10 00296 g003
Figure 4. Virtual environments: (a) Penn State Wilkes-Barre; (b) Windridge City by Unity; (c) immersed view of the Penn Stat Wilkes-Barre environment; (d) immersed view of the Windridge City environment.
Ijgi 10 00296 g004
Figure 5. Leveling the rod: (a) the rod is not leveled; (b) the rod is leveled. Note that, in Unity, y- is used as the vertical axis and not the z-axis.
Ijgi 10 00296 g005
Figure 6. Additional instrument functions: (a) focus knob showing instrument view before focusing; (b) focus knob showing instrument view after focusing; (c) focusing of the eyepiece; (d) coarse rotation using the peep sight.
Ijgi 10 00296 g006
Figure 7. Making a measurement: (a) fine rotation that allows view for observation; (b) telescope view from the instrument.
Ijgi 10 00296 g007
Figure 8. Virtual fieldbook and recording of measurements.
Ijgi 10 00296 g008
Figure 9. Effective tripod positioning and leveling: (a) calculation of the average point for the object (tripod) and ground; (b) two vectors between the leg endpoints form a hyperplane.
Ijgi 10 00296 g009
Figure 10. Example of the tripod positioning: (a) tripod is held in the air, the object and ground normal are shown; (b) the object normal is aligned with the ground normal when the user drops the tripod. The y-axis, which defines the vertical (up-down) direction in Unity, is also shown for reference. The instrument should be aligned with the vertical direction to be considered leveled.
Ijgi 10 00296 g010
Figure 11. Circular bubble feedback: (a) bubble view on virtual tablet and instrument; (b) circular bubble is roughly leveled.
Ijgi 10 00296 g011
Figure 12. Simulation performance with full physical simulation of tripod legs versus our technique: (a) full physical simulation of the tripod legs; (b) our technique. The y-axis shows execution time in milliseconds and the frames per second (FPS) are shown in parenthesis.
Ijgi 10 00296 g012
Figure 13. Tripod leg adjustment: (a) adjustment of one leg; (b) the tripod is roughly leveled.
Ijgi 10 00296 g013
Figure 14. Precise leveling of the differential level instrument: (a) adjusting tribrach screws, the toggle indicates that the vial shows a range of −3° to +3°; (b) adjusting tribrach screws, the toggle indicates that the vial shows a range of −3′ to +3′, allowing for leveling to within 1′′.
Ijgi 10 00296 g014
Figure 15. Feedback examples when users record a measurement in their fieldbook: (a) when the differential level instrument is not accurately leveled; (b) when the differential level instrument is precisely leveled.
Ijgi 10 00296 g015
Figure 16. Virtual reality lab examples: (a) three benchmark loop; (b) level line in city environment. BM, benchmark; TPBM, temporary BM.
Ijgi 10 00296 g016
Figure 17. Screenshots from the output report that show measurement in the presence of virtual wind: (a) screenshot at time 10:27:58; (b) screenshot at 10:28:15.
Ijgi 10 00296 g017
Table 1. Measurements of the three-benchmark level loop in the campus environment. BM, benchmark.
Observed MeasurementsTrue Measurements
StationBacksight (m)Foresight (m)Distance (m) Backsight (m)Foresight (m)Distance (m)
BM10.482 9.00.483 8.6
13.5 14.1
BM21.3862.64315.81.3862.64315.1
14.3 13.8
BM33.3511.59521.03.3511.59521.0
18.8 18.9
BM1 0.982 0.982
Sum Backsight (m): 5.219 Sum Backsight (m): 5.220
Sum Foresight (m): 5.220 Sum Foresight (m): 5.220
Misclosure (m): −0.001 Misclosure (m): 0.000
Table 2. Measurements of the point-to-point level line in the city environment. TPBM, temporary BM.
Observed MeasurementsTrue Measurements
StationBacksight (m)Foresight (m)Distance (m) Backsight (m)Foresight (m)Distance (m)
BM11.339 33.81.340 33.6
30.0 32.2
TPBM11.3121.40930.81.3121.40932.6
32.3 31.7
BM2 1.396 1.396
Sum Backsight (m): 2.651 Sum Backsight (m): 2.652
Sum Foresight (m): 2.805 Sum Foresight (m): 2.805
Difference (m): −0.154 Difference (m): −0.153
True Difference (m): Height BM2 − Height BM1 = 341.495 − 341.648 = −0.153
Misclosure (m): −0.153 + 0.154 = 0.001Misclosure (m): −0.153 + 0.153 = 0.000
Publisher’s Note: MDPI stays neutral with regard to jurisdictional claims in published maps and institutional affiliations.

