
Measurement of Potential Victims of Burglary at the Mesoscale: Comparison of Census, Phone Users, and Social Media Data


Abstract
:1. Introduction
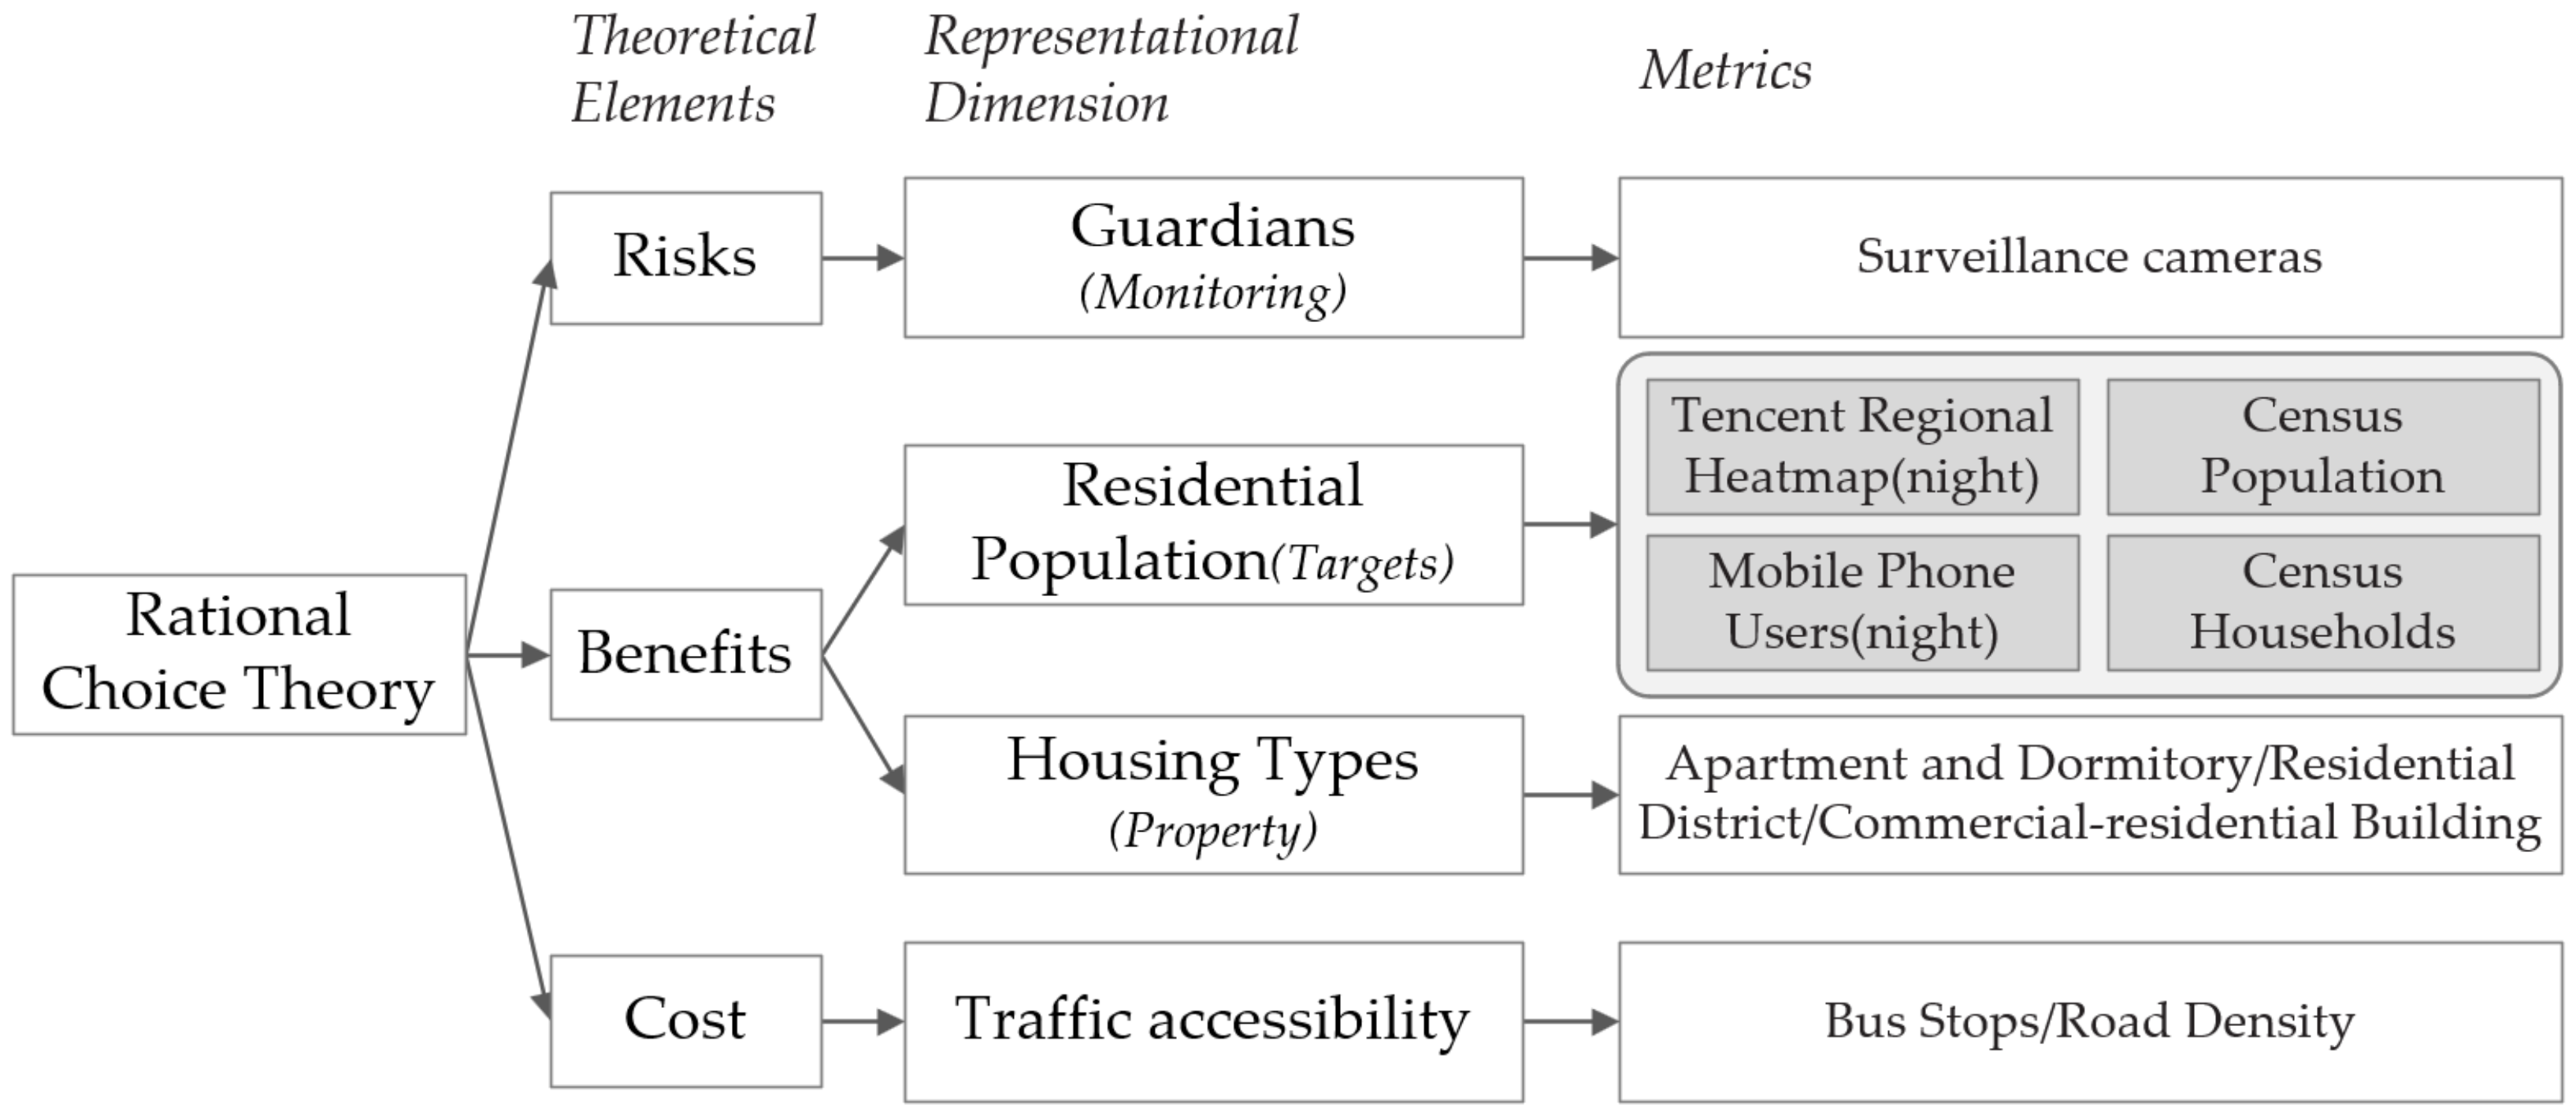
2. Theories
- (1)
- Potential benefits. Previous studies [23,24] considered the wealth and exposure of targets in residential areas to represent their attractiveness to criminals. The proceeds of burglaries come from the residence of the victim, so the number of potential victims and their possible wealth have become the primary conditions for the offender to measure the benefits. In this study, census population, census households, nighttime mobile phone users, and the Tencent regional heatmap were used to represent potential targets. Housing types also imply the offender’s estimation of the possible wealth of the household. Three housing types were used in this study: residential district buildings, apartments and dormitory buildings, and commercial–residential buildings [17,25].
- (2)
- Cost of traveling to the target. Traffic convenience affects the cost of burglaries. Following prior research [3], bus stops and road density were selected to represent traffic accessibility. The more convenient the transportation in the target area, the lower the travel cost.
- (3)
- Risks of getting caught. Crime risks stem from civil defense, physical defense, and technical defense. The risk of surveillance and standards of physical security are primary deterrents for burglars [26]. In China, surveillance cameras installed by the police are a direct supervision force, which increases the risk of burglars being discovered.
3. Study Area, Data, and Methods
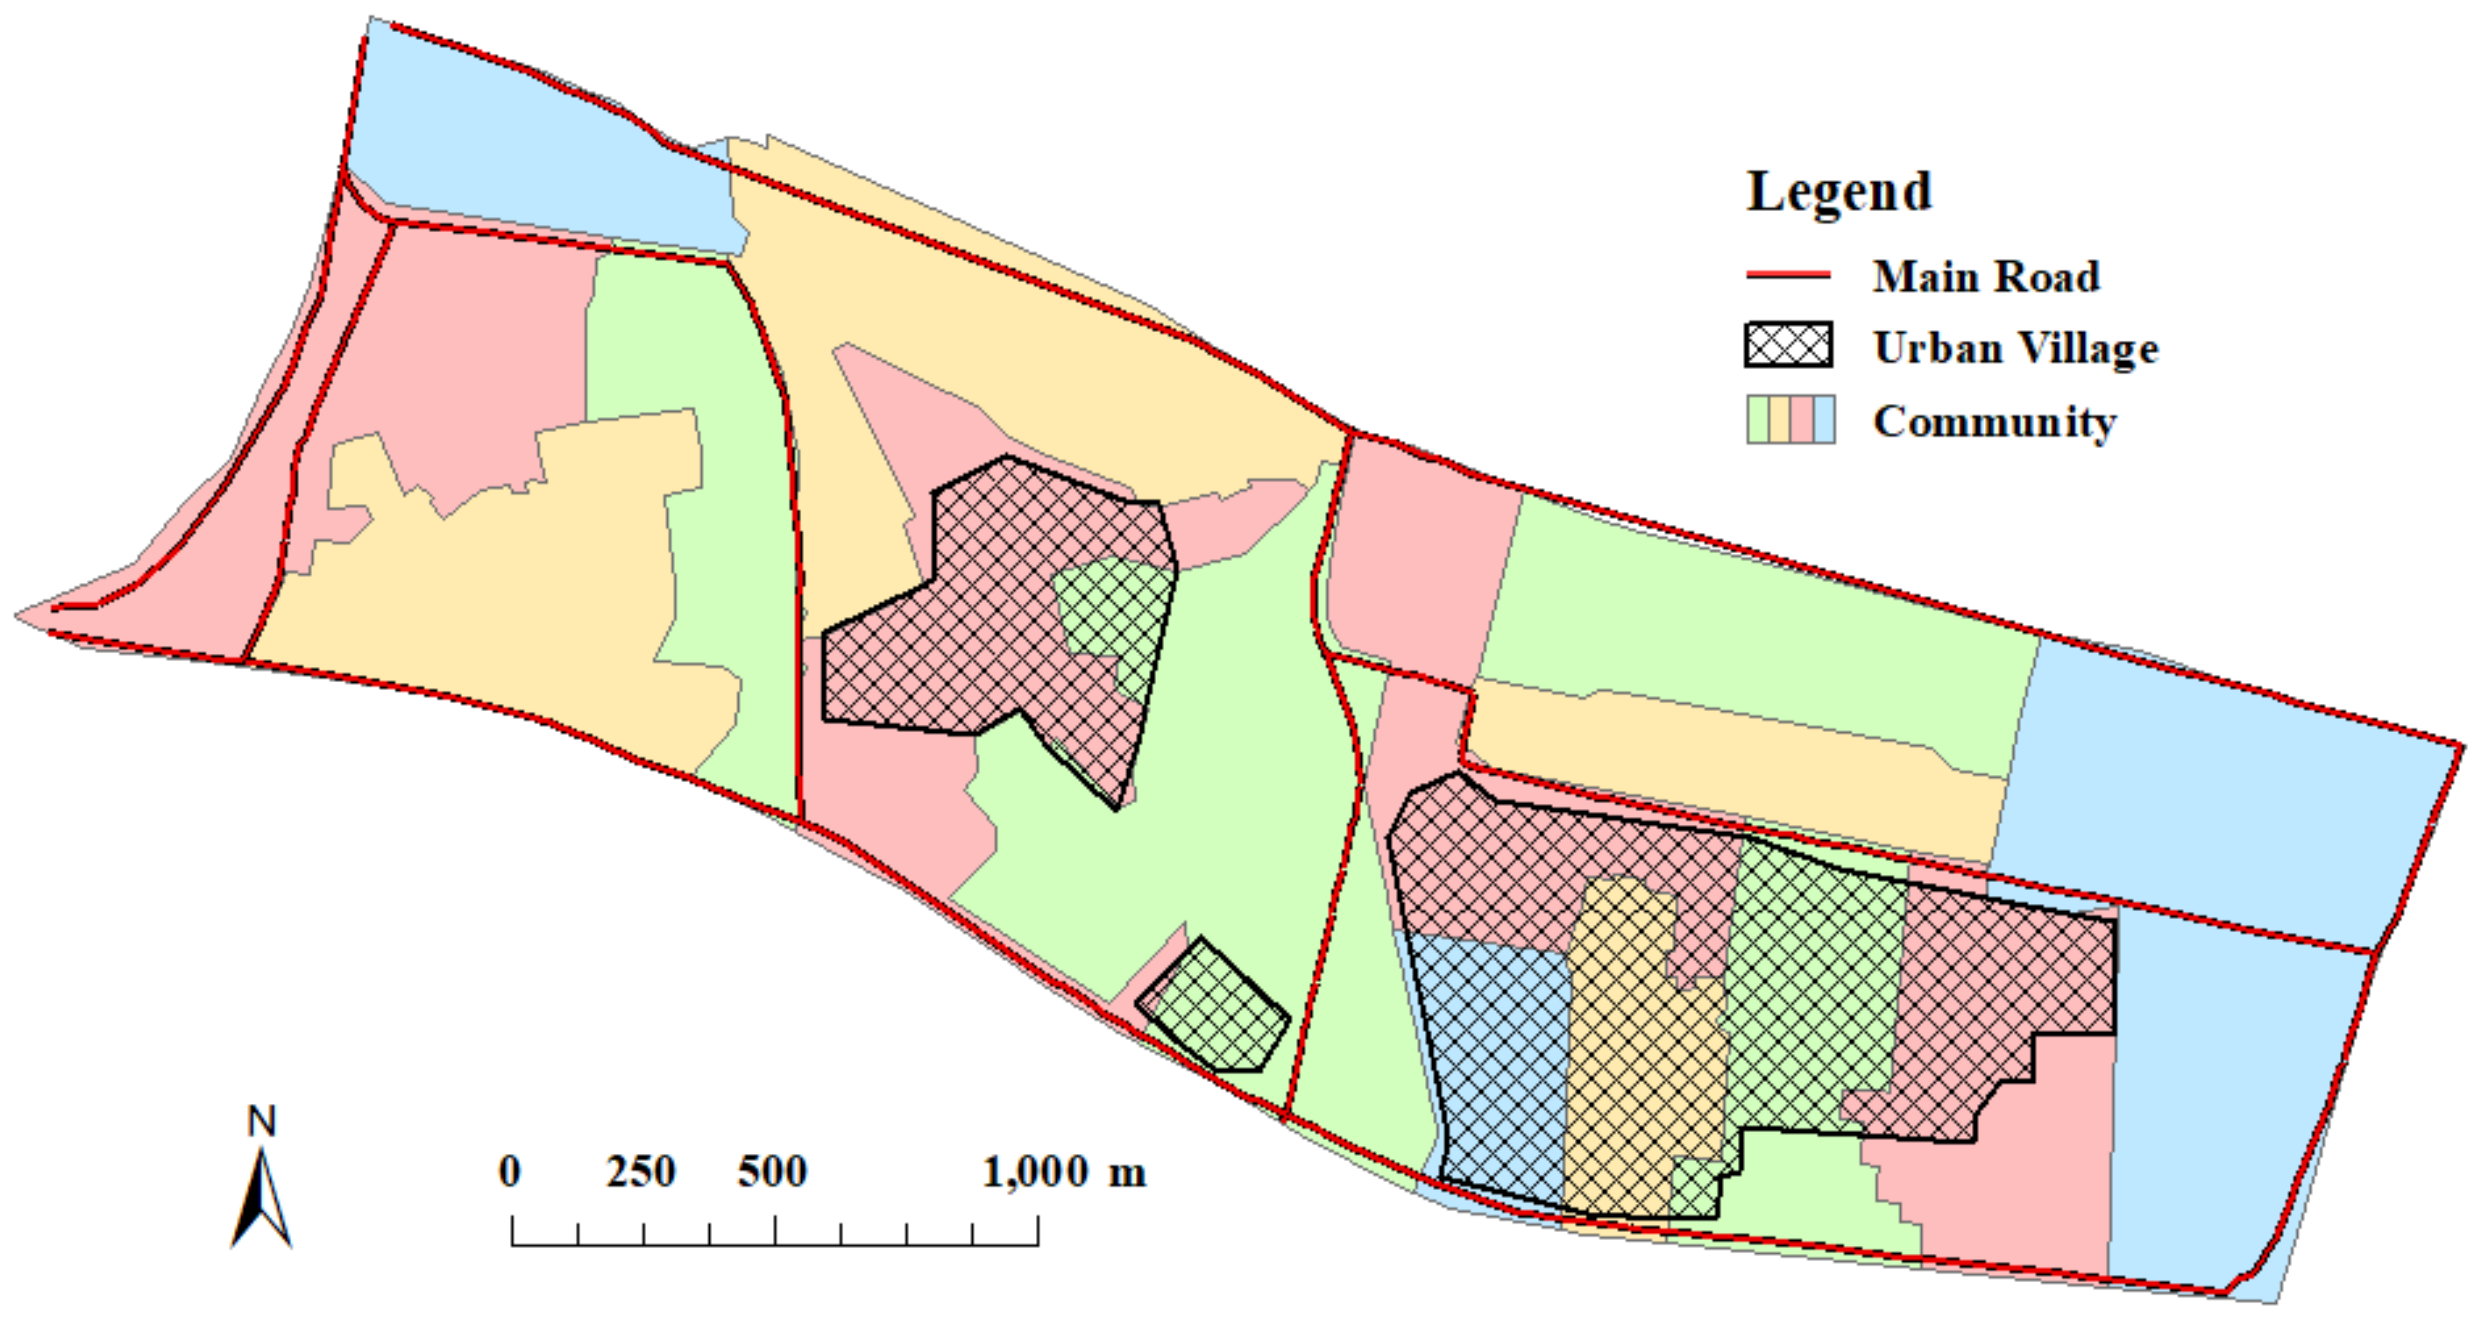
3.1. Study Area
3.2. Data and Methods
3.2.1. Spatial Units of Analysis
3.2.2. Data and Processing
3.2.3. Negative Binomial Regression Model
4. Analysis and Results
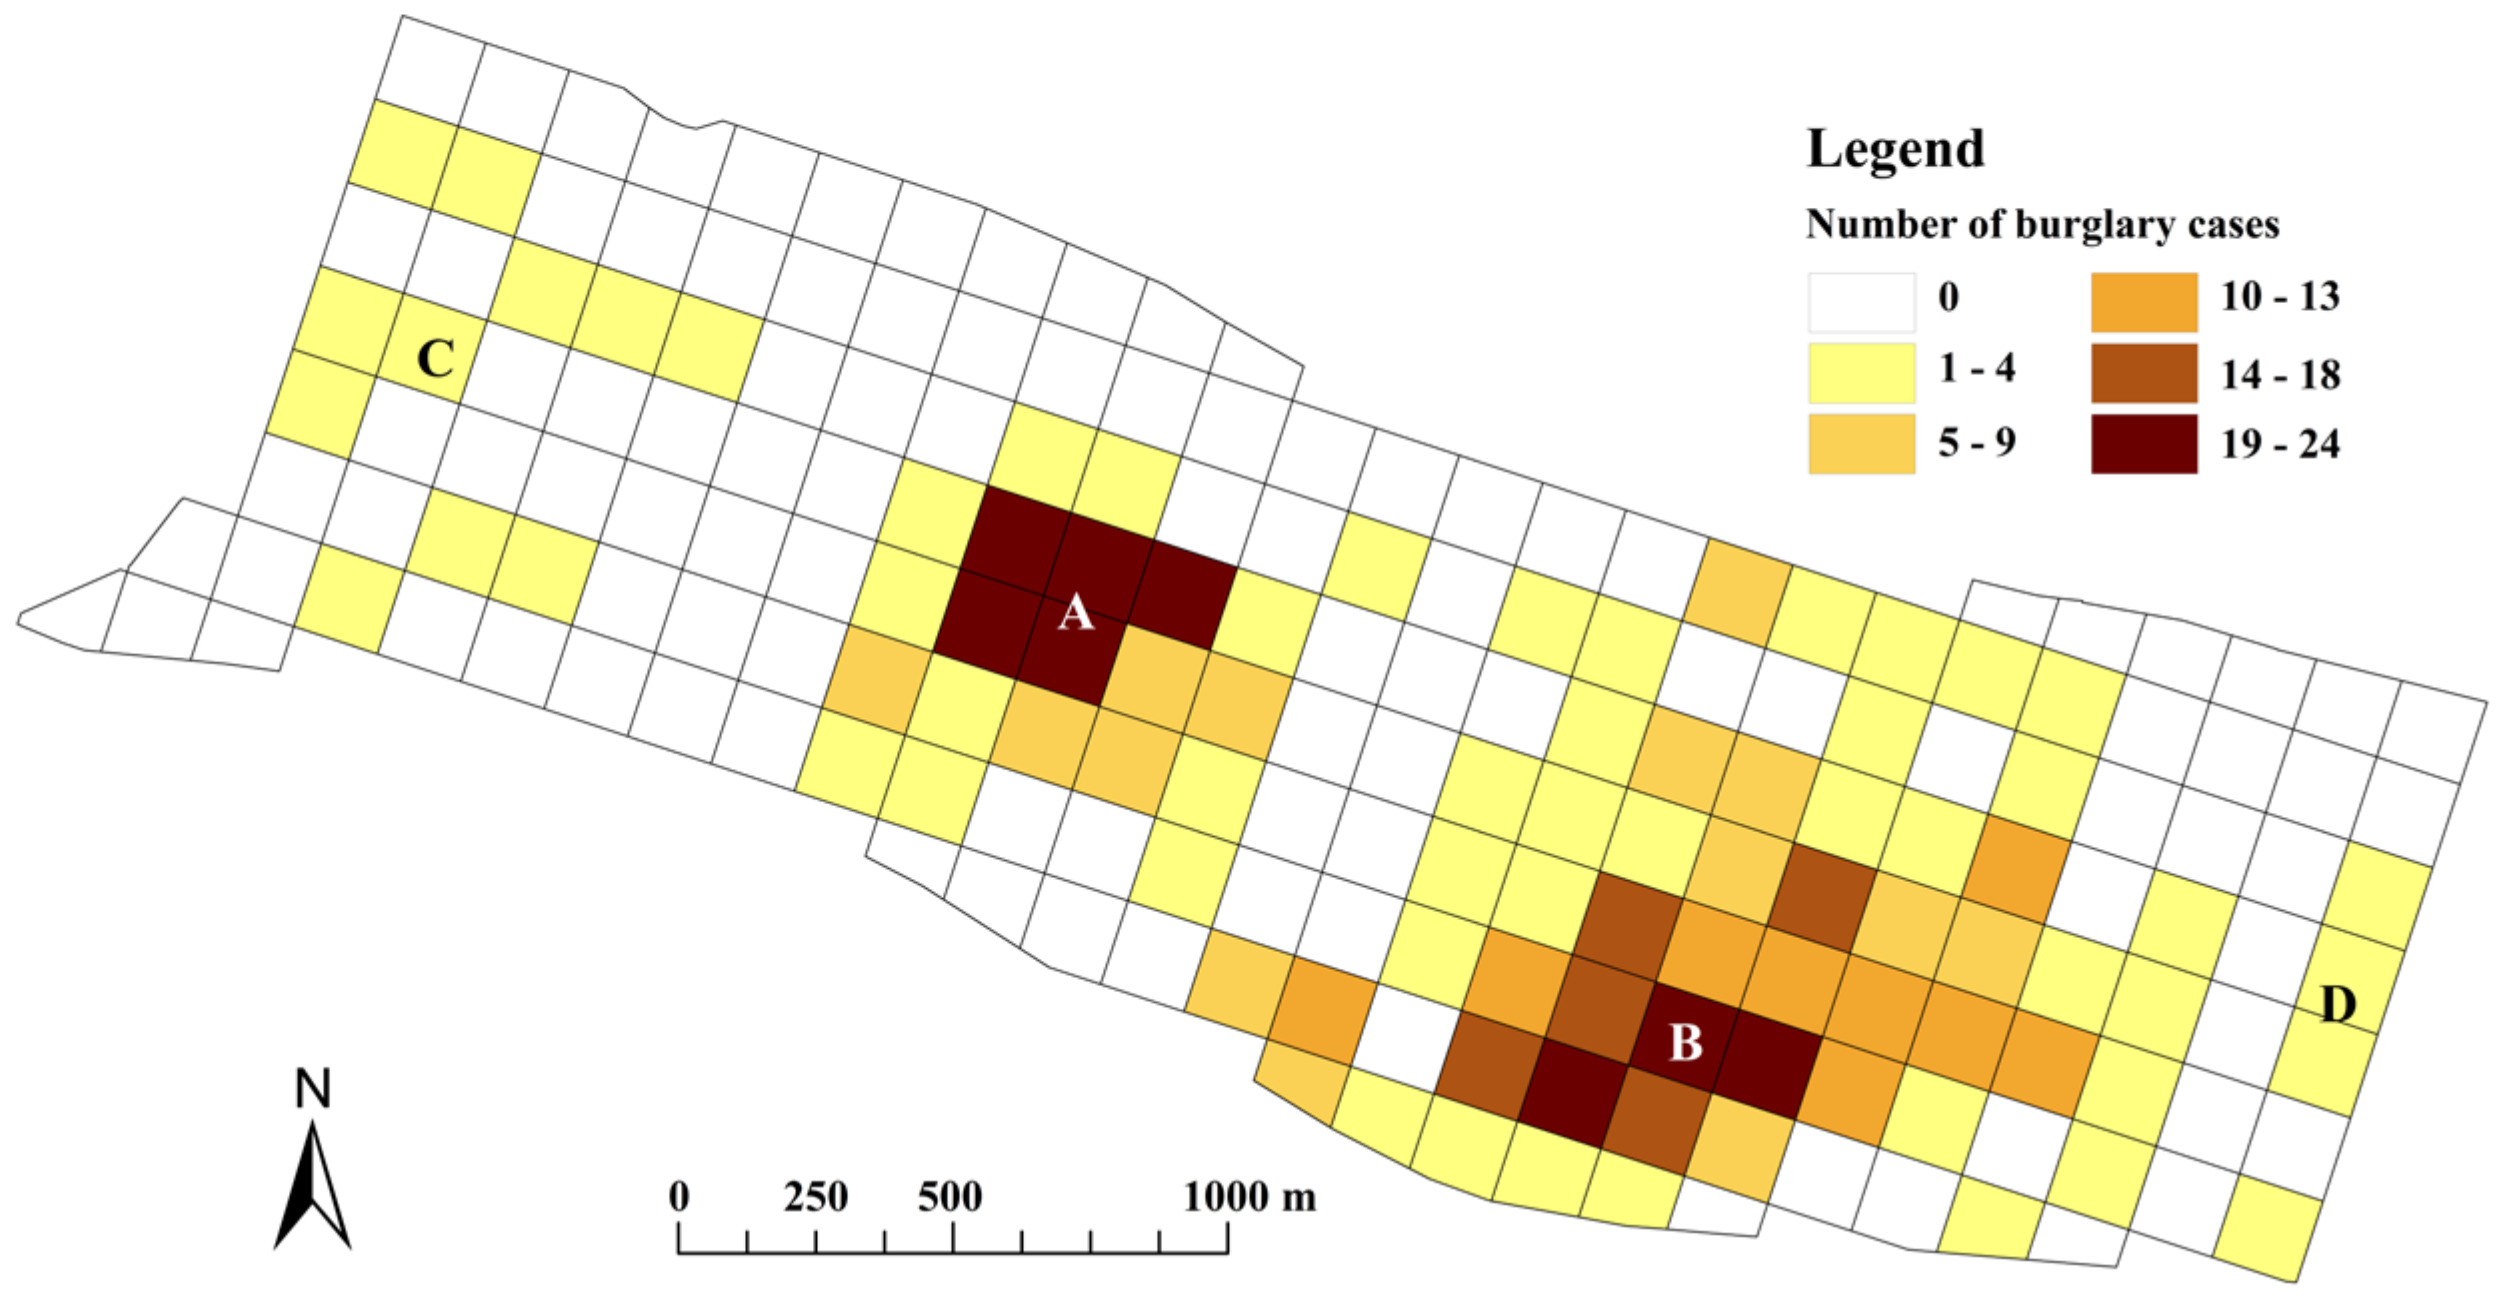
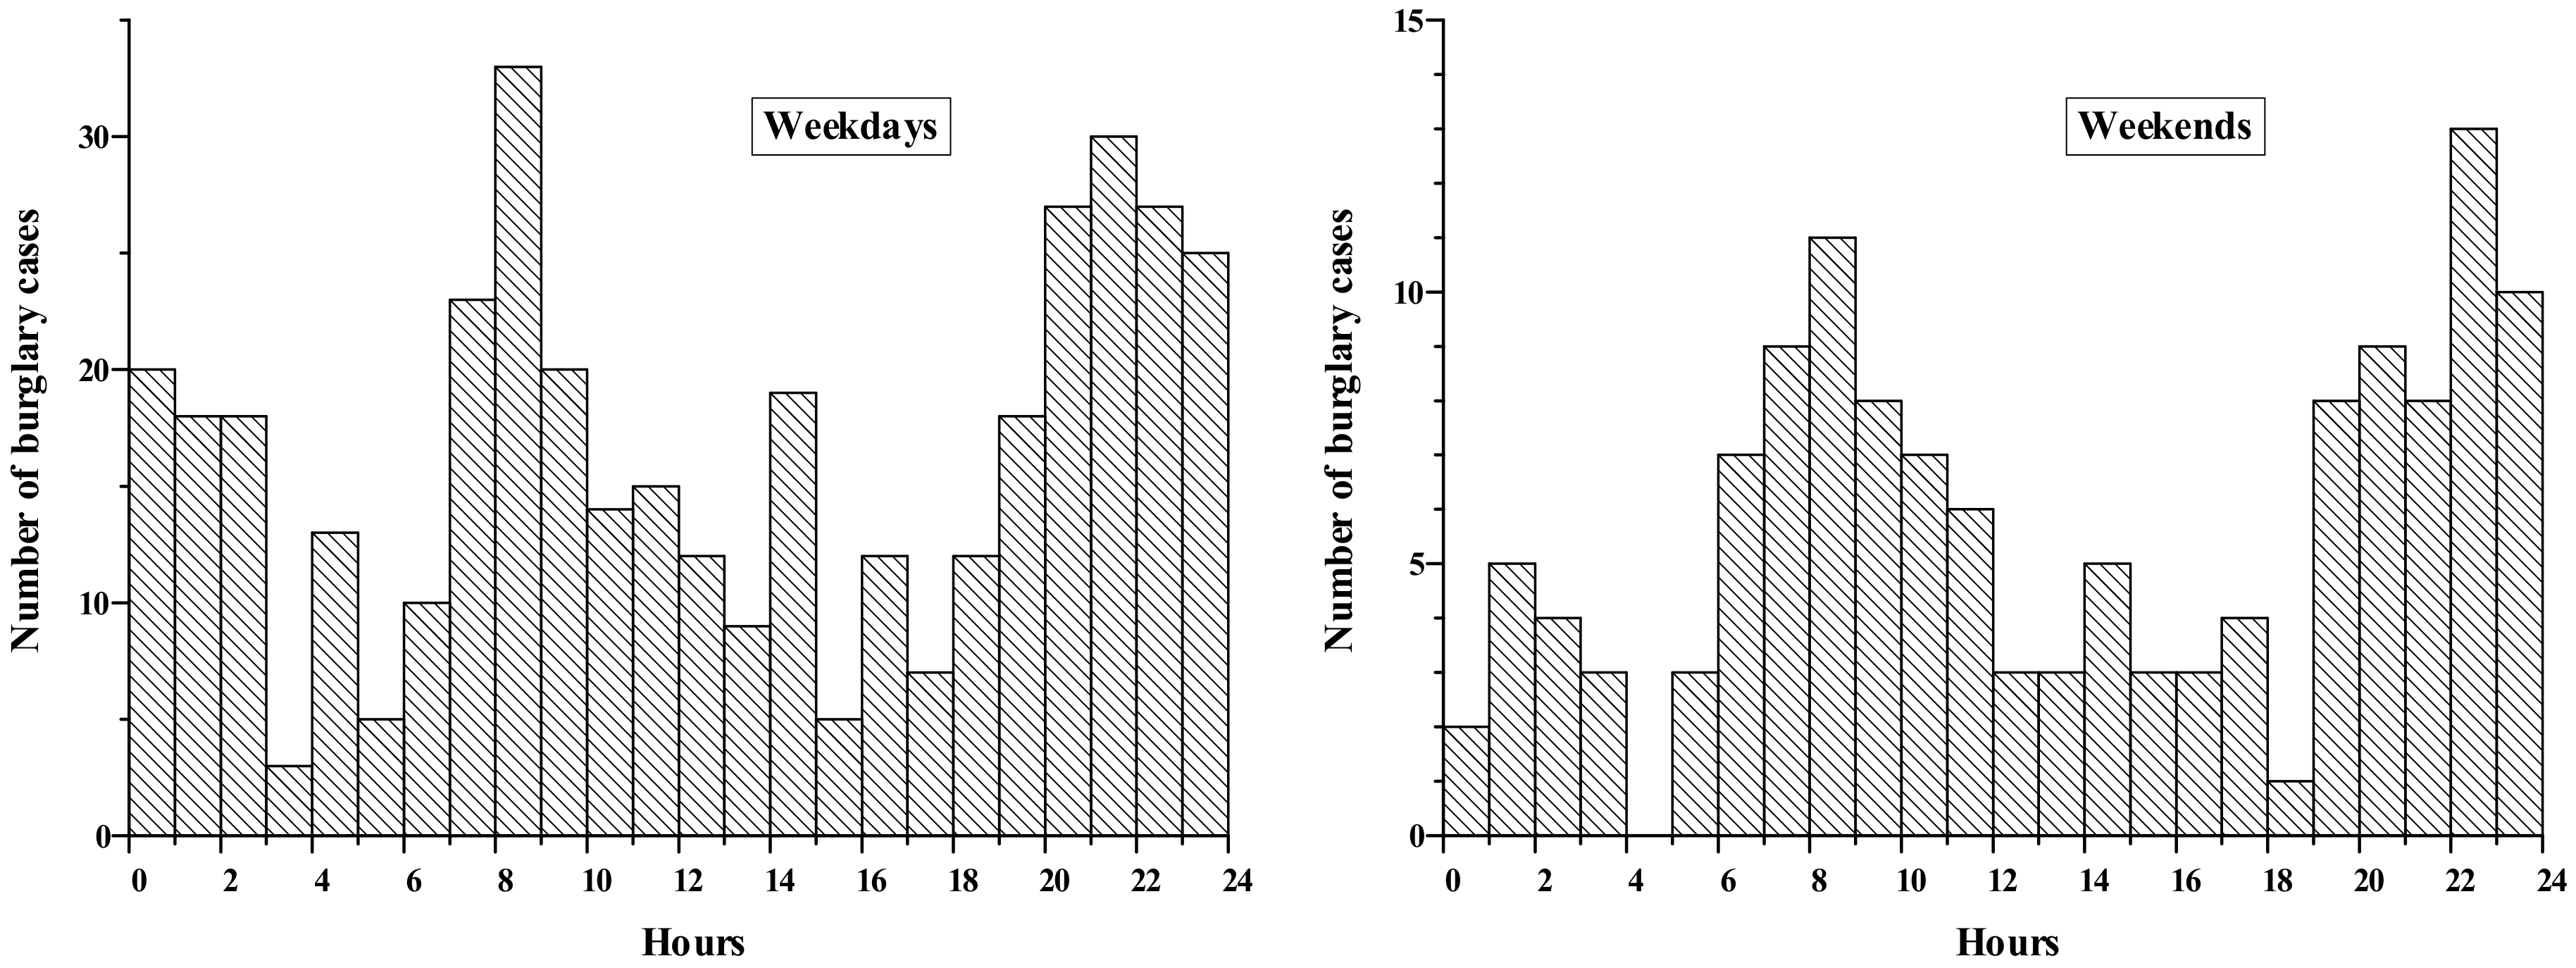
4.1. Spatial Distribution of Burglary
4.2. Measurement Result Comparison
4.3. Influencing Factors Analysis
5. Discussion
6. Conclusions
- (1)
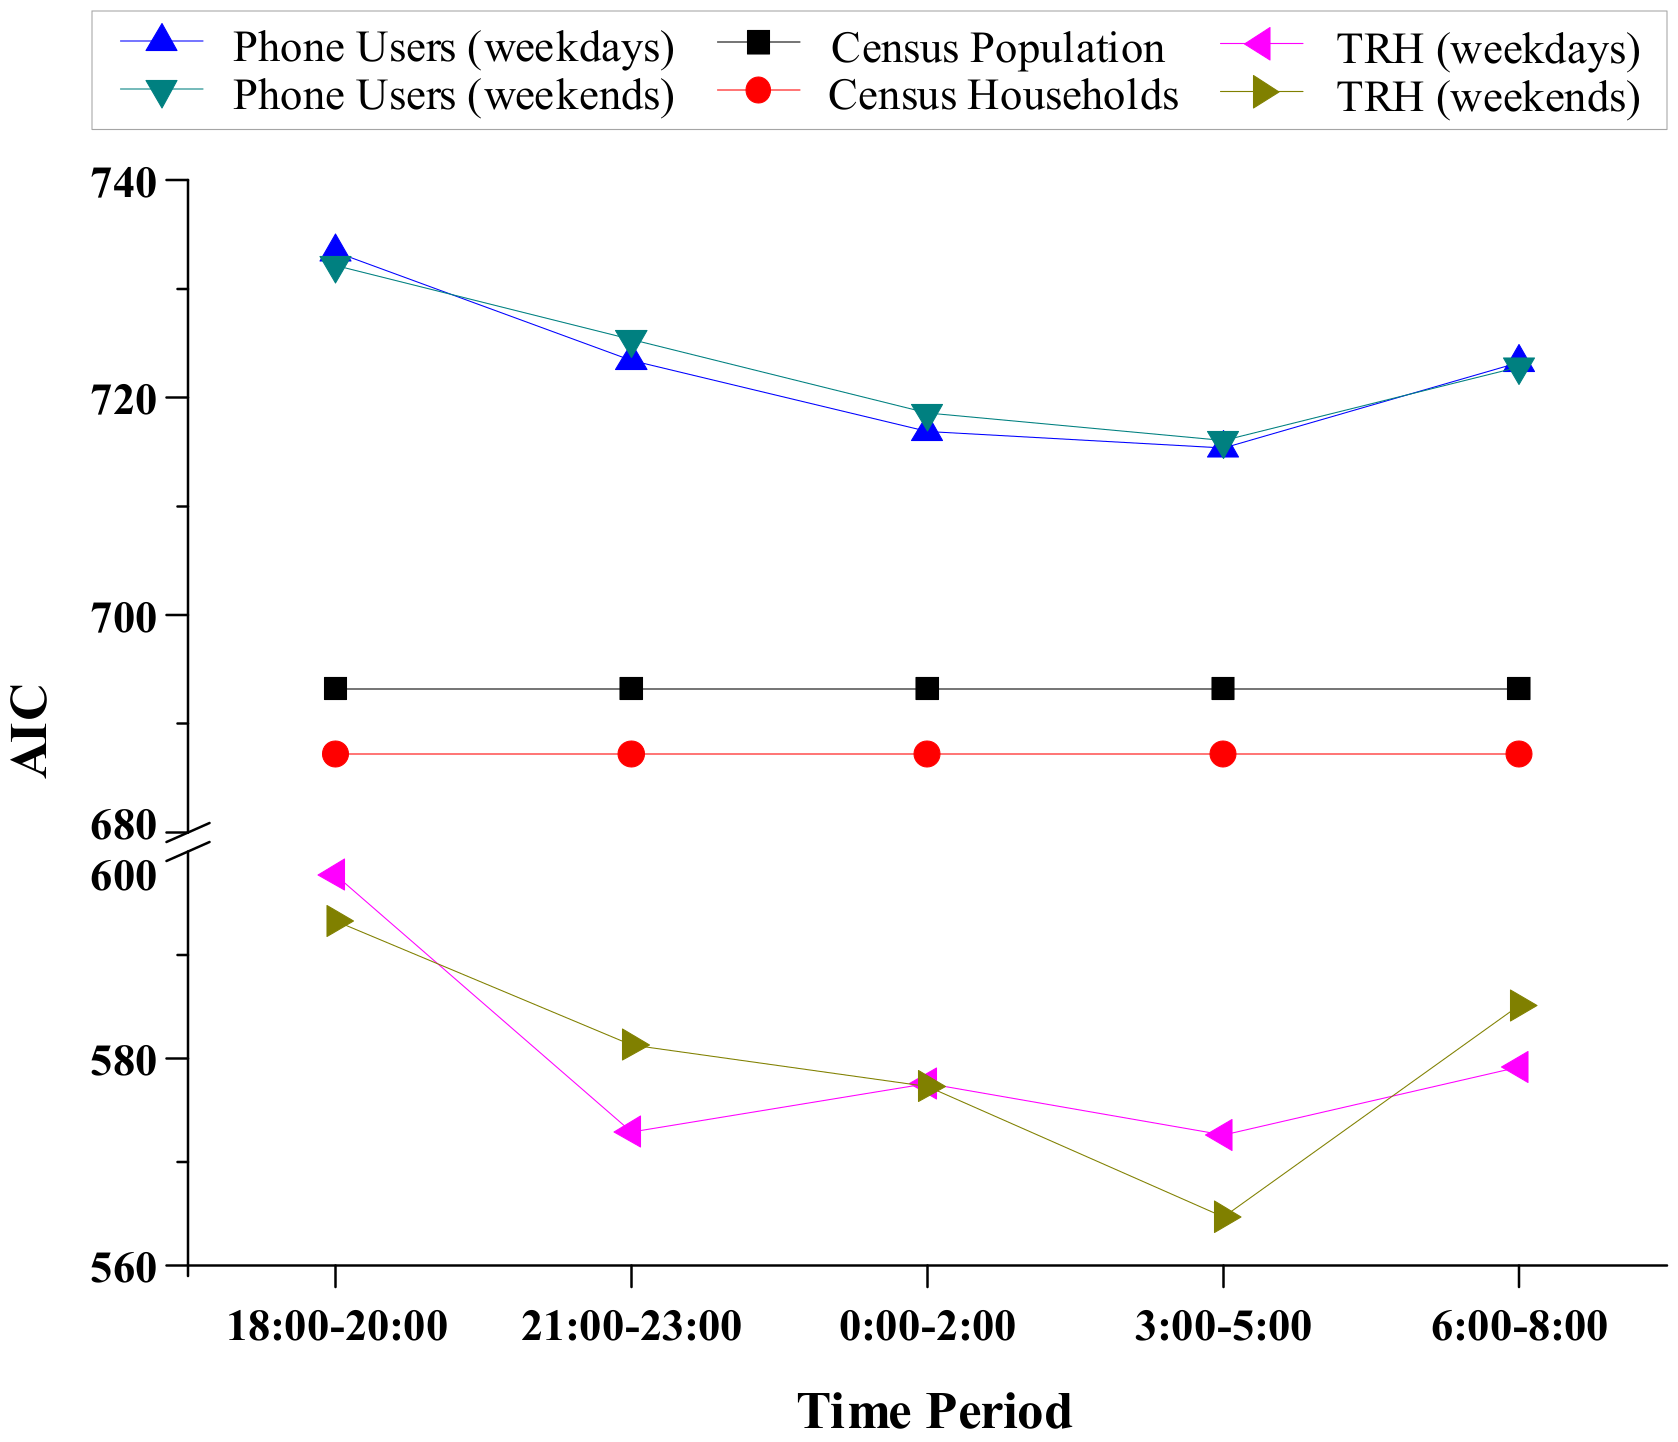
- The ranking of the performance from high to low was: TRH data, census households, census population, and mobile phone users.
- (2)
- The performance of TRH data varied in time. There existed minor differences in the performances between weekdays and weekends. The best time period for TRH data was 03:00–05:00 on weekends.
Author Contributions
Funding
Data Availability Statement
Acknowledgments
Conflicts of Interest
References
- Roth, J.; Lee, S.; Joo, J. The effect of community-level alarm ownership on burglary rates. J. Appl. Secur. Res. 2018, 13, 160–171. [Google Scholar] [CrossRef]
- Xiao, L.; Liu, L.; Song, G.; Ruiter, S.; Zhou, S. Journey-to-crime distances of residential burglars in china disentangled: Origin and destination effects. ISPRS Int. J. Geo-Inf. 2018, 7, 325. [Google Scholar] [CrossRef] [Green Version]
- Xiao, L.; Liu, L.; Song, G.; Zhou, S.; Long, D.; Feng, J. Impacts of community environment on residential burglary based on rational choice theory. Geogr. Res. 2017, 36, 2479–2491. [Google Scholar]
- Zhong, W.; Wang, D.; Xie, D.; Yan, L. Dynamic characteristics of shanghai’s population distribution using cell phone signaling data. Geogr. Res. 2017, 36, 972–984. [Google Scholar]
- Malleson, N.; Andresen, M.A. Exploring the impact of ambient population measures on London crime hotspots. J. Crim. Justice 2016, 46, 52–63. [Google Scholar] [CrossRef] [Green Version]
- Duan, Y.; Liu, Y.; Liu, X.; He, D. Measuring polycentric urban structure using Easygo big data: A case study of Chongqing metropolitan area. Prog. Geogr. 2019, 12, 1957–1967. [Google Scholar] [CrossRef]
- Song, G.; Liu, L.; Bernasco, W.; Xiao, L.; Zhou, S.; Liao, W. Testing Indicators of Risk Populations for Theft from the Person Across Space and Time: The Significance of Mobility and Outdoor Activity. Ann. Am. Assoc. Geogr. 2018, 108, 1370–1388. [Google Scholar] [CrossRef]
- He, L.; Páez, A.; Jiao, J.; An, P.; Lu, C.; Mao, W.; Long, D. Ambient population and larceny-theft: A spatial analysis using mobile phone data. ISPRS Int. J. Geo-Inf. 2020, 9, 342. [Google Scholar] [CrossRef]
- Liu, Y.; Li, W.; Wang, X. Spatiotemporal distribution of drug crimes at micro-scale: Taking NH and DM residential communities in SZ City as an example. Prog. Geogr. 2020, 39, 841–852. [Google Scholar] [CrossRef]
- Liu, L.; Liang, S.; Song, G. Explaining street contact crime based on dynamic spatio-temporal distribution of potential targets. Int. J. Geogr. Inf. Sci. 2020, 22, 887–897. [Google Scholar]
- Wang, Z.; Liu, X.; Lu, J. Multiscale geographic analysis of burglary. Acta Geogr. Sin. 2017, 72, 329–340. [Google Scholar]
- Roh, S.; Kim, E.; Yun, M. Criminal victimization in South Korea: A multilevel approach. J. Crim. Justice 2010, 38, 301–310. [Google Scholar] [CrossRef]
- Liu, D.; Song, W.; Xiu, C. Spatial analysis on robbery, forcible seizure, vehicle theft and burglary in Changchun. Sci. Geogr. Sin. 2014, 34, 1344–1352. [Google Scholar]
- Zhang, L.; Messner, S.F.; Liu, J. A multilevel analysis of the risk of household burglary in the city of Tianjin, China. Brit. J. Criminol. 2007, 47, 918–937. [Google Scholar] [CrossRef]
- Liu, L.; Jiang, C.; Zhou, S.; Liu, K.; Du, F. Impact of public bus system on spatial burglary patterns in a Chinese urban context. Appl. Geogr. 2017, 89, 142–149. [Google Scholar] [CrossRef]
- Xu, J.; Chen, P.; Chen, J. Research on spatial-temporal distributions of burglary based on the environmental criminology: Based on the analysis of crime in Beijing. Hum. Geogr. 2018, 33, 43–50. [Google Scholar]
- Sohn, D. Do all commercial land uses deteriorate neighborhood safety? Examining the relationship between commercial land-use mix and residential burglary. Habitat Int. 2016, 55, 148–158. [Google Scholar] [CrossRef]
- Vandeviver, C.; Bernasco, W. “Location, Location, Location”: Effects of Neighborhood and House Attributes on Burglars’ Target Selection. J. Quant. Criminol. 2019, 36, 1–43. [Google Scholar] [CrossRef] [Green Version]
- Chang, D. Social crime or spatial crime? Exploring the effects of social, economical, and spatial factors on burglary rates. Environ. Behav. 2009, 43, 26–52. [Google Scholar] [CrossRef]
- Stokes, N.; Clare, J. Preventing near-repeat residential burglary through cocooning: Post hoc evaluation of a targeted police-led pilot intervention. Secur. J. 2019, 32, 45–62. [Google Scholar] [CrossRef]
- Jones, P.A.; Brantingham, P.J.; Chayes, L.R. Statistical models of criminal behavior: The effects of law enforcement actions. Math. Models Methods Appl. Sci. 2011, 20, 1397–1423. [Google Scholar] [CrossRef] [Green Version]
- Wang, Z.; Liu, L.; Haberman, C.; Lan, M.; Yang, B.; Zhou, H. Burglaries and entry controls in gated communities. Urban Stud. 2021. [Google Scholar] [CrossRef]
- Long, D.; Liu, L.; Feng, J.; Song, G.; He, Z.; Cao, J. Comparisons of the community environment effects on burglary and outdoor-theft: A case study of ZH peninsula in ZG city. Acta Geogr. Sin. 2017, 72, 341–355. [Google Scholar]
- Song, G.; Xiao, L.; Zhou, S.; Long, D.; Zhou, S.; Liu, K. Impact of residents’ routine activities on the spatial-temporal pattern of theft from person. Acta Geogr. Sin. 2017, 72, 356–367. [Google Scholar]
- Montoya, L.; Junger, M.; Ongena, Y. The relation between residential property and its surroundings and day- and night-time residential burglary. Environ. Behav. 2014, 48, 515–549. [Google Scholar] [CrossRef]
- Armitage, R. Domestic burglary: Burglar responses to target attractiveness. In Reducing Burglary; Springer International Publishing: Cham, Switzerland, 2018; pp. 45–75. [Google Scholar]
- Li, L.; Lin, J.; Li, X.; Wu, F. Redevelopment of urban village in China—A step towards an effective urban policy? A case study of Liede village in Guangzhou. Habitat Int. 2014, 43, 299–308. [Google Scholar] [CrossRef]
- Xu, C.; Liu, L.; Zhou, S.; Jiang, C. Spatial heterogeneity of micro-spatial factors’ effects on street robberies: A case study of DP peninsula. Geogr. Res. 2017, 12, 2492–2504. [Google Scholar]
- Lyu, X. The characteristics of the criminal intelligence predictive analytical technology in the united states: An analysis from rand’s report. J. Intell. 2016, 35, 7–12. [Google Scholar]
- Griffith, D.A.; Amrhein, C.G.; Desloges, J.R. Statistical analysis for geographers. J. Am. Stat. Assoc. 1999, 94, 654. [Google Scholar]
- Niu, X.; Ding, L.; Song, X. Understanding urban spatial structure of Shanghai central city based on mobile phone data. Urban Plan. Forum. 2014, 6, 71–77. [Google Scholar]
- Wu, Z.; Ye, Z. Research on urban spatial structure based on Baidu heat map: A case study on the central city of Shanghai. City Plan. Rev. 2016, 40, 33–40. [Google Scholar]
- Shen, L.; Zhang, C.; Li, H.; Wang, Y.; Wang, Z. Relationship between urban rail transit commuting and jobs-housing balance: An empirical analysis from Beijing based on big data methods. Prog. Geogr. 2019, 38, 791–806. [Google Scholar]
- Chen, W.; He, X. Social work driven by big-data: Prospects and challenges. J. Soc. Sci. 2017, 7, 74–81. [Google Scholar]
- Feng, J.; Liu, L.; Long, D.; Liao, W. An examination of spatial differences between migrant and native offenders in committing violent crimes in a large Chinese city. ISPRS Int. J. Geo-Inf. 2019, 8, 119. [Google Scholar]
- Ratcliffe, J.H. Aoristic signatures and the temporal analysis of high volume crime patterns. J. Quant. Criminol. 2002, 18, 23–43. [Google Scholar] [CrossRef]
- Favarin, S. This must be the place (to commit a crime). Testing the law of crime concentration in Milan, Italy. Eur. J. Criminol. 2018, 15, 702–729. [Google Scholar] [CrossRef]
- Hanaoka, K. New insights on relationships between street crimes and ambient population: Use of hourly population data estimated from mobile phone users’ locations. Environ. Plan. B Urban Anal. City Sci. 2016, 45, 295–311. [Google Scholar] [CrossRef]
- Mburu, L.W.; Helbich, M. Crime risk estimation with a commuter- harmonized ambient population. Ann. Am. Assoc. Geogr. 2016, 106, 804–818. [Google Scholar] [CrossRef]
- Andresen, M.A. Crime measures and the spatial analysis of criminal activity. Br. J. Criminol. 2006, 46, 258–285. [Google Scholar] [CrossRef]
- Muhammad, R.; Zhao, Y.; Liu, F. Spatiotemporal analysis to observe gender based check-in behavior by using social media big data: A case study of Guangzhou, China. Sustainability 2019, 11, 2822. [Google Scholar] [CrossRef] [Green Version]
- Rizwan, M.; Wan, W.; Gwiazdzinski, L. Visualization, spatiotemporal patterns, and directional analysis of urban activities using geolocation data extracted from LBSN. ISPRS Int. J. Geo-Inf. 2020, 9, 137. [Google Scholar] [CrossRef] [Green Version]
- Liu, L.; Jiang, C.; Li, L. The effects of police CCTV camera on crime: A case study from Gusu district in Suzhou, China. Sci. Geogr. Sin. 2019, 39, 61–69. [Google Scholar]
- Davies, T.; Johnson, S.D. Examining the relationship between road structure and burglary risk via quantitative network analysis. J. Quant. Criminol. 2015, 31, 481–507. [Google Scholar] [CrossRef] [Green Version]
- Zawisza, T.; Garza, R. Using an eye tracking device to assess vulnerabilities to burglary. J. Police Crim. Psychol. 2017, 32, 203–213. [Google Scholar] [CrossRef]


| Variables | Mean | Variance | Minimum | Maximum | |
|---|---|---|---|---|---|
| Number of burglaries(cases) | 2.85 | 28.98 | 0.00 | 24.00 | |
| Census population (/100 people) | 3.99 | 2.23 | 1.46 | 7.75 | |
| Census households (/100 households) | 1.76 | 0.93 | 0.57 | 4.03 | |
| Mobile phone users (weekday) | 18:00–20:00 | 4.51 | 16.57 | 0.03 | 26.55 |
| 21:00–23:00 | 4.41 | 16.45 | 0.02 | 26.82 | |
| 00:00–02:00 | 3.33 | 12.21 | 0.01 | 26.47 | |
| 03:00–05:00 | 2.60 | 7.99 | 0.00 | 21.76 | |
| 06:00–08:00 | 3.18 | 9.49 | 0.01 | 22.40 | |
| Mobile phone users (weekend) | 18:00–20:00 | 4.75 | 17.09 | 0.04 | 23.77 |
| 21:00–23:00 | 4.64 | 18.26 | 0.04 | 28.70 | |
| 00:00–02:00 | 3.74 | 14.75 | 0.03 | 28.74 | |
| 03:00–05:00 | 2.82 | 9.23 | 0.02 | 24.16 | |
| 06:00–08:00 | 3.16 | 10.16 | 0.01 | 24.61 | |
| Tencent regional heatmap (weekday) | 18:00–20:00 | 4.69 | 10.97 | 0.03 | 14.54 |
| 21:00–23:00 | 4.55 | 13.72 | 0.02 | 16.31 | |
| 00:00–02:00 | 2.30 | 4.47 | 0.07 | 9.70 | |
| 03:00–05:00 | 1.05 | 0.86 | 0.00 | 3.73 | |
| 06:00–08:00 | 2.31 | 2.95 | 0.05 | 7.48 | |
| Tencent regional heatmap (weekend) | 18:00–20:00 | 4.60 | 11.19 | 0.09 | 13.94 |
| 21:00–23:00 | 4.06 | 9.94 | 0.09 | 14.41 | |
| 00:00–02:00 | 2.51 | 4.03 | 0.07 | 8.58 | |
| 03:00–05:00 | 1.11 | 0.88 | 0.00 | 3.65 | |
| 06:00–08:00 | 2.19 | 3.26 | 0.00 | 7.75 | |
| Number of surveillance cameras | 1.66 | 7.20 | 0.00 | 19.00 | |
| Road density | 0.27 | 0.03 | 0.00 | 1.00 | |
| Number of bus stops | 0.23 | 0.35 | 0.00 | 3.00 | |
| Number of apartment dormitories | 0.15 | 0.19 | 0.00 | 3.00 | |
| Number of commercial–residential buildings | 0.64 | 3.60 | 0.00 | 16.00 | |
| Number of residential district buildings | 0.81 | 1.77 | 0.00 | 8.00 | |
| Data | Source | Acquisition Time | Attributes | Processing Method |
|---|---|---|---|---|
| Burglaries cases | Municipal Public Security Bureau | 2017–2019 | Table: 547 cases | Drop point, intersection, summarize |
| Surveillance cameras | Municipal Public Security Bureau | 2018 | Point: 318 cameras | Intersect, summarize |
| Bus stops | “Daodaotong” electronic map | 2016 | Point: bus-stop location | Intersect, summarize |
| Housing types | “Daodaotong” electronic map | 2016 | Point: apartment dormitory, commercial–residential building, residential district building | Intersect, summarize |
| Road density | “Daodaotong” electronic map | 2016 | Line: community roads, low-grade roads but for traffic, village and town-level roads, county roads, provincial roads, domestic roads, national roads | 7 levels, weighted from 1 to 7; weighted kernel density analysis by level (radius 150 m); intersect |
| Census data | The sixth national census | November 2010 | Plane: community units | Intersect, weighted by area |
| Tencent regional heatmap | Tencent Company | 9–15 April 2018 | Point: 25 m interval sampling | Intersect, summarize |
| Mobile phone users | China Unicom | 12–18 May 2016 | Point: base station units | Create Thiessen polygons, intersect, weight by area |
| Variables Representing Potential Victims in Each Model | Mean VIF | Max VIF | |
|---|---|---|---|
| Census population (/100 people) | 1.17 | 1.50 | |
| Census households (/100 households) | 1.18 | 1.52 | |
| Mobile phone users (weekday) | 18:00–20:00 | 1.14 | 1.37 |
| 21:00–23:00 | 1.14 | 1.39 | |
| 00:00–02:00 | 1.14 | 1.38 | |
| 03:00–05:00 | 1.14 | 1.38 | |
| 06:00–08:00 | 1.14 | 1.37 | |
| Mobile phone users (weekend) | 18:00–20:00 | 1.14 | 1.38 |
| 21:00–23:00 | 1.14 | 1.39 | |
| 00:00–02:00 | 1.14 | 1.38 | |
| 03:00–05:00 | 1.14 | 1.38 | |
| 06:00–08:00 | 1.14 | 1.37 | |
| Tencent regional heatmap (weekday) | 18:00–20:00 | 1.18 | 1.50 |
| 21:00–23:00 | 1.17 | 1.46 | |
| 00:00–02:00 | 1.17 | 1.44 | |
| 03:00–05:00 | 1.18 | 1.45 | |
| 06:00–08:00 | 1.17 | 1.45 | |
| Tencent regional heatmap (weekend) | 18:00–20:00 | 1.18 | 1.51 |
| 21:00–23:00 | 1.18 | 1.47 | |
| 00:00–02:00 | 1.17 | 1.43 | |
| 03:00–05:00 | 1.18 | 1.44 | |
| 06:00–08:00 | 1.17 | 1.42 | |
| Model | Model I | Model II | Model III | Model IV | ||||
|---|---|---|---|---|---|---|---|---|
| Census Population | Census Households | Weekday 03:00–05:00 Phone Users | Weekend 03:00–05:00 TRH | |||||
| Variables | ||||||||
| IRR | Coefficient | IRR | Coefficient | IRR | Coefficient | IRR | Coefficient | |
| Residential population | 1.99 ** | 0.69 ** | 2.82 ** | 1.04 ** | 1.11 ** | 0.10 ** | 1.67 ** | 0.51 ** |
| Surveillance cameras | 1.02 | 0.02 | 1.01 | 0.01 | 1.09 * | 0.08 * | 0.98 | −0.02 |
| Road density | 0.89 | −0.11 | 1.26 | 0.23 | 0.21 | −1.58 | 1.69 | 0.53 |
| Bus stops | 0.37 ** | −0.98 ** | 0.41 ** | −0.88 ** | 0.50 ** | −0.70 ** | 0.81 | −0.21 |
| Apartment dormitories | 1.77 | 0.57 | 1.73 | 0.55 | 1.50 | 0.41 | 1.08 | 0.08 |
| Commercial–residential buildings | 1.02 | 0.02 | 1.09 | 0.08 | 1.04 | 0.04 | 1.12 ** | 0.12 ** |
| Residential district building | 1.10 | 0.10 | 1.13 | 0.12 | 1.06 | 0.06 | 1.19 ** | 0.17 ** |
| Constant | 0.11 ** | −2.25 ** | 0.22 ** | −1.52 ** | 1.14 | 0.14 | 0.12 ** | −2.15 ** |
| /lnα | 0.79 | 0.71 | 1.01 | −1.15 | ||||
| α | 2.20 | 2.04 | 2.74 | 0.32 | ||||
| AIC | 693.22 | 687.20 | 715.32 | 564.69 | ||||
| Pseudo R2 | 0.09 | 0.09 | 0.06 | 0.26 | ||||
Publisher’s Note: MDPI stays neutral with regard to jurisdictional claims in published maps and institutional affiliations. |
© 2021 by the authors. Licensee MDPI, Basel, Switzerland. This article is an open access article distributed under the terms and conditions of the Creative Commons Attribution (CC BY) license (https://creativecommons.org/licenses/by/4.0/).
Share and Cite
Zhang, Z.; Liu, L.; Cheng, S. Measurement of Potential Victims of Burglary at the Mesoscale: Comparison of Census, Phone Users, and Social Media Data. ISPRS Int. J. Geo-Inf. 2021, 10, 280. https://doi.org/10.3390/ijgi10050280
Zhang Z, Liu L, Cheng S. Measurement of Potential Victims of Burglary at the Mesoscale: Comparison of Census, Phone Users, and Social Media Data. ISPRS International Journal of Geo-Information. 2021; 10(5):280. https://doi.org/10.3390/ijgi10050280
Chicago/Turabian StyleZhang, Zhuofang, Lin Liu, and Sisun Cheng. 2021. "Measurement of Potential Victims of Burglary at the Mesoscale: Comparison of Census, Phone Users, and Social Media Data" ISPRS International Journal of Geo-Information 10, no. 5: 280. https://doi.org/10.3390/ijgi10050280
APA StyleZhang, Z., Liu, L., & Cheng, S. (2021). Measurement of Potential Victims of Burglary at the Mesoscale: Comparison of Census, Phone Users, and Social Media Data. ISPRS International Journal of Geo-Information, 10(5), 280. https://doi.org/10.3390/ijgi10050280