Abstract
Forest industry corporations use quality management systems in their wood procurement operations. Spatial quality data are used to improve the quality of wood harvesting and to achieve environmental sustainability. Some studies have proposed new management systems based on LiDAR. The main aim of this study was to investigate how efficiently planning systems can select areas for wood harvesting a priori with respect to avoiding harvesting damage caused by forest machinery. A literature review revealed the possibility of using GISs, and case studies showed the criteria required to predict the required quality levels. Terrestrial LiDAR can be utilized in authorities’ quality control systems, but it is inefficient for preplanning without terrestrial gamma-ray data collection. Airborne LiDAR and gamma-ray information about forest soils can only be used for planning larger regions at the forest level because the information includes too much uncertainty to allow it to be used for planning in small-sized areas before wood harvesting operations involving wood procurement. In addition, airborne LiDAR is not accurate enough, even at the forest level, for the planning of wood procurement systems because wood harvesting remains challenging without field measurements. Therefore, there is a need for the use of manual ground-penetrating radar for determining the peat layer thickness and the depth to the groundwater table.
1. Introduction
In Finland, national wood resources can be used to replace raw fossil materials and decrease fuel consumption because the annual increase is larger than the decrease in the wood stock of forests. This situation has existed for about forty years, and it is a threat to the development of a viable carbon sink and its environmental balance [1,2]. Therefore, as a sustainability objective, the share of renewable resources should be increased by at least 50% by 2030. This regulation was set by the Finnish government when it approved the climate and energy strategy for 2030 in 2016 [3]. The optimistic goals included in this strategy include the status of Finland as a carbon-neutral EU country in 2045 and the creation of a 100% carbon-neutral energy balance between production and consumption.
Countries such as Finland can use forests as a source of energy, fuel and other carbon-free products [4]. However, this will mean that wood harvesting operations in peatland areas will increase, which may also increase forest damage if conventional wood procurement management systems are applied. Consequently, wood procurement logistics will focus on a fast transition towards environmentally sustainable wood harvesting in peatlands, which will be part of the sustainability strategy adopted by forest industry corporations. Here, sustainability refers to ecological, social, economic and environmental sustainability [4,5]. This study investigates the literature on GISs that has been published to assess environmental quality management and wood harvesting damage. The results of this literature review and two experimental models will provide stakeholders with a useful management perspective to facilitate the comparison of suitable wood harvesting systems for wood procurement quality management in challenging development situations (Figure 1).
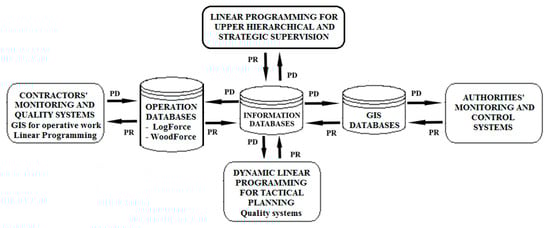
Figure 1.
Information flowchart for wood procurement management: PD = planning data; PR = planning results.
In practice, poor wood harvesting quality can be identified by stand damage and soil damage [6,7], which are the central sustainability features of the above-mentioned environmental sustainability imperative, but they are also ecological and economic issues. Risk minimization related to tree stem damage and soil rutting in areas of mechanized forest operations requires planning in the following order of priority: selection of machinery, seasonal timing of wood harvesting, skilled machine driving and route selection for roundwood forwarding. Some researchers have suggested that machine operators may make these decisions [8]. However, planning must be conducted prior to operative wood harvesting because, in practice, a harvester’s operator only executes minor route selections for forwarders during the logging operation. In addition, the forwarder’s operator only makes a decision to drive or not drive on a ready-made strip road. In wood procurement by the Finnish forest industry, managers and contractors are responsible for wood harvesting planning.
For decades, special home-made GIS-based planning systems have been developed by the forest industry and have supported managers in making decisions on wood harvesting operations [9,10,11,12,13,14]. More recently, public open GIS data sources have been developed by researchers, and these can be integrated into planning systems. They include the soil cartographic depth-to-water index [15,16,17] and various aggregations of wetness indices [7]. In addition, open data sources (e.g., soil maps and digital terrain models) and soil bearing capacity models are included in these systems [18,19]. Significant financial effort has been devoted to this purpose and a lot of development in the conservation of the forest environment and nature has been achieved thus far. On the other hand, these public open GIS-based dataset resources could be more beneficial for wood harvesting planning and operational work in wood procurement by the forest industry sector.
Currently, soil wetness maps are used to guide forest planning by authorities, but an accurate and robust prediction of soil rutting caused by harvesting machinery is not available for normal forest areas and peatlands. These maps are based on LiDAR data and are used to calculate the cartographic depth-to-water index (DTW). The values of the index indicate the spatial proximity to the nearest flow line with assumed wetland or imperfectly drained wood harvesting areas. Under these conditions, the index reveals a high susceptibility to soil rutting. On the contrary, opposing index values indicate dry and therefore suitable wood harvesting areas.
During the last decade, advanced data-driven methods have been developed in the geoscience and remote sensing areas for the classification and segmentation of materials lying over or beneath the Earth’s surface. They are discussed in this chapter to introduce the latest advanced work by citing the following studies [20,21,22]. Recent advancements in deep learning techniques provide solutions to the difficulty of single modality-dominated classification by developing multimodal deep learning methods [20]. In recent years, various non-negative matrix factorization methods have also become popular for solving this calculation problem and achieved promising levels of performance [21]. To verify the effectiveness of the proposed approaches, experiments have been conducted on both simulated and real hyperspectral datasets [22]. These experimental tests have been conducted using urban hyperspectral images. For example, experimental results based on ISPRS 2D Potsdam and Vaihingen datasets show that the proposed fine segmentation network outperforms the single modal networks and provides better segmentation results with a relatively moderate computational complexity [21]. It would be interesting to test these promising classification and segmentation techniques under more difficult forest harvesting conditions with uncertain variation in image elements. Furthermore, experiments must be executed accurately and robustly to provide a useful classification in regard to the challenging environmental criteria required by authorities; these are introduced in the next section.
1.1. Harvesting Machinery for Drained Peatland Wood Harvesting
At the national forest level, airborne laser scanning is used to collect information for the calculation of forest inventories and to determine their environmental balance. Based on calculations, peatland forests account for about 25% of the total wood stock and growth in Finland [23]. The share of drained peatland areas is 55%, and this is only used in timber production. Thus, the amount of wood that can be harvested annually is about 15 million cubic meters, which represents a share of about 20% from annual wood harvesting. Clearly, peatland areas are an important source of renewable wood for the forest industry. In addition, according to calculations, the carbon sink of peatland forests is about 13 MtCO2 eq. (million tons of carbon dioxide equivalents) [24]. Since about 50% of the wood is in the root system, the carbon sink of the terrestrial part of peatland stands is about 6 MtCO2 eq., which is also a danger if it is released to the atmosphere without active wood harvesting operations.
The machinery used for peatland wood harvesting appears to be problematic. This is surprising because decades ago, special machinery was invented for summertime wood harvesting. However, the main problem is related to the profitability of harvesting operations. There is rarely the possibility to use special machinery for peatland wood harvesting operations when applying the cut-to-length method (CTL) because harvesters and forwarders are expensive. Usually, the same harvesting machines operate on peatland and mineral soils (Figure 2). Furthermore, the same machinery is often used for thinning and final open felling. Therefore, it is not profitable to use special machines. Over the last four years, approximately 2100–2300 forwarders have been operated for wintertime wood harvesting operations, but in the summertime, harvesting is managed by only around 1400–1700 forwarders [25]. This difference is the main reason for the low profitability of wood harvesting, since the machinery utilization rate falls remarkably in the summer due to the seasonality of wood harvesting [26]. Increasing the number of special forwarders is impossible as an alternative to improve the quality management of wood procurement because the high cost of wood harvesting machinery necessitates a high annual utilization rate.
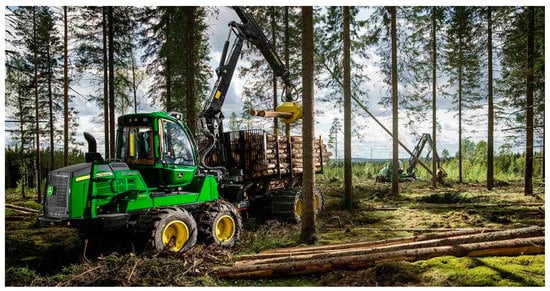
Figure 2.
Forwarder and harvester in use during summertime wood harvesting operations. Source: John Deere Forestry Ltd.
Several single-grip harvester and forwarder monitoring systems have been applied for CTL wood harvesting. One alternative to support the harvesting quality monitoring of machinery involves the application of image processing theory. For example, single-grip harvesters may result in stem damage to remaining trees, thereby reducing the growth and wood quality of trees [6]. This amplifies the need for the development of a decision support system to monitor stem damage caused by harvesters. To improve the damage monitoring system, development work could focus on terrestrial laser scanning or multi-view photogrammetry of stem damage [6,27,28,29,30,31]. It has also been suggested that these techniques and methods should be used for the monitoring of wood harvesting work because a low bearing capacity causes soil rutting and tree damage. Based on the investigation of the available wood harvesting machine types and models, there are significant differences between the nominal ground pressures exerted by the current machinery and therefore the amount of soil rutting caused by the machinery [32,33,34,35]. It is recommended that light forwarders equipped with at least eight wheels and the widest tracks as possible are used for forest wood haulage. In the same studies, both harvesters based on wheeled technology and harvesters based on tracked excavators were considered suitable for use as wood cutting machines during the challenging summer and autumn wood harvesting seasons.
Tracked machinery is more suitable for peatlands than wheeled wood harvesting machinery because the nominal ground pressure of the tracked machinery is divided more evenly into the ground [36]. However, wheeled wood harvesting machinery is often selected because, as mentioned, the selection of machinery is related to the profitability of harvesting operations. Therefore, the use of the right shaped track systems on wheels is important to improve the carrying capacity of the forwarder. However, forest soil rutting cannot usually be completely avoided. In this respect, the 6-wheeled forwarder causes about 30% deeper ruts into the ground than the 8- and 10-wheeled forwarders [32].
The classification of forwarders in terms of different levels of nominal ground pressure is useful planning information [37]. In theory, the forwarder’s load size can be determined by calculating the impact of the load on the axis masses and the nominal ground pressure. Palander et al. [33] stated that, in practice, a slightly rear-loaded weight distribution is better than a front-loaded weight distribution. By using a rear-loaded weight distribution, a forwarder’s operator can influence the load balance of the forwarder, e.g., by front-butt loading in such a way that the peatland’s rutting caused by forwarders is reduced. Furthermore, by using a wood loader, the operator has the potential to impact the weight distribution of the wheels and therefore also the rut formation on small soft areas inside peatlands.
A carrying capacity classification of stands and machinery for wood harvesting planning on peatlands is available [37]. This can be used for summer- and autumn-time wood harvesting to ensure environmentally sustainable wood procurement by reducing wood harvesting damage. From the same study material, empirical causality models have been drawn up to estimate the soil rutting process caused by the machinery. By using these models in planning systems, the carrying capacity classification of harvesting sites and wood harvesting machinery supports both managers and contractors in their management work to achieve an environmentally sound wood harvesting level. Ultimately, a suitable forwarder can be selected for use in specific peatlands under challenging wood harvesting conditions. In this planning work, the most important variables are the type of wood harvesting machinery used, the depth to the groundwater table, rainfall in the preceding four weeks, the peat layer depth, the stand’s road network at the harvesting site and the tree volume per hectare in prior harvesting operations [37]. These factors are also important variables of GIS models, which should be collected as spatial data by photographing or laser scanning systems.
The impacts of tree damage and soil rutting are of importance for forest owners and, to some extent, for contractors [38,39,40]. Due to the low bearing capacity and soil rutting, the profitability of wood haulage is negatively influenced by higher fuel consumption and decreased productivity. Therefore, some GIS studies have only focused on measuring these problems by modeling the trafficability of machinery [41]. This concept is used as a metric to assess the capability for vehicle movement through an area. It is based on the relationship between a forwarder and the special characteristics of the area through which the forwarder moves [11].
Basically, peatland soil rutting depends on the soil properties. In scientific disciplines, a severe problem is the lack of a universally consistent soil classification system. It has been observed that, in almost every country, research groups are using different nomenclatures. This causes difficulties when discussing and publishing scientific results. This is particularly common among geologists and people working with soil mechanics. For this reason, research works should adopt a universal classification and terminology, e.g., the FAO-UNESCO soil classification system [42,43,44]. By constructing universal, public and open soil knowledge databases (e.g., the Soil Wetness Index map), soil parameters could be used efficiently by separate scientific disciplines for the development of wood harvesting machinery trafficability.
1.2. Aims of the Current Study
According to the literature, environmental wood harvesting damage in peatland areas usually involves tree damage and soil rutting. There are no issues with the final open felling of forests, but it is crucial to be able to predict when a wood harvesting site is suitable for thinning without causing damage. Spatial measurements of tree stem damage and soil rutting (percentage and maximum depth) are used as indicators of an acceptable level of damage. With respect to both measures, however, it is not clear how spatial measurements of tree damage and soil rutting should be conducted or who will use these measurements. Is the purpose of the proposed measurements to be used for administrative information systems or wood procurement management systems? In this study, it is argued that different GISs should be used for different purposes in forestry. Therefore, this study evaluates the justifications for conclusions about the proposed use of GIS applications involving ground-penetrating radar, photographing, airborne LiDAR, airborne gamma ray, terrestrial gamma ray and terrestrial LiDAR. In addition to the planning systems of authorities, this study investigates how efficiently GISs can select harvesting areas a priori for wood harvesting to procure wood by the forest industry, which is the unique contribution of this publication to the literature. This investigation is conducted from the perspective of quality management systems.
2. Framework of Innovative GIS Applications: Literature Review
Wood procurement managers need a quality management system for planning, monitoring and controlling the sustainability criteria of wood harvesting at the forest level [5]. GISs and the carrying capacity classification are also already available for small-sized areas, i.e., at the stand level, and can be used to consider quality criteria before wood harvesting. Although remotely recognized image classification or mapping methods, such as land observation and soil composition analysis, are becoming increasingly important in forest planning, all of them depend on the design of efficient classifiers and classification products [44]. However, a digital management system for the quality control of tree and soil damage after harvesting is not yet available.
At the machinery system level, it is possible to use automatic monitoring and data collection, e.g., during the operation of the forwarder. Thus, it is suggested that they could serve as the kind of spatial information that managers need both for the control of actual work and for future wood harvesting planning [6,8]. However, the use of operational measurements for administrative control regarding tree damage and soil rutting damage would be a massive task that is hardly worth undertaking, as damage can be easily and cost-effectively controlled by using the photographing camera in the forwarder’s cabin and manually checking the administrative control if needed [6,28].
As a GIS tool, it is important to consider ground-penetrating radar as a data collection possibility for use in planning systems. This is a sensing technique in which the two-way travel time of a pulse of high frequency energy reflected off the interface between the peat and the underlying ground strata is measured [45]. In practice, the method produces spatial measurements of the peat thickness in a peatland area [46,47,48]. A series of measurements can then easily be interpolated to produce a peat depth map. However, ground-penetrating radar measurements are labor-intensive, particularly when mapping the peat depth over a large forest area [49].
2.1. Wood Harvesting Planning Systems
Manual peat depth measurement and ground-penetrating radar measurement can be performed by various tools. Manual calculation of the peat depth can accordingly be replaced by ground-penetrating radar data, which can be used to calculate and model peat depth information for wood harvesting planning systems of wood procurement. The measurement methods use data collection lines with a distance of 10 m between penetrating points over areas of hundreds of square kilometers in peatland studies [50]. Compared to other methods of measuring the peat depth, the ground-penetrating radar method is the most commonly deployed measurement method due to its high accuracy, cost efficiency and minimal equipment requirement [50,51,52]. Although it is the most accurate method for collecting wood procurement planning data, it is also too expensive to use both before logging and for the wood harvesting quality management systems afterwards.
In laser scanning data collection, the laser pulses are sent towards an object (e.g., a tree stem or ground surface) [53]. When they are sent towards the ground, the pulses may hit the ground, undergrowth, tops of standing trees or the branches of trees. The reflected pulse can be used to specify the location of the item receiving the pulse, and the height of the scanner can be determined based on the location information and the time taken by the laser pulse to travel to it. The scanner also measures the strength of the return pulse. In this respect, the pulse value is based on the set of items in the specified area, which represents the laser pulse rather than an individual item. The coordinates of individual laser pulses can be converted to terrestrial coordinate systems and the height findings. By using point clouds obtained from processing reflections and/or from echoes, it is possible to form continuous surface models, such as a ground model and depth or height model [31]. In theory, the difference between the forest ground and the soil’s rut bottom can be calculated from the models. On the other hand, Hyyppä et al. [54] reported that the values of the tree height model are usually mild underestimates because the laser pulse may not always hit the top of the tree.
Several GIS studies recommend wood harvesting planning systems based on open data [18,29,55,56]. The airborne LiDAR sensor has been used as an alternative for collecting peatland data for planning systems within the forest environment, e.g., for the needs of authorities at the forest and stand levels. LiDAR-derived elevation data have also been tested for use in peat depth modeling and the trafficability mapping of forest machinery [17,57,58]. A digital elevation model was used to describe the topography, slope, wetness index and distances to water elements (ditch, river). Attempts at the static modeling of peat depth using remotely sensed data such as elevation and slope have shown promise [15], but it is necessary to assume that an a priori dynamic functional relationship exists between the gradually accrued (over a long period of time) peat depth and current harvesting conditions [59]. Therefore, it can be concluded that it is impossible to model the dynamics of peat depth accurately enough based on data produced by airborne LiDAR. Accordingly, this method is not accurate enough for collecting wood procurement planning data both before and after the use of harvesting quality management systems.
Some recent studies suggest that the combined use of airborne gamma-ray data and airborne LiDAR data provides a practical means to estimate the peat depth without a priori knowledge collected by manual measurements [6,59,60]. Gatis et al. [59] reviewed LiDAR-derived variables known to influence peat accumulation (elevation, slope, topographic wetness). In addition, they concluded that gamma-ray spectrometric data correlate with peat occurrence. Based on both this and prior knowledge, Gatis et al. [59] combined LiDAR-derived variables with gamma-ray spectrometric survey data to investigate whether two technologies could be used more effectively to develop a dynamic peat depth model. Tests were successful, and it was shown that these models could be used in wood procurement planning systems before wood harvesting, which facilitates the management of large peatland areas at the forest level.
All mineral soils are, to varying degrees, radioactive. That is why the radioactive isotopes of mineral soil emit short-wave electromagnetic radiance from the ground. Magnetic, electronic and radio-metric measurements are produced by aero-geophysical mapping. These soil mapping flights have been carried out systematically since the beginning of the 1970s at a flight height of between 30 and 50 m and a flight line distance of 200 m. These elements of natural gamma radiation materials were interpolated on a 50 × 50 m raster [61]. Both airborne and terrestrial tools can be used to measure the radiation in mineral soils to take advantage of the thickness of the peat layer and to identify wetland areas because the flux of gamma-ray radiation, particularly from potassium and thorium, decreases when the soil moisture content increases [62,63,64,65]. The water content of peat is, on average, 90%. That is why it is impossible to detect gamma rays in peatlands with natural humidity levels if the peat layer thickness is more than 0.6 m [63]. This relationship has been used to provide wet and site index estimations of peatlands. More recently, Pohjankukka et al. [56] found that the sandy till and sphagnum peat soil types could be detected well from gamma-ray data. By using this information, they predicted the soil types present.
Regarding the development of planning systems, the use of terrestrial LiDAR to produce ground rutting data has been tested, e.g., by using harvester data for the needs of authorities at the forest and stand levels [8]. Although standard techniques have been developed for laser technology to identify objects, the separation of individual objects and backgrounds from forest environments raises problems that have not yet been satisfactorily resolved and are the main challenge in planning systems [66,67]. Based on the results from an experimental field study, a forest machine-mounted LiDAR sensor can be used to collect rut depth data at a spatial resolution of 10–20 m with careful treatment of raw point cloud data [67]. Studies have shown that the spatial data produced could be used to develop nationwide forest trafficability maps of wood harvesting for administration [68]. However, this spatial information is not accurate enough for use in determining forest machinery trafficability under Finnish wood harvesting conditions, although a previous study showed that the average root mean square error (RMSE) of test sites was 3.5 m for LiDAR compared to manual measurements [8]. Furthermore, due to the surface topography and vegetation, the terrain level calculation is affected by uncertainties due to reflections from other objects in the rut depth data. In addition, rocks and stumps between the wheels cause outliers in the LiDAR-measured rut depth data. Due to these common disturbances, rut depths can be either under- or overestimated at several locations. Moreover, it must be remembered that old data are useless for wood procurement planning systems because decisions must be made just before machinery is moved to the wood harvesting site.
2.2. Monitoring and Control System
Several pieces of research have reported that terrestrial LiDAR could be used for the segmentation of individual trees and the detection of tree damage from spatial data [69,70]. However, the detection of stem damage is a challenging task [71,72]. Therefore, with respect to the development of tree damage control indicators, it is more cost-effective to use photographing tools rather than laser tools for the monitoring and control of damage in peatland wood harvesting [66]. Furthermore, it seems that contractors do not need to use terrestrial LiDAR in operational wood harvesting planning, and without public financial support for investment in an automatic real-time sensor, it is impossible to produce applicable data for authorities for modeling the forest trafficability predictions of machinery.
Accordingly, it has been presented as a benefit of terrestrial LiDAR and photographing that the collection of real-time data by forestry machines during wood harvesting could be beneficial for wood harvesting quality systems [68,71]. However, without additional computational systems, real-time data are useless [72]. Currently, machine learning methods are used to produce peatland maps, as they can identify classification data with large dimensionality features. Previous studies suggest that there is also great potential for the production of computer applications for quality systems [6,68,73]. However, these applications require very sophisticated calculation methods and are therefore too expensive for wood harvesting purposes. Furthermore, in machine learning, developers often assume that raw data components are independent when evaluating model performance. However, this rarely holds true in practice. Therefore, the machine learning method is not suitable for post-wood harvesting quality control in wood procurement information systems. Data are collected under conditions of natural uncertainty, causing large variation in wood harvesting conditions, but quality measurement must be conducted with high accuracy and cost efficiency. Recently, experimental results have shown that new proposed machine learning structures may provide more promising segmentation solutions [20,21,22]. However, results are based on experimental datasets without considering the above-described natural variation in peatlands during real machine work.
It is suggested that post-harvest quality control of the rut depth would provide spatially and temporally extensive LiDAR data for the development of forest trafficability models for wood forwarding [8]. If this happens, it will also be necessary to consider the requirements of sophisticated calculation methods, such as those presented by Pohjankukka et al. [72]. It handles the autocorrelation problem of spatial information. GIS datasets are an example of data points with stronger dependency on each other the closer they are geographically. This phenomenon is known as spatial autocorrelation. In this situation, the standard cross-validation methods produce results that are too optimistic, i.e., biased prediction estimates for spatial models, which results in increased costs and working damage in practice. Pohjankukka et al. [72] proposed a spatial k-fold cross-validation method to overcome data problems associated with terrestrial LiDAR. However, as noted above, this method was developed and tested under ideal experimental forest harvesting conditions.
In theory, both wood harvesting quality problems related to the damage of monitored objects (tree stem damage and soil rutting) should be solved efficiently by using the stereo camera technique in forwarders, which operate in the forest after the use of harvesters. Therefore, it is important to research how to introduce how the terrestrial camera mounted in a forwarder’s cabin can yield digital operational photographs and the requisite spatial damage information. Recent forestry-related studies have suggested that multi-view photogrammetry and image processing could be implemented operationally, as they are more affordable alternatives to laser scanning systems [27,28,29,30,74,75,76,77]. In particular, the resource-intensive nature of current terrestrial LiDAR-based monitoring systems is of concern [28,30,78]. Marra et al. [77] photogrammetrically estimated soil rutting dimensions and soil compaction after increasing the number of forwarder passes. They reported that a problem with photogrammetry is object reflection (grass, logging residues and water), which, in some cases, influences the accuracy of the method. The previous section listed problems with terrestrial LiDAR, which seem to be more serious under the practical wood harvesting conditions of peatlands in regard to operational planning and control.
According to Salmivaara et al. [8], mounting the terrestrial LiDAR sensor on an operational forest vehicle is a cost-efficient tool for conducting extensive rut depth data collection as part of normal forestry operations. However, they did not analyze any cost data. Furthermore, their field study experiment was carried out in mid-May in the wood harvesting season, which provided ideal laboratory conditions for terrestrial LiDAR data collection. In practice, peatland forest thinning occurs during the summer and autumn when wood harvesting conditions are the most problematic for LiDAR sensors with respect to the amount of over-ground vegetation. In addition, the authors concluded that the LiDAR method is applicable across the national range of forest conditions, although its use after right-time data collection during the summer and autumn has not yet been investigated and justified, which are prerequisites for extensive national data collection. To date, the results are only robust for ideal experimental soil and vegetation and surface topography characteristics. As the data variation in LiDAR measurements will be different (larger) under real harvesting conditions, strong conclusions from experimental case studies should be carefully considered before making generalizations. Additional research must be conducted before the current presented conclusions about the ability of terrestrial LiDAR to produce spatial information can be justified. During wood harvesting in the summer or autumn, soil rutting caused by the forwarder has not yet been successfully measured for the development of a monitoring and control system, when terrestrial LiDAR is mounted on the forwarder during forest wood haulage.
2.3. Literature Synthesis for Quality Management System
Several GISs are available for the development of damage monitoring and control systems. They have been validated carefully in relation to the development of a quality management system for wood procurement. Hypothetically, in terms of damage detection, an automatic monitoring system based on the image processing of either photography or laser scanning could provide decision support to stakeholders while taking account of the quality-related factors of sustainable wood procurement during daily logging operations. However, as described above, daily planning systems are more important for wood procurement managers than authorities. Ultimately, they must be spatially based on the causal and consequence assessments of reported wood harvesting conditions and damage risks. It is always useful to synthesize the observations of a literature review by utilizing an information flowchart when designing quality management systems. Therefore, as the basic structure of the management system, three separate databases were assumed for stakeholders (Figure 1). These databases are already available in practice. Based on them, Figure 3 presents a flowchart of spatial information needs for a GIS-based wood procurement quality management system. In regard to this proposed structure, future research will certainly compare the efficiency of photogrammetry and laser scanning systems for the development of wood harvesting planning and quality management systems in terms of their accuracy and costs, respectively.
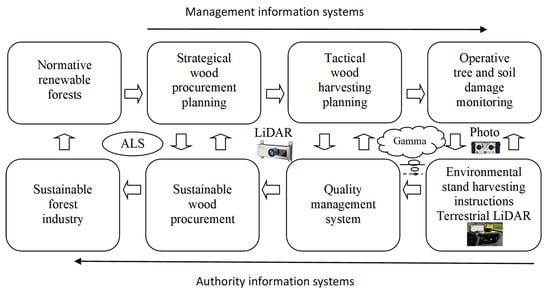
Figure 3.
Flowchart of spatial wood harvesting information related to the development of a GIS-based quality management system for wood procurement.
Currently, there is a basic soil map with a scale of 1:20,000 for Finland. The open GIS data include a digital elevation model, which is available countrywide for wood procurement companies [79]. In addition to a 10 m grid, a 2 m grid DEM based on airborne laser scanning is available for most of the country. Moreover, the whole country is covered by a general soil map at the scale of 1:200,000 [80]. Numerical soil type patterns (≥6.25 ha) have been produced for this map by relating the properties and quality of the data, largely by interpreting, editing and making use of existing geophysical GIS datasets and image processing techniques.
Significant improvements in the public open mapping of forests and peatland areas have also been made, which supports the development of wood harvesting planning systems. On the map, soils can be displayed for both surface soil and ground layers. In addition, a topographic database is used for bordering areas, and the geophysical data are used for the determination of the thickness of the peat layer. For example, the peatland’s wet index uses a 16 m grid [8] that includes aero-geophysical mapping data and a topographical database in vector form that includes important map elements and data components such as small and wet points of peatlands.
3. Materials Used for Modeling Indicators of Wood Harvesting Quality
Figure 3 presents tree stem damage and soil rutting as quality-related indicators of wood harvesting, and these are also the quality-related factors associated with environmentally sustainable wood procurement during daily operations. They can be measured directly in real time from the forwarder as the final stage of operation. Next, two empirical analyses were used to describe the explanatory variables associated with these indices that affect the measurement success of tree stem damage and soil rutting.
3.1. Tree Damage Monitoring Measurement
Data on the wood harvesting quality and conditions were collected from challenging wood harvesting sites—privately owned forests located in the regions of South Karelia, North Karelia, South Savonia, North Savonia and Northern Ostrobothnia in Finland. During forest work, the locations of soil rutting and tree damage and the coordinates of each study plot were stored using the Trimble GeoExplorer 2005 GPS device. Then, this information was stored in the ArcMap 10 program. The locations of spatial datasets were picked up by the "extract values” to form the study plot database, from which observations were exported to Microsoft Office Excel. The wood harvesting quality observations collected from study plots were also saved in Microsoft Office Excel. Statistical analyses were performed using SPSS Statistics 20.0.
Photography was carried out during autumn. Then, spatial data on real stem damage after logging were collected. Background information on single-grip harvesters and sample plots is described in Table 1. The total number of stem damage observations was 558 at fifteen wood harvesting stands (Table 2). All observations were photographed from one direction. The average distance between a photography point and the damaged stem was 6.4 m. The stem damage was photographed with a Canon EOS 60D digital single-lens reflex camera. The focal length of the camera lens was set at 18 mm. The camera was connected to a tripod to maximize its stability. Images were recorded in JPEG format. The images were 5184 pixels in width and 3456 pixels in height. The image color profile was the standard Red Green Blue (RGB) and the bit depth was 24.

Table 1.
Basic information about single-grip harvesters in tree stem damage detection.
Table 2.
Basic information about tree stem damages in digital photographs.
3.2. Soil Rutting Monitoring Measurement
The wood harvesting machine data were collected from contractors. Three different harvester trademarks and six forwarder trademarks were used in peatlands (Table 3). As basic data on the harvesting conditions, the tree volume and tree removal per hectare were measured from the study plots. In addition, the average forest haulage distance and distances between ditches of peatland were calculated based on the map of each stand. The depth of the groundwater table was measured by digging a pit close to each data collection point. The digging place was the deepest point in the plot. The thickness of the peat layer was measured by a peat sampler in the middle of the study plots.
Table 3.
The machines’ trademarks, the number of wheels used in wood harvesting machinery and the number of study plots of peatland stands.
A general soil map (1:200,000) was available for all 240 study plots. To determine the locations of data, a systematic point network (50 × 50 m) was created by the ArcGIS program. Data collection points were established on the study plots, and the distance of each point to the center of the nearest strip road of machines was measured. The raster (25 × 25 m) was used in 144 study sample plots. It was used to calculate the depth of the groundwater table and the variation in the height model of the ground surface if raster material (2 × 2 m) was not available at the wood harvesting sites. In addition, 179 study plots included a potassium raster (25 × 25 m), which was created to obtain gamma-ray information.
From the middle of the study plot, six meters was measured on the strip road of forest forwarding in both directions. The length of soil rutting was determined from this part of the road (i.e., 12 m). The percentages of damaged road were calculated from the length of soil rutting according to the wood harvesting regulations drawn up by authorities. The damage was interpreted as soil rutting if it was more than 10 cm deep, more than 50 cm long and located in the strip roads developed for forest forwarding. In addition, the deepest rut point (i.e., the maximum rut depth) on the wheel track of every road was measured, and the average rut depth of every forest stand was calculated.
The average percentage of soil rutting in the total road length was 12.2% (standard deviation, 23.3%). The maximum rut depth was, on average, 10.8 cm, and the average rut depth of all strip road tracks was 3.8 cm. The highest soil rutting percentage of one stand was 56.3%. Correspondingly, the maximum rut depth was 11.2 cm, and the average rut depth of the strip road tracks was 5.2 cm.
The tree height model (2 × 2 m) was generated by laser pulses on 96 study plots. Additionally, a height model (25 × 25 m) was calculated from the topographic height curves. In addition to that model (2 × 2 m), another model (6 × 6 m) was used to reflect pulses from vegetation (>2 m). The accuracy of height information was approximately 30 cm. The study data also included 85 study plots, and the information collected included the number of trees, the density of trees in the stand, the basal area of trees in the stand and the tree species present.
4. Methods Used by Wood Harvesting Quality Models
Data were analyzed in three stages. First, the experimental analysis examined the factors associated with tree damage and soil rutting during wood harvesting. Secondly, we investigated whether it would be possible to model the quality indicators via regression analysis. Thirdly, we investigated whether it would be possible to collect spatial information about the quality criteria efficiently without manual measurements. By means of the exploratory factors, regression models were prepared and evaluated to select harvesting sites to advance environmentally sustainable wood procurement. Modeling information increases our understanding about an indicator’s predictive ability when used as a quality criterion.
Logistic regression analysis was used to model the relationships among successful stem damage detection, wood harvesting conditions and the image processing technique [6]. Here, it was assumed that the model would be suitable as a digital planning tool for supporting wood procurement before harvesting work. An explanatory regression analysis investigated the relationships among soil rutting, machine technology and wood harvesting conditions in the strip road network of peatlands. This dependency was modeled for the maximum soil rutting depth formed by a forwarder at carrying capacity category two [37]. The models showed whether a change in the independent variables would result in a change in the quality indicators (i.e., the soil rutting percentage and the maximum depth of soil rutting).
5. Experimental Quality Indicator Models
The logistic regression model describes the relationships among successful tree stem damage detection and image processing variables (Table 4). When statistically significant photographing conditions were selected for inclusion in the model, the model’s overall percentage of successful stem damage detection was 88% with the wood harvesting conditions present in practice (Table 5). This means that the tree stem damage indicator of study plots was accurate enough for use in the monitoring of a quality management system. It could allow authorities to successfully make decisions about the wood harvesting quality. If the quality is below an acceptable level, additional control operations should be implemented in the forest by using manual measurements.
Table 4.
Effects of statistically significant photographing conditions on the successful detection of stem damage during the processing of photographs taken with a filming angle of 90° from the strip road.
Table 5.
Classification of successful stem damage detection (No = 0, Yes = 1) from a strip road network using a predictive model with wood harvesting conditions present in practice.
Both soil rutting damage criteria (i.e., the soil rutting percentage and maximum depth of soil rutting) were negatively correlated with the depth to the groundwater table, the height variation (2 × 2 m) of the stand and the density of laser pulses reflected from the vegetation. Moreover, there was a negative correlation between the values of potassium and the soil rutting percentage. Both soil rutting variables correlated positively with the thickness of the peat layer and the value describing the tree height in the stand.
The explanation degree of the regression model of the maximum depth of soil rutting was 0.514 (Table 6). Based on standardized regression coefficients, the type of wood harvesting system (i.e., one-machine system with a harwarder versus a two-machine system with a harvester and forwarder) successfully explained the degree of soil rutting. The type of harvesting system used and the thickness of the peat layer were highly statistically significant. The forest haulage distance and the depth to the groundwater table were almost statistically significant explanatory variables. When the thickness of the peat layer and the forwarding distance grew, the maximum depth of soil rutting increased. In addition to this, when the depth to the groundwater table decreased, the maximum depth of soil rutting reduced.
Table 6.
An explanatory model of the maximum depth of soil rutting in a strip road network of forest stands.
According to the analysis of variance, the model was very statistically significant. The standard deviation of the residuals of the model was around zero on both sides when the maximum rut depth was less than 15 cm. With a larger soil rutting depth, the model gave higher than realistic values for the maximum depth of soil rutting, but the model worked with a sufficient degree rate of certainty in an acceptable operating range. It can be used to select logging stands for summertime wood harvesting, in which the maximum depth of soil rutting is less than or equal to 10 cm. Due to this criterion, research data were collected from 33 study plots located in the stands, which should have been harvested during the wintertime. This means that wood harvesting decisions made in the summertime were correct in 86.3% of the study plots. By using this model in a wood harvesting planning system, managers and contractors could successfully make decisions about stand selection for wood procurement operations during the summer and autumn wood harvesting seasons.
6. Discussion
Tree stem damage and soil rutting are used as criteria and indicators of an acceptable level of damage from wood harvesting. With respect to both measures, however, it is not clear how spatial measurements of tree damage and soil rutting should be conducted and who will use these measurements. It is unknown whether the regulation measurements should be used for administrative information systems or for the wood harvesting management systems of wood procurement. This study evaluated the justifications for previous studies’ conclusions about the proposed uses of GIS applications including ground-penetrating radar, terrestrial photographing, airborne and terrestrial LiDAR and airborne and terrestrial gamma-ray scanning. The results of the literature review and the experimental models of tree damage and soil rutting were used to design an acceptable quality management system for wood procurement to be used by stakeholders for peatland thinning during summer and autumn wood harvesting.
The main aim of this study was to investigate how efficiently the planning systems can select harvesting areas a priori for wood harvesting while avoiding harvesting damage caused by forest machinery. The literature review revealed the possibilities associated with the use of GISs, and the models described the criteria for predicting the required quality levels. Terrestrial LiDAR could be utilized for wood harvesting quality control systems by authorities, but it is an inefficient system for use in preplanning without terrestrial gamma-ray data collection. Airborne LiDAR and soil gamma-ray data can only be used for planning larger regions at the forest level because the information includes too much uncertainty for planning in smaller areas before wood harvesting. In addition, airborne LiDAR is not accurate enough, even at the forest level, in systems of wood procurement because wood harvesting planning without field measurements remains challenging. Therefore, there is a need for the use of manual ground-penetrating radar for the measurement of the peat layer thickness and the depth to the groundwater table [49], and this can be used with the soil rutting model (Table 6).
There is no concern about the final open felling of forests in drained peatlands, but it is crucial to predict time possibilities before wood harvesting if the harvesting site is suitable for thinning without damage. According to the related body of literature, the rutting of forest land usually cannot be avoided [81]. Therefore, the final open felling of peatlands without thinning through short-rotation forestry could be an environmentally efficient management method. On the other hand, the use of harvesting machinery with a low nominal ground pressure (<30 kPa) by wood procurement companies is required to provide forest owners with an environmentally sustainable wood harvesting method [33]. It must also be noted that tracked machinery is more suitable for peatlands than wheeled wood harvesting machinery because the nominal ground pressure produced by tracked machinery divides more evenly into the ground than that produced with wheeled machinery [36,82].
The thickness of the peat layer and the depth to the groundwater table have been identified as the most important soil factors in studies concerning peatland wood harvesting planning and quality management systems. They were also found to be statistically significant independent variables in a linear regression model of the maximum rut depth (Table 6). Models describing the spatial data variation in peatlands, e.g., the density values of laser pulses reflected from trees and the soil rut’s bottom, had a lower explanation degree than the model presented in this study (Table 6). The quality success indicator used in the current study for wood harvesting in peatlands is based on the soil rutting percentage, which, based on the conditions used in this experiment from the point of view of practical wood harvesting, is a less accurate indicator than the maximum depth of soil rutting. The most likely reason for the use of different indicators in the literature is the difficulty of measuring the maximum depth of soil rutting by LiDAR in deep ruts which may be full of water. Terrestrial LiDAR also has several other problems when measuring the maximum depth of soil rutting, which also negatively affect the accuracy when calculating the soil rutting percentage [67].
We agree that wet soils in mires and near streams and lakes have a particularly low bearing capacity and are therefore most susceptible to rutting. This has been the research context of several publications [15,16]. Under these harvesting conditions, the newly developed cartographic depth-to-water index, which measures the flow and distance to open water, is the best soil wetness predictor. Our research context is different—operational wood harvesting for wood procurement. We must measure the thickness of the peat layer and the distance to the groundwater table just before wood harvesting in practice. Furthermore, the harvesting areas in peatlands are located far from open water.
On the other hand, it is suggested that DTW-derived soil wetness maps can be used to reduce the environmental and economic costs of off-road traffic effects, such as unacceptable soil rutting [15]. However, the causal relationships among data associated with rutting by wood harvesting machines after operational wood harvesting have seldom been analyzed. Based on the results of this study, it is fundamental to determine the causes of the dependent variable (rutting) and the explanatory variables (the thickness of the peat layer and the depth to the groundwater table), and these should be measured in practice. The accuracy of planning systems for wood cutting (cut-to-length method) and wood forwarding depends on the selection of the measurement target (explanatory variable). This problem can be avoided if research only focuses on the investigation and development of forest planning. In this respect, DTW is a useful tool for planning at the forest level. In Finland, forest planning only uses wood harvesting methods, but, in practice, it is not necessary for stakeholders to do anything. The harvesting plans of authorities are helpful for forest owners, but timber buyers must execute much more accurate planning of forest stands after purchasing them before harvesting because they are responsible for damage.
LiDAR has been suggested for use in forest planning in several publications. For example, recent DTW advances dealt with the mapping potential and actual soil disturbance impacts for the purpose of conducting an off-road soil trafficability assessment (Campbell et al. 2013). According to Campbell, the resulting best-fitted regression between the Cone Index, log(10) (DTW) and elevation (or study area) was used to map the Cone Index and expected recreational terrain vehicle-specific rutting depths across the landscape. The maps generated were generally in agreement with the results of a 40-km-long soil disturbance survey conducted along a recreational vehicle trail section within the foothill area. However, they did not model rutting caused by wood harvesting machines, which is the research context of this study. Therefore, the use of LiDAR and DTW for wood procurement should be analyzed in practice before we can recommend them for use in wood harvesting planning systems at the forest level. Unfortunately, real wood harvesting tests are missing, or they are just minor driving experiments.
Additional real forestry planning benefits of LiDAR include improved wood harvesting scheduling (summer versus fall versus winter), in-field navigation, optimization of stands’ access routes and guidance in wood forwarding trails [15,83]. However, in a recent study, rutting measurements turned out to be independent of the soil moisture content, which was simulated using DTW [84]. The influence of the soil moisture content on soil rutting has been reported extensively [85,86], and it has been shown to have an inevitable influence on rutting. The relatively low moisture content (40 vol%) present during field trials limited the predictability of the rut depth by means of cartographic indices. Ågren et al. [15] also mentioned a further aim regarding the use of cartographic knowledge to determine how to lay out the forwarding trails depending on current or forecasted weather conditions by changing the DTW index using the flow initiation threshold [87], i.e., determining when and where wood harvesting should be executed depending on the prevailing weather and soil conditions from the perspective of forest operations.
In wood procurement by the forest industry, accurate assessment of the harvesting conditions prior to the use of machine traffic is essential for operational planning to ensure efficient machine utilization and to avoid damage to the trees and peatlands or the machine operating trails. In this respect, remote sensing-based cartographic indices seem to have promise for use in operation, as they may be able to carry out soil rutting predictions. However, a high level of measurement accuracy must be assumed beforehand, e.g., LiDAR-based DTW has not been proven to be a reliable alternative to conventional terramechanical field measurements of actual wood harvesting stand conditions in practice [84]. Instead of airborne LiDAR, manual ground-penetrating radar can be used to measure the peat layer thickness and the depth to the groundwater table to provide a more accurate soil rutting model [49]. In contrast to LiDAR, both terramechanical field measurements produce data based on the justified explanatory variables related to soil rutting.
This study investigated the literature about GISs related to environmental quality management to prevent wood harvesting damage. These results provide stakeholders of wood procurement with a useful perspective to facilitate a comparison among suitable information systems for the development of quality management. Figure 1 presents the information flow of the wood procurement management system at a general level. In addition, Figure 3 presents a flowchart of spatial wood harvesting information that could be used to develop a GIS-based quality management system for wood procurement. The flowcharts reveal that managers and contractors are responsible for wood harvesting planning because planning must be conducted just before operative wood harvesting. In practice, the harvester operator executes route selections for forwarders during the logging operation, and the forwarder operator only makes the decision to drive or not drive on ready-made trails. It is also noted that minimization of tree stem damage and soil rutting risk at mechanized forest operations requires careful planning in the following order of priority: selection of machinery, seasonal timing of wood harvesting, skilled machine driving and route selection for forwarding in the forest.
7. Conclusions
Currently, monitoring and control systems that automatically collect spatial information about wood harvesting damage are not well known. Several researchers have concluded that the GISs required for such systems are not yet available because expectations about mounting them into single-grip cut-to-length machinery (i.e., harvesters) have been too optimistic. This study investigated both soil rutting and tree damage with respect to current manual and digital quality management systems. The use of a combination of manual and automatic systems is proposed for authorities and wood procurement managers. Photography of wood harvesting damage by a stereo camera is a cost-efficient and profitable way to collect data in practice, and the camera should be mounted in the forwarder’s cabin. Based on automatic image processing and harvesting quality index calculations, forest damage could be controlled manually by authorities. This quality management system is also a cost-efficient system for authorities because their manual quality measurements will only focus effectively on low-quality damaged stands instead of randomly selecting often good-quality forest targets, which is currently conducted. Authorities could also use laser scanning systems to collect spatial data for normative and strategic purposes at the national forest inventory level. Moreover, the forest industry and contractors could use the authorities’ open quality management system, the spatial soil data and the soil rutting model in their planning systems to improve the quality of wood harvesting and to achieve environmental sustainability.
Author Contributions
Supervision, Teijo Palander; Writing—original draft, Teijo Palander; Writing—review & editing, Kalle Kärhä All authors have read and agreed to the published version of the manuscript.
Funding
This research received no external funding.
Institutional Review Board Statement
Not applicable.
Informed Consent Statement
Not applicable.
Conflicts of Interest
The authors declare no conflict of interest.
References
- Palander, T.; Haavikko, H.; Kärhä, K. Towards sustainable wood procurement in forest industry—The energy efficiency of larger and heavier vehicles in Finland. Renew. Sustain. Energy Rev. 2018, 96, 100–118. [Google Scholar] [CrossRef]
- Palander, T.; Haavikko, H.; Kortelainen, E.; Kärhä, K. Comparison of Energy Efficiency Indicators of Road Transportation for Modeling Environmental Sustainability in “Green” Circular Industry. Sustainability 2020, 12, 2740. [Google Scholar] [CrossRef]
- Government Report on the National Energy and Climate Strategy for 2030. Ministry of Economic Affairs and Employment of Finland, Publications of the Ministry of Economic Affairs and Employment 4. 2017. Available online: http://julkaisut.valtioneuvosto.fi/bitstream/handle/10024/79247/TEMjul_12_2017_verkkojulkaisu.pdf (accessed on 27 February 2021).
- Finland’s National Forest Programme. More Welfare from Diverse Forests—Government Resolution. Publ. Finn. Minist. Agric. For. 2015, 3, 1–52.
- Laukkanen, S.; Palander, T.; Kangas, J. Applying voting theory in participatory decision support for sustainable timber harvesting. Can. J. For. Res. 2004, 34, 1511–1524. [Google Scholar] [CrossRef]
- Palander, T.; Eronen, J.; Peltoniemi, N.; Aarnio, A.; Kärhä, K.; Ovaskainen, H. Improving a stem-damage monitoring system for a single-grip harvester using a logistic regression model in image processing. Biosyst. Eng. 2019, 180, 36–49. [Google Scholar] [CrossRef]
- Uusitalo, J.; Ala-Ilomäki, J.; Lindeman, H.; Toivio, J.; Sirén, M. Modelling soil moisture—Soil strength relationship of fine-grained upland forest soils. Silva Fennica 2019, 53, 10050. [Google Scholar] [CrossRef]
- Salmivaara, A.; Miettinen, M.; Finér, L.; Launiainen, S.; Korpunen, H.; Tuominen, S.; Heikkonen, J.; Nevalainen, P.; Sirén, M.; Ala-Ilomäki, J.; et al. Wheel rut measurements by forest machine-mounted LiDAR sensors—Accuracy and potential for operational applications? Int. J. For. Eng. 2018, 29, 41–52. [Google Scholar] [CrossRef]
- Palander, T. A local DLP-GIS-LP system for geographically decentralized wood procurement planning and decision making. Silva Fenn. 1997, 31, 179–192. [Google Scholar] [CrossRef]
- Dean, D.J. Finding optimal routes for networks of harvest site access roads using GIS-based techniques. Can. J. For. Res. 1997, 27, 11–22. [Google Scholar] [CrossRef]
- Donlon, J.J.; Forbus, K.D. Using a Geographic Information System for Qualitative Spatial Reasoning about Trafficability. In Proceedings of the QR99, Loch Awe, UK, 6–9 June 1999; Available online: https://www.qrg.northwestern.edu/papers/Files/Donlon_Forbus_QR99_Distribution.pdf (accessed on 23 April 2021).
- Qiu, R.; Mikkonen, E. GIS-based decision support system for wood logistics. For. Stud. China 2004, 6, 29–33. [Google Scholar] [CrossRef]
- Suvinen, A. A GIS-based simulation model for terrain tractability. J. Terramech. 2006, 43, 427–449. [Google Scholar] [CrossRef]
- Vainio, P.; Tokola, T.; Palander, T.; Kangas, A. A GIS-based stand management system for estimating local energy wood supplies. Biomass Bioenergy 2009, 33, 1278–1288. [Google Scholar] [CrossRef]
- Ågren, A.M.; Lidberg, W.; Ring, E. Mapping temporal dynamics in a forest stream network—Implications for riparian forest management. Forests 2015, 6, 2982–3001. [Google Scholar] [CrossRef]
- Ågren, A.M.; Lidberg, W.; Strömgren, M.; Ogilvie, J.; Arp, P.A. Evaluating digital terrain indices for soil wetness mapping—A Swedish case study. Hydrol. Earth. Syst. Sci. 2014, 18, 3623–3634. [Google Scholar] [CrossRef]
- Niemi, M.T.; Vastaranta, M.; Vauhkonen, J.; Melkas, T.; Holopainen, M. Airborne LIDAR-derived elevation data in terrain trafficability mapping. Scand. J. For. Res. 2017, 32, 762–773. [Google Scholar] [CrossRef]
- Campbell, D.M.H.; White, B.; Arp, P.A. Modeling and mapping soil resistance to penetration and rutting using LiDAR-derived digital elevation data. J. Soil Water Conserv. 2013, 68, 460–473. [Google Scholar] [CrossRef]
- Jones, M.-F.; Arp, P.A. Relating cone penetration and rutting resistance to variations in forest soil properties and daily moisture fluctuations. Open J. Soil Sci. 2017, 7, 149–171. [Google Scholar] [CrossRef]
- Hong, D.; Gao, L.; Yokoya, N.; Yao, J.; Chanussot, J.; Du, Q.; Zhang, B. More Diverse Means Better: Multimodal Deep Learning Meets Remote-Sensing Imagery Classification. IEEE Trans. Geosci. Remote Sens. 2020. [CrossRef]
- Pan, X.; Gao, L.; Marinoni, A.; Zhang, B.; Yang, F.; Gamba, P. Semantic Labeling of High Resolution Aerial Imagery and LiDAR Data with Fine Segmentation Network. Remote Sens. 2018, 10, 743. [Google Scholar] [CrossRef]
- Yao, J.; Meng, D.; Zhao, Q.; Cao, W.; Xu, Z. Nonconvex-sparsity and nonlocal-smoothness-based blind hyperspectral unmixing. IEEE Trans. Image Process 2019, 28, 2991–3006. [Google Scholar] [CrossRef]
- Finnish Forest Statistics. 2020; Natural Resources Institute Finland: Helsinki, Finland; 573p, Available online: https://stat.luke.fi/en/uusi-etusivu (accessed on 23 April 2021).
- Information on LULUCF Actions. 2016; Progress Report; Ministry of Agriculture and Forestry; 24p. Available online: https://uk-air.defra.gov.uk/assets/documents/reports/cat07/1703311112_UK_LULUCF_Action_Progress_Report.pdf (accessed on 23 April 2021).
- Finnish Forest Statistics. 2019; Natural Resources Institute Finland: Helsinki, Finland; 417p, Available online: https://stat.luke.fi/en/uusi-etusivu (accessed on 23 April 2021).
- Kärhä, K.; Tamminen, T.; Leinonen, T.; Suvinen, A. Reducing seasonality in wood harvesting operations in Finland. In Proceedings of the Joint Seminar Arranged by NB-NORD and NOFOBE, Lappeenranta, Finland, 14–16 June 2017; 47, p. 41. [Google Scholar]
- Rose, J.C.; Paulus, S.; Kuhlmann, H. Accuracy Analysis of a Multi-View Stereo Approach for Phenotyping of Tomato Plants at the Organ Level. Sensors 2015, 15, 9651–9665. [Google Scholar] [CrossRef]
- Forsman, M.; Börlin, N.; Holmgren, J. Estimation of Tree Stem Attributes Using Terrestrial Photogrammetry with a Camera Rig. Forests 2016, 7, 61. [Google Scholar] [CrossRef]
- Nevalainen, P.; Salmivaara, A.; Ala-Ilomäki, J.; Launiainen, S.; Hiedanpää, J.; Finér, L.; Pahikkala, P.; Heikkonen, J. Estimating the Rut Depth by UAV Photogrammetry. Remote Sens. 2017, 9, 1279. [Google Scholar] [CrossRef]
- Hyyppä, J.; Virtanen, J.-P.; Jaakkola, A.; Yu, X.; Hyyppä, H.; Liang, X. Feasibility of Google Tango and Kinect for Crowdsourcing Forestry Information. Forests 2018, 9, 6. [Google Scholar] [CrossRef]
- Hyyppä, J.; Inkinen, M. Detecting and estimating attributes for single trees using laser scanner. Photogrammetric J. Finl. 1999, 16, 27–42. [Google Scholar]
- Ala-Ilomäki, J.; Högnäs, T.; Lamminen, S.; Sirén, M. Equipping a conventional wheeled forwarder for peatland operations. Int. J. For. Eng. 2011, 22, 7–13. [Google Scholar] [CrossRef]
- Palander, T.; Punttila, T.; Kariniemi, A. Forwarder’s mass control with a loader for wood harvesting on peatlands. Mires Peat 2012, 63, 57–72. [Google Scholar]
- Uusitalo, J.; Ala-Ilomäki, J. The significance of above-ground biomass, moisture content and mechanical properties of peat layer on the bearing capacity of ditched pine bogs. Silva Fenn. 2013, 47, 1–18. [Google Scholar] [CrossRef]
- Uusitalo, J.; Salomäki, M.; Ala-Ilomäki, J. The effect of wider logging trails on rut formations in the harvesting of peatland forests. Croat. J. For. Eng. 2015, 36, 125–130. [Google Scholar]
- Bergroth, J.; Palander, T.; Kärhä, K. Excavator-based harvesters in wood cutting operations in Finland. For. Stud. 2006, 45, 74–88. [Google Scholar]
- Högnäs, T.; Kärhä, K.; Lindeman, H.; Palander, T. Carrying capacity classification for peatland thinnings. Metsätehon Tuloskalvosarja 2009, 17, 1–24. [Google Scholar]
- Kärhä, K.; Oinas, S. Satisfaction and Company Loyalty as Expressed by Non-Industrial Private Forest Owners towards Timber Procurement Organizations in Finland. Silva Fenn. 1998, 32, 27–42. [Google Scholar] [CrossRef][Green Version]
- Kärhä, K. Modelling the Antecedents and Consequences of Forest Owners’ Satisfaction in Timber-Sales Transactions. J. For. Econ. 1999, 5, 389–411. [Google Scholar]
- Kärhä, K.; Eronen, J.; Palander, T.; Ovaskainen, H.; Riekki, K.; Hämäläinen, H. Information Needs of Non-industrial Private Forest Owners after Logging Operations in Finland: A Case Study. Small-Scale For. 2020, 19, 205–230. [Google Scholar] [CrossRef]
- Suvinen, A.; Tokola, T.; Saarilahti, M. Terrain Trafficability Prediction with GIS Analysis. For. Sci. 2009, 55, 433–442. [Google Scholar]
- Legend for the Soil Map of the World; FAO/UNESCO: Paris, France, 1974; Volume 1, pp. 1–62.
- Yli-Halla, M. Classification of acid sulphate soils of Finland according to Soil Taxonomy and the FAO/Unesco legend. Agric. Food Sci. Finl. 1997, 6, 247–258. [Google Scholar] [CrossRef]
- Yli-Halla, M.; Mokma, D.L. Classification of Soils of Finland According to Soil Taxonomy. Soil Surv. Horiz. 1999, 40, 56–69. [Google Scholar] [CrossRef]
- Davis, J.L.; Annan, A.P. Ground-Penetrating Radar for high resolution mapping of soil and rock stratigraphy. Geophys. Prospect. 1989, 37, 531–551. [Google Scholar] [CrossRef]
- Plado, J.; Sibul, I.; Mustasaar, M.; Jõeleht, A. Ground-penetrating radar study of the Rahivere peat bog, eastern Estonia. Est. J. Earth Sci. 2011, 60, 31–42. [Google Scholar] [CrossRef]
- Parry, L.E.; West, L.J.; Holden, J.; Chapman, P.J. Evaluating approaches for estimating peat depth. J. Geophys. Res. Biogeosci. 2014, 119, 567–576. [Google Scholar] [CrossRef]
- Comas, X.; Terry, N.; Slater, L.; Warren, M.; Kolka, R.; Kristiyono, A.; Sudiana, N.; Nurjaman, D.; Darusman, T. Imaging tropical peatlands in Indonesia using ground-penetrating radar (GPR) and electrical resistivity imaging (ERI): Implications for carbon stock estimates and peat soil characterization. Biogeosciences 2015, 12, 2995–3007. [Google Scholar] [CrossRef]
- Parsekian, A.D.; Slater, L.; Ntarlagiannis, D.; Nolan, J.; Sebesteyen, S.D.; Kolka, R.K.; Hanson, P.J. Uncertainty in Peat Volume and Soil Carbon Estimated Using Ground-Penetrating Radar and Probing. Soil Sci. Soc. Am. J. 2012, 76, 1911–1918. [Google Scholar] [CrossRef]
- Uusitalo, J.; Ala-Ilomäki, J. Terrain trafficability classification of logging machinery on pine mires. In: Special issue. Abstracts for international conferences organized by LSFRI Silava in cooperation with SNS and IUFRO. Mezzinatne 2012, 25, 85–87. [Google Scholar]
- Holden, N.M.; Connolly, J. Estimating the carbon stock of a blanket peat region using a peat depth inference model. Catena 2011, 86, 75–85. [Google Scholar] [CrossRef]
- Householder, J.E.; Janovec, J.P.; Tobler, M.W.; Page, S.; Lähteenoja, O. Peatlands of the Madre de Dios river of Peru: Distribution, geomorphology, and habitat diversity. Wetlands 2012, 32, 359–368. [Google Scholar] [CrossRef]
- Akumu, C.E.; McLaughlin, J. Modeling peatland carbon stock in a delineated portion of the Nayshkootayaow river watershed in Far North Ontario, using an integrated GIS and Remote Sensing approach. Catena 2014, 121, 297–306. [Google Scholar] [CrossRef]
- Hyyppä, J.; Kelle, O.; Lehikoinen, M.; Inkinen, M. A segmentation-based method to retrieve stem volume estimates from 3-dimensional tree height models produced by laser scanner. IEEE Trans. Geosci. Remote Sens. 2001, 39, 969–975. [Google Scholar] [CrossRef]
- Picchio, R.; Latterini, F.; Mederski, P.S.; Tocci, D.; Venanzi, R.; Stefanoni, W.; Pari, L. Applications of GIS-Based Software to Improve the Sustainability of a Forwarding Operation in Central Italy. Sustainability 2020, 12, 5716. [Google Scholar] [CrossRef]
- Pohjankukka, J.; Nevalainen, P.; Pahikkala, T.; Hyvönen, E.; Hänninen, P.; Sutinen, R.; Ala-Ilomäki, J.; Heikkonen, J. Predicting water permeability of soil based on open data. In Proceedings of the 10th International Conference on Artificial Intelligence Applications and Innovations (AIAI 2014), Rhodes, Greece, 19–21 September 2014; IFIP Advances in Information and Communication Technology; Iliadis, L., Maglogiannis, I., Papadopoulos, H., Eds.; Springer: Berlin/Heidelberg, Germany, 2014; Volume 436, pp. 436–446. [Google Scholar]
- Parry, L.E.; Charman, D.J.; Noades, J.P.W. A method for modelling peat depth in blanket peatlands. Soil Use Manag. 2012, 28, 614–624. [Google Scholar] [CrossRef]
- Rudiyanto, M.B.; Setiawan, B.I.; Arif, C.; Saptomo, S.K.; Chadirin, Y. Digital mapping for cost-effective and accurate prediction of the depth and carbon stocks in Indonesian peatlands. Geoderma 2016, 272, 20–31. [Google Scholar] [CrossRef]
- Gatis, N.; Luscombe, D.J.; Carless, D.; Parry, L.E.; Fyfe, R.M.; Harrod, T.R.; Brazier, R.E.; Anderson, K. Mapping upland peat depth using airborne radiometric and lidar survey data. Geoderma 2019, 335, 78–87. [Google Scholar] [CrossRef]
- Mattila, U.; Tokola, T. Terrain mobility estimation using TWI and airborne gamma-ray data. J. Environ. Manag. 2018, 232, 531–536. [Google Scholar] [CrossRef]
- Hyvönen, E.; Turunen, P.; Vanhanen, E.; Arkimaa, H.; Sutinen, R. Airborne gamma-ray surveys in Finland. In: Airo, M.-L. (Ed.). Aerogeophysics in Finland 1972–2004. Methods, system characteristics and applications. Geol. Surv. Finl. 2005, 39, 119–134. [Google Scholar]
- Grasty, R.L. Radon emanation and soil moisture effects on airborne gamma-ray measurements. Geophysics 1997, 62, 1379–1385. [Google Scholar] [CrossRef]
- Airo, M.-L. Aeromagnetic and aeroradiometric response to hydrothermal alteration. Surv. Geophys. 2002, 23, 273–302. [Google Scholar] [CrossRef]
- Hyvönen, E.; Pänttäjä, M.; Sutinen, M.-L.; Sutinen, R. Assessing site suitability for Scots pine using airborne and terrestrial gamma-ray measurements in Finnish Lapland. Can. J. For. Res. 2003, 33, 796–806. [Google Scholar] [CrossRef]
- Virtanen, K. Airborne geophysical gamma radiation data in peat research. In: Quaternary Economical Geology in the Nordic Countries. STRIAE 1990, 29, 111–114. [Google Scholar]
- Hellstöm, T.; Lärkeryd, P.; Nordfjell, T.; Ringdahl, O. Autonomous Forest Vehicles: Historic, envisioned, and state-of-the-art. Int. J. For. Eng. 2009, 20, 31–38. [Google Scholar]
- Kong, J.; Wang, Z.; Jin, X.; Wang, X.; Su, T.; Wang, J. Semi-Supervised Segmentation Framework Based on Spot-Divergence Super voxelization of Multi-Sensor Fusion Data for Autonomous Forest Machine Applications. Sensors 2018, 18, 3061. [Google Scholar] [CrossRef]
- Ala-Ilomäki, J.; Cohen, J.; Heilimo, J.; Hyvönen, E.; Hänninen, P.; Ikonen, J.; Middleton, M.; Nevalainen, P.; Pahikkala, T.; Pohjankukka, J.; et al. New computational methods for efficient utilisation of public data. Geol. Surv. Finl. Rep. Investig. 2015, 217, 1–55. [Google Scholar]
- Liang, X.; Kankare, V.; Hyyppä, J.; Wang, Y.; Kukko, A.; Haggren, H.; Yu, X.; Kaartinen, H.; Jaakkola, A.; Guan, F.; et al. Terrestrial laser scanning in forest inventories. ISPRS J. Photogramm. Remote Sens. 2016, 115, 63–77. [Google Scholar] [CrossRef]
- Zhong, L.; Cheng, L.; Xu, H.; Wu, Y.; Chen, Y.; Li, M. Segmentation of Individual Trees from TLS and MLS Data. IEEE J. Sel. Top. Appl. Earth Obs. Remote Sens. 2017, 10, 774–787. [Google Scholar] [CrossRef]
- Iglhaut, J.; Cabo, C.; Puliti, S.; Piermattei, L.; O’Connor, J.; Rosette, J. Structure from Motion Photogrammetry in Forestry: A Review. Curr. For. Rep. 2019, 5, 155–168. [Google Scholar] [CrossRef]
- Pohjankukka, J.; Pahikkala, T.; Nevalainen, P.; Heikkonen, J. Estimating the prediction performance of spatial models via spatial k-fold cross validation. Int. J. Geogr. Inf. Sci. 2017, 31, 2001–2019. [Google Scholar] [CrossRef]
- Pohjankukka, J.; Riihimäki, H.; Nevalainen, P.; Pahikkala, T.; Ala-Ilomäki, J.; Hyvönen, E.; Varjo, J.; Heikkonen, J. Predictability of boreal forest soil bearing capacity by machine learning. J. Terramech. 2016, 68, 1–8. [Google Scholar] [CrossRef]
- Acuna, M. Automated volumetric measurement of truckloads through multi-view photogrammetry and 3D image processing software. In Proceedings of the FORMEC 2017: 50th anniversary of the International Symposium on Forestry Mechanization, Braşov, Romania, 25–29 September 2017. [Google Scholar]
- Acuna, M.; Sosa, A. Automated Volumetric Measurements of Truckloads through Multi-View Photogrammetry and 3D Reconstruction Software. Croat. J. For. Eng. 2019, 40, 151–162. [Google Scholar]
- Borz, S.A.; Acuna, M.; Heinimann, H.; Palander, T.; Spinelli, R. Innovating the competitive edge: From research to impact in the forest value chain: The half-century of FORMEC. Ann. For. Res. 2017, 60, 199–201. [Google Scholar] [CrossRef]
- Marra, E.; Cambi, M.; Fernandez-Lacruz, R.; Giannetti, F.; Marchi, E.; Nordfjell, T. Photogrammetric estimation of wheel rut dimensions and soil compaction after increasing numbers of forwarder passes. Scand. J. For. Res. 2018, 33, 613–620. [Google Scholar] [CrossRef]
- Olofsson, K.; Holmgren, J.; Olsson, H. Tree Stem and Height Measurements using Terrestrial Laser Scanning and the RANSAC Algorithm. Remote Sens. 2014, 6, 4323–4344. [Google Scholar] [CrossRef]
- National Land Survey of Finland; 2020. Available online: https://www.maanmittauslaitos.fi/en/maps-and-spatial-data/expert-users/product-descriptions/topographic-database (accessed on 23 April 2021).
- Geological Survey of Finland. 2020. Available online: https://www.gtk.fi/en/services/data-sets-and-online-services-geo-fi/map-services/ (accessed on 23 April 2021).
- Uusitalo, J.; Kaakkurivaara, T.; Haavisto, M. Utilizing airborne laser scanning technology in predicting bearing capacity of peatland forest. Croat. J. For. Eng. 2012, 33, 329–337. [Google Scholar]
- Palander, T.; Bergroth, J.; Kärhä, K. Excavator technology for increasing the efficiency of energy wood and pulp wood harvesting. Biomass Bioenergy 2012, 40, 120–126. [Google Scholar] [CrossRef]
- Arp, P.A. High-resolution flow-channel and wet-areas maps: A tool for better forest operations planning. Sustain. For. Manag. Netw. SFM Netw. Res. Note 2009, 55, 1–6. [Google Scholar]
- Schönauer, M.; Hoffmann, S.; Maack, J.; Jansen, M.; Jaeger, D. Comparison of Selected Terramechanical Test Procedures and Cartographic Indices to Predict Rutting Caused by Machine Traffic during a Cut-to-Length Thinning Operation. Forests 2021, 12, 113. [Google Scholar] [CrossRef]
- Cambi, M.; Certini, G.; Neri, F.; Marchi, E. The impact of heavy traffic on forest soils: A review. For. Ecol. Manag. 2015, 338, 124–138. [Google Scholar] [CrossRef]
- Uusitalo, J.; Ala-Ilomäki, J.; Lindeman, H.; Toivio, J.; Sirén, M. Predicting rut depth induced by an 8-wheeled forwarder in fine-grained boreal forest soils. Ann. For. Sci. 2020, 77, 42. [Google Scholar] [CrossRef]
- Vega-Nieva, D.J.; Murphy, P.N.C.; Castonguay, M.; Ogilvie, J.; Arp, P.A. A modular terrain model for daily variations in machine-specific soil forest trafficability. Can. J. Soil Sci. 2009, 89, 93–109. [Google Scholar] [CrossRef]
Publisher’s Note: MDPI stays neutral with regard to jurisdictional claims in published maps and institutional affiliations. |
© 2021 by the authors. Licensee MDPI, Basel, Switzerland. This article is an open access article distributed under the terms and conditions of the Creative Commons Attribution (CC BY) license (https://creativecommons.org/licenses/by/4.0/).