TATSSI: A Free and Open-Source Platform for Analyzing Earth Observation Products with Quality Data Assessment
Abstract
1. Introduction
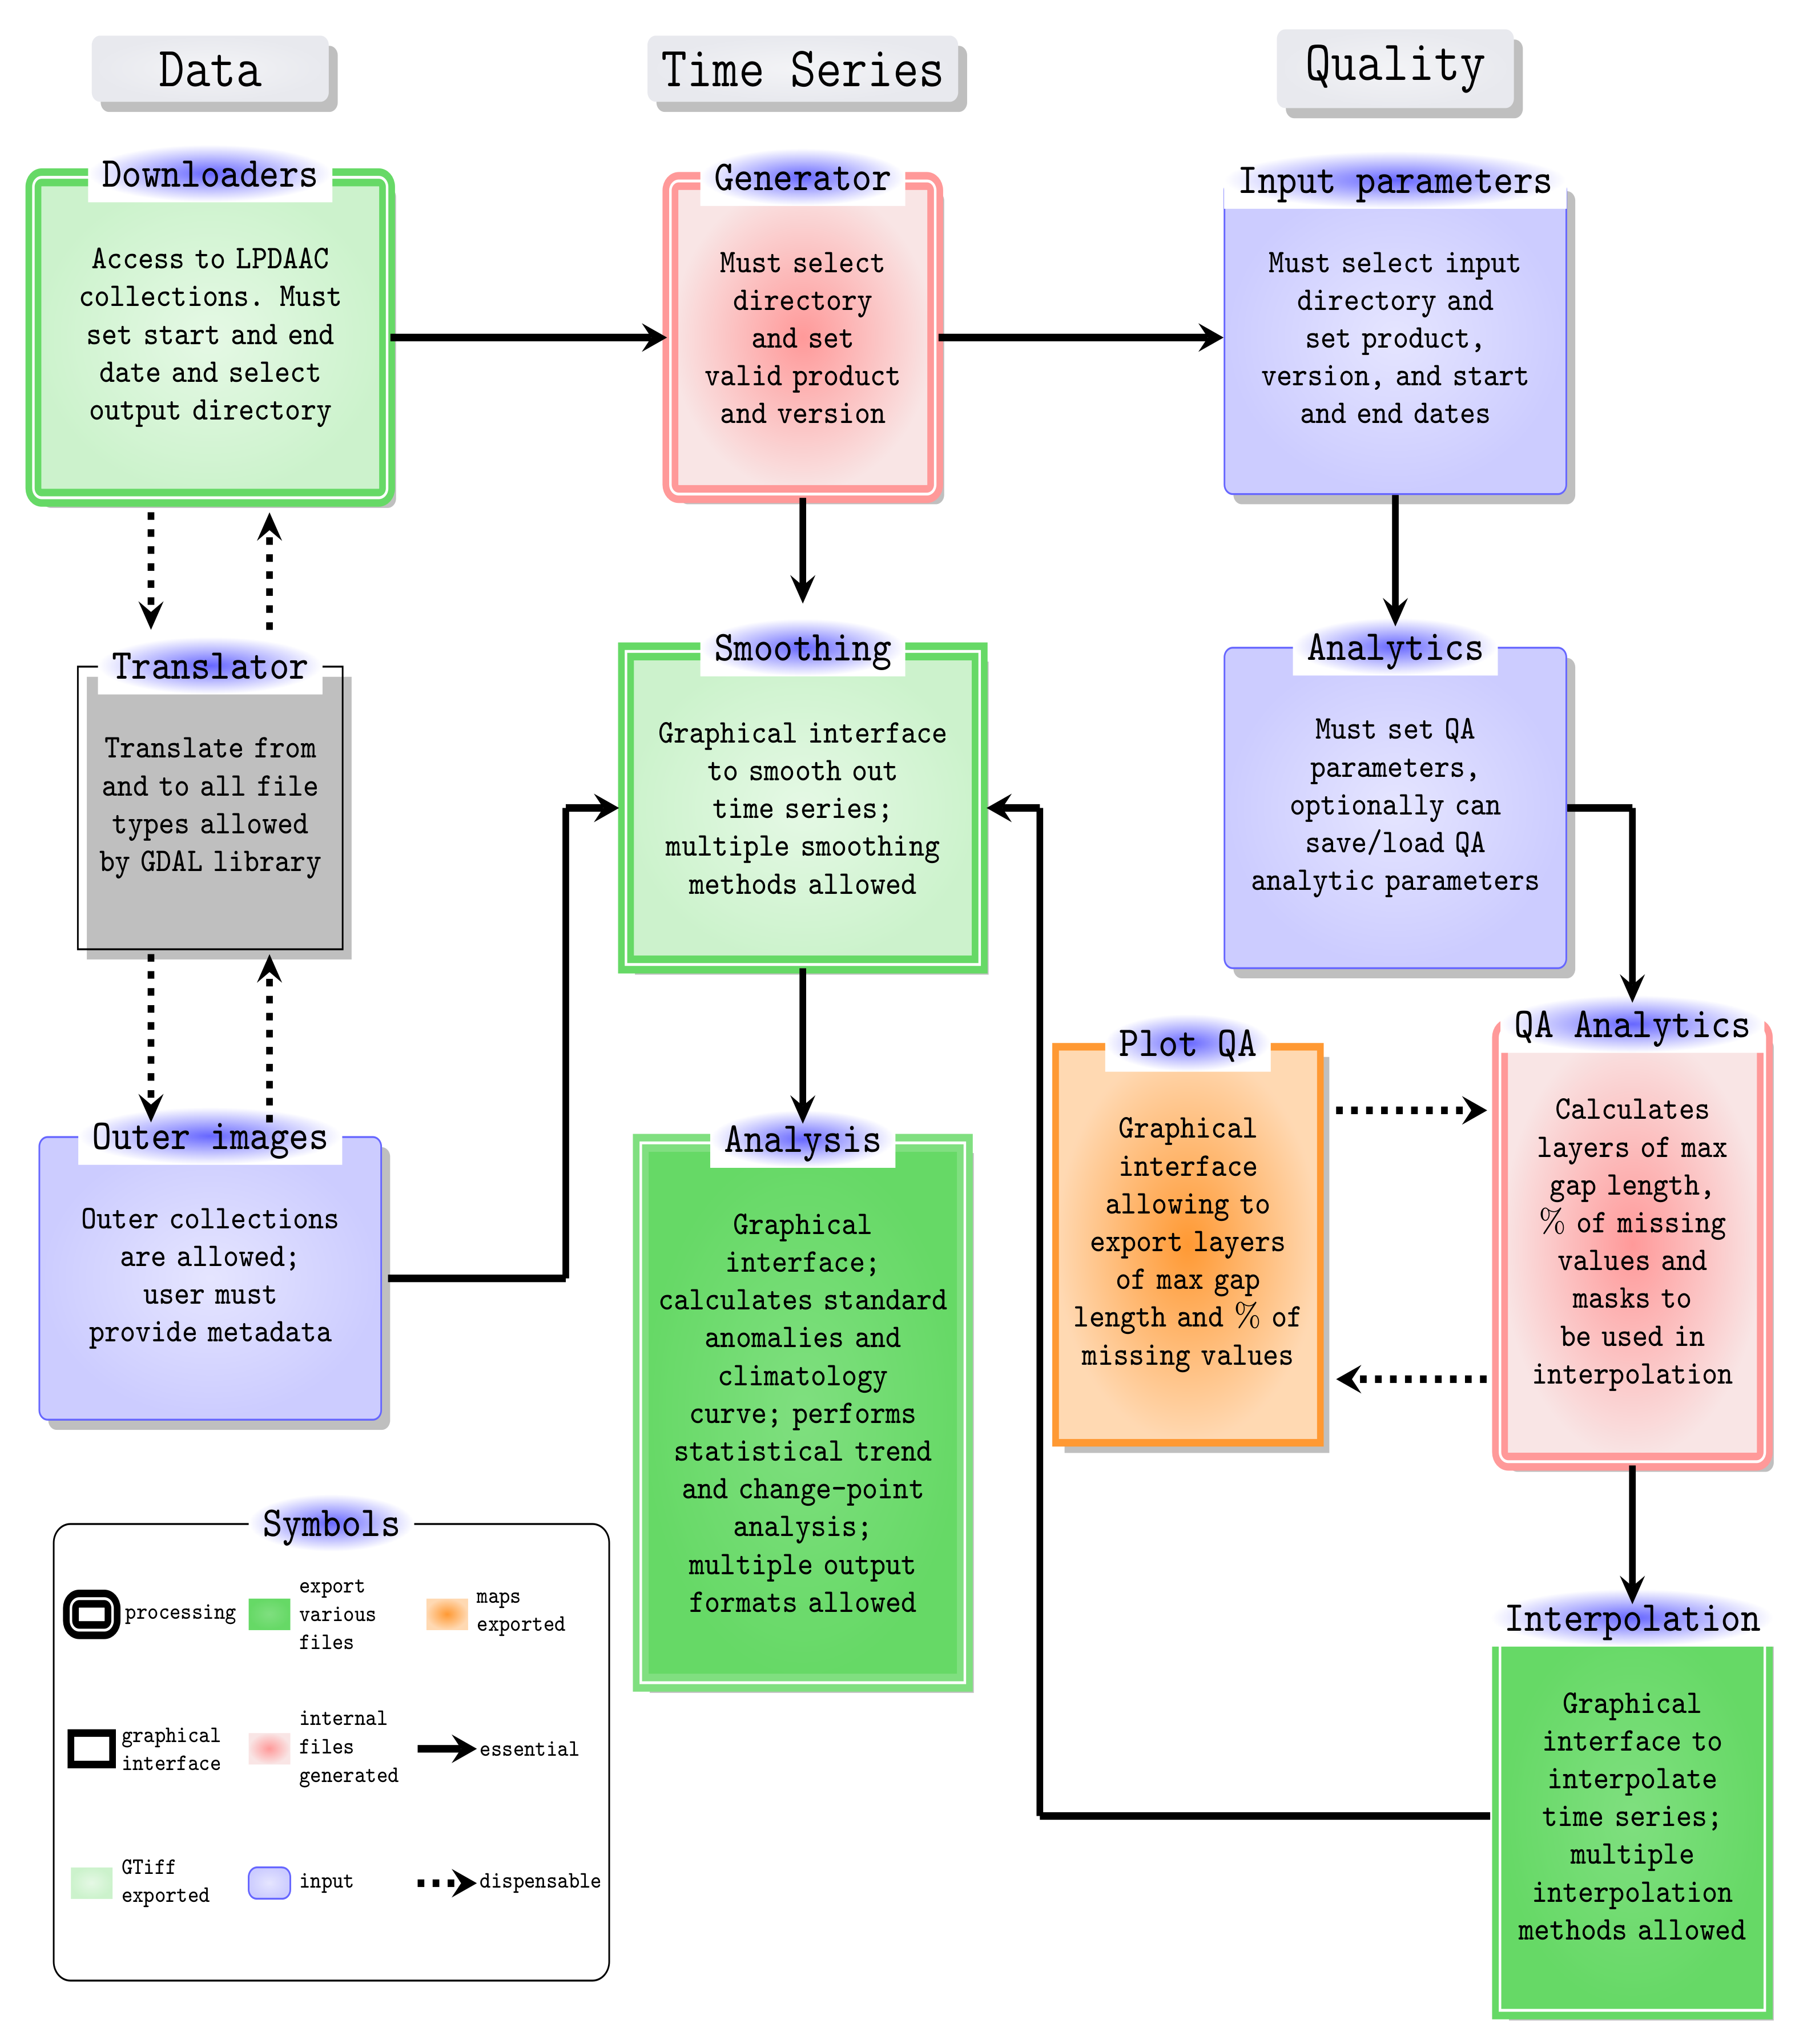
2. TATSSI: Tools for Analyzing Time Series of Satellite Imagery
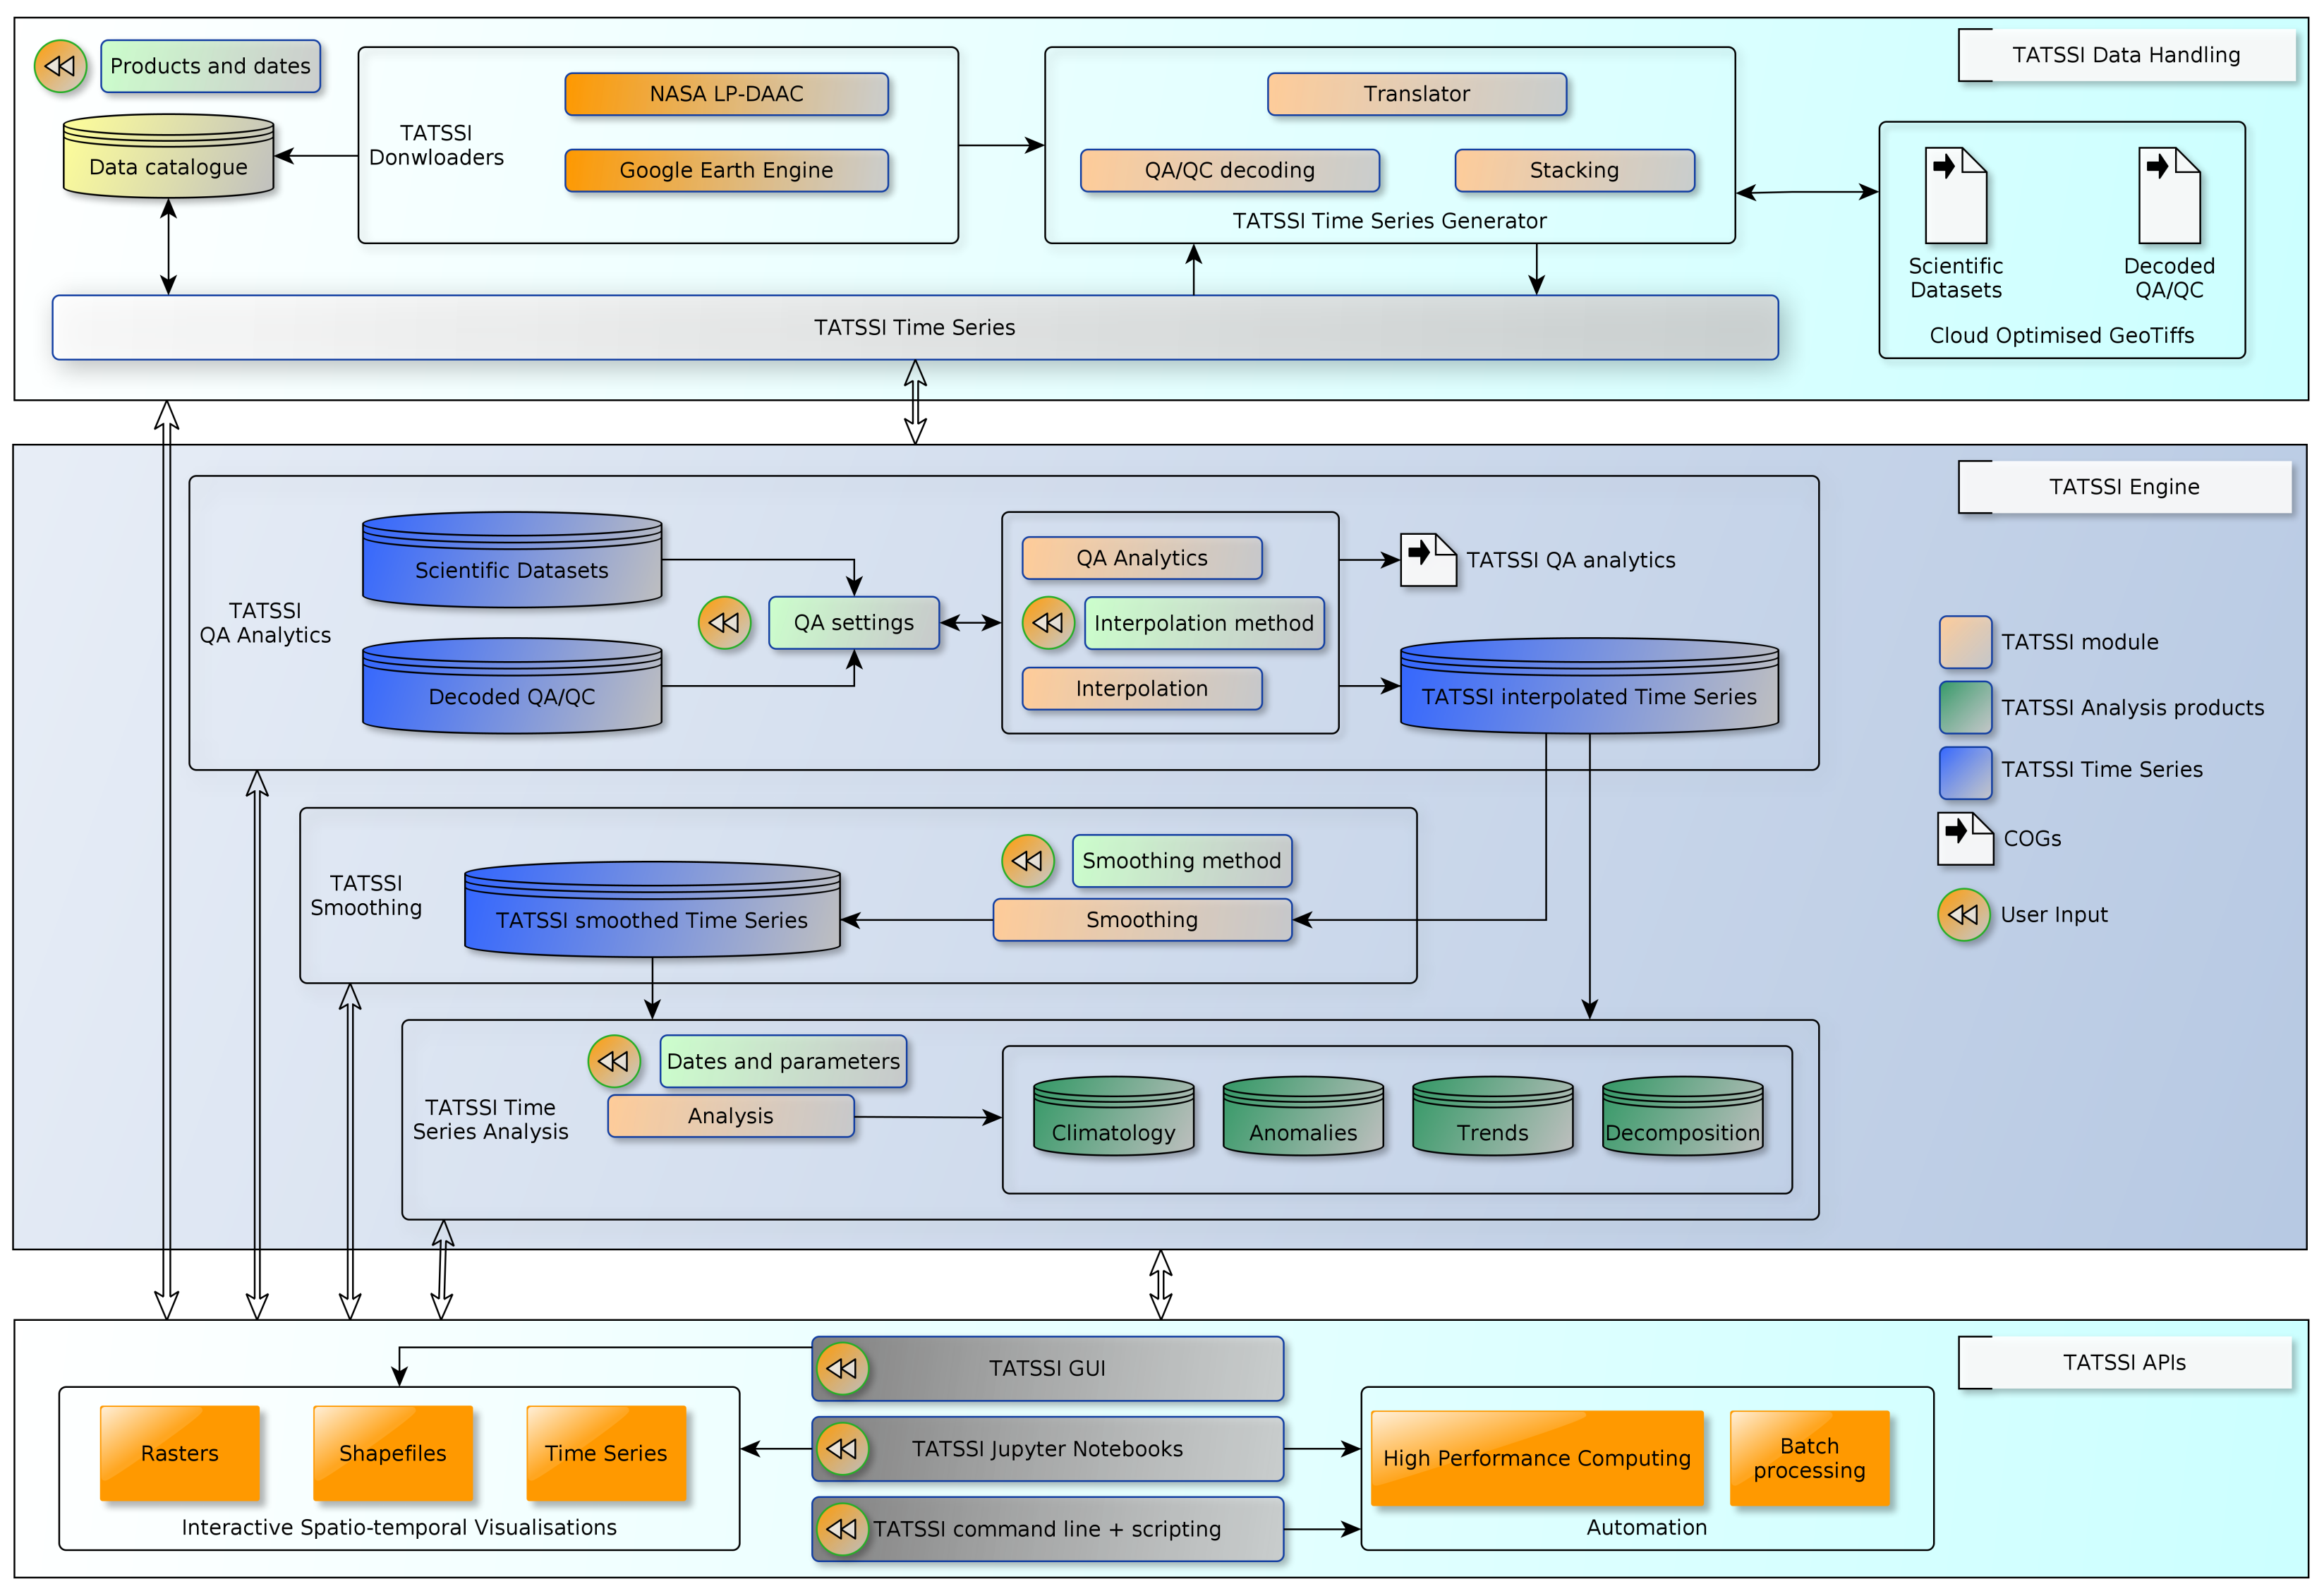
2.1. Architecture and Design
2.2. Data Handling
- For every file in the data directory that matches the product and version selected by the user:
- ‒
- Each band or SDS is imported in the internal TATSSI format (COG).
- For each QA layer associated with the product:
- ‒
- Import data into the internal TATSSI format and perform the QA decoding for each flag.
- For each SDS and associated QA/QC:
- ‒
- Generate GDAL VRT layer stacks
2.3. Engine
2.4. Interfaces
| Listing 1. Python script used by TATSSI to generate time series. |
# Import TATSSI modules from TATSSI.time_series.generator import Generator # Set downloading parameters source_dir = ‘/data/MCD43A4_h08v06’ product = ‘MCD43A4’ version = ‘006’ data_format = ‘hdf’ # Create TATSSI the~time series generator object tsg = Generator(source_dir=source_dir, product=product, version=version, data_format=data_format) # Generate the~time series tsg.generate_time_series() |
| Listing 2. Calculation of Normalized Difference Moisture Index based on the MCD43A4 product taken on tile h08v06. |
import os import sys # TATSSI modules from TATSSI.time_series.analysis import Analysis from TATSSI.input_output.utils import save_dask_array # TATSSI time series object for band 2 fname = (f‘/data/MCD43A4_h08v06/Nadir_Reflectance_Band2/’ f‘interpolated/MCD43A4.006._Nadir_Reflectance_Band2.linear.tif’) ts_b2 = Analysis(fname=fname) # Get DataArray from {\tatssi} time series object b2 = ts_b2.data._Nadir_Reflectance_Band2 # TATSSI time series object for band 6 fname = (f‘/data/MCD43A4_h08v06/Nadir_Reflectance_Band6/’ f‘interpolated/MCD43A4.006._Nadir_Reflectance_Band6.linear.tif’) ts_b6 = Analysis(fname=fname) # Get DataArray from {\tatssi} time series object b6 = ts_b6.data._Nadir_Reflectance_Band6 # Compute normalized difference moisture index (NDMI) ndmi = ((b2-b6) / (b2+b6)).astype(np.float32) # Copy metadata attributes from band 2 ndmi.attrs = b2.attrs # Change fill value to 0 ndmi.attrs[‘nodatavals’] = tuple(np.zeros(len(ndmi.time))) # Save data fname = ‘/data/marismas_NDMI.tif’ data_var=‘NDMI’ save_dask_array(fname=fname, data=ndmi, data_var=data_var) |
2.5. Adding Metadata to EO Time Series Not Generated by TATSSI
| Listing 3. Python script to add metadata to Landsat 7 images. |
import os import sys import gdal from glob import glob import datetime as dt DataDir = ’/data/Landsat7’ def add_metadata(fname, str_date, data_var, fill_value): """ Adds date to metadata as follows: RANGEBEGINNINGDATE=YYYY-MM-DD :param fname: Full path of files to add date to its metadata :param str_date: date in string format, layout: YYYY-MM-DD :param data_var: Variable name, e.g. surface_reflectance :param fill_value: Fill value """ # Open the file for update d = gdal.Open(fname, gdal.GA_Update) # Open band and get existing metadata md = d.GetMetadata() # Add date md[’RANGEBEGINNINGDATE’] = str_date # Add variable description md[’data_var’] = data_var # Add fill value md[’_FillValue’] = fill_value # Set metadata d.SetMetadata(md) d = None if __name__ == "__main__": # Get all file from data directory for Landsat band 4, for instance # /data/Landsat7/LE70290462004017EDC01/LE70290462004017EDC01_sr_band4.tif fnames = glob(os.path.join(DataDir, ‘*’, ‘*_sr_band4.tif’)) fnames.sort() for fname in fnames: # Extract date from filename # LE7PPPRRRYYYYDDDEDC01_sr_band4.tif # YYYY = year # DDD = julian day year_julian_day = os.path.basename(fname)[9:16] # Convert string YYYYDDD into a datetime object _date = dt.datetime.strptime(year_julian_day, ‘%Y%j’) # Convert datetime object to string YYYY-MM-DD str_date = _date.strftime(‘%Y-%m-%d’) # Set data variable to a descriptive ’L7_SurfaceReflectance_B4’ data_var = ‘L7_SurfaceReflectance_B4’ # Add metadata add_metadata(fname=fname, str_date=str_date, data_var=data_var, fill_value=‘-9999’) |
| Listing 4. Creating a GDAL Virtual Raster from files modified through Listings 3’s code. |
gdalbuildvrt -separate LE70290462004.vrt /data/Landsat7/*/*_sr_band4.tif
0...10...20...30...40...50...60...70...80...90...100 - done.
|
2.6. Cloud Computing Environments
| Listing 5. Accessing to MCD43A4 products stored on a cloud facility. |
gdalinfo-nomd/vsicurl/https://modis-pds.s3.amazonaws.com/MCD43A4.006/18/17/2021062/MCD43A4.A2021062.h18v17.006.2021071072416_B02.TIF
Driver: GTiff/GeoTIFF
Files: /vsicurl/https://modis-pds.s3.amazonaws.com/MCD43A4.006/18/17/2021062/MCD43A4.A2021062.h18v17.006.2021071072416_B02.TIF
       /vsicurl/https://modis-pds.s3.amazonaws.com/MCD43A4.006/18/17/2021062/MCD43A4.A2021062.h18v17.006.2021071072416_B02.TIF.ovr
Size is 2400, 2400
Coordinate System is:
PROJCS["unnamed",
    GEOGCS["Unknown datum based upon~the~custom spheroid",
        DATUM["Not_specified_based_on_custom_spheroid",
            SPHEROID["Custom spheroid",6371007.181,0]],
        PRIMEM["Greenwich",0],
        UNIT["degree",0.0174532925199433]],
    PROJECTION["Sinusoidal"],
    PARAMETER["longitude_of_center",0],
    PARAMETER["false_easting",0],
    PARAMETER["false_northing",0],
    UNIT["metre",1,
        AUTHORITY["EPSG","9001"]]]
Origin = (0.000000000000000,-8895604.157332999631763)
Pixel Size = (463.312716527916677,-463.312716527916507)
Corner Coordinates:
Upper Left  (       0.000,-8895604.157) (  0d 0‘ 0.01"E, 80d 0’ 0.00"S)
Lower Left  (       0.000,-10007554.677) (  0d 0’ 0.01"E, 90d 0’ 0.00"S)
Upper Right ( 1111950.520,-8895604.157) ( 57d35’15.74"E, 80d 0’ 0.00"S)
Lower Right ( 1111950.520,-10007554.677) ( 46d55‘34.78"E, 90d 0’ 0.00"S)
Center      ( 555975.260,-9451579.417) ( 57d22’ 6.84"E, 85d 0’ 0.00"S)
Band 1 Block=512x512 Type=Int16, ColorInterp=Gray
  Description = Nadir_Reflectance_Band2
  NoData Value=32767
  Overviews: 1200x1200, 600x600, 300x300
  Offset: 0,   Scale:0.0001
|
3. Study Sites and Materials
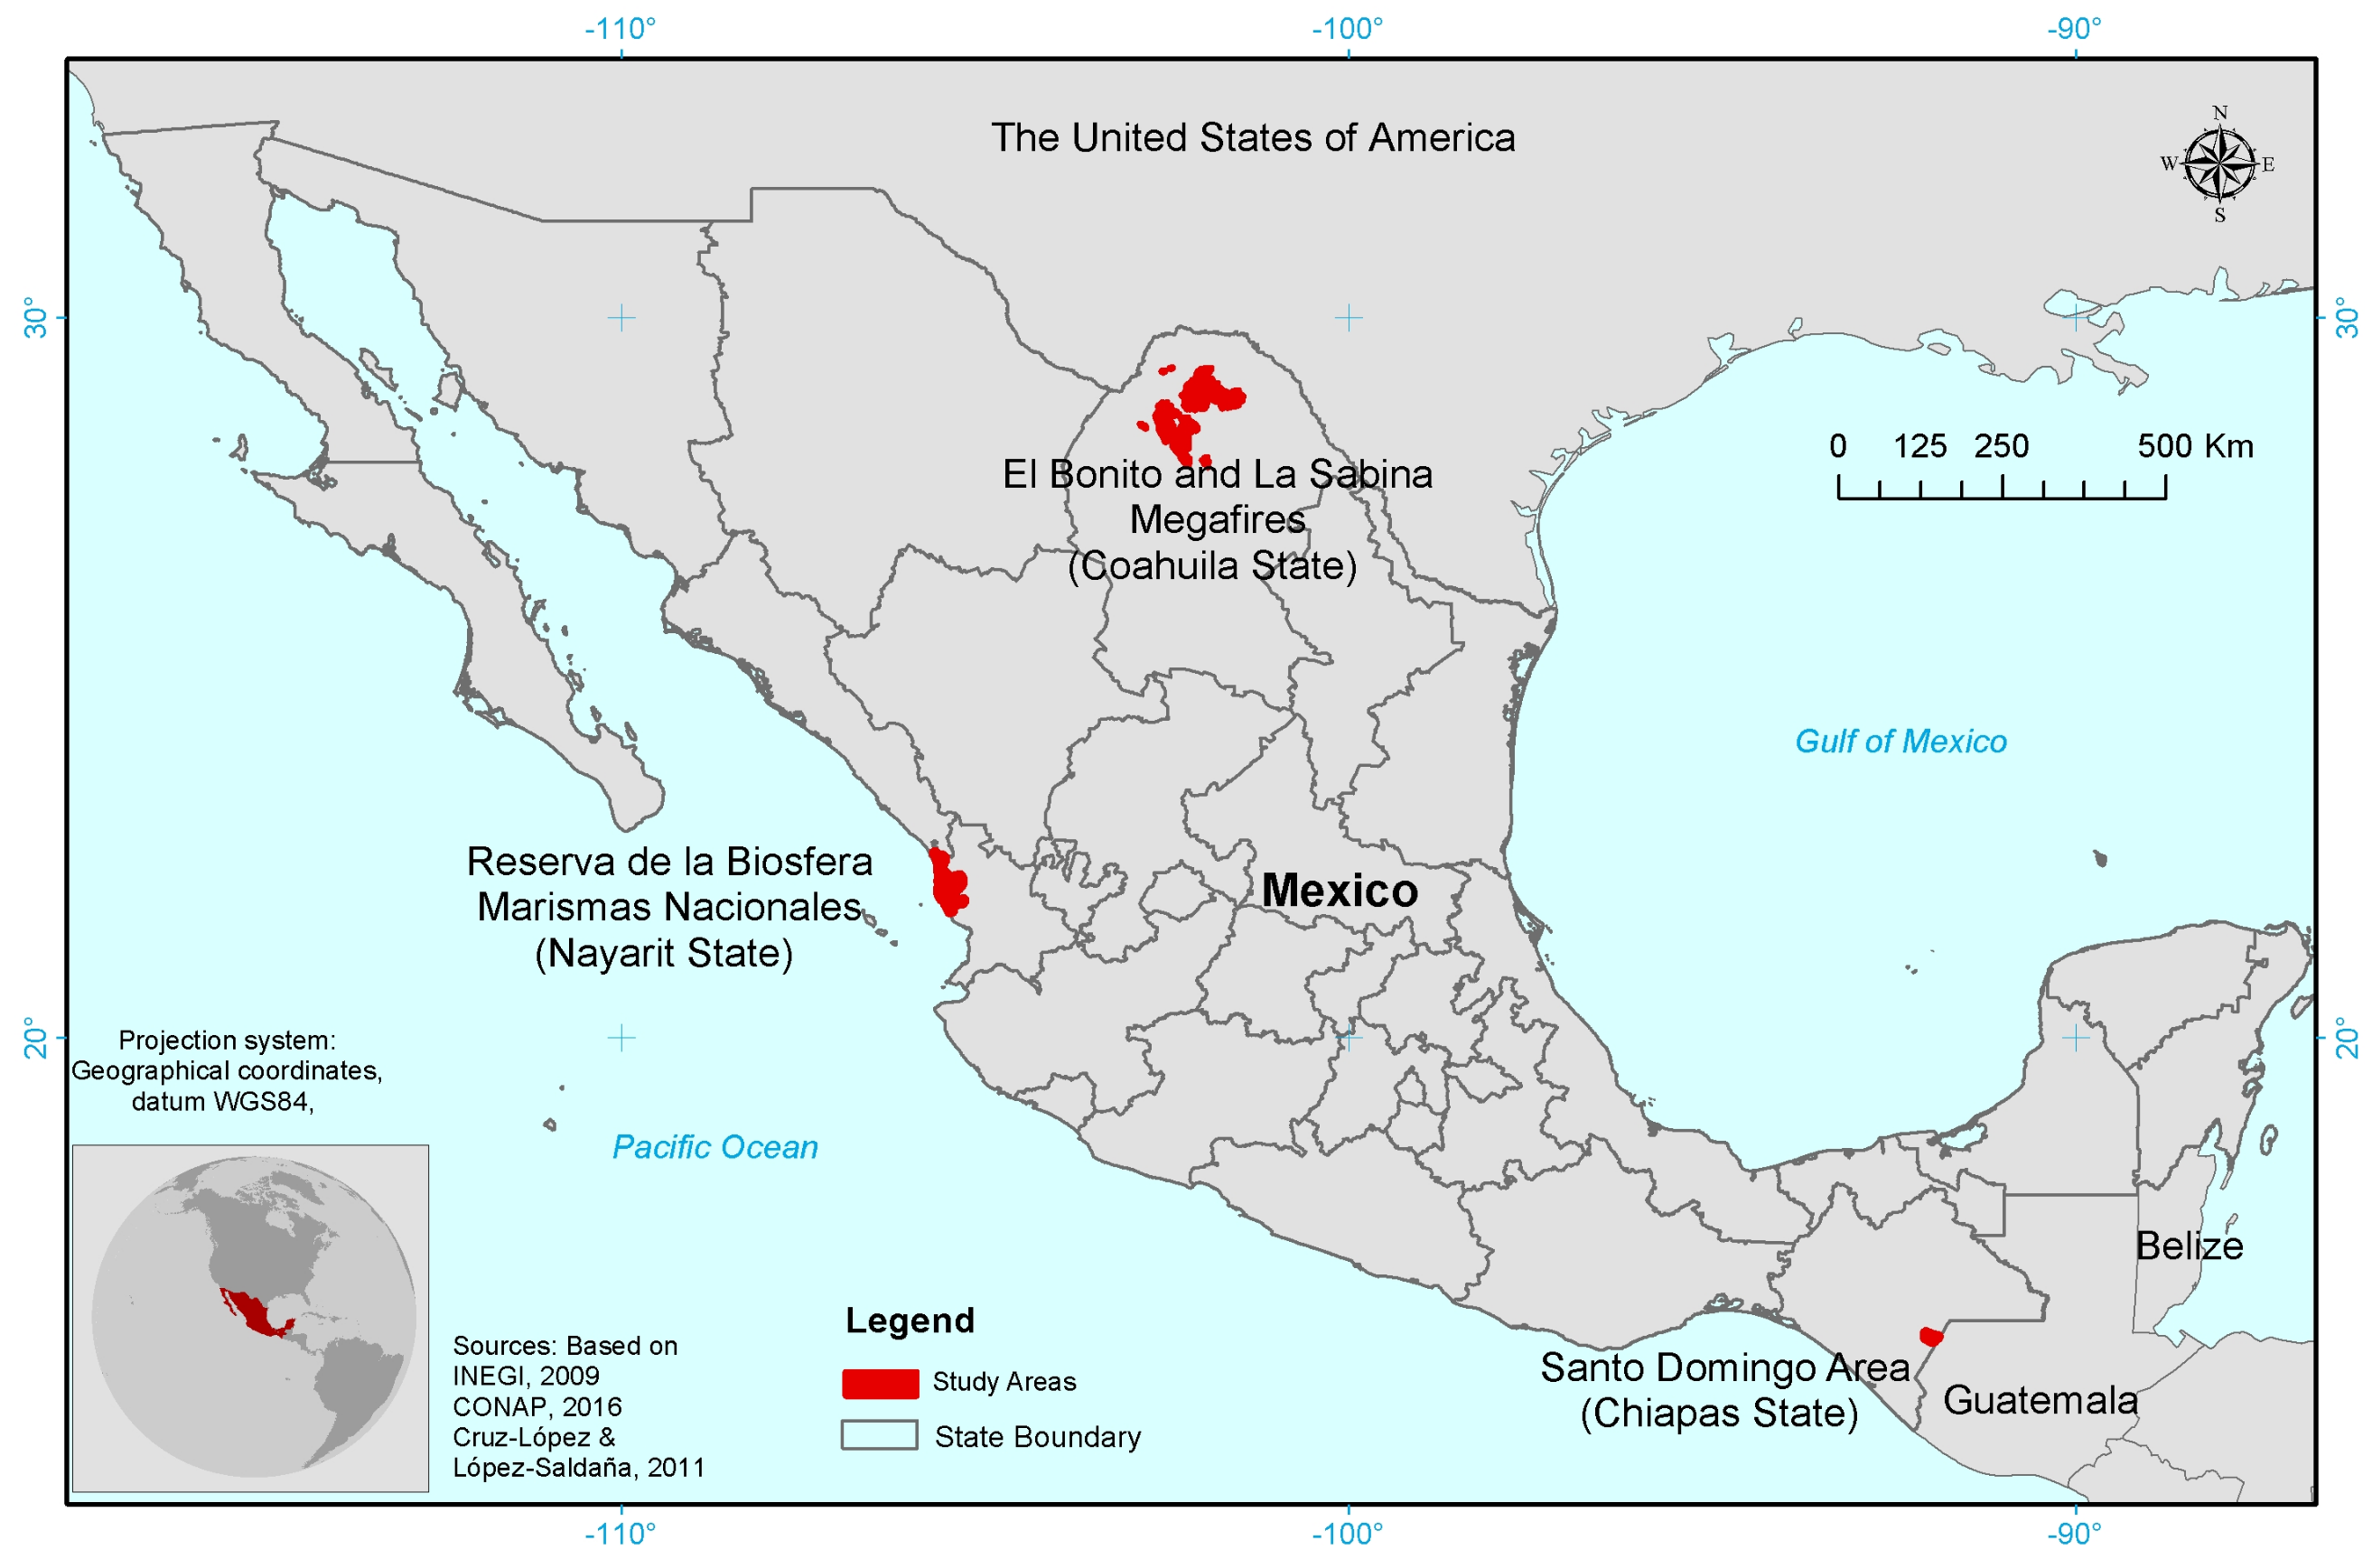
3.1. Irrigation Area Changes in Santo Domingo
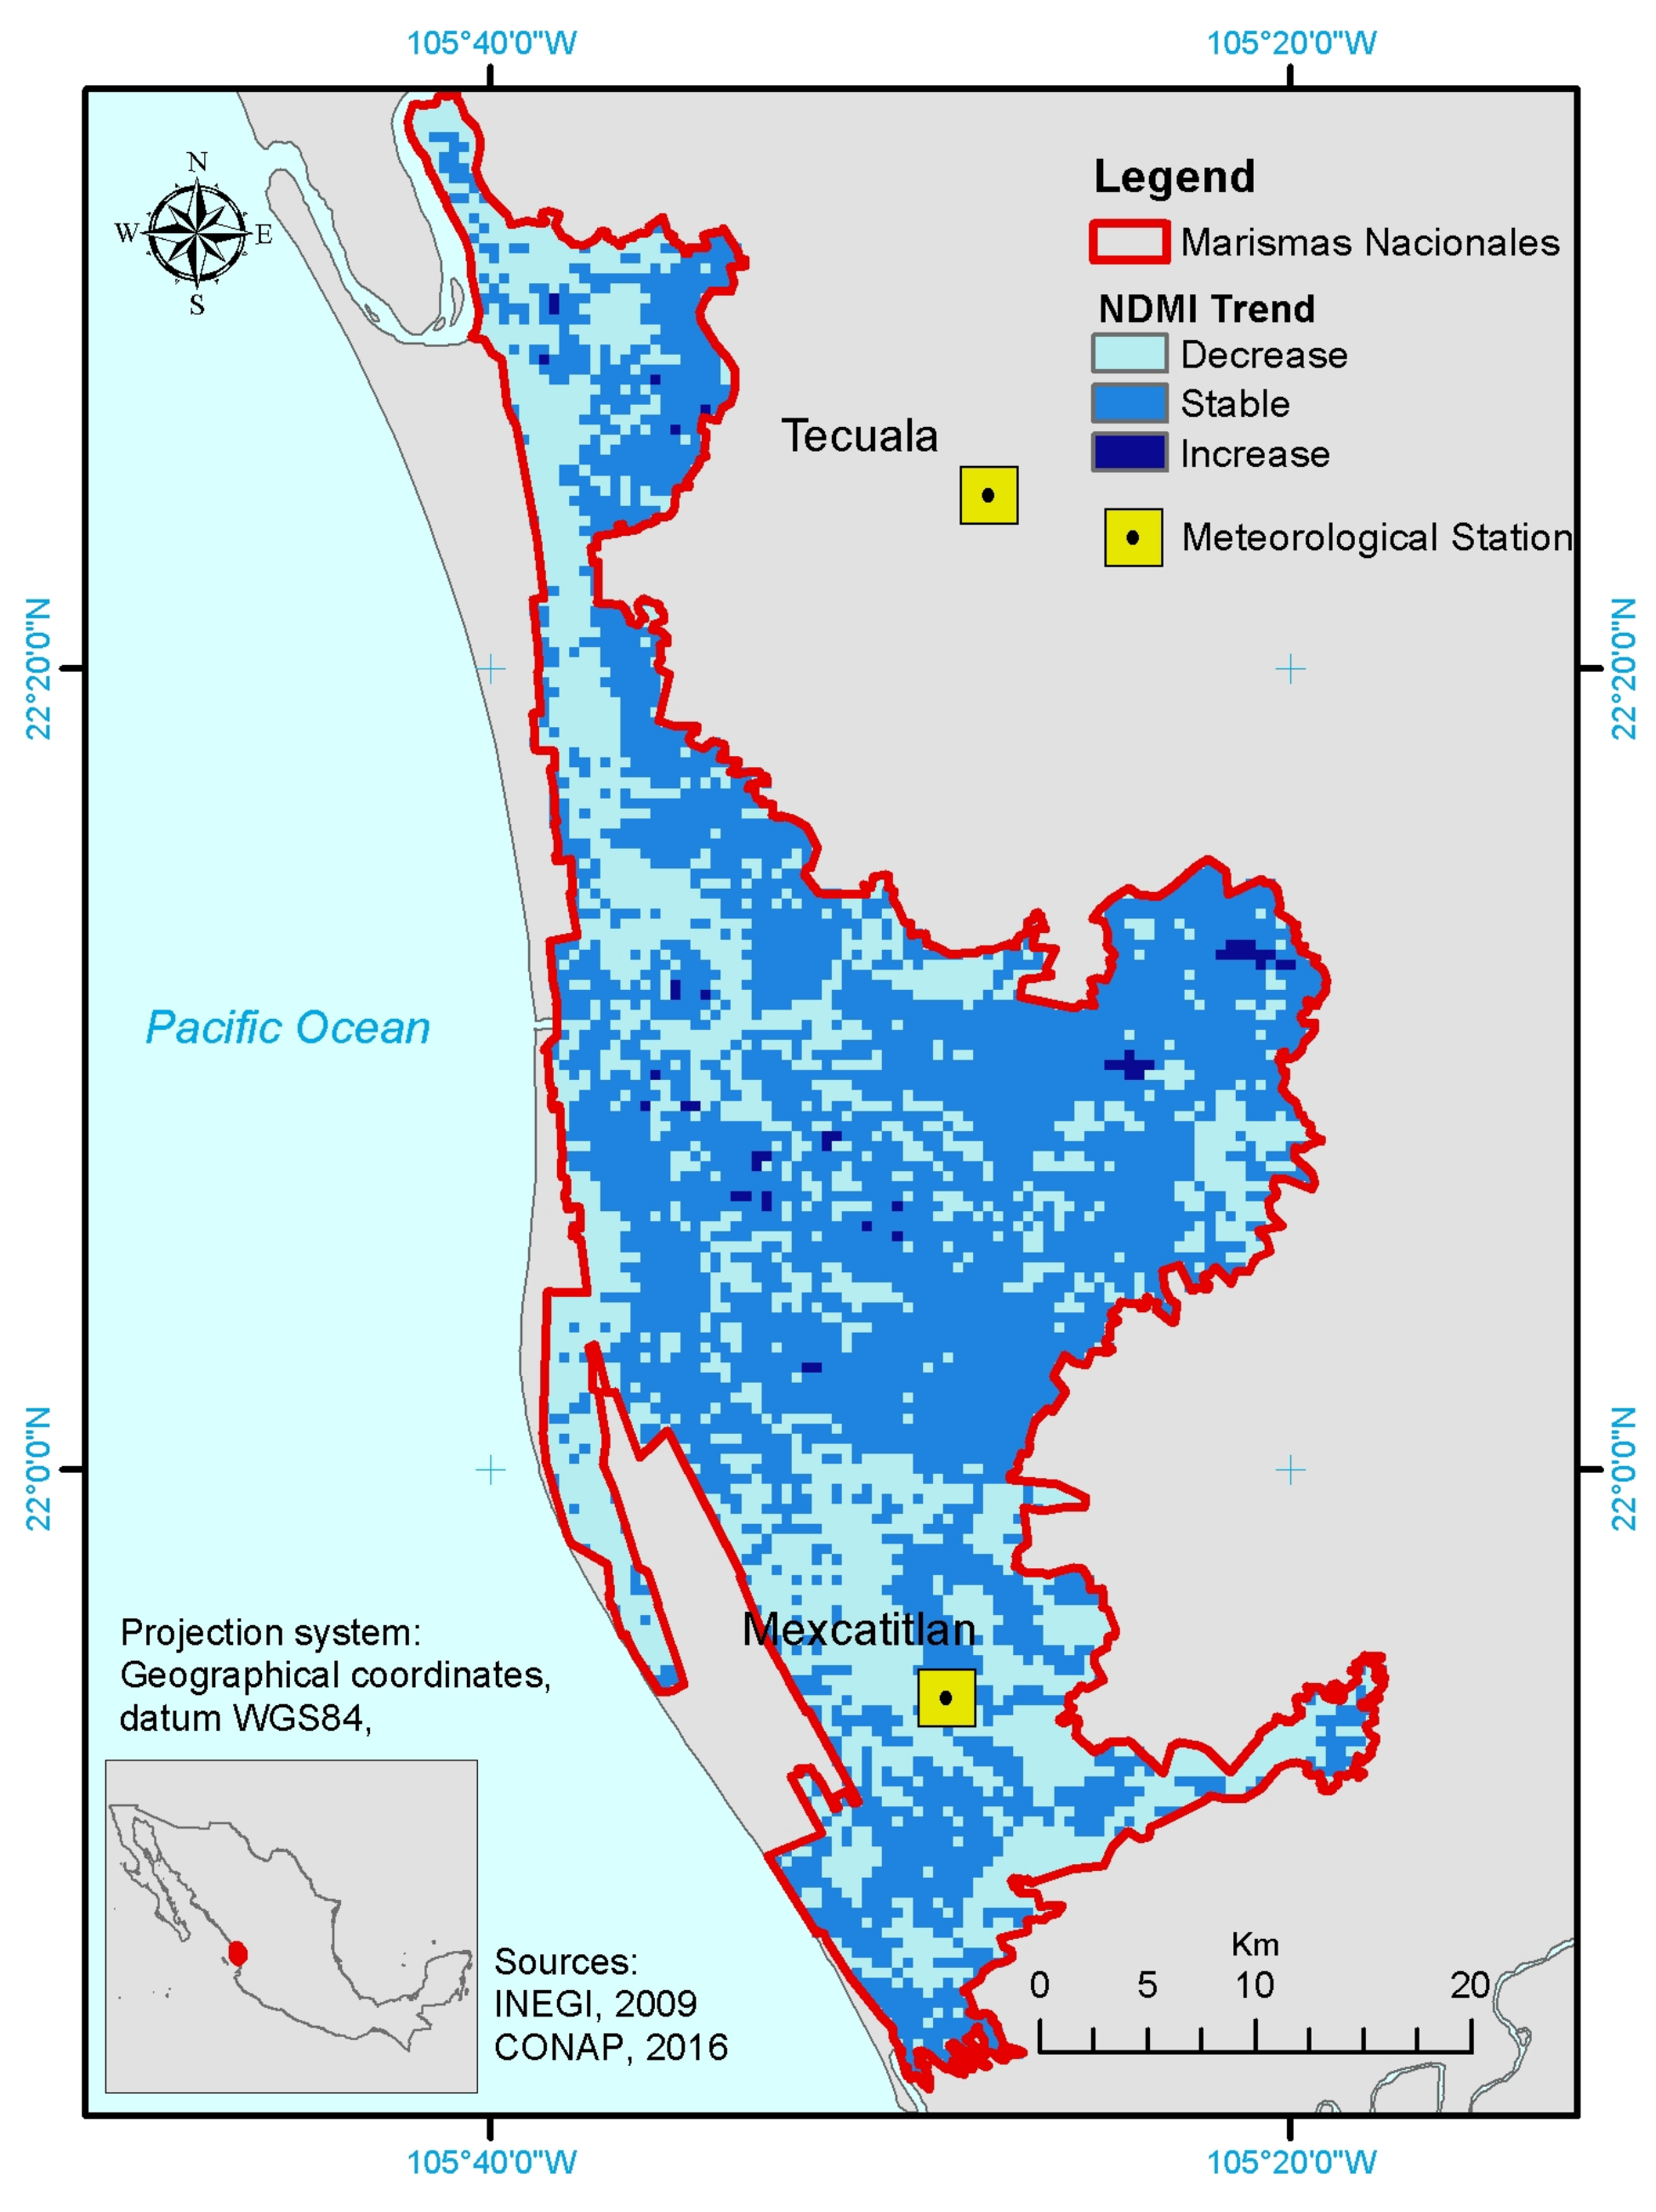
3.2. Evaluation of Moisture Dynamics of Marismas Nacionales
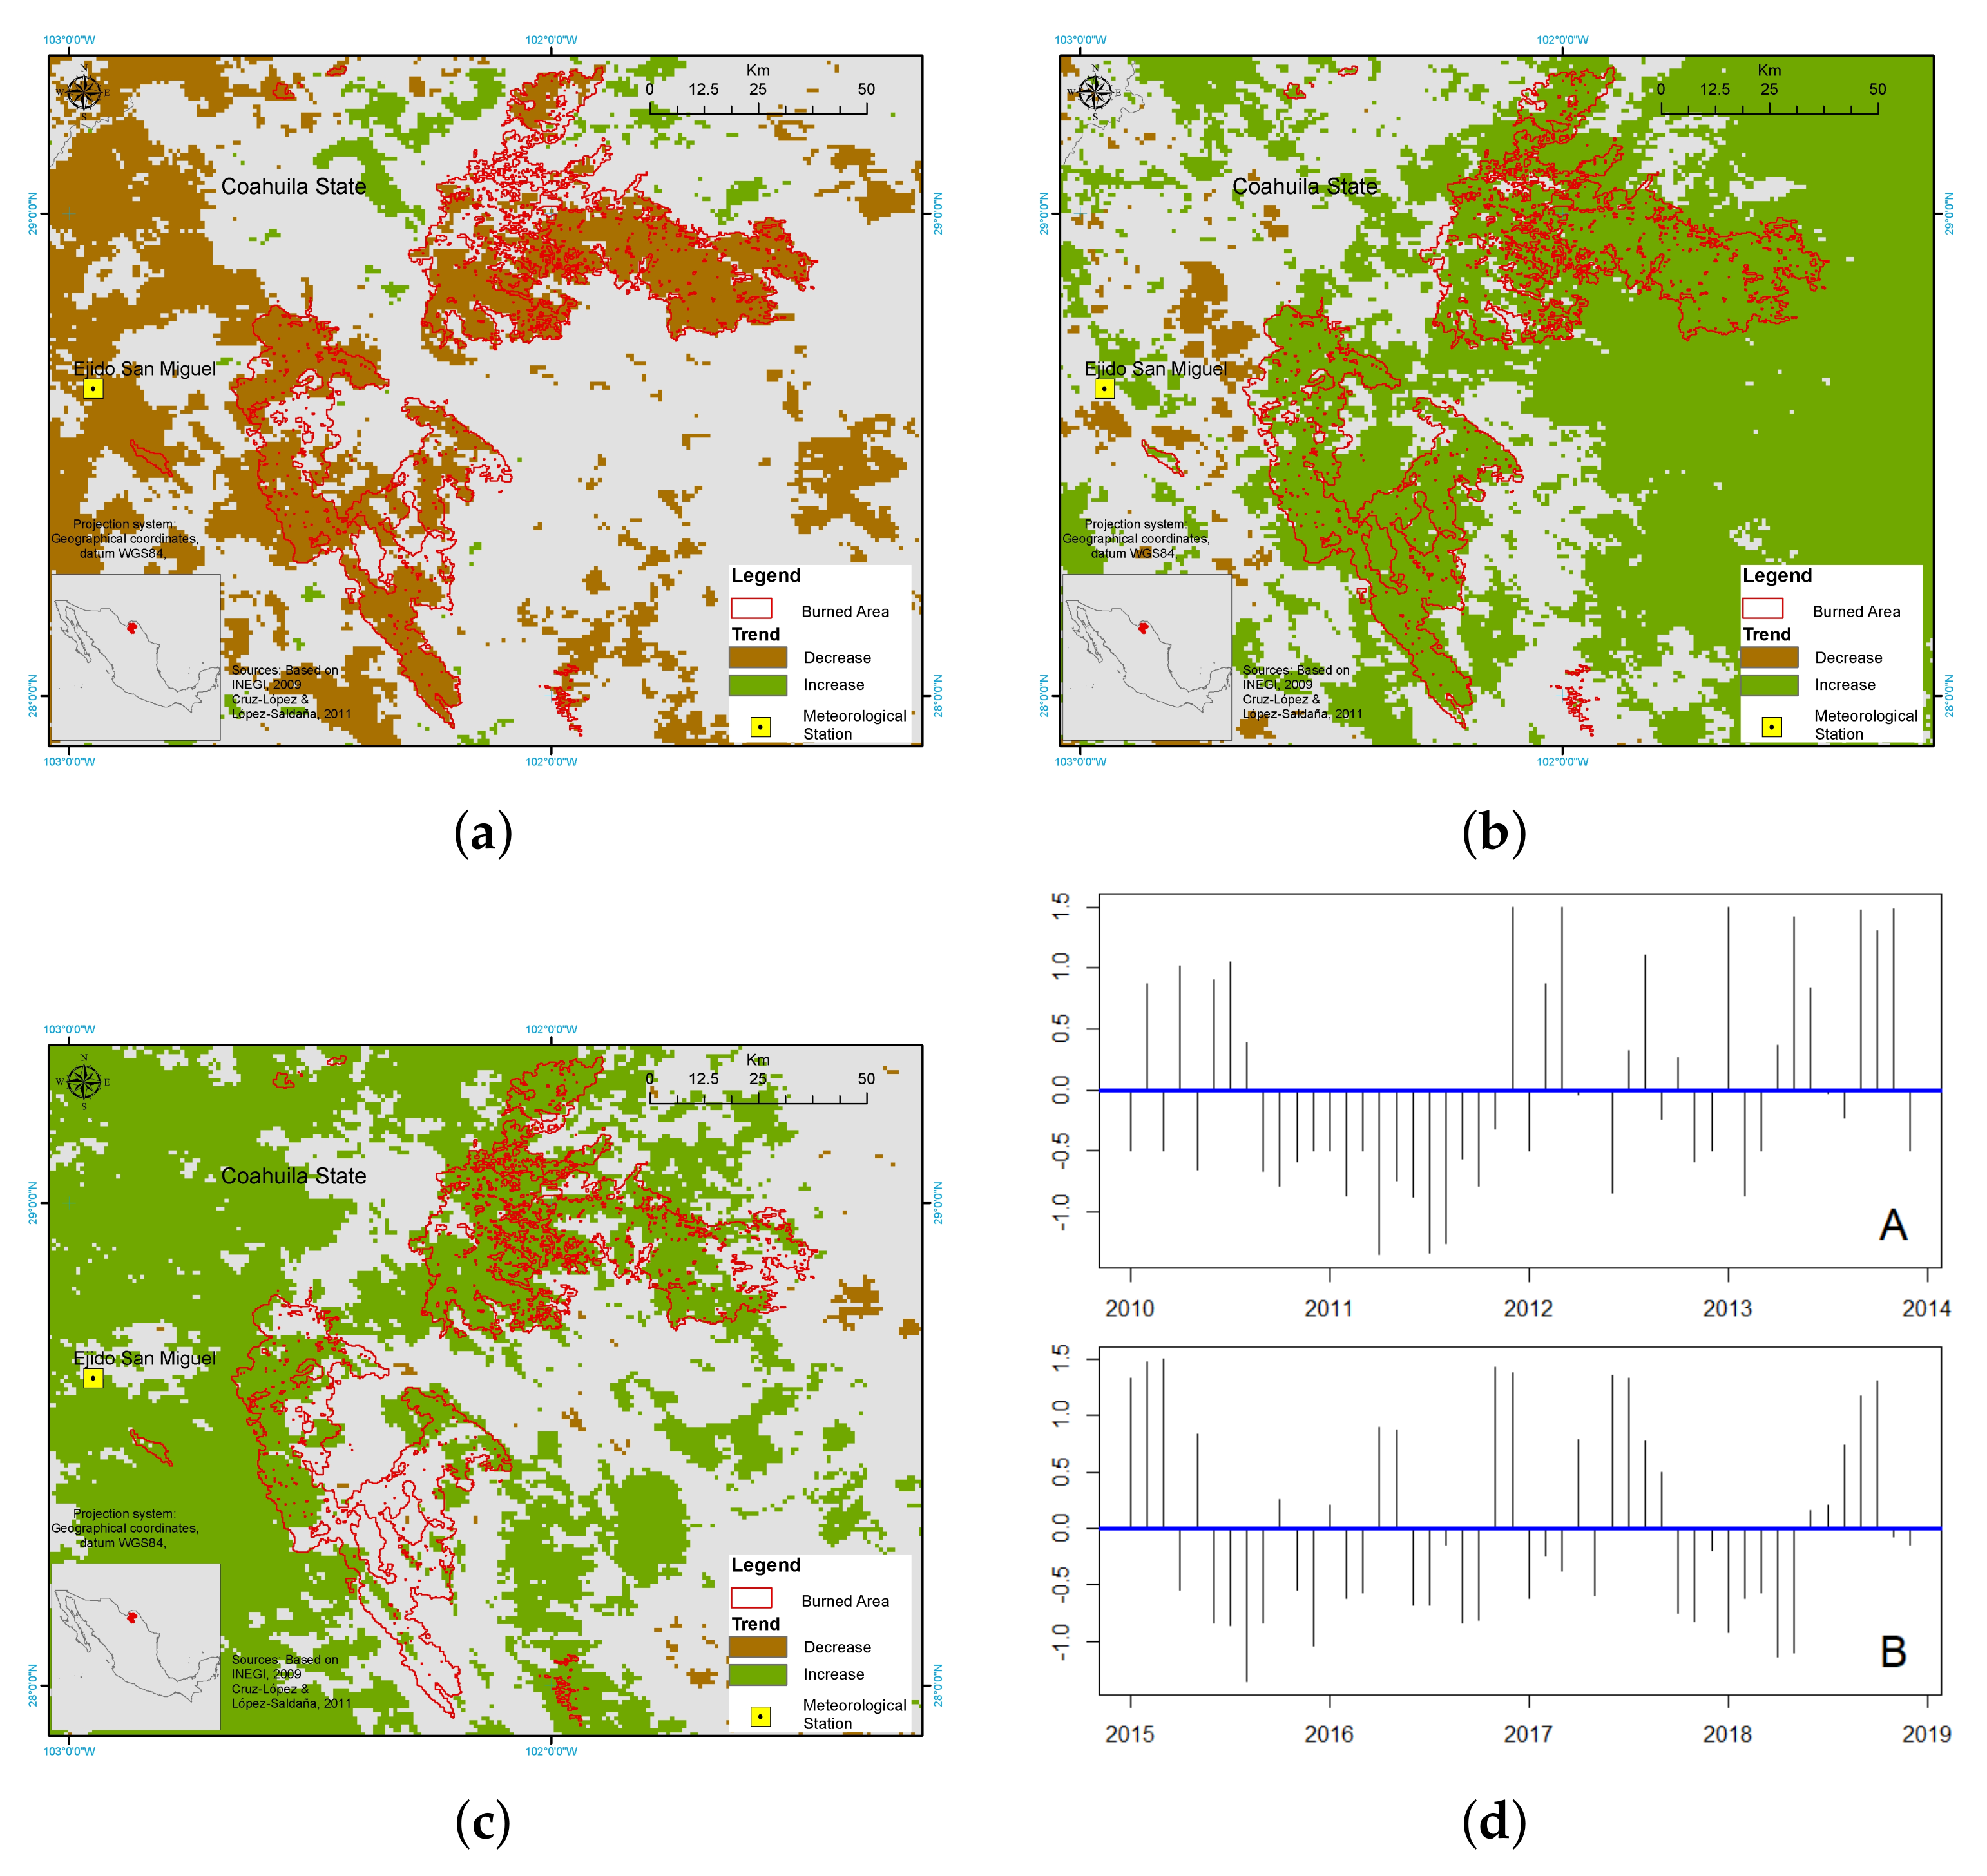
3.3. Burned Area Monitoring at El Bonito and La Sabina
3.4. Pre-Processing
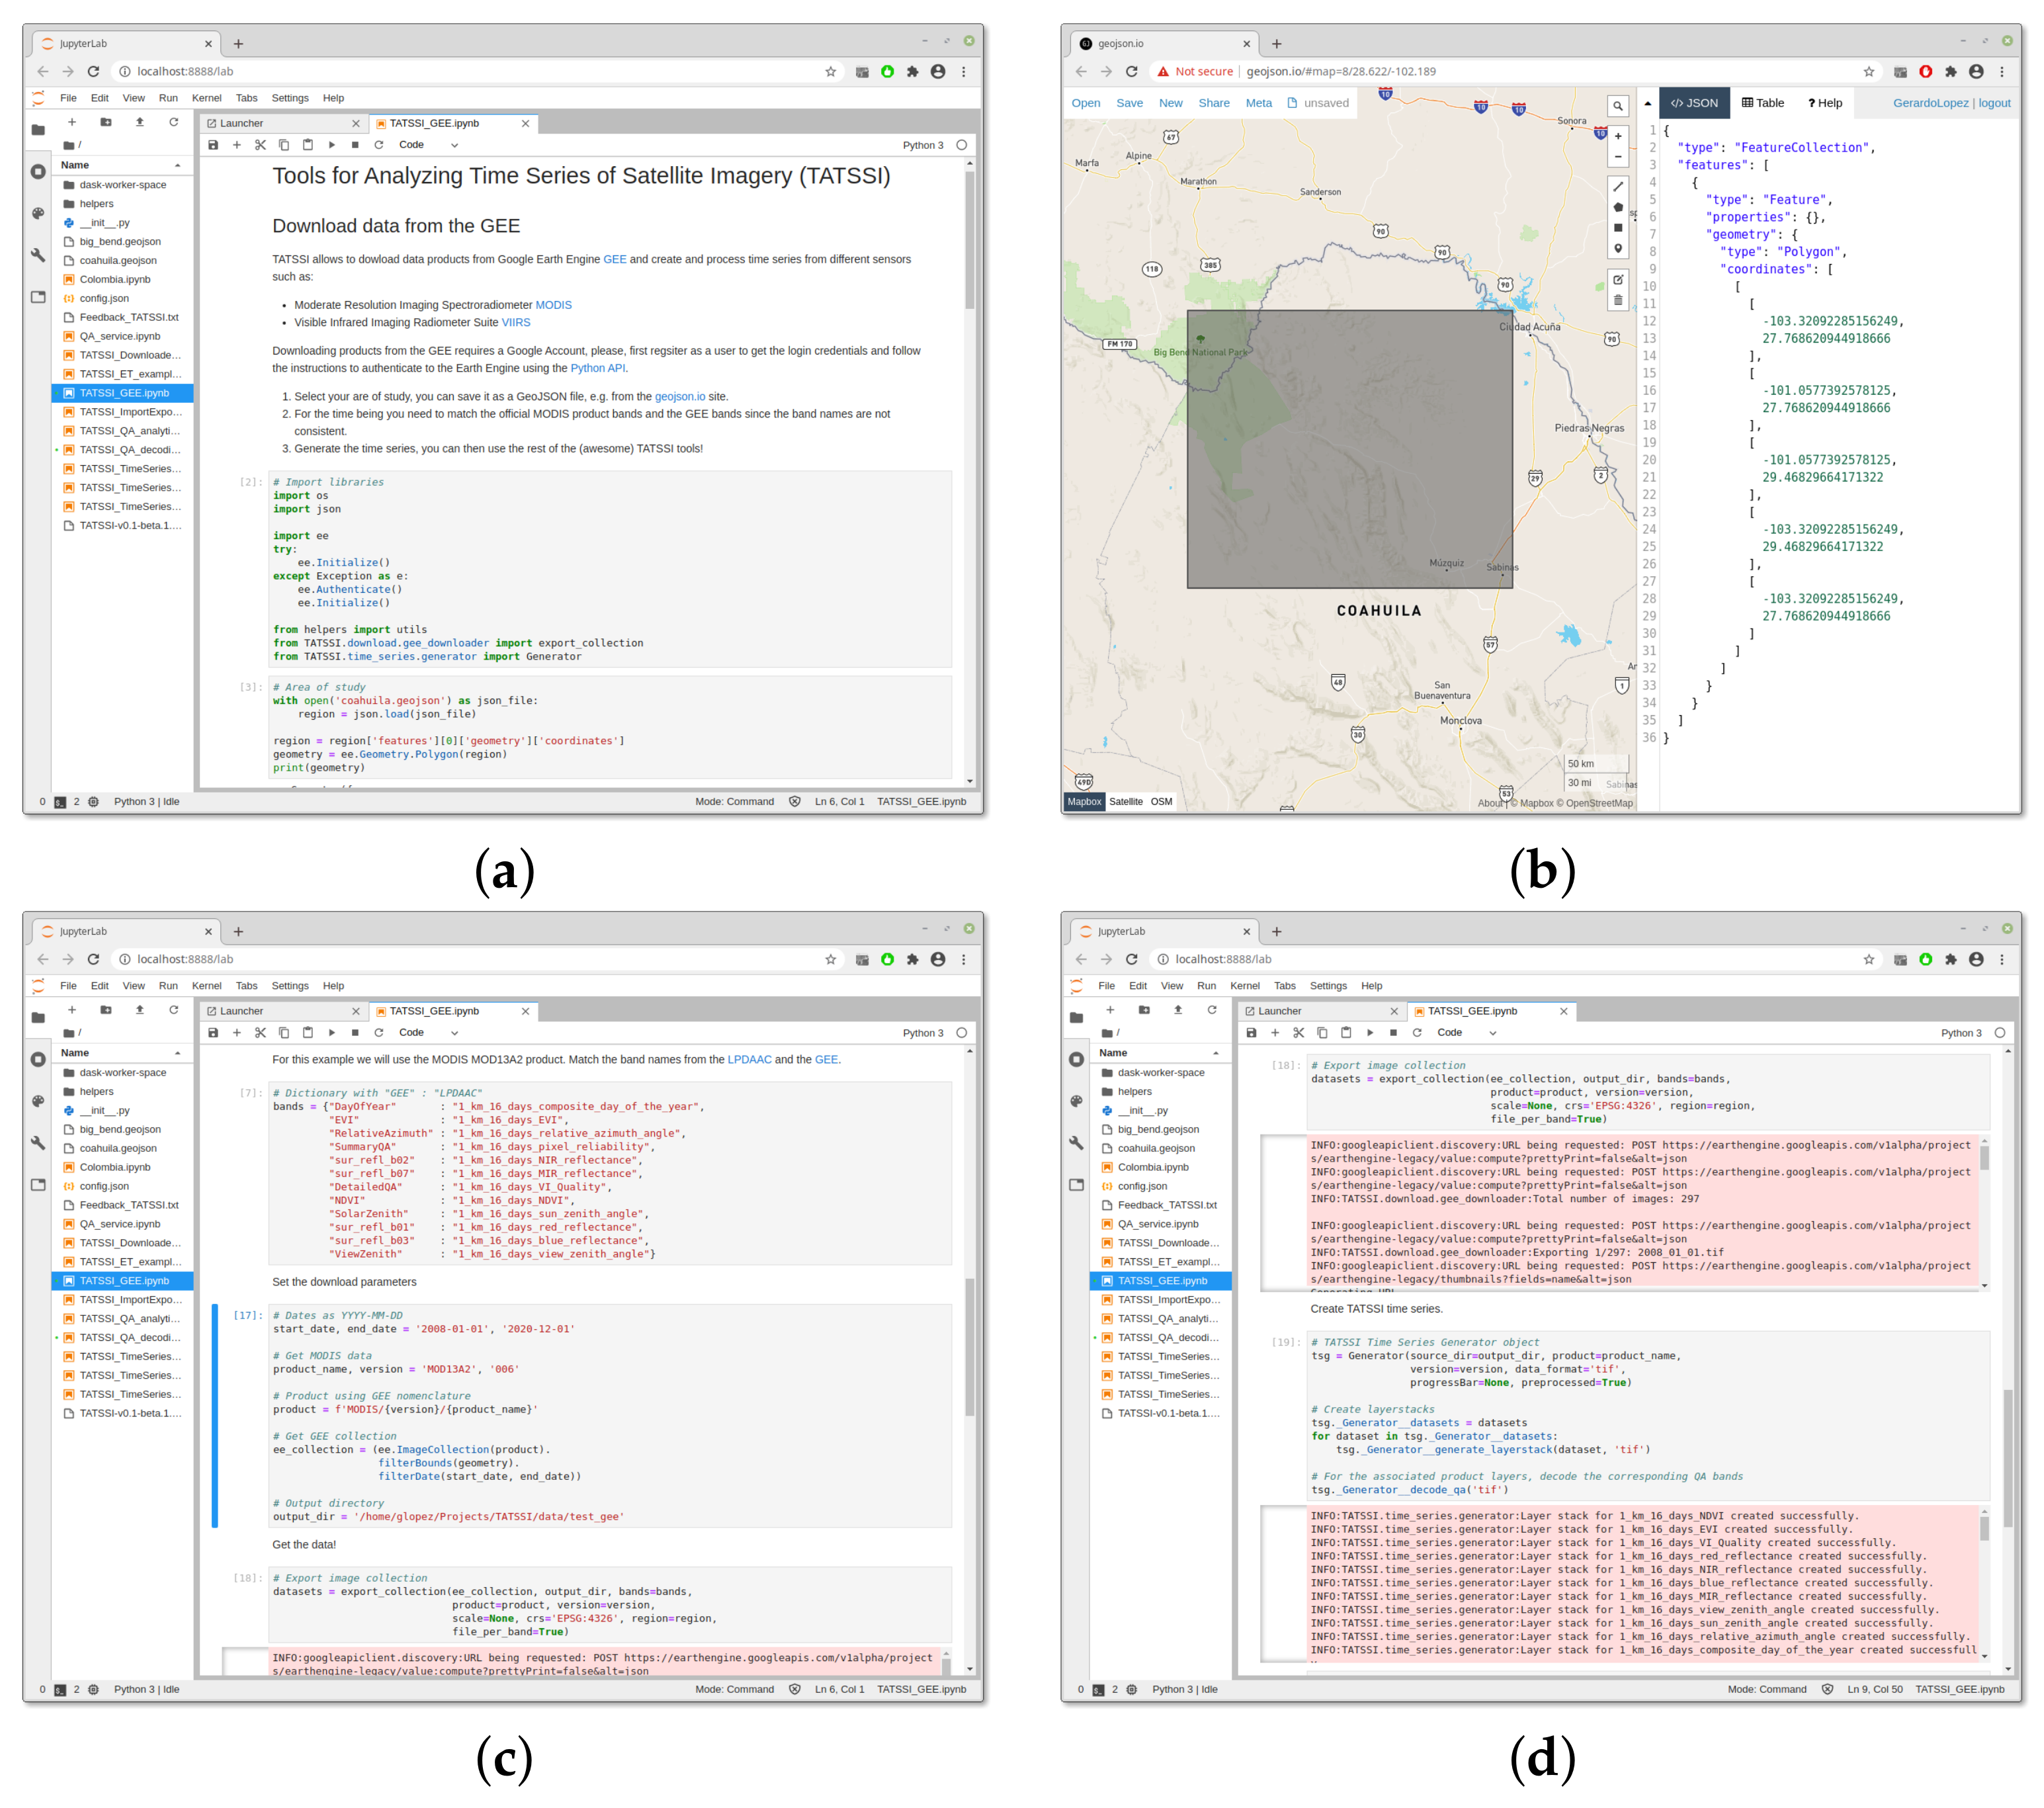
- Download and Time Series Generation. To analyze changes in the irrigation area (IA) of Santo Domingo with TATSSI we focused on the MOD13A2.006’s EVI. The TATSSI GUI Downloaders allowed us to acquire the images of the tile h09v07 from January 1st, 2001 to December 31st, 2019. A further application of the Select Spatial Subset within the Generator module allowed us to define a subset covering the area of interest (AOI). As a reference for our subsetting, we uploaded a shapefile of the AOI via the Geometry Overlay application in the Generator module. To generate the final time series, it is crucial that the original product and the shapefile have the same coordinate reference system and projection. For the EMD case study, we considered the NDMI derived from the MCD43A4 product from which we initially obtained 1461 daily images of tile h08v06 using the TATSSI GUI Downloaders. Then, as for IA, we generated a time series covering the AOI employing Select Spatial Subset and TATSSI GUI Generator modules. Based on this time series, we calculated the NDMI using the Python script presented in Section 2.4 and the details presented in Section 3.2. For the BAM case study, we employed the EVI layer of the MOD13A2.006. The AOI is located on the edge between MODIS tiles h08v06 and h09v06. For an efficient download and generation of the time series to analyze, we combined TATSSI Jupyter Notebook API and the GEE (see Section 2.4 for further details), and acquired subsets of MOD13A2.006 images covering the AOI from 2008 to 2020.
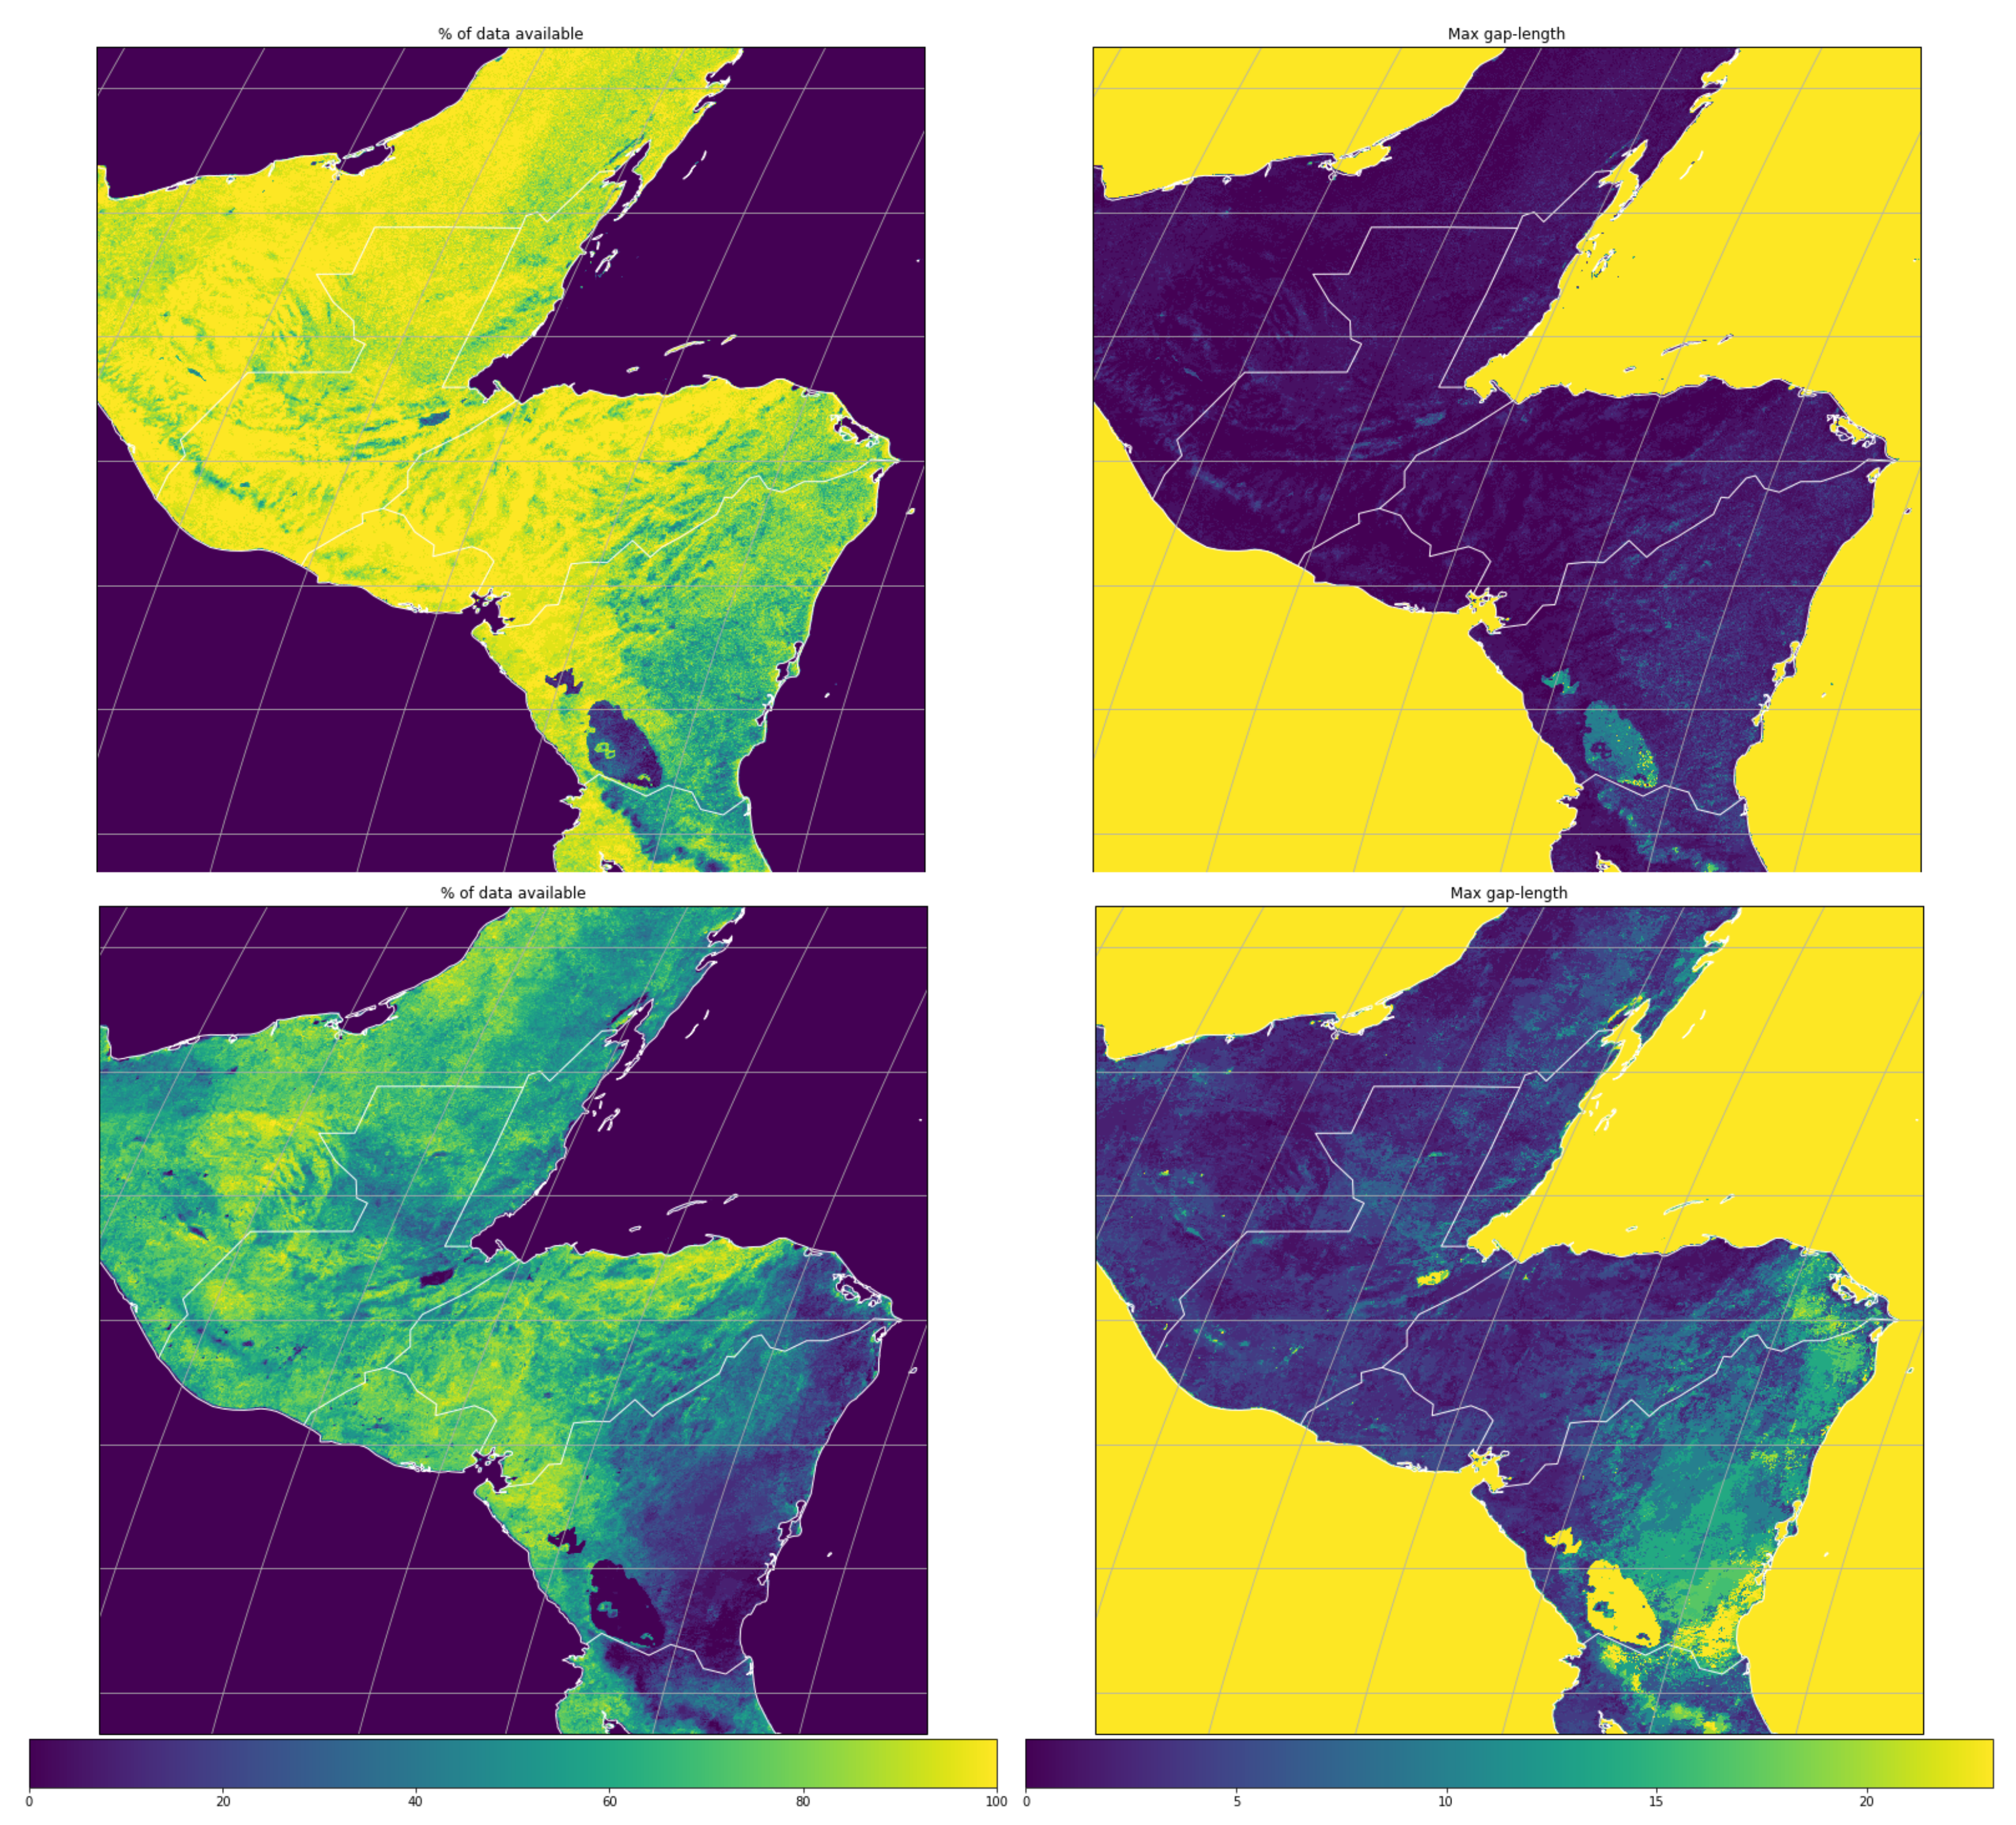
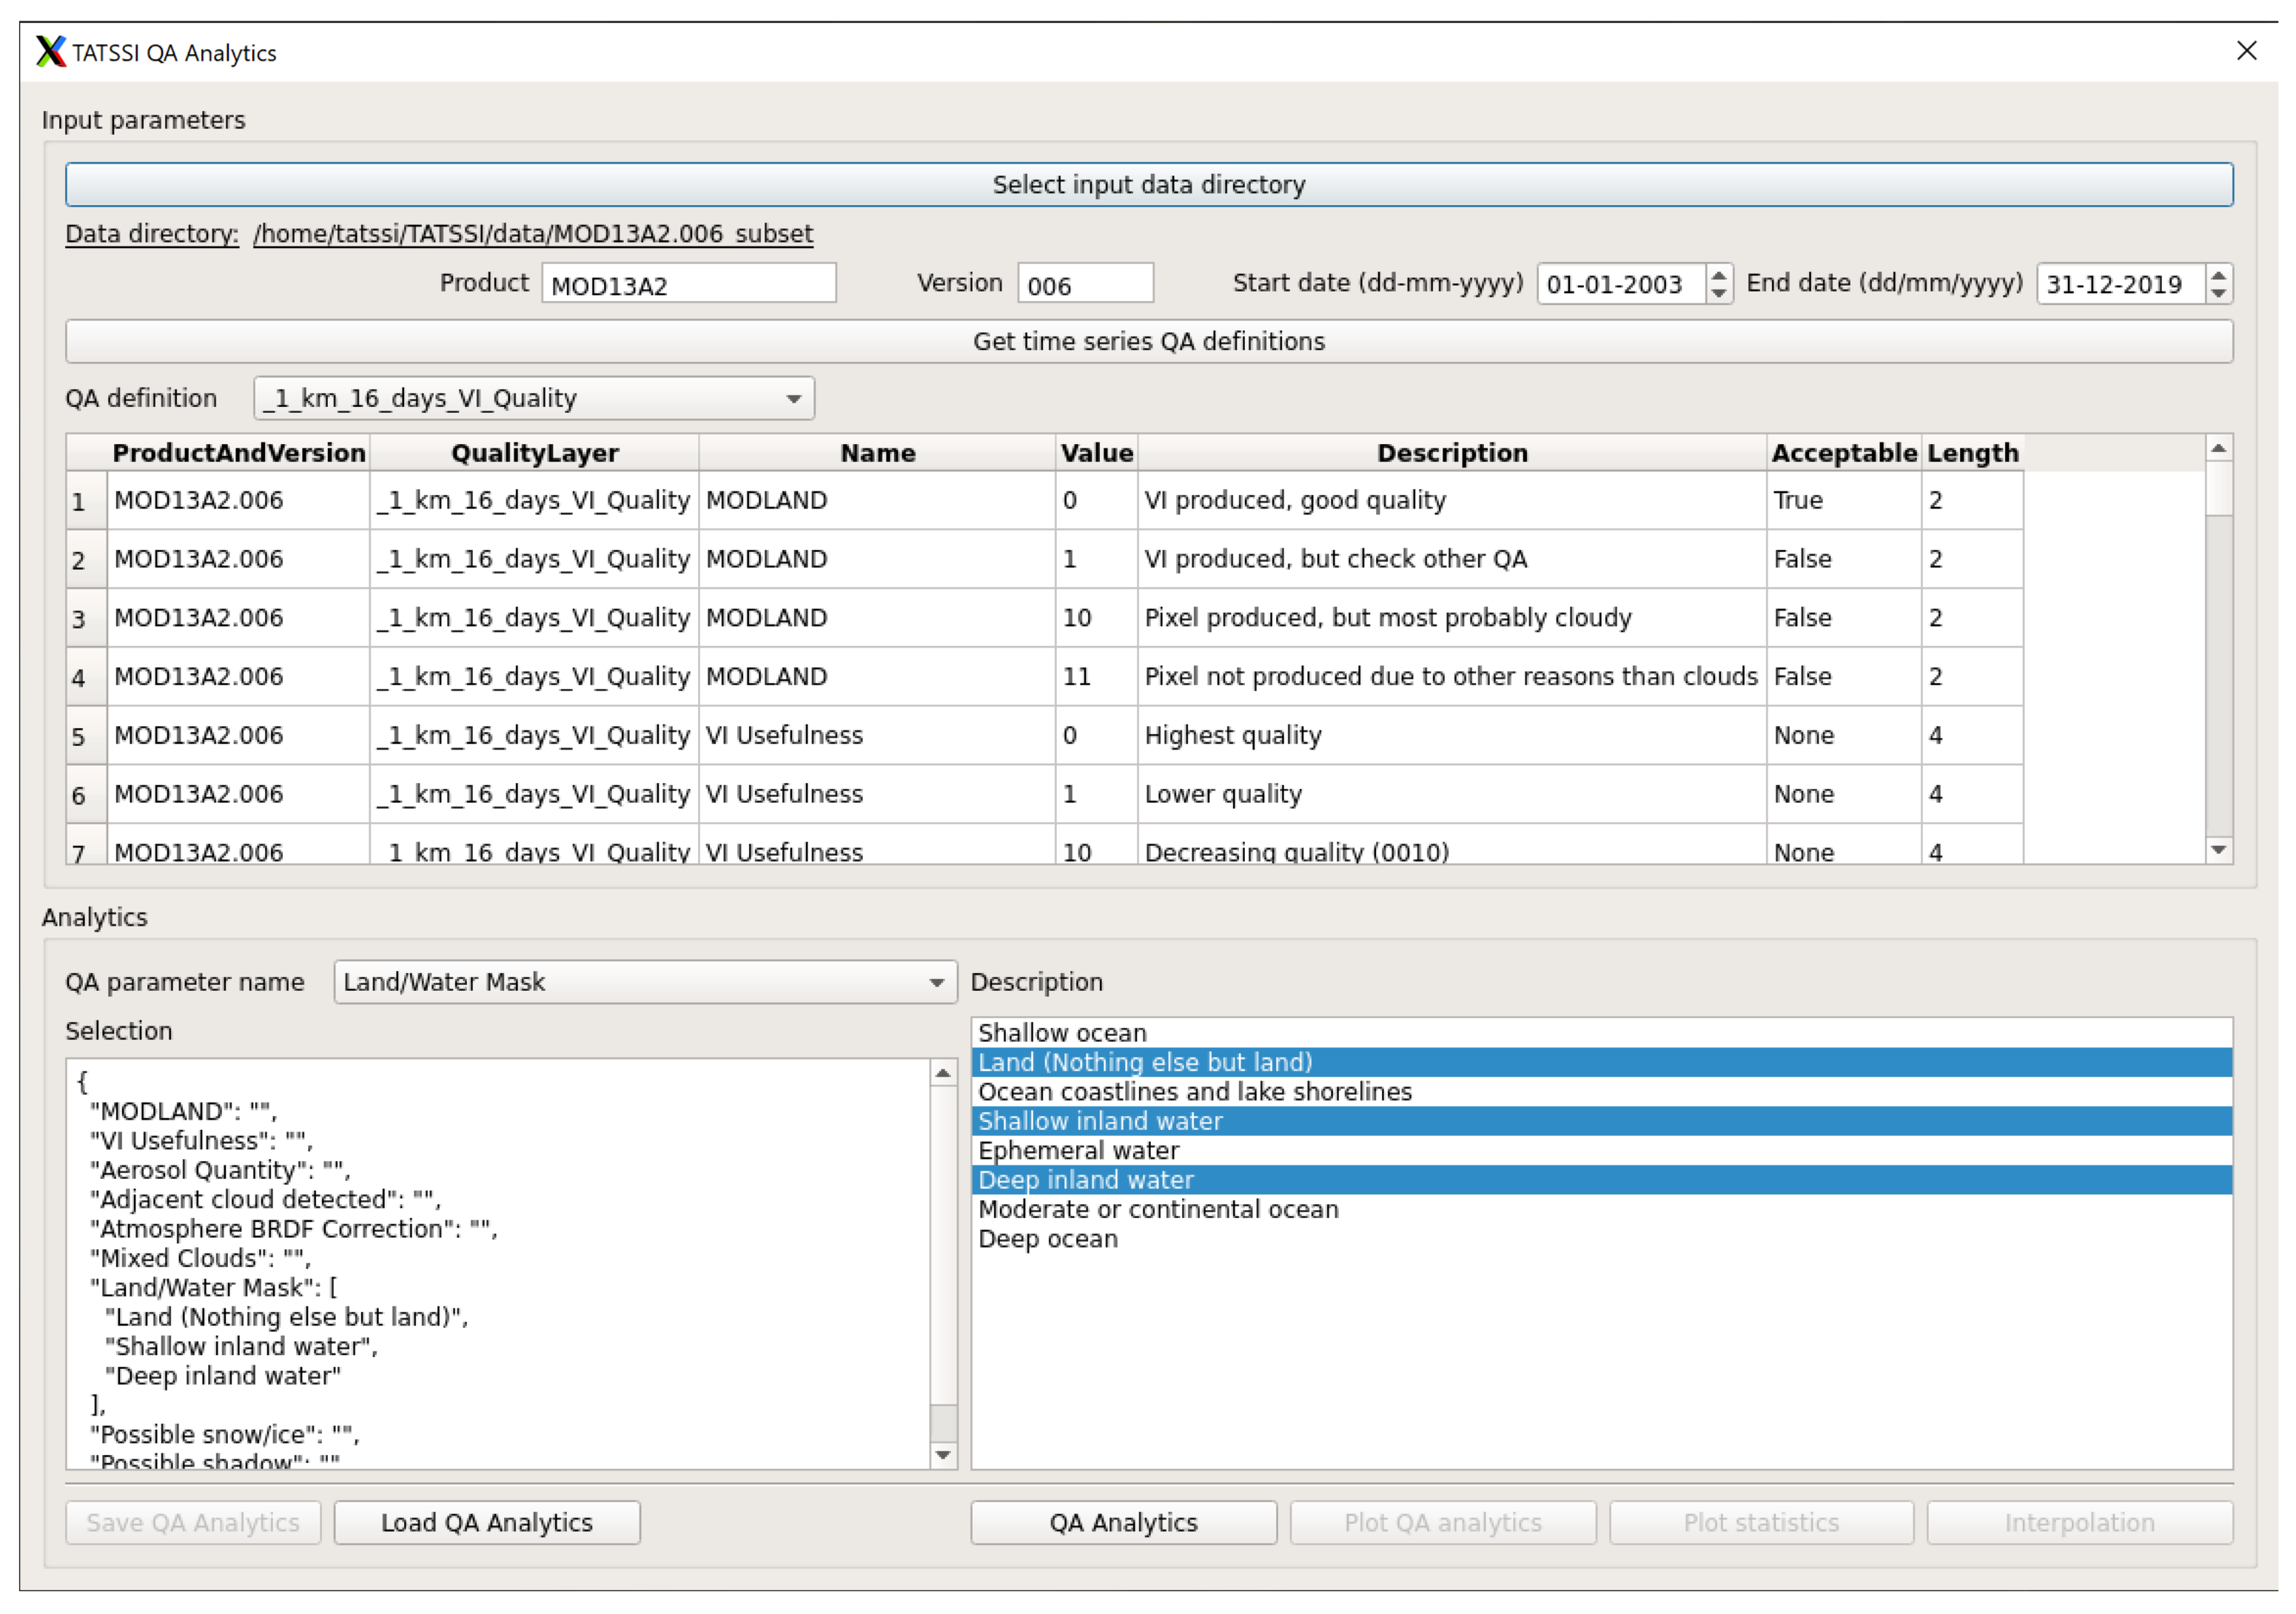
- Quality assessment and gap-filling. We followed the same QA/QC analysis procedure for IA and BAM using MOD13A2.006’s layer "1_km_16_days_pixel_reliability" with the "Good data, use with confidence" and "Marginal data, Useful, but look at other QA information" flags together. The use of these flags and layers was discussed in Section 2.3. For EMD, the MCD43A4’s quality layer has two flags; we applied the “Processed, good quality (full BRDF inversions)" layer with the TATSSI GUI Analytics module. After that, the percentage of data available in the time series (per pixel) ranged from 37 to 98%, and the maximum-gap length was between 5 and 153 observations. This lack of information was ameliorated by a subsequent temporal linear interpolation using the Interpolation submodule (within Analytics).
4. Methods
4.1. Interpolation
4.2. Standard Anomalies
4.3. Seasonal and Trend Decomposition of Time Series
4.4. Statistical Trend Analysis
4.5. Change-Point Analysis
4.6. Additional Methods for Any Exploratory Analysis of EO Time Series
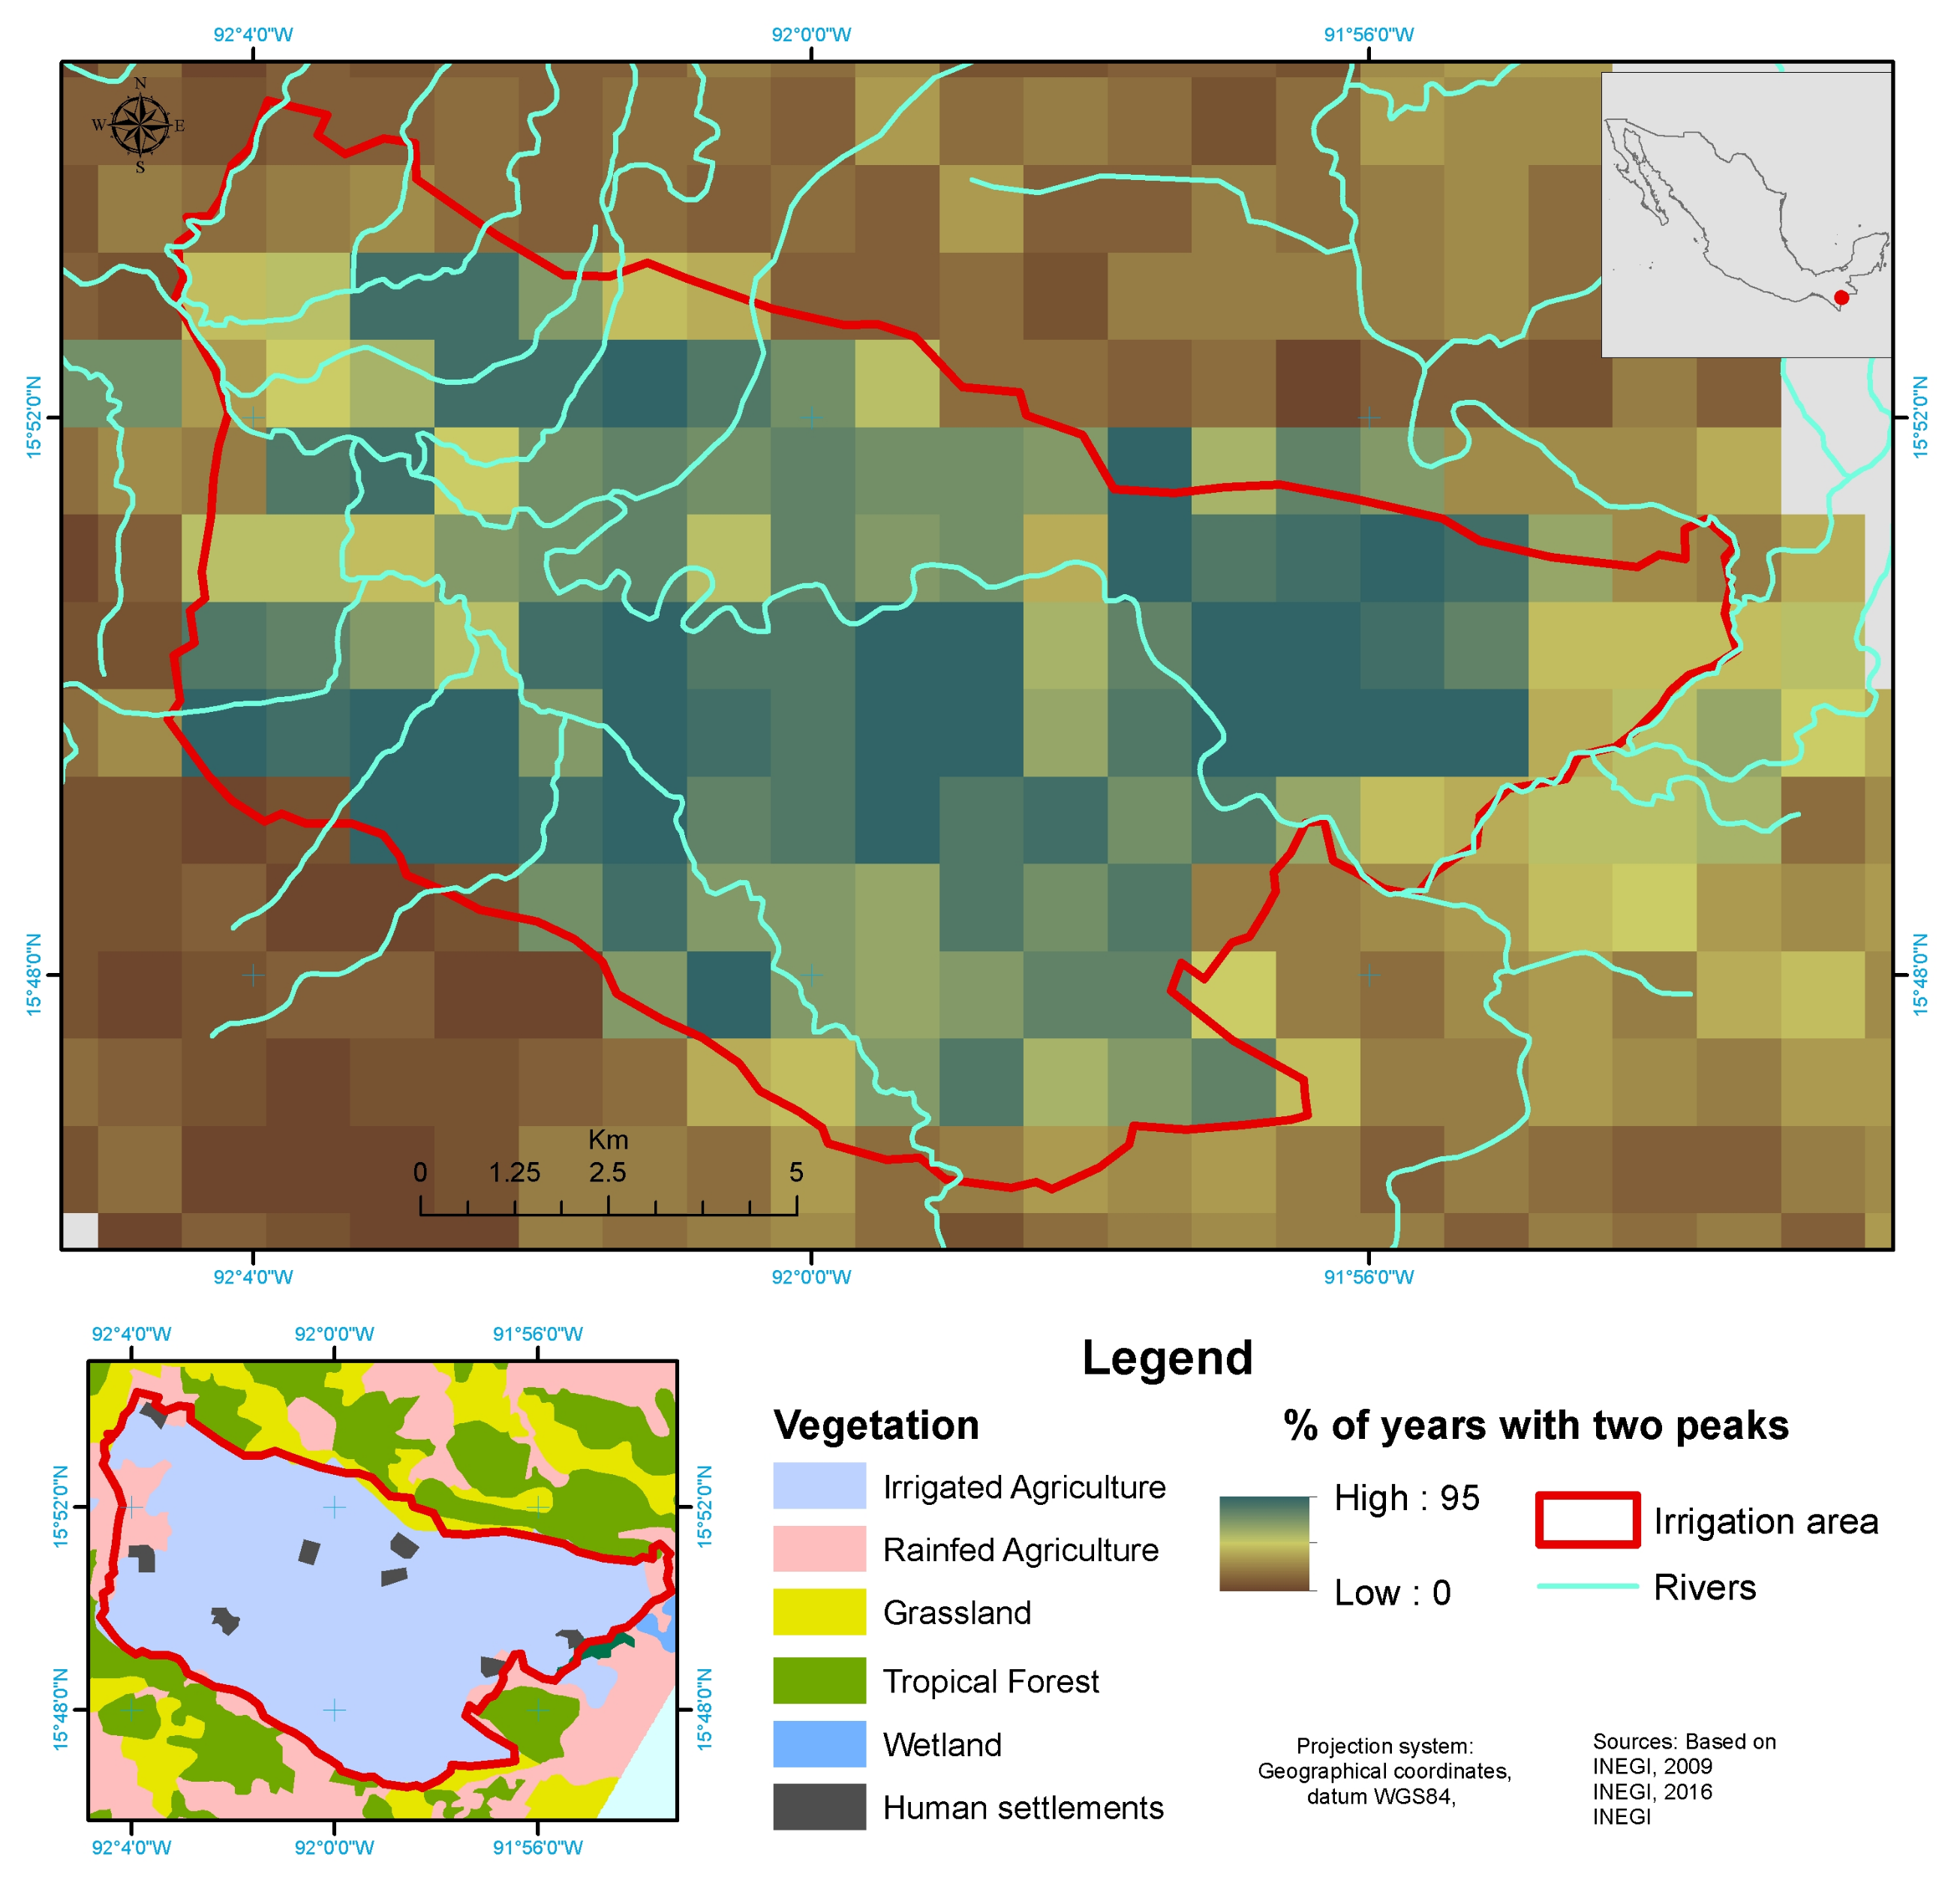
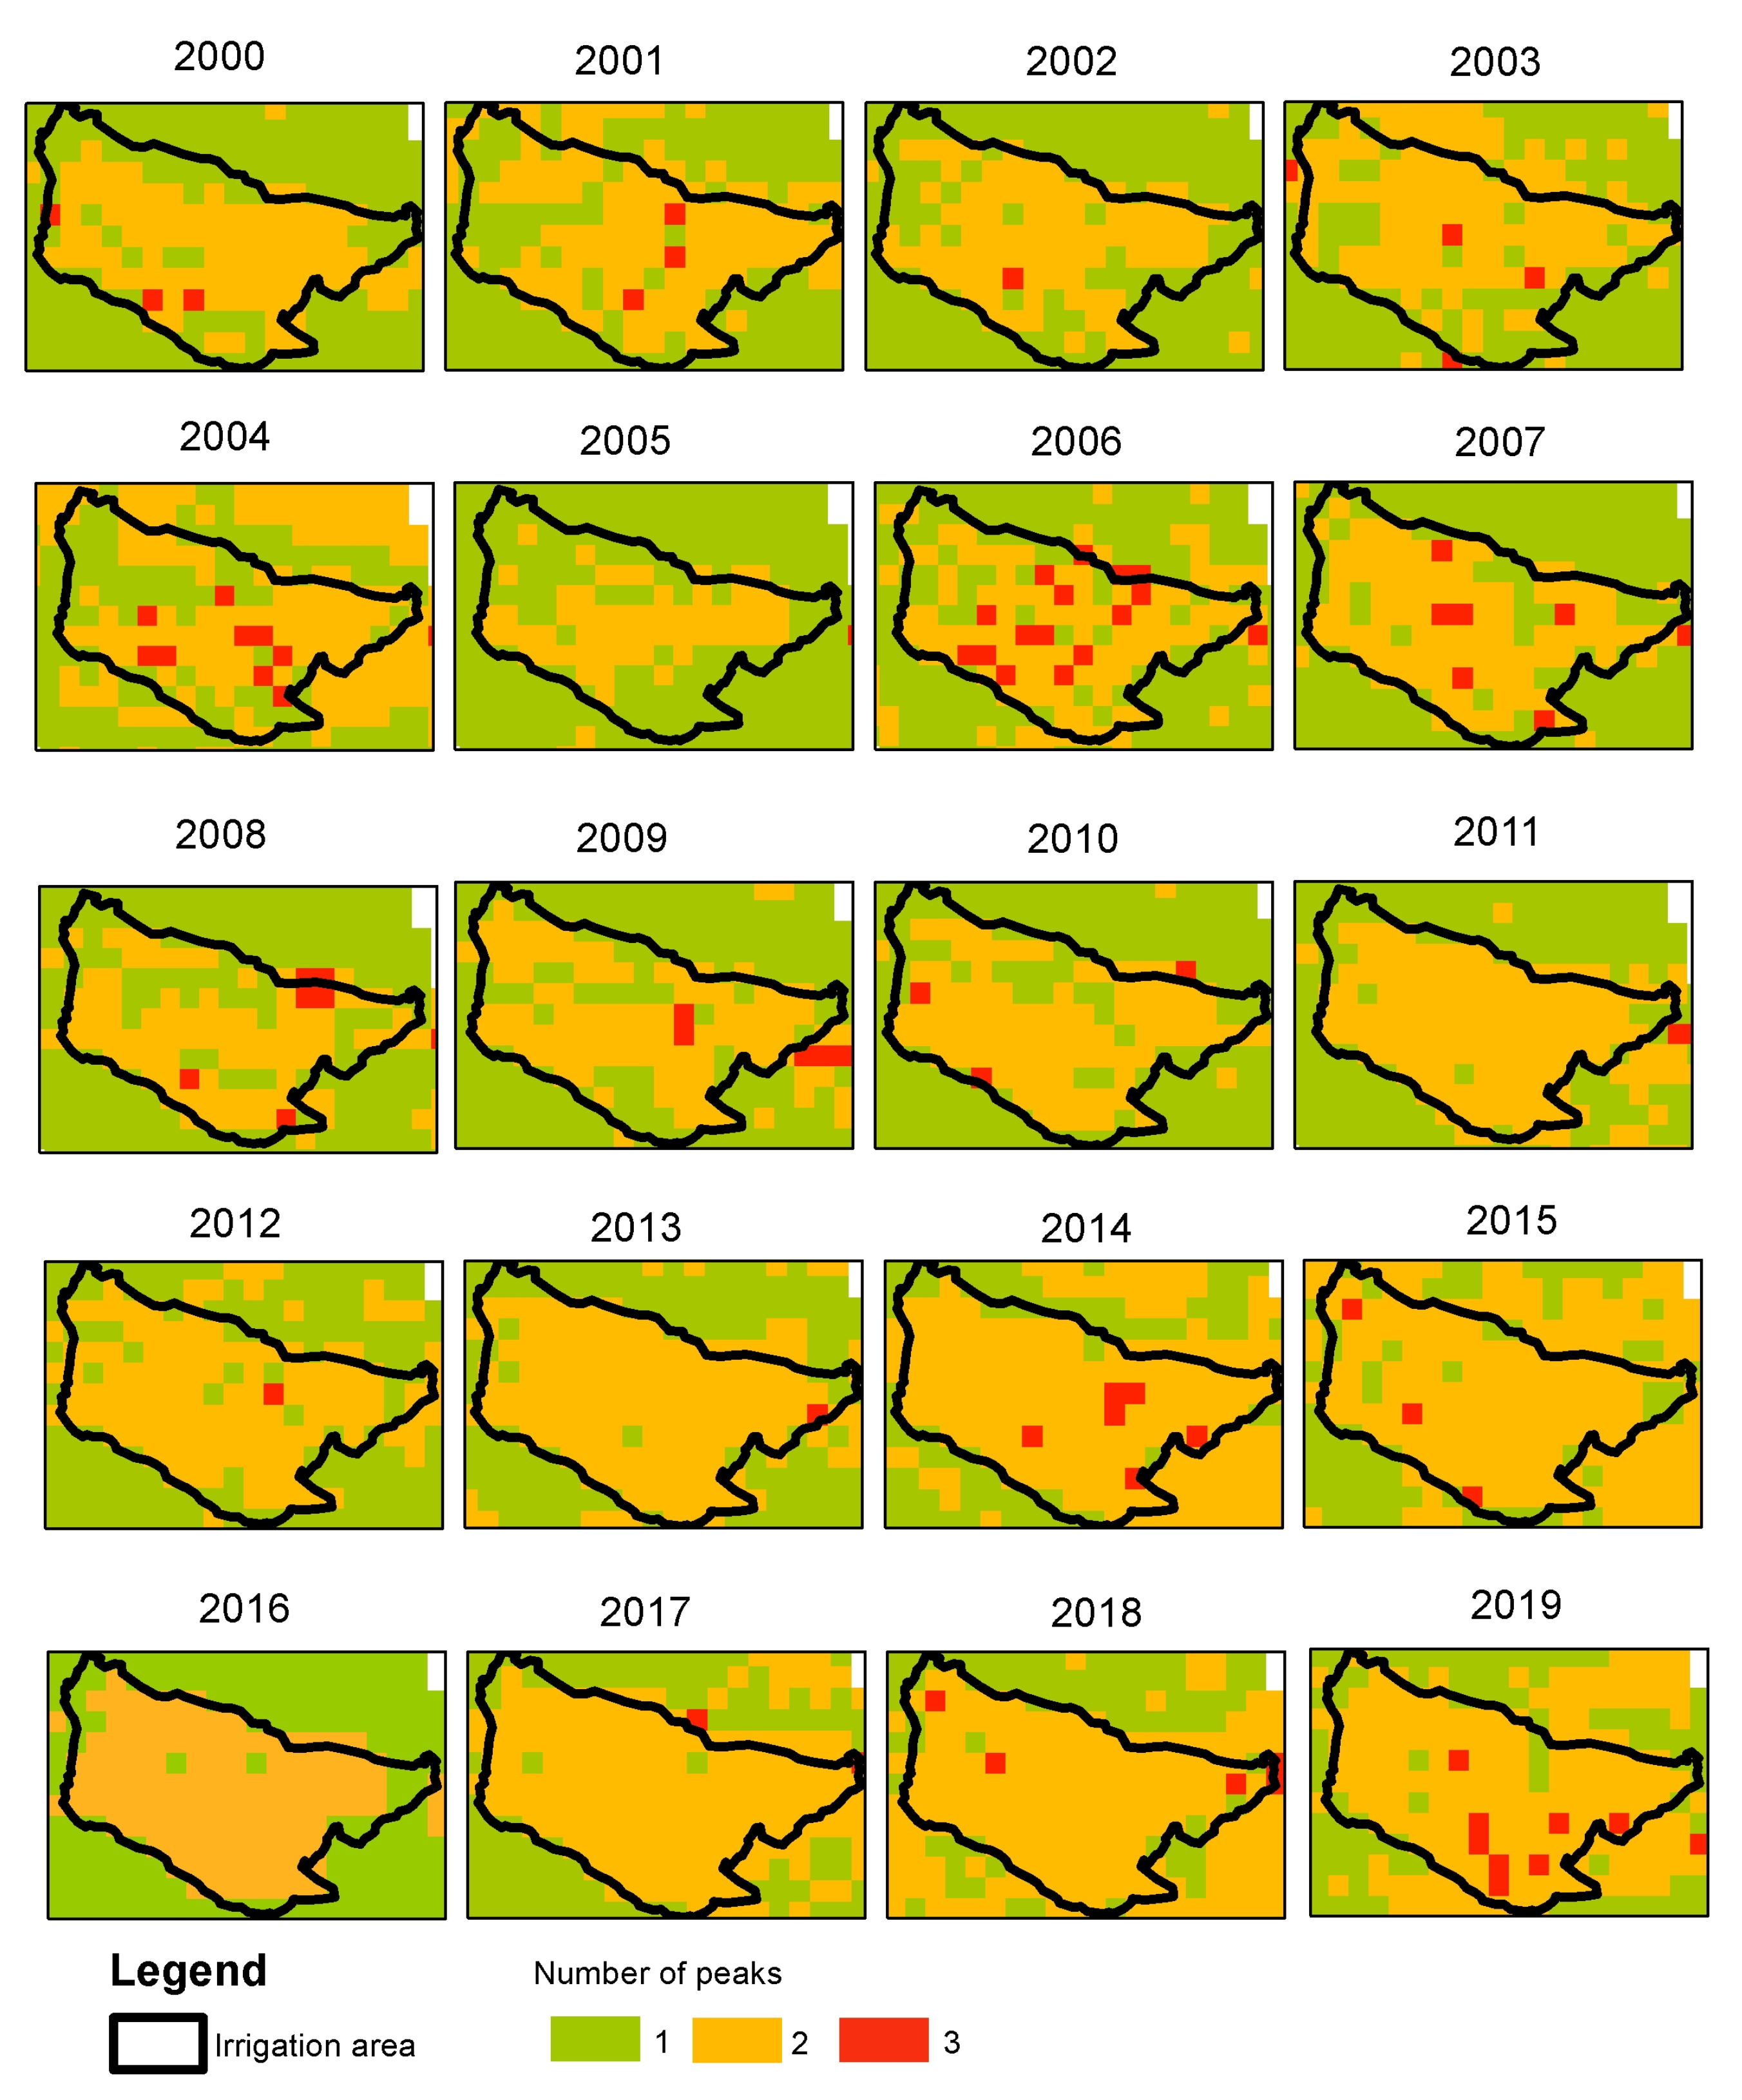
- Peaks and valleys. TATSSI’s Analysis module plots the original chosen time series along with its maxima and minima. We also refer to maxima and minima as peaks and valleys, respectively. These peaks and valleys can be exported as a multilayer stack. We analyzed the distribution of these peaks and valleys for our application of irrigation area changes.
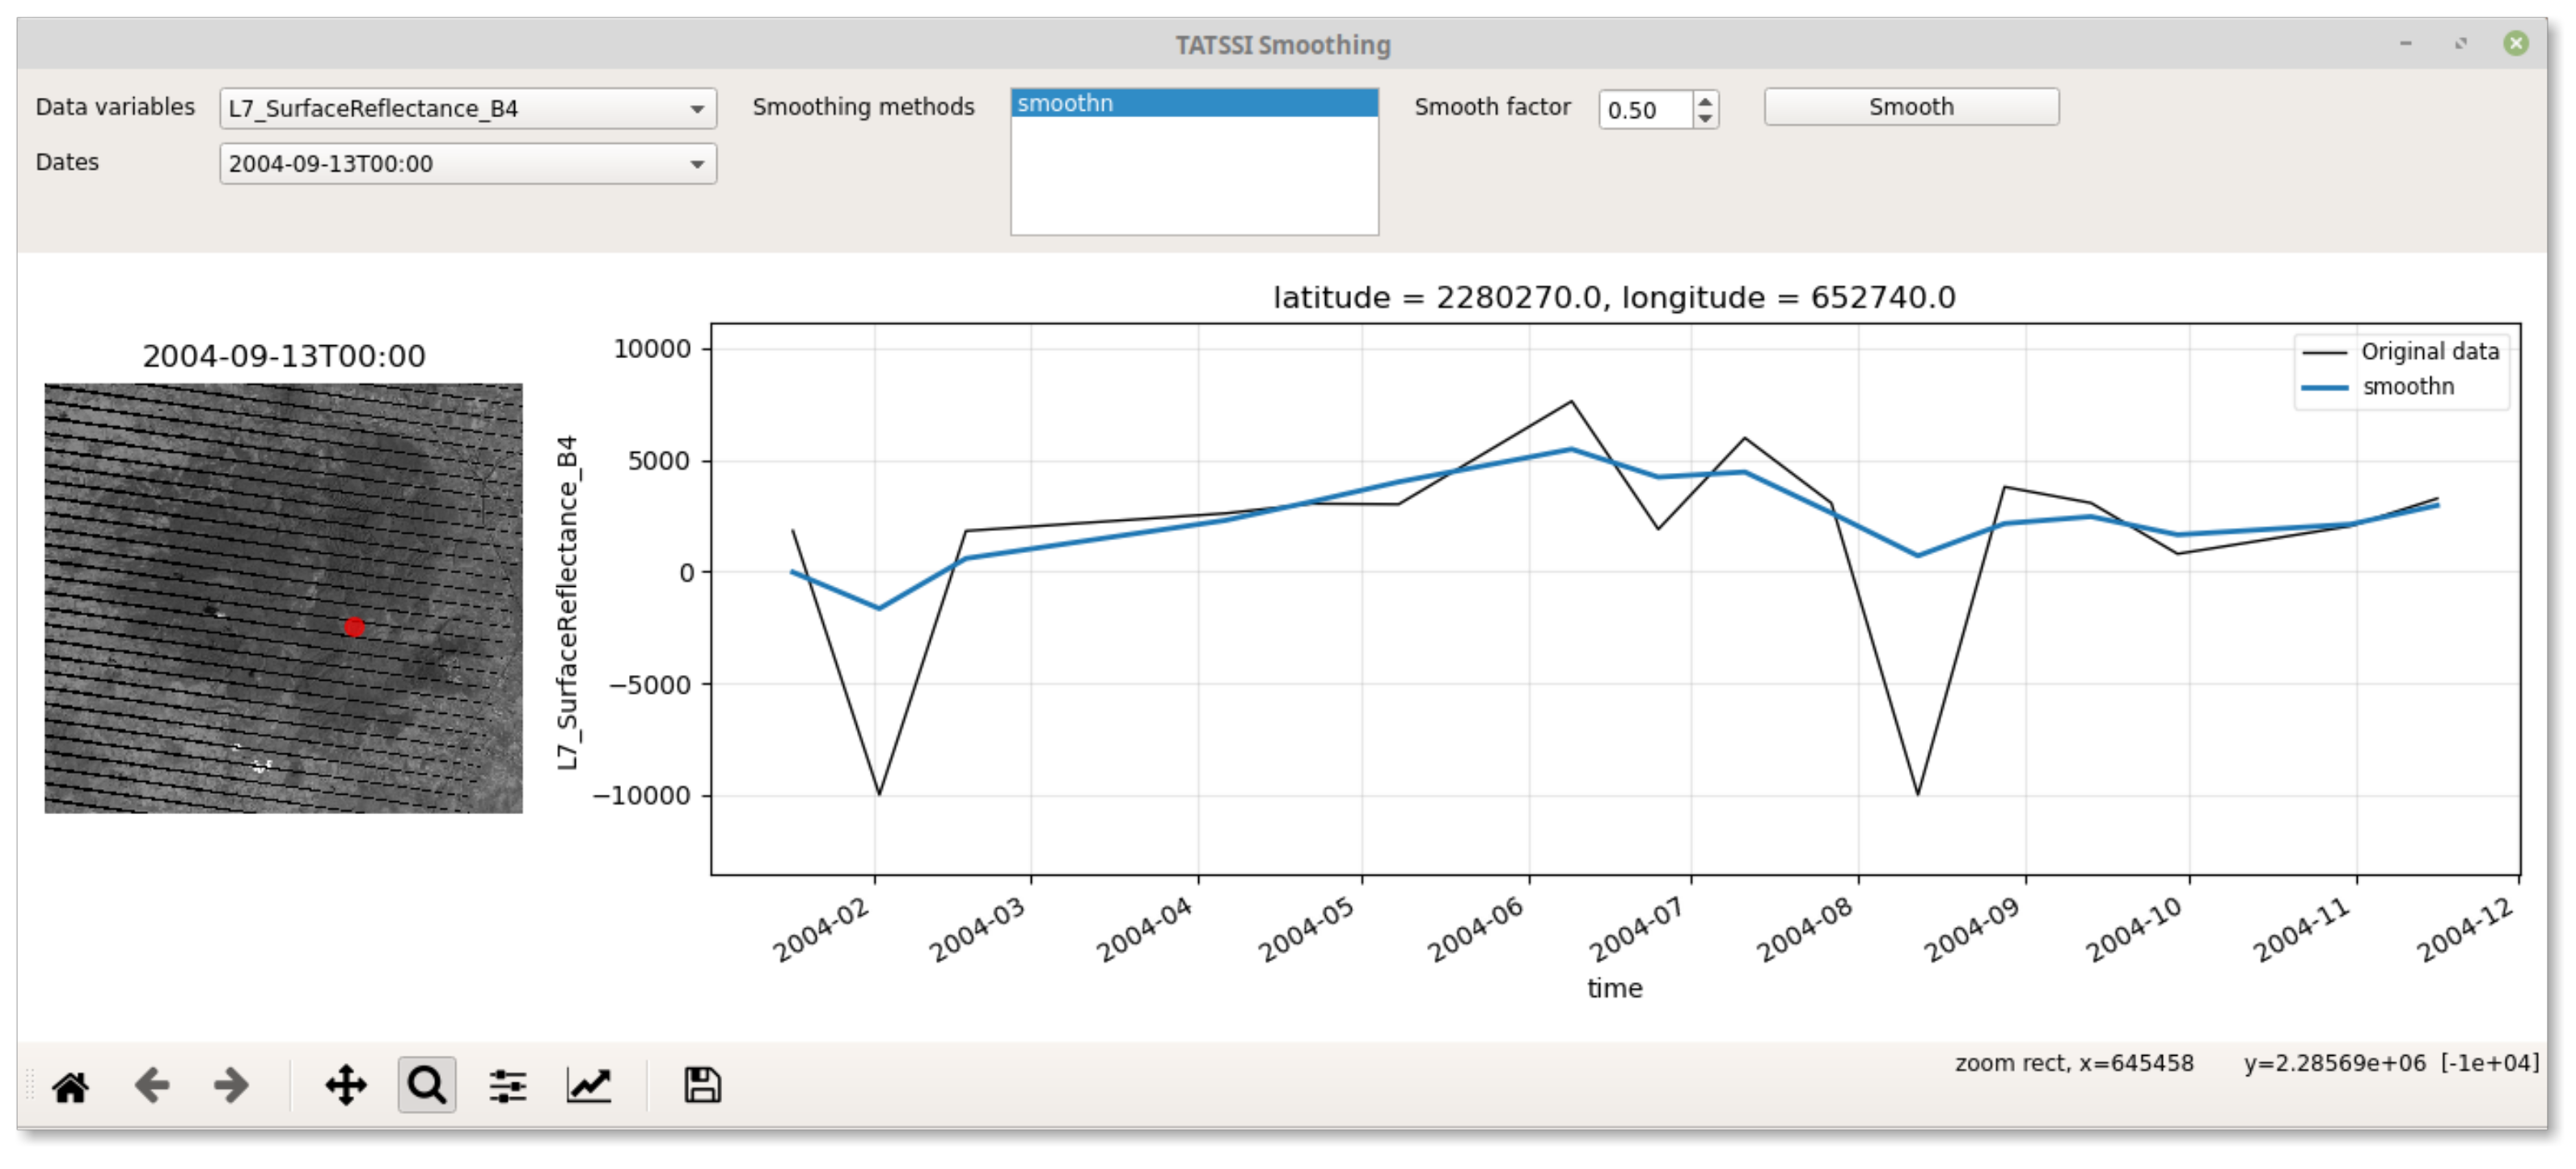
- Smoothing. When in need of a method to remove extra noise and extract an apparent regression signal, TATSSI’s Smoothing module can be used. As shown in Figure 7 this module is in the Time Series menu. This tool is an adaptation of Garcia’s [62] robust smoothing method for massive processing. For our application of irrigation area, before analyzing the distribution of peaks and valleys, we smoothed the EVI time series with a smooth factor of .
- Climatology curve. This curve can be found in a graphical panel of TATSSI’s GUI Analysis module. The user can easily appreciate a series of boxplots (one for each time-point within the time series) highlighting the minimum, 25% quantile, 50% quantile (also known as the median), 75% quantile and maximum of the distribution of the observations (across periods for each time-point). Layers of these statistics, along with layers of mean and standard deviation, can be exported as multilayer stacks.
5. Results
5.1. Distribution of Maximum per Year to Study Irrigation Area Changes
5.2. NDMI Trends in Marismas Nacionales
5.3. Vegetation Monitoring in the Burned Area of Coahuila
6. Conclusions
Author Contributions
Funding
Institutional Review Board Statement
Informed Consent Statement
Data Availability Statement
Acknowledgments
Conflicts of Interest
References
- Esaias, W.E.; Abbott, M.R.; Barton, I.; Brown, O.B.; Campbell, J.W.; Carder, K.L.; Clark, D.K.; Evans, R.H.; Hoge, F.E.; Gordon, H.R.; et al. An overview of MODIS capabilities for ocean science observations. IEEE Trans. Geosci. Remote Sens. 1998, 36, 1250–1265. [Google Scholar] [CrossRef]
- Justice, C.O.; Vermote, E.; Townshend, J.R.; Defries, R.; Roy, D.P.; Hall, D.K.; Salomonson, V.V.; Privette, J.L.; Riggs, G.; Strahler, A.; et al. The Moderate Resolution Imaging Spectroradiometer (MODIS): Land remote sensing for global change research. IEEE Trans. Geosci. Remote Sens. 1998, 36, 1228–1249. [Google Scholar] [CrossRef]
- Wan, Z.; Wang, P.; Li, X. Using MODIS land surface temperature and normalized difference vegetation index products for monitoring drought in the southern Great Plains, USA. Int. J. Remote Sens. 2004, 25, 61–72. [Google Scholar] [CrossRef]
- Du, L.; Tian, Q.; Yu, T.; Meng, Q.; Jancso, T.; Udvardy, P.; Huang, Y. A comprehensive drought monitoring method integrating MODIS and TRMM data. Int. J. Appl. Earth Obs. Geoinf. 2013, 23, 245–253. [Google Scholar] [CrossRef]
- Hu, C.; Müller-Karger, F.E.; Taylor, C.; Myhre, D.; Murch, B.; Odriozola, A.L.; Godoy, G. MODIS detects oil spills in Lake Maracaibo, Venezuela. Eos Trans. Am. Geophys. Union 2003, 84, 313–319. [Google Scholar] [CrossRef]
- Jin, M.; Dickinson, R.E.; Zhang, D. The footprint of urban areas on global climate as characterized by MODIS. J. Clim. 2005, 18, 1551–1565. [Google Scholar] [CrossRef]
- Chuvieco, E.; Opazo, S.; Sione, W.; Valle, H.d.; Anaya, J.; Bella, C.D.; Cruz, I.; Manzo, L.; López, G.; Mari, N.; et al. Global burned-land estimation in Latin America using MODIS composite data. Ecol. Appl. 2008, 18, 64–79. [Google Scholar] [CrossRef]
- Alonso-Canas, I.; Chuvieco, E. Global burned area mapping from ENVISAT-MERIS and MODIS active fire data. Remote Sens. Environ. 2015, 163, 140–152. [Google Scholar] [CrossRef]
- Ramo, R.; Chuvieco, E. Developing a random forest algorithm for MODIS global burned area classification. Remote Sens. 2017, 9, 1193. [Google Scholar] [CrossRef]
- Andela, N.; Morton, D.; Giglio, L.; Chen, Y.; Van Der Werf, G.; Kasibhatla, P.; DeFries, R.; Collatz, G.; Hantson, S.; Kloster, S.; et al. A human-driven decline in global burned area. Science 2017, 356, 1356–1362. [Google Scholar] [CrossRef]
- Xiong, X.; Butler, J.J. MODIS and VIIRS Calibration History and Future Outlook. Remote Sens. 2020, 12, 2523. [Google Scholar] [CrossRef]
- Zhang, X.; Jayavelu, S.; Liu, L.; Friedl, M.A.; Henebry, G.M.; Liu, Y.; Schaaf, C.B.; Richardson, A.D.; Gray, J. Evaluation of land surface phenology from VIIRS data using time series of PhenoCam imagery. Agric. For. Meteorol. 2018, 256, 137–149. [Google Scholar] [CrossRef]
- Shi, K.; Yu, B.; Huang, Y.; Hu, Y.; Yin, B.; Chen, Z.; Chen, L.; Wu, J. Evaluating the ability of NPP-VIIRS nighttime light data to estimate the gross domestic product and the electric power consumption of China at multiple scales: A comparison with DMSP-OLS data. Remote Sens. 2014, 6, 1705–1724. [Google Scholar] [CrossRef]
- Ardanuy, P.E.; Schueler, C.F.; Miller, S.W.; Kealy, P.M.; Cota, S.A.; Haas, M.; Welsch, C. NPOESS VIIRS design process. In Proceedings of the Earth Observing Systems VI, International Society for Optics and Photonics, San Diego, CA, USA, 29 July–3 August 2001; Volume 4483, pp. 24–34. [Google Scholar]
- Schueler, C.F.; Clement, J.E.; Ardanuy, P.E.; Welsch, C.; DeLuccia, F.; Swenson, H. NPOESS VIIRS sensor design overview. In Proceedings of the Earth Observing Systems VI, International Society for Optics and Photonics, San Diego, CA, USA, 29 July–3 August 2001; Volume 4483, pp. 11–23. [Google Scholar]
- Lee, T.F.; Miller, S.D.; Schueler, C.; Miller, S. NASA MODIS Previews NPOESS VIIRS Capabilities. Weather Forecast. 2006, 21, 649–655. [Google Scholar] [CrossRef]
- Masek, J.G.; Vermote, E.F.; Saleous, N.E.; Wolfe, R.; Hall, F.G.; Huemmrich, K.F.; Gao, F.; Kutler, J.; Lim, T.K. A Landsat surface reflectance dataset for North America, 1990–2000. IEEE Geosci. Remote Sens. Lett. 2006, 3, 68–72. [Google Scholar] [CrossRef]
- Gupta, P.; Remer, L.A.; Patadia, F.; Levy, R.C.; Christopher, S.A. High-Resolution Gridded Level 3 Aerosol Optical Depth Data from MODIS. Remote Sens. 2020, 12, 2847. [Google Scholar] [CrossRef]
- Udelhoven, T. TimeStats: A software tool for the retrieval of temporal patterns from global satellite archives. IEEE J. Sel. Top. Appl. Earth Obs. Remote Sens. 2010, 4, 310–317. [Google Scholar] [CrossRef]
- Jönsson, P.; Eklundh, L. TIMESAT—A program for analyzing time-series of satellite sensor data. Comput. Geosci. 2004, 30, 833–845. [Google Scholar] [CrossRef]
- Leutner, B.; Horning, N.; Schwalb-Willmann, J. RStoolbox: Tools for Remote Sensing Data Analysis; R Package Version 0.2.6; 2019; Available online: https://cran.r-project.org/web/packages/RStoolbox/index.html (accessed on 16 April 2021).
- Roussel, J.R.; Auty, D.; Coops, N.C.; Tompalski, P.; Goodbody, T.R.; Meador, A.S.; Bourdon, J.F.; de Boissieu, F.; Achim, A. lidR: An R package for analysis of Airborne Laser Scanning (ALS) data. Remote Sens. Environ. 2020, 251, 112061. [Google Scholar] [CrossRef]
- Ferrán, Á.; Bernabé, S.; Rodríguez, P.G.; Plaza, A. A web-based system for classification of remote sensing data. IEEE J. Sel. Top. Appl. Earth Obs. Remote Sens. 2012, 6, 1934–1948. [Google Scholar] [CrossRef]
- Gorelick, N.; Hancher, M.; Dixon, M.; Ilyushchenko, S.; Thau, D.; Moore, R. Google Earth Engine: Planetary-scale geospatial analysis for everyone. Remote Sens. Environ. 2017. [Google Scholar] [CrossRef]
- Schaaf, C.B.; Wang, Z.; Strahler, A.H. Commentary on Wang and Zender—MODIS snow albedo bias at high solar zenith angles relative to theory and to in situ observations in Greenland. Remote Sens. Environ. 2011, 115, 1296–1300. [Google Scholar] [CrossRef]
- Colditz, R.R.; Conrad, C.; Wehrmann, T.; Schmidt, M.; Dech, S. TiSeG: A flexible software tool for time-series generation of MODIS data utilizing the quality assessment science data set. IEEE Trans. Geosci. Remote Sens. 2008, 46, 3296–3308. [Google Scholar] [CrossRef]
- Busetto, L.; Ranghetti, L. MODIStsp: An R package for automatic preprocessing of MODIS Land Products time series. Comput. Geosci. 2016, 97, 40–48. [Google Scholar] [CrossRef]
- R Core Team. R: A Language and Environment for Statistical Computing; R Foundation for Statistical Computing: Vienna, Austria, 2020. [Google Scholar]
- Militino, A.F.; Montesino-SanMartin, M.; Pérez-Goya, U.; Ugarte, M.D. Using RGISTools to Estimate Water Levels in Reservoirs and Lakes. Remote Sens. 2020, 12, 1934. [Google Scholar] [CrossRef]
- GDAL/OGR Contributors. GDAL/OGR Geospatial Data Abstraction Software Library; Open Source Geospatial Foundation: Chicago, IL, USA, 2020. [Google Scholar]
- Zambelli, P.; Gebbert, S.; Ciolli, M. Pygrass: An object oriented python application programming interface (API) for geographic resources analysis support system (GRASS) geographic information system (GIS). ISPRS Int. J. Geo Inf. 2013, 2, 201–219. [Google Scholar] [CrossRef]
- Rey, S.J.; Anselin, L.; Li, X.; Pahle, R.; Laura, J.; Li, W.; Koschinsky, J. Open geospatial analytics with PySAL. ISPRS Int. J. Geo Inf. 2015, 4, 815–836. [Google Scholar] [CrossRef]
- Rajabifard, A.; Williamson, I.P. Spatial data infrastructures: Concept, SDI hierarchy and future directions. In Proceedings of the GEOMATICS’80 Conference, Proceedings Geomatics, Tehran, Iran, 29 May–2 April 2001. [Google Scholar]
- Gomes, V.C.; Queiroz, G.R.; Ferreira, K.R. An overview of platforms for big earth observation data management and analysis. Remote Sens. 2020, 12, 1253. [Google Scholar] [CrossRef]
- Dask Development Team. Dask: Library for Dynamic Task Scheduling. 2016. Available online: https://docs.dask.org/en/latest/cite.html (accessed on 15 January 2021).
- Team, A. Application for Extracting and Exploring Analysis Ready Samples (AρρEEARS); NASA EOSDIS LP DAAC, USGS/Earth Resources Observation and Science (EROS): Sioux Falls, SD, USA, 2020. [Google Scholar]
- Lewis, P.; Guanter, L.; Lopez Saldana, G.; Muller, J.; Watson, G.; Shane, N.; Kennedy, T.; Fisher, J.; Domenech, C.; Preusker, R.; et al. The ESA globAlbedo Project: Algorithm. In Proceedings of the 2012 IEEE International Geoscience and Remote Sensing Symposium, Munich, Germany, 22–27 July 2012. [Google Scholar] [CrossRef]
- Roy, D.P.; Borak, J.S.; Devadiga, S.; Wolfe, R.E.; Zheng, M.; Descloitres, J. The MODIS Land product quality assessment approach. Remote Sens. Environ. 2002, 83, 62–76. [Google Scholar] [CrossRef]
- Hunter, J.D. Matplotlib: A 2D graphics environment. Comput. Sci. Eng. 2007, 9, 90–95. [Google Scholar] [CrossRef]
- Kluyver, T.; Ragan-Kelley, B.; Pérez, F.; Granger, B.; Bussonnier, M.; Frederic, J.; Kelley, K.; Hamrick, J.; Grout, J.; Corlay, S.; et al. Jupyter Notebooks—A publishing format for reproducible computational workflows. In Positioning and Power in Academic Publishing: Players, Agents and Agendas; Loizides, F., Schmidt, B., Eds.; IOS Press: Amsterdam, The Netherlands, 2016; pp. 87–90. [Google Scholar]
- Hoyer, S.; Fitzgerald, C.; Hamman, J.; Akleeman; Kluyver, T.; Roos, M.; Helmus, J.J.; Cable, M.P.; Maussion, F.; Miles, A.; et al. xarray: v0.8.0. 2016. Available online: https://zenodo.org/record/59499#.YHlZlj8RVPY (accessed on 16 April 2021). [CrossRef]
- Harris, C.R.; Millman, K.J.; van der Walt, S.J.; Gommers, R.; Virtanen, P.; Cournapeau, D.; Wieser, E.; Taylor, J.; Berg, S.; Smith, N.J.; et al. Array programming with NumPy. Nature 2020, 585, 357–362. [Google Scholar] [CrossRef]
- Huete, A.; Justice, C.; Liu, H. Development of vegetation and soil indices for MODIS-EOS. Remote Sens. Environ. 1994, 49, 224–234. [Google Scholar] [CrossRef]
- Mitsch, W.J.; Bernal, B.; Hernandez, M.E. Ecosystem services of wetlands. Int. J. Biodivers. Sci. Ecosyst. Serv. Manag. 2015, 11. [Google Scholar] [CrossRef]
- Keddy, P.A.; Fraser, L.H.; Solomeshch, A.I.; Junk, W.J.; Campbell, D.R.; Arroyo, M.T.; Alho, C.J. Wet and wonderful: The world’s largest wetlands are conservation priorities. BioScience 2009, 59, 39–51. [Google Scholar] [CrossRef]
- Junk, W.J.; An, S.; Finlayson, C.; Gopal, B.; Květ, J.; Mitchell, S.A.; Mitsch, W.J.; Robarts, R.D. Current state of knowledge regarding the world’s wetlands and their future under global climate change: A synthesis. Aquat. Sci. 2013, 75, 151–167. [Google Scholar] [CrossRef]
- Weise, K.; Höfer, R.; Franke, J.; Guelmami, A.; Simonson, W.; Muro, J.; O’Connor, B.; Strauch, A.; Flink, S.; Eberle, J.; et al. Wetland extent tools for SDG 6.6. 1 reporting from the Satellite-based Wetland Observation Service (SWOS). Remote Sens. Environ. 2020, 247, 111892. [Google Scholar] [CrossRef]
- Acreman, M.; Holden, J. How wetlands affect floods. Wetlands 2013, 33, 773–786. [Google Scholar] [CrossRef]
- Valderrama-Landeros, L.; Rodríguez-Zúñiga, M.; Troche-Souza, C.; Velázquez-Salazar, S.; Villeda-Chávez, E.; Alcántara-Maya, J.; Vázquez-Balderas, B.; Cruz-López, M.; Ressl, R. Manglares de México: Actualización y Exploración de los Datos del Sistema de Monitoreo 1970/1980–2015; Comisión Nacional para el Conocimiento y Uso de la Biodiversidad: Ciudad de México, Mexico, 2017. [Google Scholar]
- Blanco, M.; Flores-Verdugo, F.; Ortiz-Pérez, M.; De la Lanza, G.; López-Portillo, J.; Valdéz-Hernández, I.; Agraz-Hernández, C.; Czitrom, S.; Rivera-Arriaga, E.; Orozco, A.; et al. Diagnóstico Funcional de Marismas Nacionales (Informe Final); Universidad Autónoma de Nayarit-Comisión Nacional Forestal-DEFRA UK: Nayarit, Mexico, 2011. [Google Scholar]
- Cruz-López, M.; López-Saldaña, G. Evaluación de áreas afectadas por incendios forestales. In XIX Reunión Nacional SELPER-México; Mas, J.F., Cuevas-García, G., Eds.; UNAM—CIGA: Morelia, Michoacán, 2011; pp. 149–153. [Google Scholar]
- Wilson, E.H.; Sader, S.A. Detection of forest harvest type using multiple dates of Landsat TM imagery. Remote Sens. Environ. 2002, 80, 385–396. [Google Scholar] [CrossRef]
- Cruz-López, M.; López-Saldaña, G. Assessment of affected areas by forest fires in Mexico. In Advances in Remote Sensing and GIS Applications in Forest Fire Management From Local to Global Assessments; San Miguel, J., Camia, A., Santos de, O.S., Gitas, I., Eds.; Publications Office of the European Union: Luxembourg, 2011; p. 81. [Google Scholar]
- Cruz-López, M.I. Monitoring of areas affected by forest megafires. In Proceedings of the 9thEARSeL Forest Fire Special Interest Group Workshop. European Association of Remote Sensing Laboratories, Warwickshire, UK, 15–17 October 2013; Volume 4483, pp. 2–5. [Google Scholar]
- Kennedy, R.E.; Yang, Z.; Cohen, W.B. Detecting trends in forest disturbance and recovery using yearly Landsat time series: 1. LandTrendr—Temporal segmentation algorithms. Remote Sens. Environ. 2010, 114, 2897–2910. [Google Scholar] [CrossRef]
- Brockwell, P.J.; Davis, R.A. Introduction to Time Series and Forecasting; Springer: Berlin/Heidelberg, Germany, 2016. [Google Scholar]
- Mann, H.B. Nonparametric tests against trend. Econom. J. Econom. Soc. 1945, 13, 245–259. [Google Scholar] [CrossRef]
- Kendall, M.G. Rank Correlation Methods, 4th ed.; Griffin: Lewiston, ID, USA, 1962. [Google Scholar]
- Killick, R.; Eckley, I. changepoint: An R package for changepoint analysis. J. Stat. Softw. 2014, 58, 1–19. [Google Scholar] [CrossRef]
- Menini, N.; Almeida, A.E.; Lamparelli, R.; Le Maire, G.; Oliveira, R.S.; Verbesselt, J.; Hirota, M.; Torres, R.D.S. Tucumã: A toolbox for spatiotemporal remote sensing image analysis [Software and Data Sets]. IEEE Geosci. Remote Sens. Mag. 2019, 7, 110–122. [Google Scholar] [CrossRef]
- Killick, R.; Fearnhead, P.; Eckley, I.A. Optimal detection of changepoints with a linear computational cost. J. Am. Stat. Assoc. 2012, 107, 1590–1598. [Google Scholar] [CrossRef]
- Garcia, D. Robust smoothing of gridded data in one and higher dimensions with missing values. Comput. Stat. Data Anal. 2010, 54, 1167–1178. [Google Scholar] [CrossRef]
- Verbesselt, J.; Hyndman, R.; Newnham, G.; Culvenor, D. Detecting trend and seasonal changes in satellite image time series. Remote Sens. Environ. 2010, 114, 106–115. [Google Scholar] [CrossRef]
| Bit Word | Decoded Value | Meaning |
|---|---|---|
| 00 | 1 | VI produced, good quality |
| 01 | 2 | VI produced, but check other QA |
| 10 | 3 | Pixel produced, but most probably cloudy |
| 11 | 4 | Pixel not produced due to other reasons than clouds |
Publisher’s Note: MDPI stays neutral with regard to jurisdictional claims in published maps and institutional affiliations. |
© 2021 by the authors. Licensee MDPI, Basel, Switzerland. This article is an open access article distributed under the terms and conditions of the Creative Commons Attribution (CC BY) license (https://creativecommons.org/licenses/by/4.0/).
Share and Cite
Tecuapetla-Gómez, I.; López-Saldaña, G.; Cruz-López, M.I.; Ressl, R. TATSSI: A Free and Open-Source Platform for Analyzing Earth Observation Products with Quality Data Assessment. ISPRS Int. J. Geo-Inf. 2021, 10, 267. https://doi.org/10.3390/ijgi10040267
Tecuapetla-Gómez I, López-Saldaña G, Cruz-López MI, Ressl R. TATSSI: A Free and Open-Source Platform for Analyzing Earth Observation Products with Quality Data Assessment. ISPRS International Journal of Geo-Information. 2021; 10(4):267. https://doi.org/10.3390/ijgi10040267
Chicago/Turabian StyleTecuapetla-Gómez, Inder, Gerardo López-Saldaña, María Isabel Cruz-López, and Rainer Ressl. 2021. "TATSSI: A Free and Open-Source Platform for Analyzing Earth Observation Products with Quality Data Assessment" ISPRS International Journal of Geo-Information 10, no. 4: 267. https://doi.org/10.3390/ijgi10040267
APA StyleTecuapetla-Gómez, I., López-Saldaña, G., Cruz-López, M. I., & Ressl, R. (2021). TATSSI: A Free and Open-Source Platform for Analyzing Earth Observation Products with Quality Data Assessment. ISPRS International Journal of Geo-Information, 10(4), 267. https://doi.org/10.3390/ijgi10040267


