
Determination of Environmental Factors for the Implementation of the Exploitability Index in Industrial Aggregate Mining Using Multi-Criteria Analysis


 and
and 
Abstract
1. Introduction
2. Materials and Methods
2.1. Traditional Exploitability Indexes
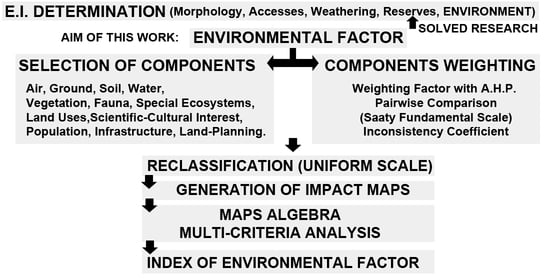
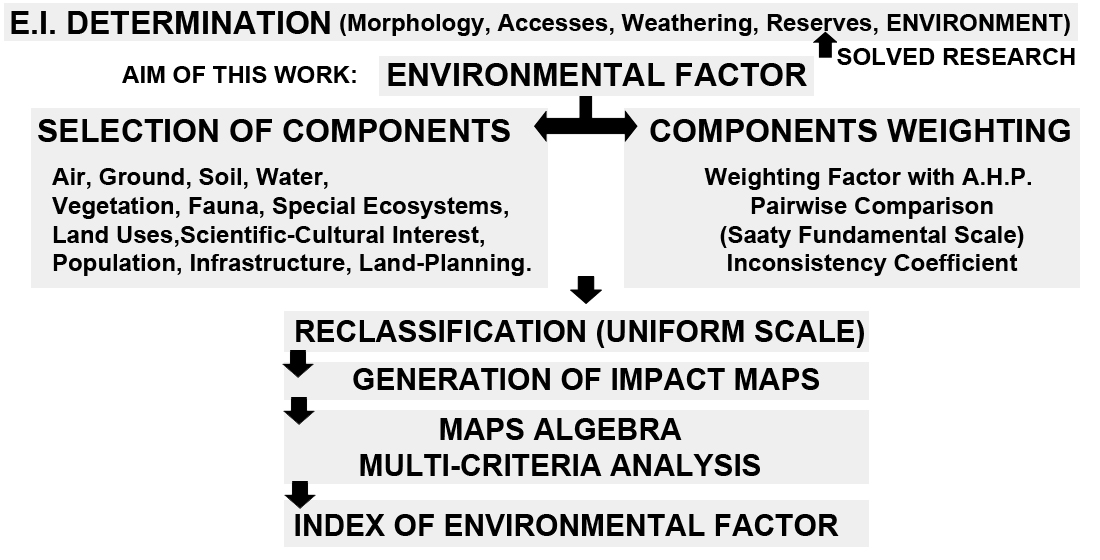
2.2. Methodological Proposal to Redefine the Environmental Criterion
- Socio-economic subsystem: It refers to the population and its attributes as consumer of goods and services, and subject of social relations and cultural activities.
- Nuclei and infrastructures subsystem: It is constituted by human settlements, infrastructures and their exchange relations.
- Natural physical subsystem: It is probably the most relevant of the three groups, and it is constituted by the land and resources in their present form.
2.2.1. Definition of Components
- Air: Mining affects this component mainly by the emission of solid particles, dust, gases and noise pollution during the excavation of holes, the stockpiling of materials, the creation of dumps, and due to the traffic of heavy loading and hauling equipment. [23].
- Ground-soil: Mining irreversibly affects the soil, which turns this component into one of the most relevant when assessing the environmental factor. The assessment is developed by means of the analysis of the active geomorphological processes (landslides, erosion, flooding, subsidence, etc.). The areas where these processes are more active are considered as less suitable, and those less active, as more adequate for mining activities. For example, the creation of voids, dumps, and the construction of tracks, buildings and treatment plants, have negative edaphic effects on the exploitation surroundings, due to the accumulation of wastes, fine elements and dust [24].
- Water: Mining affects surface water causing turbidity due to solid particles, dissolved toxic elements, acidification derived from the oxidation of pyrite components [1], etc. In this sense, all the conditions suffered by surface water also affect the groundwater [25]. In addition to this, the dumps, the creation of holes and excavations, and the pumping of water out of mine workings below the water table can alter aquifers and their flow regimes, which can be polluted by oils and hydrocarbons from heavy machinery [26].
- Vegetation: Mining removes or reduces the vegetation cover, and hinders its regeneration, due to the loss of fertile elements associated to the drastic increases of slopes and the erosion [27].
- Fauna: Mining has an impact on fauna, mainly by affecting their terrestrial habitats, provoking the displacement or concentration of species and individuals, excavating holes, and especially, by generating dumps. In addition to the foregoing, it can change behavior patterns of the fauna due to the disturbances related to heavy machinery traffic and the creation of tracks and infrastructures [28].
- Special ecosystems: Mining and all its inherent activities may severely affect this type of ecosystems, whose wildlife protection is the ultimate objective aimed by the definition of this kind of protecting areas [29].
- Landscape: Mining causes global disturbances in the landscape. These disruptions are generally grave in the case of dumps, severe when considering mining holes, and temporary with respect to the impacts associated to constructions, buildings, and the implantation of infrastructure [30].
- Scientific–cultural assets: Although extractive activities can promote the development of mining heritage, they can imply irreversible consequences for other types of cultural, historical, artistic or scientific elements. For a proper conservation, a regional catalogue that includes the assets of cultural interest is needed [31].
- Land uses: The territory is classified by the legislator according to its constraints with respect to its utilization (agriculture, forestry uses, etc.). If the mining activities are not developed in an area that is especially classified for this use, a change in the classification of the land and its degrees of protection is required [32].
- Population: The attitude of the population towards a mining project produces an important environmental factor called social acceptance. Mining projects that achieve social acceptance have a positive impact from an economic point of view and, in a negative way, can alter significant places, such as cultural and social heritage sites with unique value [33].
- Road network: Mining activity increases the traffic density on public roads, which puts the population at risk of a possible growth in the number of accidents, the deterioration of road surfaces and muddy roads. Socio-economically depressed areas can also benefit from the construction of new infrastructure required for the development of such activities [34].
- Urban planning: To start a mining project, its viability must pass through three basic legislative filters, namely mining legislation, environmental legislation, and urban planning legislation [35]. The classification of the land that is usually defined by the municipalities sets the type of activities that can be developed there. Sometimes, the mining project needs a modification in the land use so as to become effective.
2.2.2. Methodological Proposal
3. Results
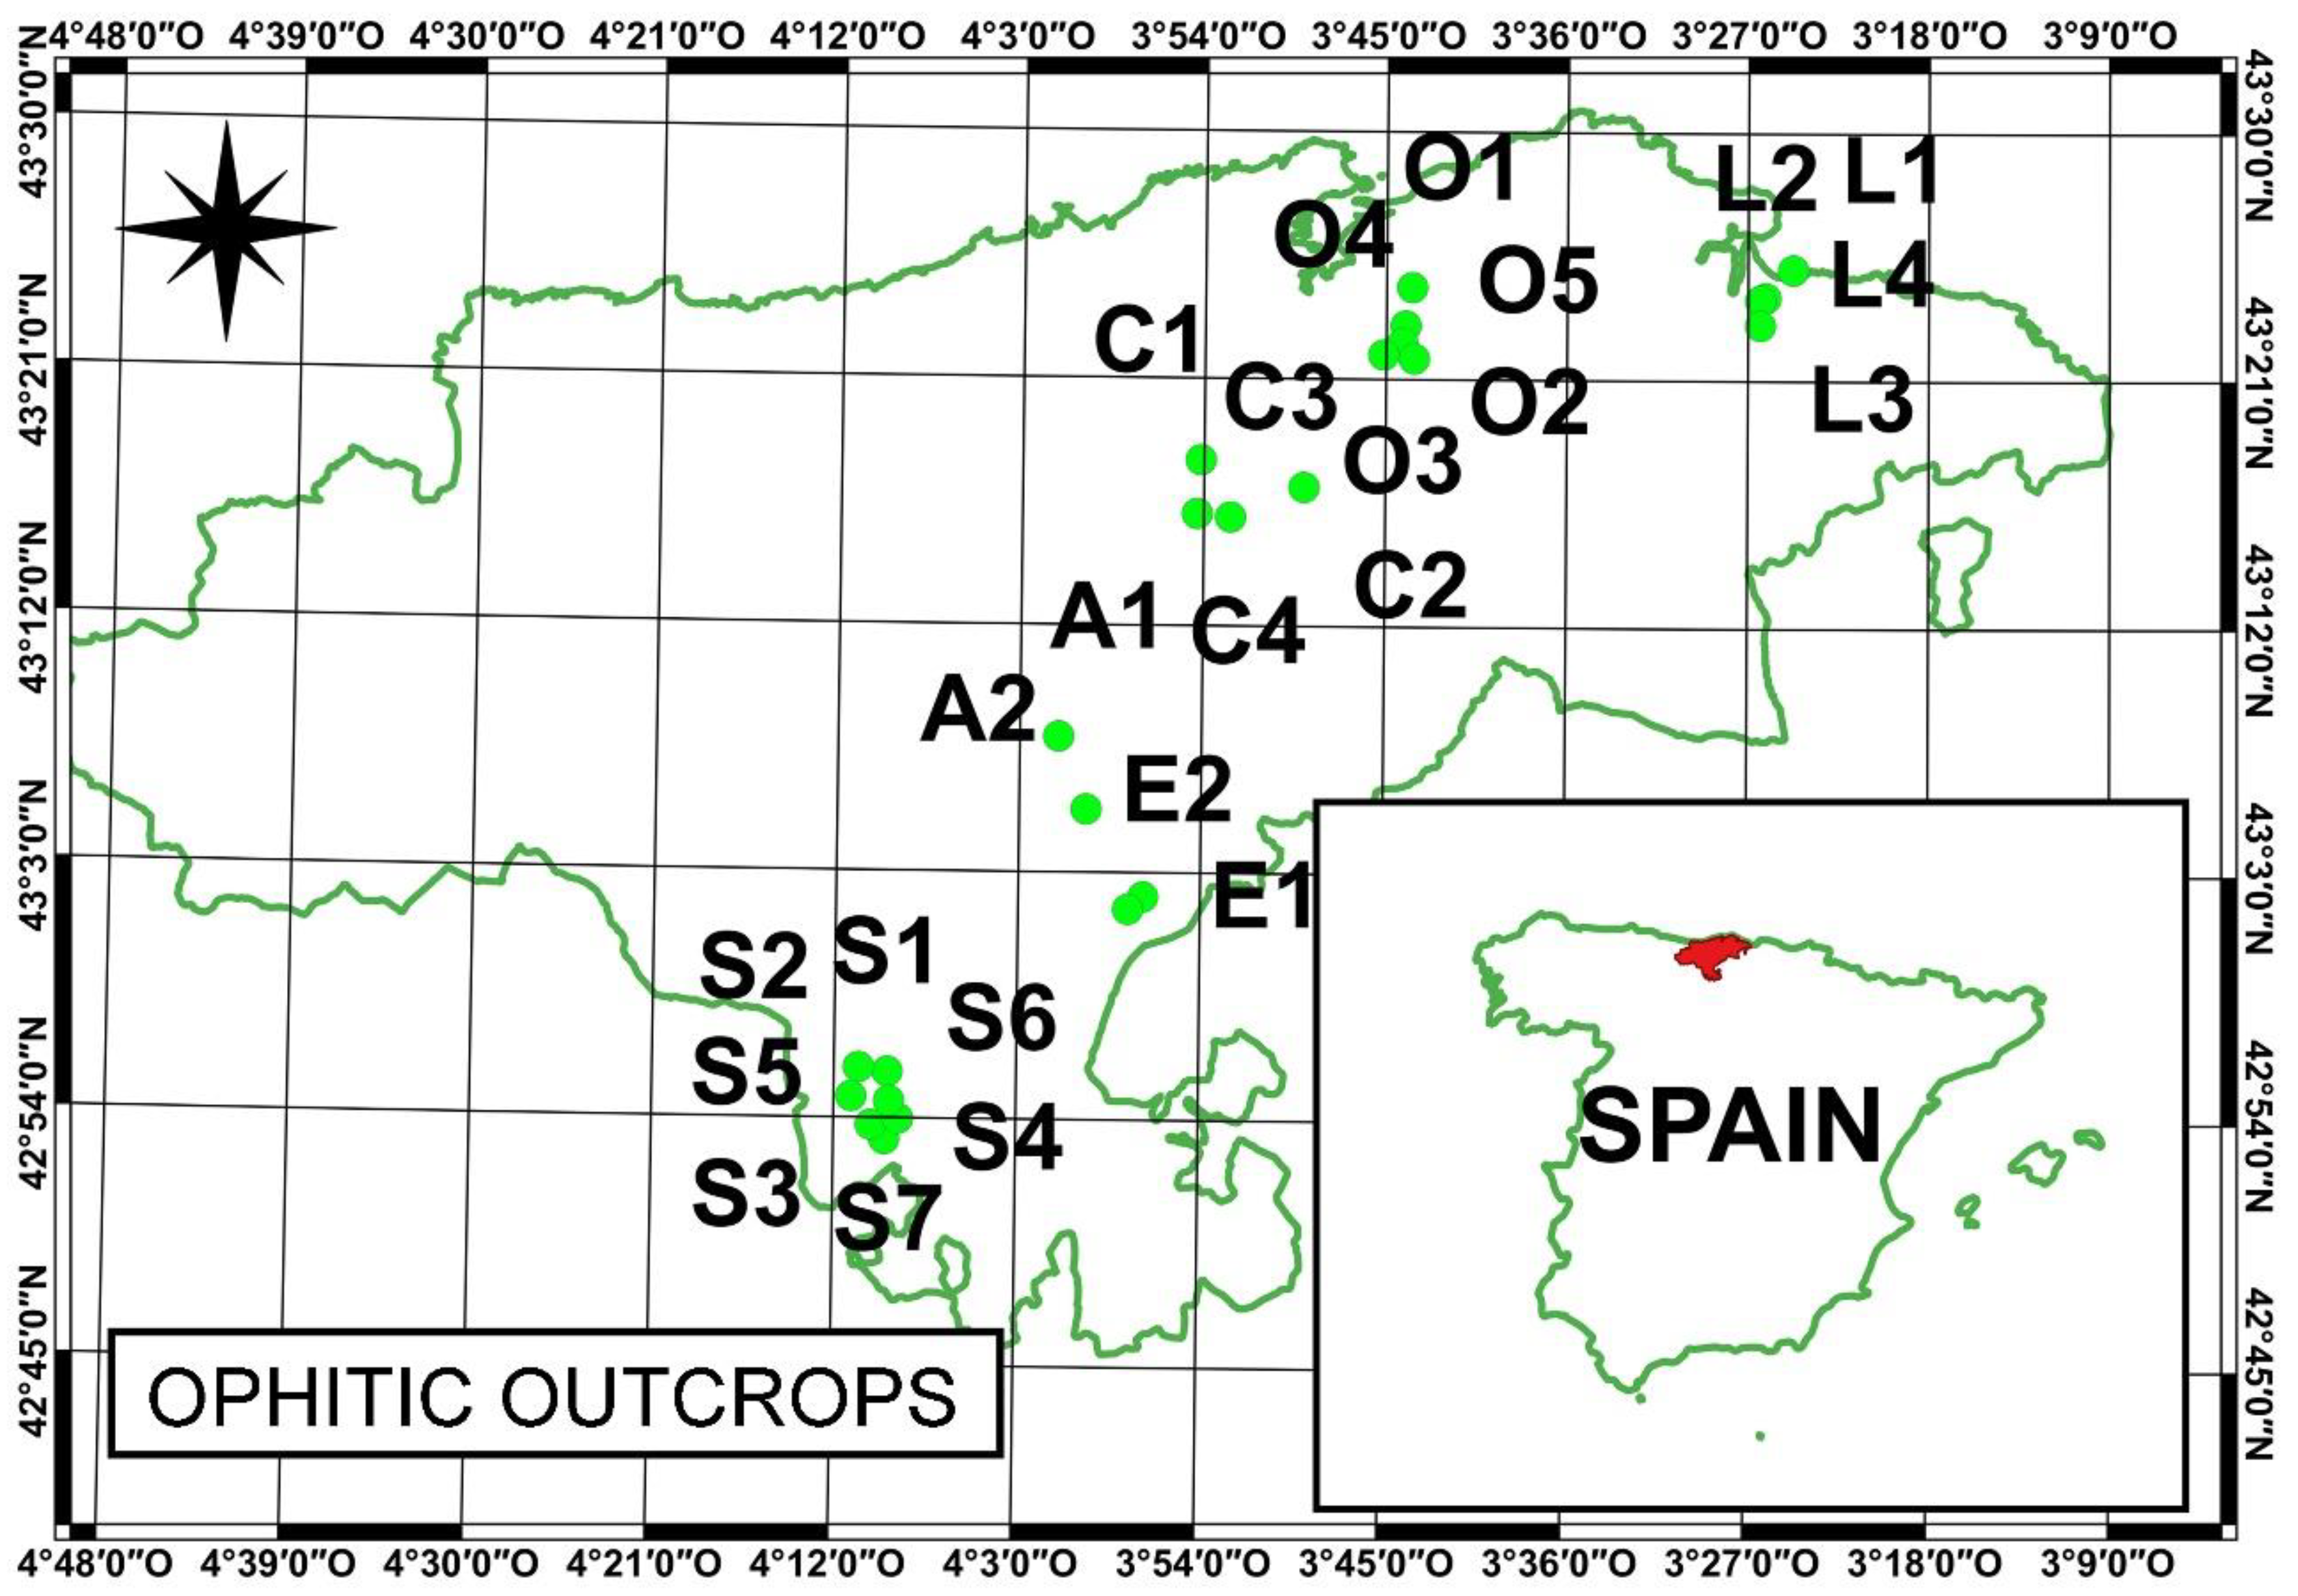
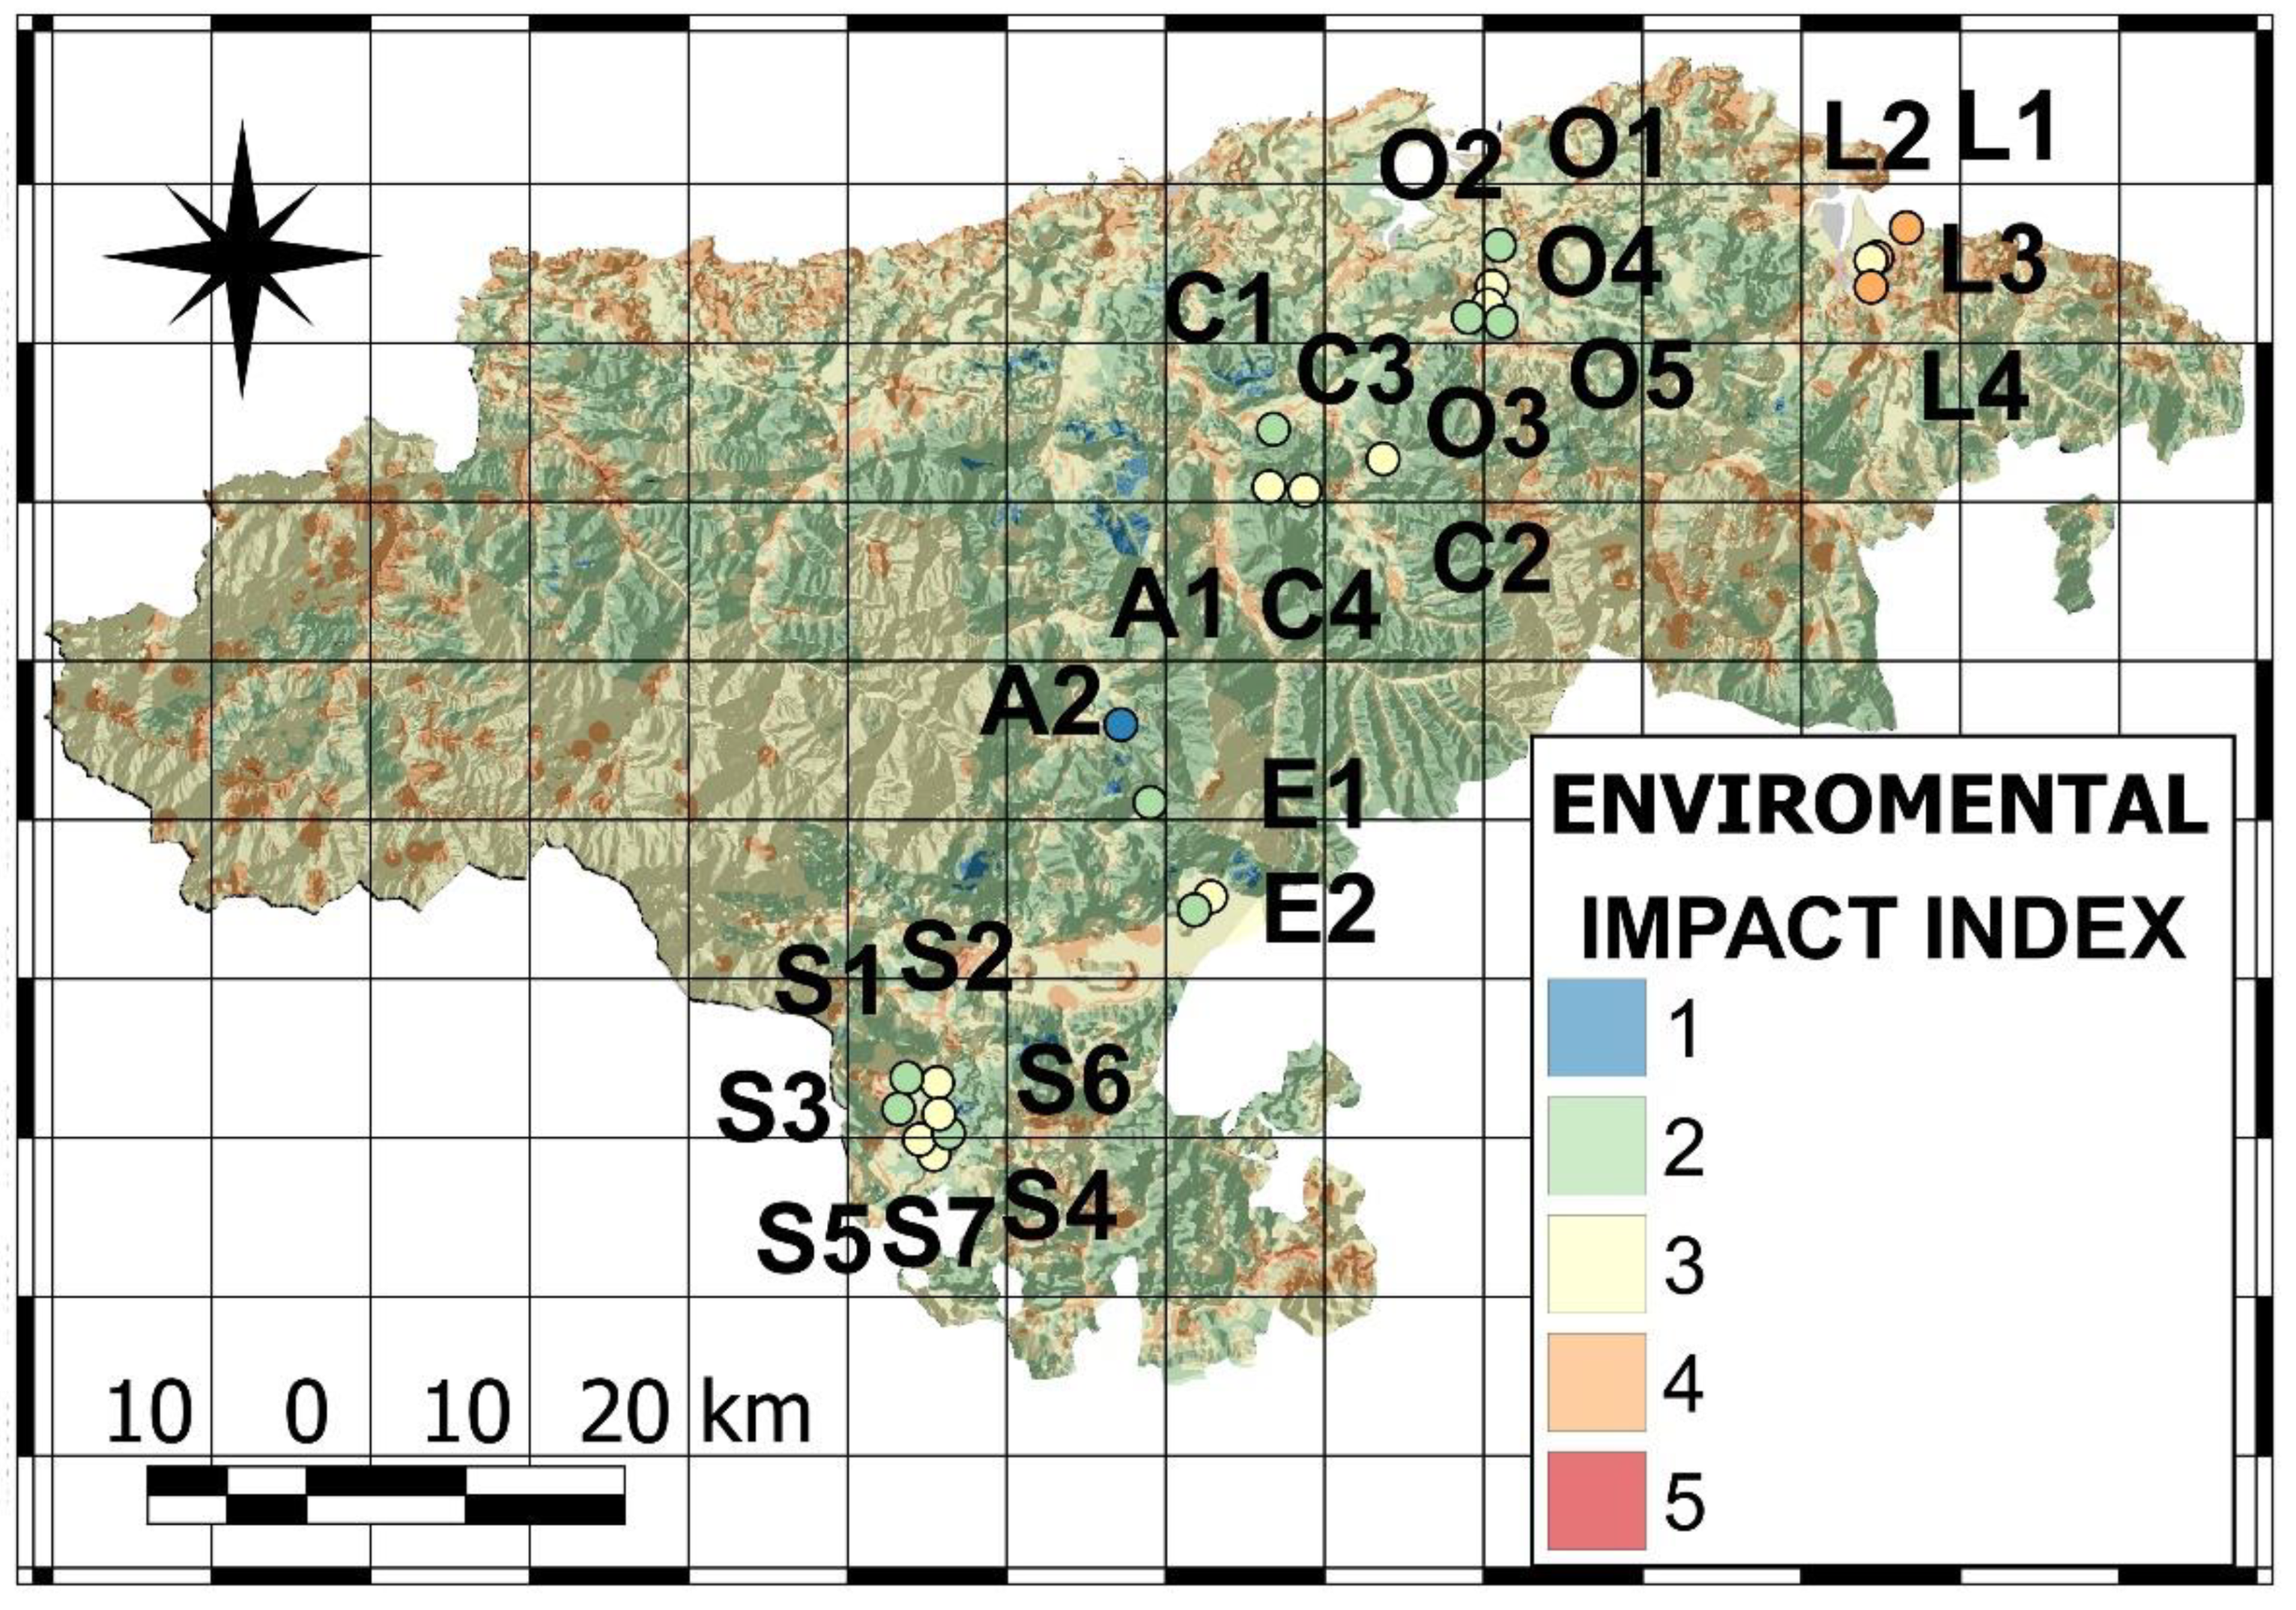
3.1. Introduction
- Area of Laredo: It comprises the northernmost outcrops of the region. Four different outcrops can be distinguished, namely El Canto (L1), Peña Lucía (L2), Colindres (L3) and Limpias (L4).
- Area of Orejo: Five different outcrops can be distinguished in the area, namely Orejo (O1), Solares (O2), Sobremazas (O3), Anaz (O4) and Hermosa (O5).
- Central Area: It includes the outcrops in the central zone of the region. Four different outcrops can be distinguished, namely San Román (C1), Esles (C2), Sandoñana (C3) and Escobedo (C4).
- Area of Alsa: It comprises the outcrops of Cueto Pando (A1) and the Alsa Reservoir (A2).
- Area of Ebro: It includes the ophitic outcrops near the Ebro Reservoir (E1) and La Población (E2).
- South Area: It includes an important number of outcrops in the south of the region, namely San Martín de Hoyos (S1), Olea (S2), Castrillo del Haya (S3), Rebolledo (S4), Camesa (S5), Matarrepudio (S6) and El Haya (S7).
3.2. Matrix of Pairwise Comparison and Weighting of Components
- Reciprocity, if aij = x, then aji = 1/x.
- Homogeneity, if i and j are equally important, then aij = aji = 1.
- By definition, aii =1 for any i.
- Consistency: The matrix must not contain contradictions in the valuation performed.
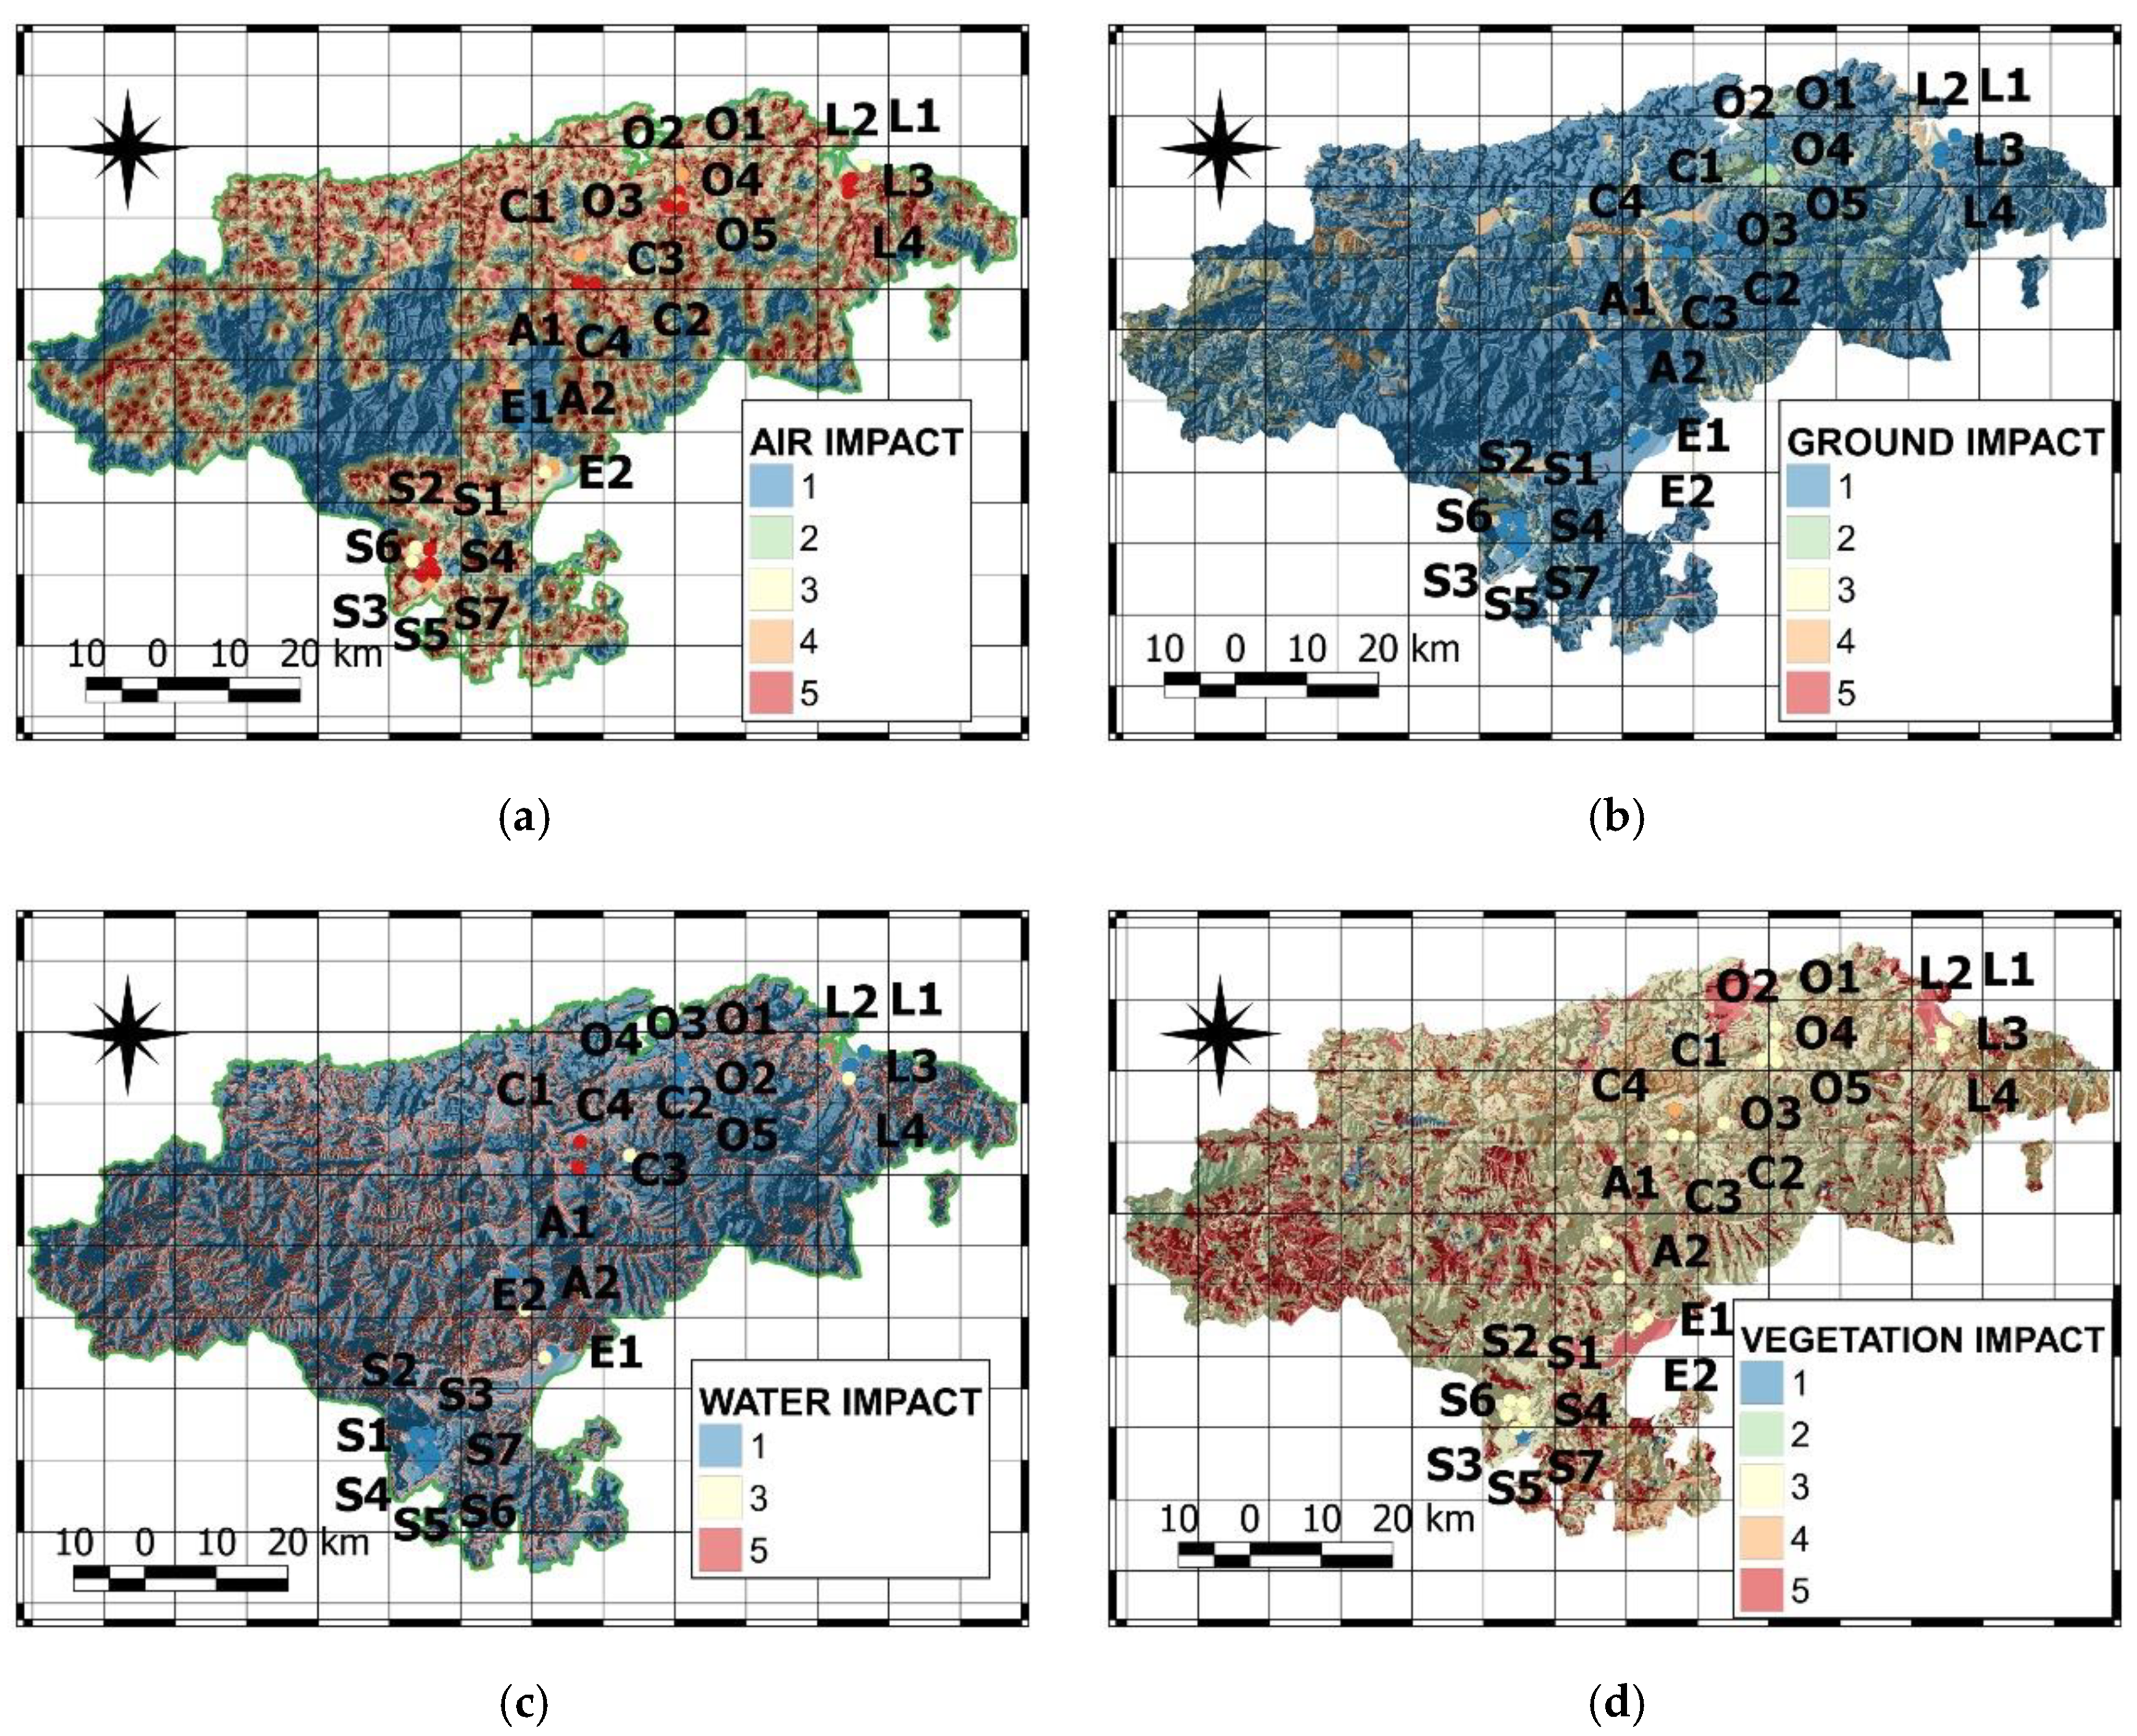
3.3. Determination of the Maps of Impact
3.3.1. Map of Air Impact
3.3.2. Map of Ground-Soil Impact
3.3.3. Map of Water Impact
3.3.4. Map of Vegetation Impact
3.3.5. Map of Fauna Impact
3.3.6. Map of Special Ecosystems Impact
3.3.7. Map of Landscape Impact
3.3.8. Map of Land Uses
3.3.9. Map of Cultural Heritage Impact
3.3.10. Map of Population Impact
3.3.11. Map of Infrastructure Impact
3.3.12. Map of Urban Planning Impact
3.4. Results of the Environmental Impact Index
4. Discussion
- The framework that comprises this research is focused on a preliminary analysis of the environmental factor, which allows us to calculate the EI at an early stage of the mining exploration. During this phase, the analysis is made on a general basis, as most of the prospecting techniques have not been applied yet, and the mining project itself has not been developed. This makes it necessary to apply data which are characterized by a pronounced general nature. Another relevant issue is the geographic scope of the research, which is focused on a specific Spanish administrative region, Cantabria. This allows for the application of a single regulatory framework, the same cartographic base, etc. If several administrative regions were involved, this could vary and should be considered.
- Once the components that most affect the environment in the area of extractive activities of ophitic materials were chosen, the multi-criteria method (i.e., AHP) was applied to determine the weighting to be used through an analytical process with objective criteria. The proposal of the matrix of components, as well as its pairwise comparison and the weighting itself were validated through the analysis of the consistency ratio of the matrix itself, as proposed in the methodology.
- After establishing the components and their respective weighting coefficients, the main criteria for the definition of each component were set. A detailed analysis of each criterion involved is required. In this regard, it should be taken into account that the more components there are, the better the environmental coefficient will represent the reality of the impact. At a second level, the more criteria used in the definition of the component, the better the component will be represented, and the more representative the environmental coefficient will be.
- Since all the processing is done with GIS tools, the elaboration of all the maps, which involves a great workload, is done in a quasi-automatic form. However, the thematic data and a proper normalization of the results are required to be able to apply the map algebra, as proposed by the methodology. The whole procedure was applied according to it and carried out successfully, obtaining the value of each component of the environment for every outcrop analyzed.
- Once the value and weighting of every component is obtained, the final value of the environmental coefficient for each outcrop is determined. Significant differences in the results are detected when compared with the environmental coefficients traditionally used. These significant differences are inevitably transferred to the EI of the outcrops, since the environmental coefficient can represent up to 30% of the weight in its calculation. All of this was taken into account in the pairwise comparison and the application of Saaty scale, and a conservative model was chosen. The adoption of a riskier alternative could possibly have resulted in even more significant differences.
- The methodology has a strong dependence on the components and the criteria of the components themselves chosen for each factor, since variations in any of these components cause the result to vary. Both the factors and the components are at the discretion of the developers, as they must be set according to their experience and the regional setting in which the outcrops are located. Nevertheless, by applying the methodology proposed in this research, variations are reduced to a minimum, especially with the final standardization.
5. Conclusions
Author Contributions
Funding
Institutional Review Board Statement
Informed Consent Statement
Data Availability Statement
Conflicts of Interest
References
- Suh, J.; Kim, S.-M.; Yi, H.; Choi, Y. An overview of GIS-based modeling and assessment of mining-induced hazards: Soil, water, and forest. Int. J. Environ. Res. Public Health 2017, 14, 1463. [Google Scholar] [CrossRef]
- Risk, C.; Zamaria, S.A.; Chen, J.; Ke, J.J.; Morgan, G.; Taylor, J.; Larsen, K.; Cowling, S.A. Using geographic information systems to make transparent and weighted decisions on pit development: Incorporation of interactive economic, environmental, and social factors. Can. J. Earth Sci. 2020, 57, 1103–1126. [Google Scholar] [CrossRef]
- Kim, S.M.; Choi, Y.; Suh, J.; Oh, S.; Park, H.D.; Yoon, S.H.; Go, W.R. ArcMine: A GIS extension to support mine reclamation planning. Comput. Geosci. 2012, 46, 84–95. [Google Scholar] [CrossRef]
- Nowak, M.M.; Dziób, K.; Ludwisiak, L.; Chmiel, J. Mobile GIS applications for environmental field surveys: A state of the art. Glob. Ecol. Conserv. 2020, 23, e01089. [Google Scholar] [CrossRef]
- Paraskevis, N.; Roumpos, C.; Stathopoulos, N.; Adam, A. Spatial analysis and evaluation of a coal deposit by coupling AHP & GIS techniques. Int. J. Min. Sci. Technol. 2019, 29, 943–953. [Google Scholar] [CrossRef]
- Haslam, P.A. Bigger data and quantitative methods in the study of socio-environmental conflicts. Sustainability 2020, 12, 7673. [Google Scholar] [CrossRef]
- Ranjith Premasiri, H.M.; Dahanayake, T. Development of GIS based model for locating sustainable construction aggregate mining sites: Case study from Sri Lanka. In Remote Sensing Enabling Prosperity, Proceedings of the 39th Asian Conference on Remote Sensing (ACRS 2018), Kuala Lumpur, Malaysia, 15–19 October 2018; Asian Association on Remote Sensing: Klong Luang, Thailand, 2019. [Google Scholar]
- Yuan, H.; Nturambirwe, J.F.I. Research and application of geographical information system and data mining technology in monitoring and evaluation of natural geographical environment. J. Mine Vent. Soc. S. Afr. 2020, 73, 135–139. [Google Scholar]
- Fernández-Maroto, G.; De Luis-Ruiz, J.M.; Pereda-García, R.; Malagón Picón, B.; Pérez-Álvarez, R. Multicriteria analysis for the determination of the exploitability index of industrial aggregate outcrops. Arch. Min. Sci. 2020, 65, 103–115. [Google Scholar] [CrossRef]
- Murdzek, R.; Malik, H.; Leśniak, A. Ground Subsidence Information as a Valuable Layer in GIS Analysis. E3S Web Conf. 2018, 36, 02006. [Google Scholar] [CrossRef]
- Barettino, D. Ordenación Minero-Ambiental de Recursos de Rocas Industriales. Aplicación a la Reserva Estatal de Pizarras de La Cabrera (León). Ph.D. Thesis, Polytechnic University of Madrid, Madrid, Spain, 2002. [Google Scholar]
- Díaz de Terán, J.R.; González Lastra, J.R. Un método de Evaluación y de Jerarquización de los Afloramientos de Rocas Industriales. In Proceedings of the I Reunión Nacional de Geología Ambiental y Ordenación del Territorio, vol. Comunicaciones, Santander, Spain, 19–23 May 1980; Sociedad Española de Geología y Ordenación del Territorio: Santander, Spain, 1980. [Google Scholar]
- Gómez Orea, D. Evaluación de Impacto Ambiental; Agrícola Española: Madrid, Spain, 1998. [Google Scholar]
- Oliveira Sousa, L.M. Estudo da Fracturaçao e das Características Físico-Mecânicas de Granitos da Regiao de Trás-os-Montes com Vista à sua Utilizaçao como Rocha Ornamental. Ph.D. Thesis, Universidade de Trás-Os-Montes e Alto Douro, Vila Real, Portugal, 2000. [Google Scholar]
- Muñoz de la Nava, P.M.; Escudero, J.A.R.; Suárez, I.R.; Romero, E.G.; Rosa, A.C.; Moles, F.C.; Martínez, M.P.G. Metodología de investigación de rocas ornamentales: Granitos. Bol. Geol. Min. 1989, 100, 129–149. [Google Scholar]
- Berry, P.; Pistocchi, A. A Multicriterial Geographical Approach for the Environmental Impact Assessment of Open-Pit Quarries. In Proceedings of the 6th International Conference of Enviromental Issues and Mangement of Waste in Energy and Mineral Production (SWEMP 2000), Calgary, AB, Canada, 30 May–2 June 2000; A.A: Balkema Publisher: Rotterdam, The Netherlands, 2000. [Google Scholar]
- Bandini, A.; Berry, P.; Dacquino, C. Implementation of a Database of Risk Assesment of Abandoned Italian Mining Sites. In Proceedings of the 11th International Symposyum on Environmetal Issues and Waste Management in Energy and Mineral Production (SWEMP 2000), Banff, AB, Canada, 16–19 September 2009; The Reading Matrix, Inc.: Irvine, CA, USA, 2009. [Google Scholar]
- Rudke, A.P.; Sikora de Souza, V.A.; Santos, A.M.D.; Freitas Xavier, A.C.; Rotunno Filho, O.C.; Martins, J.A. Impact of mining activities or areas of environmental protection in the southwest of the Amazon: A GIS- and remote sensing-based assessment. J. Environ. Manag. 2020, 263, 110392. [Google Scholar] [CrossRef] [PubMed]
- Fernández Maroto, G. Comportamiento como Árido para Pavimento de Ofitas de Cantabria. Ph.D. Thesis, University of Oviedo, Oviedo, Spain, 2002. [Google Scholar]
- Hernández-Durán, G.; Arranz-González, J.C.; Vega-Panizo, R.D.L. El análisis del potencial geológico de rocas industriales en proyectos de planificación territorial: Una revisión. Bol. Geol. Min. 2014, 125, 475–492. [Google Scholar]
- Kwinta, A.; Gradka, R. Mining exploitation influence range. Nat. Hazards 2018, 94, 979–997. [Google Scholar] [CrossRef]
- Lin, Y.; Hoover, J.; Beene, D.; Erdei, E.; Liu, Z. Environmental risk mapping of potential abandoned uranium mine contamination on the Navajo Nation, USA, using a GIS-based multi-criteria decision analysis approach. Environ. Sci. Pollut. Res. 2020, 27, 30542–30557. [Google Scholar] [CrossRef]
- Wnorowski, A.; Aklilu, Y.; Harner, T.; Schuster, J.; Charland, J. Polycyclic aromatic compounds in ambient air in the surface minable area of Athabasca oil sands in Alberta (Canada). Atmos. Environ. 2021, 244, 117897. [Google Scholar] [CrossRef]
- Martínez-Toledo, A.; González-Mille, D.; García-Arreola, M.; Cruz-Santiago, O.; Trejo-Acevedo, A.; Ilizaliturri-Hernández, C. Patterns in utilization of carbon sources in soil microbial communities contaminated with mine solid wastes from San Luis Potosi, Mexico. Ecotoxicol. Environ. Saf. 2021, 208, 111493. [Google Scholar] [CrossRef]
- Tomiyama, S.; Igarashi, T.; Tabelin, C.; Tangviroon, P.; Li, H. Modeling of the groundwater flow system in excavated areas of an abandoned mine. J. Contam. Hydrol. 2020, 230, 103617. [Google Scholar] [CrossRef]
- Zhixin, S.; Gangfu, S.; Wenzhong, T.; Dandan, Y.; Yu, Z.; Yaoyao, Z.; Jinghao, W.; Yulu, M. Molybdenum contamination dispersion from mining site to a reservoir. Ecotoxicol. Environ. Saf. 2021, 208. [Google Scholar] [CrossRef]
- Xinguang, Y.; Xilai, L.; Mingming, S.; Liqun, J.; Huafang, S. The effects of replaced topsoil of different depths on the vegetation and soil properties of reclaimed coal mine spoils in an alpine mining area. Isr. J. Ecol. Evol. 2019, 65, 1–14. [Google Scholar] [CrossRef]
- Jorba, M.; Ninot Sugrañes, J.; Bracho, C. Interacciones en espacios mineros restaurados: Vegetación y avifauna. Ecosistemas 2019, 28, 78–81. [Google Scholar] [CrossRef]
- Hernandez-Santin, L.; Rudge, M.; Bartolo, R.; Whiteside, T.; Erskine, P. Reference site selection protocols for mine site ecosystem restoration. Restor. Ecol. 2020, 29, e13278. [Google Scholar] [CrossRef]
- Chen, W.; Li, X.; He, H.; Wang, L. Assessing Different Feature Sets’ Effects on Land Cover Classification in Complex Surface-Mined Landscapes by ZiYuan-3 Satellite Imagery. Remote Sens. 2018, 10, 23. [Google Scholar] [CrossRef]
- Brandi, I.; Barbosa, M.; Guimarães de Paula, R.; Araújo, R.; Vieira de Moura, R.; Mota de Lima, H. Instrumented geotechnical monitoring of a natural cave in a near mine operation—Towards a sustainable approach to mining and preservation of speleological heritage. J. Clean. Prod. 2019, 239, 118040. [Google Scholar] [CrossRef]
- Doya, R.; Nakayama, S.S.M.M.; Hokuto, N.; Haruya, T.; Yabe, J.; Muzandu, K.; Yohannes, Y.B.; Kataba, A.; Zyambo, G.; Ogawa, T.; et al. Land Use in Habitats Affects Metal Concentrations in Wild Lizards Around a Former Lead Mining Site. Environ. Sci. Technol. 2020, 54, 14474–14481. [Google Scholar] [CrossRef] [PubMed]
- Martins, N.; Bollinger, C.; Harper, R.; Ribeiro, R. Effects of acid mine drainage on the genetic diversity and structure of a natural population of Daphnia longispina. Aquat. Toxicol. 2009, 92, 104–112. [Google Scholar] [CrossRef][Green Version]
- Moridi, M.A.; Kawamura, Y.; Sharifzadeh, M.; Chanda, E.K.; Wagner, M.; Jang, H.; Okawa, H. Development of underground mine monitoring and communication system integrated ZigBee and GIS. Int. J. Min. Sci. Technol. 2015, 25, 811–818. [Google Scholar] [CrossRef]
- Gałaś, A.; Tyszer, M.; Gałaś, S. Using GIS to Predict Potential Environmental Conflicts in the Colca and Andagua Volcanoes Geopark (Peru). In Public Recreation and Landscape Protection—With Nature Hand in Hand Conference Proceeding, Krtiny, Czech Republic, 2–4 May 2018; Fialová, J., Ed.; Mendel University in Brno—Czech Society of Landscape Engineers: Brno, Czech Republic, 2018. [Google Scholar]
- Saedpanah, S.; Amanollahi, J. Environmental pollution and geo-ecological risk assessment of the Qhorveh mining area in western Iran. Environ. Pollut. 2019, 253, 811–820. [Google Scholar] [CrossRef] [PubMed]
- Saaty, T.L. How to make a decision: The analytic hierarchy process. Eur. J. Oper. Res. 1990, 48, 9–26. [Google Scholar] [CrossRef]
- Aguarón, J.; Escobar, M.T.; Moreno-Jiménez, J.M. Consistency Stability Intervals for a judgement in AHP Decision Support Systems. Eur. J. Oper. Res. 2001, 45, 382–393. [Google Scholar] [CrossRef]
- Aznar Bellver, J.; Guijarro Martínez, F. Nuevos Métodos de Valoración. Modelos Multicriterio; Editorial Universitat Politècnica de València: Valencia, Spain, 2005. [Google Scholar]
- Kellogg, C.A.; Griffin, D.W. Aeorobiology and the Global Transport of Desert Dust. Trends Ecol. Evol. 2006, 21, 638–644. [Google Scholar] [CrossRef] [PubMed]
- Al-Sammarraee, M.; Chan, A.; Salim, S.M.; Mahabaleswar, U.S. Large-eddy Simulations of Particle Sedimentation in a Longitudinal Sedimentation Basin of a Water Treatment Plant. Part I: Particle settling performance. Chem. Eng. J. 2009, 152, 307–314. [Google Scholar] [CrossRef]
- Knopff, K.; Bede, L.C.; Arruda, L.; Alves, T.; Simons, B. Methods for Postdisaster Impact Assessment: A Case Study of the Impacts at the Fundão Dam Failure on Terrestrial Species Threatened with Extinction. Integr. Environ. Assess. Manag. 2020, 16, 1551–3777. [Google Scholar] [CrossRef] [PubMed]
- Dentoni, V.; Massacci, G. Assessment of Visual Impact Induced by Surface Mining with Reference to a Case Study Located in Sardinia, Italy. Environ. Earth Sci. 2013, 68, 1485–1493. [Google Scholar] [CrossRef]


| Level 1 | Level 2 | Level 3 |
|---|---|---|
| Natural physical subsystem | Inert medium | Air |
| Ground-soil | ||
| Water | ||
| Biotic medium | Vegetation | |
| Fauna | ||
| Special ecosystems | ||
| Perceivable medium | Landscape | |
| Scientific–cultural assets | ||
| Land uses | Productive uses | |
| Socio-economic subsystem | Population | Density of population |
| Nuclei and infrastructures subsystem | Infrastructures and services | Road network |
| Urban structure | Urban planning |
| Scale | Definition | Explanation |
|---|---|---|
| 1 | Same importance | Both criteria contribute to the objective in the same way. |
| 3 | Moderated importance | Experience and judgment slightly favor one criterion over the other. |
| 5 | Great Importance | Experience and judgment strongly favor one criterion over the other. |
| 7 | Very great importance | One criterion is very strongly favored over the other. In practice, its dominance can be demonstrated. |
| 9 | Extreme importance | Evidence favors one factor over the other to the fullest extent. |
| 2, 4, 6 and 8 | Intermediate values between the ones that are mentioned above, when qualifying is required. | |
| n | 3 | 4 | 5 | 6 | 7 | 8 | 9 | 10 | 11 | 12 |
|---|---|---|---|---|---|---|---|---|---|---|
| ICA | 0.525 | 0.882 | 1.115 | 1.252 | 1.341 | 1.404 | 1.452 | 1.484 | 1.513 | 1.535 |
| Rank of the Matrix | Consistency Ratio |
|---|---|
| 3 | ≤5% |
| 4 | ≤9% |
| ≥5 | ≤10% |
| Criterion | Value |
|---|---|
| Very low | 1 |
| Low | 2 |
| Moderate | 3 |
| High | 4 |
| Very high | 5 |
| Component | A | B | C | D | E | F | G | H | I | J | K | L | |
|---|---|---|---|---|---|---|---|---|---|---|---|---|---|
| Air | A | 1 | 1.00 | 0.33 | 0.33 | 0.33 | 0.20 | 0.33 | 1.00 | 0.20 | 1.00 | 1.00 | 0.20 |
| Ground-Soil | B | 1.00 | 1 | 0.33 | 1.00 | 1.00 | 0.20 | 0.50 | 2.00 | 0.20 | 2.00 | 0.50 | 0.20 |
| Water | C | 3.00 | 3.00 | 1 | 2.00 | 1.00 | 0.20 | 3.00 | 3.00 | 0.25 | 2.00 | 5.00 | 0.33 |
| Vegetation | D | 3.00 | 1.00 | 0.50 | 1 | 1.00 | 0.20 | 2.00 | 2.00 | 0.25 | 2.00 | 2.00 | 0.33 |
| Fauna | E | 3.00 | 1.00 | 1.00 | 1.00 | 1 | 0.20 | 2.00 | 2.00 | 0.25 | 2.00 | 2.00 | 0.33 |
| Special Ecosystems | F | 5.00 | 5.00 | 5.00 | 5.00 | 5.00 | 1 | 5.00 | 5.00 | 1.00 | 5.00 | 5.00 | 5.00 |
| Landscape | G | 3.00 | 2.00 | 0.33 | 0.50 | 0.50 | 0.20 | 1 | 3.00 | 0.25 | 2.00 | 3.00 | 2.00 |
| Productive Uses | H | 1.00 | 0.50 | 0.33 | 0.50 | 0.50 | 0.20 | 0.33 | 1 | 0.20 | 1.00 | 2.00 | 0.33 |
| Areas of Scientific–Cultural Interest | I | 5.00 | 5.00 | 4.00 | 4.00 | 4.00 | 1.00 | 4.00 | 5.00 | 1 | 5.00 | 5.00 | 4.00 |
| Density of Population | J | 1.00 | 0.50 | 0.50 | 0.50 | 0.50 | 0.20 | 0.50 | 1.00 | 0.20 | 1 | 0.50 | 0.25 |
| Road Network | K | 1.00 | 2.00 | 0.20 | 0.50 | 0.50 | 0.20 | 0.33 | 0.50 | 0.20 | 2.00 | 1 | 0.33 |
| Urban Planning | L | 5.00 | 5.00 | 3.00 | 3.00 | 3.00 | 0.20 | 0.50 | 3.00 | 0.25 | 4.00 | 3.00 | 1 |
| A | B | C | D | E | F | G | H | I | J | K | L | Global Priorities | Row Vector | Column Matrix | |
|---|---|---|---|---|---|---|---|---|---|---|---|---|---|---|---|
| A | 0.03 | 0.04 | 0.02 | 0.02 | 0.02 | 0.05 | 0.02 | 0.04 | 0.05 | 0.03 | 0.03 | 0.01 | 0.0296 | 0.3719 | 12.5739 |
| B | 0.03 | 0.04 | 0.02 | 0.05 | 0.05 | 0.05 | 0.03 | 0.07 | 0.05 | 0.07 | 0.02 | 0.01 | 0.0406 | 0.5087 | 12.5300 |
| C | 0.09 | 0.11 | 0.06 | 0.10 | 0.05 | 0.05 | 0.15 | 0.11 | 0.06 | 0.07 | 0.17 | 0.02 | 0.0875 | 1.1555 | 13.2037 |
| D | 0.09 | 0.04 | 0.03 | 0.05 | 0.05 | 0.05 | 0.10 | 0.07 | 0.06 | 0.07 | 0.07 | 0.02 | 0.0590 | 0.7636 | 12.9472 |
| E | 0.09 | 0.04 | 0.06 | 0.05 | 0.05 | 0.05 | 0.10 | 0.07 | 0.06 | 0.07 | 0.07 | 0.02 | 0.0615 | 0.8074 | 13.1281 |
| F | 0.16 | 0.19 | 0.30 | 0.26 | 0.27 | 0.25 | 0.26 | 0.18 | 0.24 | 0.17 | 0.17 | 0.35 | 0.2317 | 3.2422 | 13.9917 |
| G | 0.09 | 0.07 | 0.02 | 0.03 | 0.03 | 0.05 | 0.05 | 0.11 | 0.06 | 0.07 | 0.10 | 0.14 | 0.0679 | 0.9231 | 13.5898 |
| H | 0.03 | 0.02 | 0.02 | 0.03 | 0.03 | 0.05 | 0.02 | 0.04 | 0.05 | 0.03 | 0.07 | 0.02 | 0.0331 | 0.4227 | 12.7865 |
| I | 0.16 | 0.19 | 0.24 | 0.21 | 0.22 | 0.25 | 0.21 | 0.18 | 0.24 | 0.17 | 0.17 | 0.28 | 0.2077 | 2.8505 | 13.7219 |
| J | 0.03 | 0.02 | 0.03 | 0.03 | 0.03 | 0.05 | 0.03 | 0.04 | 0.05 | 0.03 | 0.02 | 0.02 | 0.0300 | 0.3855 | 12.8670 |
| K | 0.03 | 0.07 | 0.01 | 0.03 | 0.03 | 0.05 | 0.02 | 0.02 | 0.05 | 0.07 | 0.03 | 0.02 | 0.0357 | 0.4497 | 12.6147 |
| L | 0.16 | 0.19 | 0.18 | 0.16 | 0.16 | 0.05 | 0.03 | 0.11 | 0.06 | 0.14 | 0.10 | 0.07 | 0.1158 | 1.5489 | 13.3792 |
| Parameter | Value |
|---|---|
| λmax | 13.1111 |
| CI | 0.1010 |
| ICA (Table 3) | 1.535 |
| RC | 6.58% |
| Global Priorities | Total Row Vector | Column Matrix | Final Weight (%) | ||
|---|---|---|---|---|---|
| Air | A | 0.0277 | 0.3637 | 13.1080 | 2.77 |
| Ground-Soil | B | 0.0379 | 0.4968 | 13.1080 | 3.79 |
| Water | C | 0.0855 | 1.1207 | 13.1080 | 8.55 |
| Vegetation | D | 0.0568 | 0.7452 | 13.1080 | 5.68 |
| Fauna | E | 0.0601 | 0.7879 | 13.1080 | 6.01 |
| Special Ecosystems | F | 0.2424 | 3.1779 | 13.1080 | 24.24 |
| Landscape | G | 0.0684 | 0.8970 | 13.1080 | 6.84 |
| Productive Uses | H | 0.0315 | 0.4129 | 13.1080 | 3.15 |
| Areas of Scientific–Cultural Interest | I | 0.2131 | 2.7929 | 13.1080 | 21.31 |
| Density of Population | J | 0.0289 | 0.3789 | 13.1080 | 2.89 |
| Road Network | K | 0.0334 | 0.4381 | 13.1080 | 3.34 |
| Urban Planning | L | 0.1141 | 1.4961 | 13.1080 | 11.41 |
| Partial Impact Values | ||||||||||||
|---|---|---|---|---|---|---|---|---|---|---|---|---|
| Weighting Coefficient | 0.028 | 0.038 | 0.085 | 0.057 | 0.060 | 0.242 | 0.068 | 0.031 | 0.213 | 0.029 | 0.033 | 0.114 |
| Outcrop Component | A | B | C | D | E | F | G | H | I | J | K | L |
| L1 | 3 | 1 | 1 | 3 | 1 | 5 | 1 | 1 | 5 | 4 | 2 | 5 |
| L2 | 5 | 1 | 1 | 3 | 1 | 5 | 2 | 3 | 5 | 4 | 5 | 3 |
| L3 | 5 | 1 | 1 | 3 | 1 | 3 | 4 | 5 | 5 | 4 | 5 | 3 |
| L4 | 5 | 1 | 3 | 3 | 1 | 5 | 2 | 3 | 5 | 5 | 5 | 5 |
| O1 | 4 | 1 | 1 | 3 | 1 | 3 | 2 | 3 | 1 | 3 | 3 | 3 |
| O2 | 5 | 1 | 1 | 3 | 1 | 3 | 3 | 5 | 5 | 3 | 4 | 5 |
| O3 | 4 | 2 | 1 | 3 | 1 | 3 | 3 | 3 | 1 | 3 | 4 | 5 |
| O4 | 5 | 2 | 1 | 3 | 1 | 3 | 2 | 3 | 1 | 3 | 3 | 5 |
| O5 | 5 | 2 | 1 | 3 | 1 | 3 | 1 | 3 | 1 | 3 | 3 | 5 |
| C1 | 4 | 1 | 5 | 4 | 1 | 1 | 1 | 4 | 1 | 3 | 3 | 5 |
| C2 | 3 | 1 | 3 | 3 | 1 | 1 | 2 | 3 | 5 | 3 | 4 | 5 |
| C3 | 5 | 1 | 1 | 3 | 1 | 1 | 3 | 3 | 5 | 3 | 1 | 5 |
| C4 | 5 | 1 | 5 | 3 | 1 | 1 | 2 | 3 | 5 | 3 | 4 | 5 |
| A1 | 4 | 1 | 1 | 3 | 1 | 1 | 1 | 1 | 1 | 3 | 1 | 3 |
| A2 | 1 | 1 | 3 | 3 | 1 | 1 | 1 | 4 | 1 | 1 | 1 | 5 |
| E1 | 4 | 1 | 1 | 3 | 1 | 3 | 2 | 3 | 5 | 2 | 3 | 3 |
| E2 | 3 | 1 | 3 | 3 | 1 | 3 | 2 | 3 | 1 | 2 | 4 | 3 |
| S1 | 5 | 1 | 1 | 3 | 5 | 1 | 2 | 1 | 5 | 2 | 3 | 3 |
| S2 | 3 | 1 | 1 | 3 | 5 | 3 | 2 | 3 | 1 | 2 | 1 | 3 |
| S3 | 3 | 1 | 1 | 3 | 5 | 3 | 2 | 3 | 1 | 2 | 5 | 3 |
| S4 | 4 | 1 | 1 | 1 | 5 | 1 | 2 | 3 | 5 | 2 | 5 | 5 |
| S5 | 5 | 1 | 1 | 3 | 5 | 1 | 3 | 3 | 5 | 2 | 1 | 3 |
| S6 | 5 | 1 | 1 | 3 | 5 | 3 | 2 | 5 | 1 | 2 | 4 | 3 |
| S7 | 5 | 1 | 1 | 3 | 5 | 3 | 2 | 3 | 5 | 2 | 4 | 3 |
| Viewshed Area | Reclassified Viewshed |
|---|---|
| 0 < value ≤ 1 | 1 |
| 1 < value ≤ 3 | 2 |
| 3 < value ≤ 5 | 3 |
| 5 < value ≤ 9 | 4 |
| 9 < value ≤ 17 | 5 |
| Population Density | Impact Value |
|---|---|
| 0 < density ≤ 0.05 | 1 |
| 0.05 < density ≤ 0.20 | 2 |
| 0.20 < density ≤ 5 | 3 |
| 5 < density ≤ 10 | 4 |
| 10 < density ≤ 55 | 5 |
| Land Classification | Impact Value |
|---|---|
| - Specially protected rustic land. - Consolidated urban land. - Limited land for development. - Unconsolidated urban land. | 5 |
| - Rustic land of ordinary protection. | 3 |
| - Non-urbanizable land 3 forest interest. - Undeveloped agricultural land. - Undeveloped non-urbanizable land of normal regime. - Forest and livestock land (far from the nucleus). | 2 |
| - Non-urbanizable land with mining protection. - Non-urbanizable land with special mining-farming protection 2. - Undeveloped land with the protection for extractive activities. - Undeveloped land 2 of forestry interest and mining extraction. - Undeveloped land class IV. Open-pit quarries. | 1 |
| Outcrop | Total Impact | Reclassified Total Impact | Traditional Impact |
|---|---|---|---|
| L1 | 3.568 | 4 | 4 |
| L2 | 3.627 | 4 | 4 |
| L3 | 3.342 | 3 | 4 |
| L4 | 4.055 | 4 | 4 |
| O1 | 2.166 | 2 | 4 |
| O2 | 3.439 | 3 | 4 |
| O3 | 2.534 | 3 | 2 |
| O4 | 2.460 | 2 | 2 |
| O5 | 2.392 | 2 | 2 |
| C1 | 2.271 | 2 | 2 |
| C2 | 2.938 | 3 | 0 |
| C3 | 2.791 | 3 | 2 |
| C4 | 3.165 | 3 | 2 |
| A1 | 1.483 | 1 | 0 |
| A2 | 1.836 | 2 | 1 |
| E1 | 2.990 | 3 | 4 |
| E2 | 2.314 | 2 | 4 |
| S1 | 2.710 | 3 | 0 |
| S2 | 2.283 | 2 | 1 |
| S3 | 2.417 | 2 | 0 |
| S4 | 2.926 | 3 | 1 |
| S5 | 2.774 | 3 | 1 |
| S6 | 2.502 | 3 | 0 |
| S7 | 3.291 | 3 | 4 |
| Calculated Impact Value | Reclassified Impact Value |
|---|---|
| 0 < value ≤ 1.50 | 1 |
| 1.50 < value ≤ 2.50 | 2 |
| 2.50 < value ≤ 3.50 | 3 |
| 3.5 < value ≤ 4.50 | 4 |
| 4.50 < value ≤ 5 | 5 |
Publisher’s Note: MDPI stays neutral with regard to jurisdictional claims in published maps and institutional affiliations. |
© 2021 by the authors. Licensee MDPI, Basel, Switzerland. This article is an open access article distributed under the terms and conditions of the Creative Commons Attribution (CC BY) license (http://creativecommons.org/licenses/by/4.0/).
Share and Cite
de Luis-Ruiz, J.M.; Salas-Menocal, B.R.; Fernández-Maroto, G.; Pérez-Álvarez, R.; Pereda-García, R. Determination of Environmental Factors for the Implementation of the Exploitability Index in Industrial Aggregate Mining Using Multi-Criteria Analysis. ISPRS Int. J. Geo-Inf. 2021, 10, 196. https://doi.org/10.3390/ijgi10040196
de Luis-Ruiz JM, Salas-Menocal BR, Fernández-Maroto G, Pérez-Álvarez R, Pereda-García R. Determination of Environmental Factors for the Implementation of the Exploitability Index in Industrial Aggregate Mining Using Multi-Criteria Analysis. ISPRS International Journal of Geo-Information. 2021; 10(4):196. https://doi.org/10.3390/ijgi10040196
Chicago/Turabian Stylede Luis-Ruiz, Julio Manuel, Benito Ramiro Salas-Menocal, Gema Fernández-Maroto, Rubén Pérez-Álvarez, and Raúl Pereda-García. 2021. "Determination of Environmental Factors for the Implementation of the Exploitability Index in Industrial Aggregate Mining Using Multi-Criteria Analysis" ISPRS International Journal of Geo-Information 10, no. 4: 196. https://doi.org/10.3390/ijgi10040196
APA Stylede Luis-Ruiz, J. M., Salas-Menocal, B. R., Fernández-Maroto, G., Pérez-Álvarez, R., & Pereda-García, R. (2021). Determination of Environmental Factors for the Implementation of the Exploitability Index in Industrial Aggregate Mining Using Multi-Criteria Analysis. ISPRS International Journal of Geo-Information, 10(4), 196. https://doi.org/10.3390/ijgi10040196