1. Introduction
1.1. Background
The cadastre map has long been a main part of the modern cadastre and critical material in the cadastre legal and administration practices. Nowadays, it serves as the visualization medium that helps users unambiguously perceive cadastre-related spatial and non-spatial information, which may otherwise be difficult to understand with only tables and descriptions. As the cadastre in multiple countries starts to register the 3D legal space and its right, restriction, and responsibility, many researchers believe that moving the cadastre map from 2D to 3D and cartographically enriching the raw data may bring a series of benefits to 3D legal space visualization [
1], including intuitive presentations [
2], 3D interactive navigation [
3], and extra symbol design choices compared with 2D visualization [
4]. The latest 3D mapping development in various application fields demonstrates the potential to create an immersive 3D environment by using not only visual but auditive channels [
5,
6], and such an immersive environment benefits a wide spectrum of users and tasks, such as noise evaluation, biodiversity, urban planning, site marketing, and cultural heritage displaying [
5,
6,
7,
8,
9]. As 3D cadastre mapping often deals with congregated scenarios and complex legal realities, fine-tuning the cartographic enrichment is key to ensuring a usable mapping result. Addressing this topic, plenty of mapping and visualization designs have been proposed according to the discoveries about the user’s visual capability, visual task, cartographic enrichment, prototype implementation, and the usability of the 3D cadastre visualization [
4,
10,
11].
Currently, the existing guidance and principles communicated between the 3D cadastre cartographers are often in the forms of oral communication, documents, research papers, and regulations. The instructions and the resulting 3D graphic contents are scattered and not readily interchangeable between cadastre systems, practitioners, and organizations. There is still no easy entry of synthesized and concrete symbology instructions, regulations, and patterns for cartographers, administrators, and visualization systems to follow. Administrators have to demarcate the mapping regulations in a series of symbolic rules expressed in natural languages. On the other hand, cartographers have to collect and understand these symbolic rules first, for example, the boundary of a 2D land parcel should be colored red. They should carefully apply these rules to specific scenarios and manually enrich the original cadastre data to 3D scenes. In the context of semantically rich 3D cadastre data, such a process is not only time-consuming but may contain subjective bias. Moreover, the cartographically enriched scene is often not readily interchangeable due to the difference in the 3D scene encoding. 3D cadastre mapping requires a method that could provide the interoperability of both the symbolic rule and the 3D scene content to the portrayal process. A well-recognized data model provides interoperability and may facilitate practices of the open data, geospatial service, and volunteered geographic information (VGI) [
12,
13]. As a result, establishing a model for portrayal-related information could be a solution to 3D cadastre portrayal interoperability.
In the cartography domain, a digital landscape model (DLM) refers to data models that are specialized for describing the geospatial reality, and a digital cartographic model (DCM) refers to data models that are specialized for cartographic portrayal. Both DLM and DCM could be set as either a conceptual definition or an encoding regulation. With DLM and DCM, the visualization pipeline can be divided into two consecutive processes: a symbology process from DLM to DCM and a rendering process from DCM to the final mapping output. In the symbology process, the feature in the DLM is selected and then geometrically and semantically generalized. Some existing cadastre mapping practices have already implemented such a process without explicitly using these terms. For example, cartographers could use a relational database to store the spatial and non-spatial raw data, eXtensible Stylesheet Language Transformations (XSLT) to define the symbolic rules, and Scaleable Vector Graphics (SVG) to encode the final mapping output. In this process, the relational database schema is a DLM, and the XSLT and SVG encodings are employed as DCMs.
Introducing DCM on top of DLM is a common approach in 2D cartography for the structured portrayal-related information description, interoperation, and automation [
14,
15]. The DCM has been a critical part of many computerized mapping platforms and is evaluated as a valuable component of Spatial Data Infrastructure (SDI) [
16]. Moving from 2D to 3D, the research of the 3D city model visualization has already recognized the importance of portrayal modeling to establish interoperability and style customization, especially for the semantically rich 3D city models such as City Geographic Markup Language (CityGML) [
17]. Some researchers argue that a standalone DCM could be embedded in the 3D city service chain and be an indispensable part of 3D SDI in the future [
18,
19].
1.2. Problem Description
Based on the previously presented research, design, and implementation of the DCM, introducing a standalone DCM for the 3D cadastre portrayal modeling could be beneficial for the 3D cadastre portrayal interoperation. This idea was mentioned in Stoter’s [
20] early 3D cadastre thesis. Some cadastre prototypes have already employed a design that separates portrayal modeling and reality modeling without referring to the DCM term, like that of Cemellini et al. [
21] and that of Shojaei et al. [
3]. However, to our knowledge, there are few explicit investigations of the DCM application to 3D cadastre. The main research question is whether DCM and the DCM-based 3D cadastre visualization pipeline is applicable. There are also two sub-questions. First, are the existing general-purpose DCMs capable of describing the main design features of 3D cadastre mapping? Second, to what extent can the DCM-centered visualization pipeline facilitate 3D cadastre mapping?
1.3. Methodology
Aiming to answer these research questions, this paper presents proof-of-concept research of the 3D cadastre DCM and the corresponding visualization pipeline. The Land Administration Domain Model (LADM)-based tentative 3D cadastre DLM of China [
22] and the existing urban cadastre practices in China provide concrete bases for the portrayal-related research. The research starts by identifying the requirements and design features of the 3D cadastre mapping through a literature review and interviews with users and cartographers in China. The literature review contains not only academic manuscripts but also technical reports. Eighteen participants have been enrolled for interviews and the following user tests. Since current general-purpose DCMs could not fully support the modeling of the cadastre mapping design features, this research then designs an ad hoc 3D cadastre DCM, constructs supporting applications and embeds the model into the cadastre visualization pipeline. Qualitative proof-of-concept user tests are employed to gauge the applicability of the DCM centered visualization pipeline. The tests are centered around three tasks: the rule-based and automatic cartographic enrichment, symbol design cooperation, and 3D scene diffusing. The empirical result demonstrates that such DCM-based 3D cadastre visualization pipeline is applicable and provides cadastre mapping interoperability and automation. The invited cartographer participants could design, produce, and interoperate 3D cadastre symbolic rules effectively and efficiently with the DCM-centered visualization pipeline. The output 3D scenes could be readily rendered in multiple 3D visualization platforms with a designated style and then fulfill the user’s visualization requirements.
1.4. Significance
This is the first research dedicated to 3D cadastre DCM to our knowledge. It provides a new paradigm of 3D cadastre mapping: modeling the portrayal-related information separately from the semantically rich cadastre raw data. The new mapping paradigm promotes the share and exchange of portrayal-related information and by this means facilitates the 3D cadastre mapping administration, content production, data protection, and 3D scene diffusion. This work is one part of the ongoing 3D portrayal development in the geospatial domain. The result, though ad hoc in cadastre and in the Chinese urban context, may also inspire similar research in other application domains and locations.
This paper is structured as follows.
Section 2 provides a brief review of the DCM-related works, extending those already presented in the introduction section.
Section 3 presents the collection of the requirements and design features of the 3D cadastre mapping.
Section 4 presents the design of the 3D cadastre DCM, the development of the supportive programs, and the formation of the visualization pipeline.
Section 5 explains the validation process and presents the result.
Section 6 discusses its significance and limits.
Section 7 concludes the research.
2. Related Work
2.1. Portrayal Modeling in 3D Cadastre
Explicitly modeling the portrayal-related information is common in the current 3D cadastre mapping research and practices. Most of the current works focus on the modeling of the graphic content, which is the result of a symbology process. Some researchers employ CityGML [
23,
24], which models the classes and relations of urban objects together with their geometry, semantic, and appearance features. Since it encodes not only the geospatial reality but also some of the portrayal information, CityGML could be evaluated as a DLM and DCM mixed model. Such a solution is valuable when the reality modeling and the portrayal modeling are tightly connected but is burdensome when only portrayal information is needed. Nonetheless, CityGML can only encode limited portrayal information. That is one reason why some researchers try to extend the original CityGML model for better portrayal support. For example, Mao, Ban, and Harrie [
25] proposed a CityTree model extending CityGML for multiple representation and visualization. Many CityGML-based programs, such as 3D CityDB, use other data formats for mapping and visualization.
Compared with using the DCM and DLM mixed model, some existing cadastre mapping applications employ dedicated 3D scene models to encode the graphic content of cartographically enriched 3D scenes, such as Extensible 3D (X3D) [
20,
26,
27], COLLAborative Design Activity (COLLADA) [
28], and Keyhole Markup Language (KML) [
3,
29]. In this context, these models can be evaluated as standalone cadastre DCMs, as they are dedicated to 3D cadastre portrayal. These models could provide better 3D graphic support compared with CityGML and can be readily rendered by many visualization platforms such as Google Earth, Cesium, and three.js. Using dedicated 3D scene encoding also provides flexibility to the 3D scene defusing and rendering. The encoded 3D scenes, such as those in the COLLADA files, can be pre-constructed and stored in the server-side data repository to facilitate graphic data transfer, interoperation, and visualization.
Despite modeling the graphic content, the symbology process from the cadastre data to the 3D scene has not yet been explicitly modeled, thus can only be hand-crafted by using 3D content authoring tools such as Sketchup, Blender, and Revit. The 3D scene could be either re-drawn from scratch, as done by Vandysheva et al. [
26] or transformed and extended from the raw geometry data stored in Industry Foundation Classes (IFC) [
28] files, CityGML [
29] files, or Oracle database [
20]. Explicitly modeling the symbology is the premise that the cartographic enriching process can be automated while maintaining rich customizable settings. Stoter [
20] and Shojaei et al. [
3] encoded the symbolic rules in the enriching process by using XSLT. They then realized the automatic 3D content creating through which the cadastre data, either in the Oracle database or Land eXtensible Markup Language (LandXML) files, is converted to the X3D/KML encoded 3D scene following the rules demarcated in the XSLT files. In this process, both XSLT and X3D/KML could be evaluated as cadastre DCMs, as they are dedicated to portrayal modeling. This ad hoc solution indicates the potential value of modeling symbolic rules with 3D content together for mapping automation. However, both Stoter [
20] and Shojaei et al. [
3] provide limited information concerning the reasoning behind their XSLT structure. Furthermore, the ad hoc solution has yet been related to the existing general-purpose DCMs.
2.2. General-Purpose DCMs
Most of the existing general-purpose DCMs are for 2D symbology modeling and are tightly attached to a certain platform or service, such as the Open Geospatial Consortium (OGC) Styled Layer Descriptor (SLD) for Web Map Service (WMS), the ArcGIS layer style for ArcGIS platform, CartoCSS for Tilemill, and the Mapbox style specification for Mapbox applications. There are two widely recognized platform-independent and general-purpose DCMs: an encoding level model OGC Symbology Encoding (SE), and a conceptual model ISO 19117 Portrayal. Researchers are constantly improving existing DCMs to meet new demands. Bocher and Ertz [
30] redesigned OGC SE to enable the description of the compound 2D symbol. Rylov and Zipf [
31] proposed improvements to the label placement of OGC SE. The current general-purpose DCMs are often encoded in a manner that both humans and computers can understand. For example, the OGC SLD and Symbology Encoding (SE) are encoded in eXtensible Markup Language (XML), the CartoCSS is in Cascading Style Sheet (CSS), and the Mapbox map style is in JavaScript Object Notation (JSON). As a result, these DCMs could be mediums with which the cartographic portrayal information between human and machine is exchanged.
Despite the research and implementation of 2D DCM, there are still a limited number of research publications on 3D DCM. Researchers have proposed some tentative platform-independent and general-purpose 3D DCMs, such as the 3D SLD and 3D SE proposed by Neubauer and Zipf [
32,
33] and the 3D SE by Haist, Ramos, and Reitz [
34]. Their proposals developed existing OGC SLD and SE specifications to adapt the elementary 3D cartographic features. However, there is yet a widely accepted general-purpose 3D DCM that has been well validated and could be readily applied to 3D cadastre mapping. Currently, binding 3D mapping to specific content creation or visualization platform for portrayal description is a common solution in the 3D geo-visualization domain, for example, using the three.js framework in combination with the WebGL rendering technique [
35], using Cesium [
29], or using CityEngine’s design and visualization applications [
36]. Such a solution confines the exchange of portrayal information.
In sum, most of the research concerning the portrayal modeling of the 3D cadastre mapping addresses the encoding of the 3D scene graphic content. The encoding could be tightly connected with cadastre DLM like those using CityGML or be independent like those using a dedicated 3D graphic content model. Compared with the modeling of the 3D scene, the modeling of the symbology process is less touched with only an ad hoc solution by using XSLT files. On the other hand, there still lacks a well-recognized general-purpose 3D DCM ready for 3D cadastre mapping. The existing general-purpose DCMs, either 2D or tentative 3D ones, provide a rich knowledge base for the 3D cadastre DCM development. By reviewing the user requirements and design features of the 3D cadastre mapping, we can propose a new 3D DCM accordingly.
3. User Requirements and Design Features of 3D Cadastre Mapping
The inventory of the user requirements and design features is the starting point of the 3D cadastre DCM research, as such a model should be capable of encoding the cadastre design features, and its mapping results should meet a large portion of the user’s requirements. In this part, a literature review yields a preliminary inventory, which is then refined based on the interviews with the cadastre map producers and readers.
3.1. Literature Review and Preliminary Inventory
The preliminary inventory of the 3D cadastre visualization requirements and design features are formulated based on literature review. We have collected and reviewed the 3D cadastre-related research papers, presentations, and technical reports since 2001 with an emphasis on the user’s requirements, cadastre 3D scenes, figures, and design descriptions. Both the snapshot of a 3D visualization system, such as that in Vandysheva et al.’s [
26] manuscript, and the demonstrative plot used in these manuscripts, such as the isometric diagram, are considered. For the user requirement, some of the cadastre researchers, such as Wang, Pouliot, and Hubert [
37] and Shojaei et al. [
11], have already proposed and tested rich inventories. The documents involved in the ongoing cadastre data fusion projects and 3D pilot projects in China also contain valuable information about the domestic requirements.
3.2. Interviews and Selection of Participants
The preliminary inventory is then validated in the interviews with the cadastre map users and cartographers in China. The interview contains two sections: a visualization requirement section and a design feature section. The visualization requirement section requires the interviewee to evaluate the pertinence of the items in the preliminary requirement inventory. The design feature section requires the interviewee to evaluate the pertinence and preference of the items in the preliminary design feature inventory. We manually create demonstrative 3D scenes that are cartographically enriched based on the urban cadastre scenarios in China. For the visualization requirement section, we build one demonstrative 3D scene dedicated for each visualization requirement and two demonstrative 3D scenes that can serve all the requirements. The 3D scenes employ some of the main 3D cadastre mapping design features and are then reused in the design feature section. The other design features are presented in the form of snapshots with explanatory texts.
Each interview is carried out in the interviewee’s office with 3D scenes, snapshots, and questions displayed on the screen of a laptop. The overall process lasts around an hour. In the interview, the interviewer first gives a short introduction concerning the testing context and explains the key feature of each demonstrative 3D scene. The interviewee browses the demonstrative 3D scenes in the form of pre-recorded video, so the influence of the 3D navigation on their reading is minimized. Then, the interviewee starts to evaluate the proposed visualization requirements. It can rank the visualization requirements as irrelevant, optional, or essential. In the design feature section, the interviewee can evaluate the design feature pertinence as relevant or irrelevant. They are invited to openly express their subjective preference.
We interviewed 12 potential 3D cadastre map readers and six cadastre cartographers in Anhui Province, China, to understand their opinion towards the preliminary inventory of the 3D cadastre visualization requirements and design features. The reader participants were selected with respect to the main reader groups. Among these interviewees, two were cadastre managers, five were cadastre-related surveyors, and five were public users (property owners). The selection of participants in each group is close to a convenient sampling. For managers and surveyors, we invited those who have experiences with the overlapping legal space. For property owners, we invited those outside the cadastre and survey domain. Inviting non-professional property owners was valuable, since in China the graphic representation of the property, currently 2D, has been an indispensable part of the registration documents issued to property owners. Apart from the 12 reader participants, 6 cadastre cartographers who had already participated in cadastre-related projects were also interviewed, but only for the design feature section. Three of these cartographers were from the private sector, one was from the public sector, and two were from education institutions. These cartographers had experience in symbol design, 3D content creation, and interactive 3D scene implementation.
3.3. Inventory of Visualization Requirements
Six user requirements were verified in the interviews, as shown in
Table 1. These visualization requirements are from the visual task aspect rather than the detailed functional aspect. The list aims to provide a concrete basis for the following discussion of visualization design features with the interviewee. We are fully aware of the potential bias due to the limited participant number. Comprehensive user research that contains detailed technical and functional requirements is still under a lengthy and recursive investigation following the 3D cadastre development in China.
3.4. Inventory of Design Features
The specialty of 3D cadastre mapping is at the style level, as most of the cartographic elements have already been presented in the 3D geo-visualization domain. Non-photorealistic [
38] cartographic enrichment of the legal object for both the 3D scene and static plot are prevailing. Some prototypes employ a photo-realistic design for the corresponding physical objects, terrains, and landmarks, such as that of Korea [
39] and Australia [
3]. There is also a design that integrates the cadastre boundary lines with photorealistic “Streetview” [
40]. In the interview, most participants expressed their preference toward a non-photorealistic style.
In a non-photorealistic 3D visualization, the map primitive is the key medium whose visual variables could be altered by cartographers to encode underlying information. The interactive 3D cadastre visualization prototypes employ the area primitive most frequently. Combining the area primitive with visual variables such as color hue and transparency yields promising usability [
4]. Moving an area from its corresponding feature’s location is also a common design to reduce the occlusion effect [
41]. Compared with the area primitive, the line primitive is less touched in the interactive scene. Only some 3D cadastre prototypes use line colors for highlighting [
26]. Despite the limited application in the interactive scene, the line primitive has been extensively employed in the static cadastre plot with color hue, width, and shape (solid line, dash line, etc.). The line primitive is often employed in the visualization of 3D city models when presenting the boundary is a must, as in the design of Peters et al. [
42] and Jobst, Kyprianidis, and Döllner [
43]. The point primitive appears in some cross-section diagrams, isometric diagrams, and 2D cadastre maps for presenting turning points and landmarks, such as those in the 3D registration document of Shenzhen [
44]. The solid primitive in 3D cadastre visualization is often realized in a way of boundary representation, involving multiple area primitives as symbol components. A solid can also be represented as voxelized volume. Li et al. [
45] demonstrated that the voxelized volume texture rendering of the 3D legal space has the advantage of semantic consistency and facilitates volume cutting, as in a cross-section view. However, as shown in their research, direct visualization of a solid primitive with voxelization may require significantly more computing resources. As a result, the voxelized solid is not discussed in this study.
An important design feature of 3D cadastre mapping is that compound symbols are extensively used in the existing 3D cadastre mapping. In a compound symbol, multiple types of map primitives could be employed for one type of cadastre feature at the same time, and they may no longer be in accordance with the geometry and the location of its corresponding feature. For example, a 3D property unit could be symbolized by a combination of survey points, outlines, and boundary faces. Similarly, an unbounded 3D space, such as a 2D underground parcel, could be symbolized by a series of areas along its boundary face strings.
The interviewed cadastre managers, surveyors, and cartographers confirmed the importance of the area, line, point primitives, and the compound symbols. The professional cadastre users value the point primitive as they regularly deal with boundary turning points and landmarks, which are key factors in the cadastral boundary registration in China. On the other hand, the public user considers that the point primitive is less relevant. Both the literature review and the interviews with cadastre cartographers show that the design choices are deeply influenced by the functions provided by the 3D scene creation tools. Three commonly used authoring tools—3D content creation software (e.g., Sketchup), Computer-Aided Design (CAD) (e.g., Autodesk CAD), and Geographical Information System (GIS) (e.g., ArcGIS)—provide different sets of readily available design tools. The 2D cadastre map, isometric diagram, and cross-section diagram, which are often drawn with CAD, uses point primitives, line primitives, and text annotation more frequently. On the other hand, the 3D content creation software and GIS-based 3D content creation use the line and point primitives less frequently. Some existing work takes advantage of a mixed solution. For example, Döner et al. [
46]’s 4D cadastre employed both CAD and GIS for content editing and visualization.
As a modeling method that depicts the reality in different representations and with different levels of generalization for quicker visualization and analysis [
47,
48], the level of detail (LOD) can be achieved in either DLM or DCM, as a multi-representation can be either feature or visualization centric. Shojaei et al. [
11] argue that the LOD of a legal object in a DLM of 3D cadastre is not appropriate since the geometry of a legal object should be registered precisely without any simplicity. This is also confirmed in our interview. On the other hand, DCM and 3D rendering could employ an LOD to accelerate the transmission and display without damaging the precision of the readers’ perception. For the 3D scene projection, many of the 3D cadastre visualizations use perspective projection in an interactive viewport. Some designs introduce extra 2D viewports with an orthogonal projection to precisely depict the measurements of the property units [
44,
49]. Finally, the map legend of 3D cadastre is often achieved in a standalone and complementary viewport, as in solutions from China [
44] and the Netherland [
50].
4. Model Design
By evaluating current general-purpose DCMs with respect to the 3D cadastre mapping design features, we found that the existing general-purpose DCMs, even those proposed for 3D visualization, could not fulfill the needs of 3D cadastre mapping. First, existing tentative 3D DCMs may not be flexible enough to describe the compound 3D symbol in the 3D cadastre mapping. For example, the tentative 3D SE proposed by Neubauer and Zipf [
32,
33] cannot encode the symbolic rule that uses the area primitive to visualize the line boundaries of a land parcel. The inflexibility may also impede the precise depiction of the symbol part’s offset from the original geometry. It is hard to encode the explosion highlighting symbology, which offsets each of the surfaces of a solid geometry towards the outside or inside in order to give a view of the 3D legal space’s interior. The second deficiency is that the current general-purpose 3D DCMs only model symbolic rules. The cartographically enriched 3D scene, which is most frequently modeled in the current 3D cadastre mapping practices, is not included and readily interoperable. The visualization designer and implementor must independently calculate and render the 3D scene based on the rules implied in these 3D DCMs. The 3D cadastre mapping may expect that the 3D DCM is flexible enough to support compound 3D cadastre symbols and includes the 3D scene encoding.
According to the inventory of the user’s requirements and design features, we designed a new 3D DCM that addresses two major concerns: first, that it should be flexible enough to represent the compound cadastre 3D symbols, and second, that it should encode not only the symbolic rules but also the 3D scene’s graphic content. The existing theories, terminologies, frameworks, and ontologies of 3D cartography and information visualization [
51,
52,
53,
54,
55] are considered in the design process. The proposed 3D DCM contains two modules: a 3D symbology encoding (SE) module to structurally describe the symbolic rules and a 3D graphic content (GC) module to formalize the description of the cartographically enriched 3D scene. We establish the SE module of the proposed DCM at both the conceptual level and encoding level. On the other hand, the GC module of the proposed DCM is selected from the existing 3D content encoding models for better compatibility with the prevailing 3D visualization applications.
4.1. 3D Symbology Encoding Module
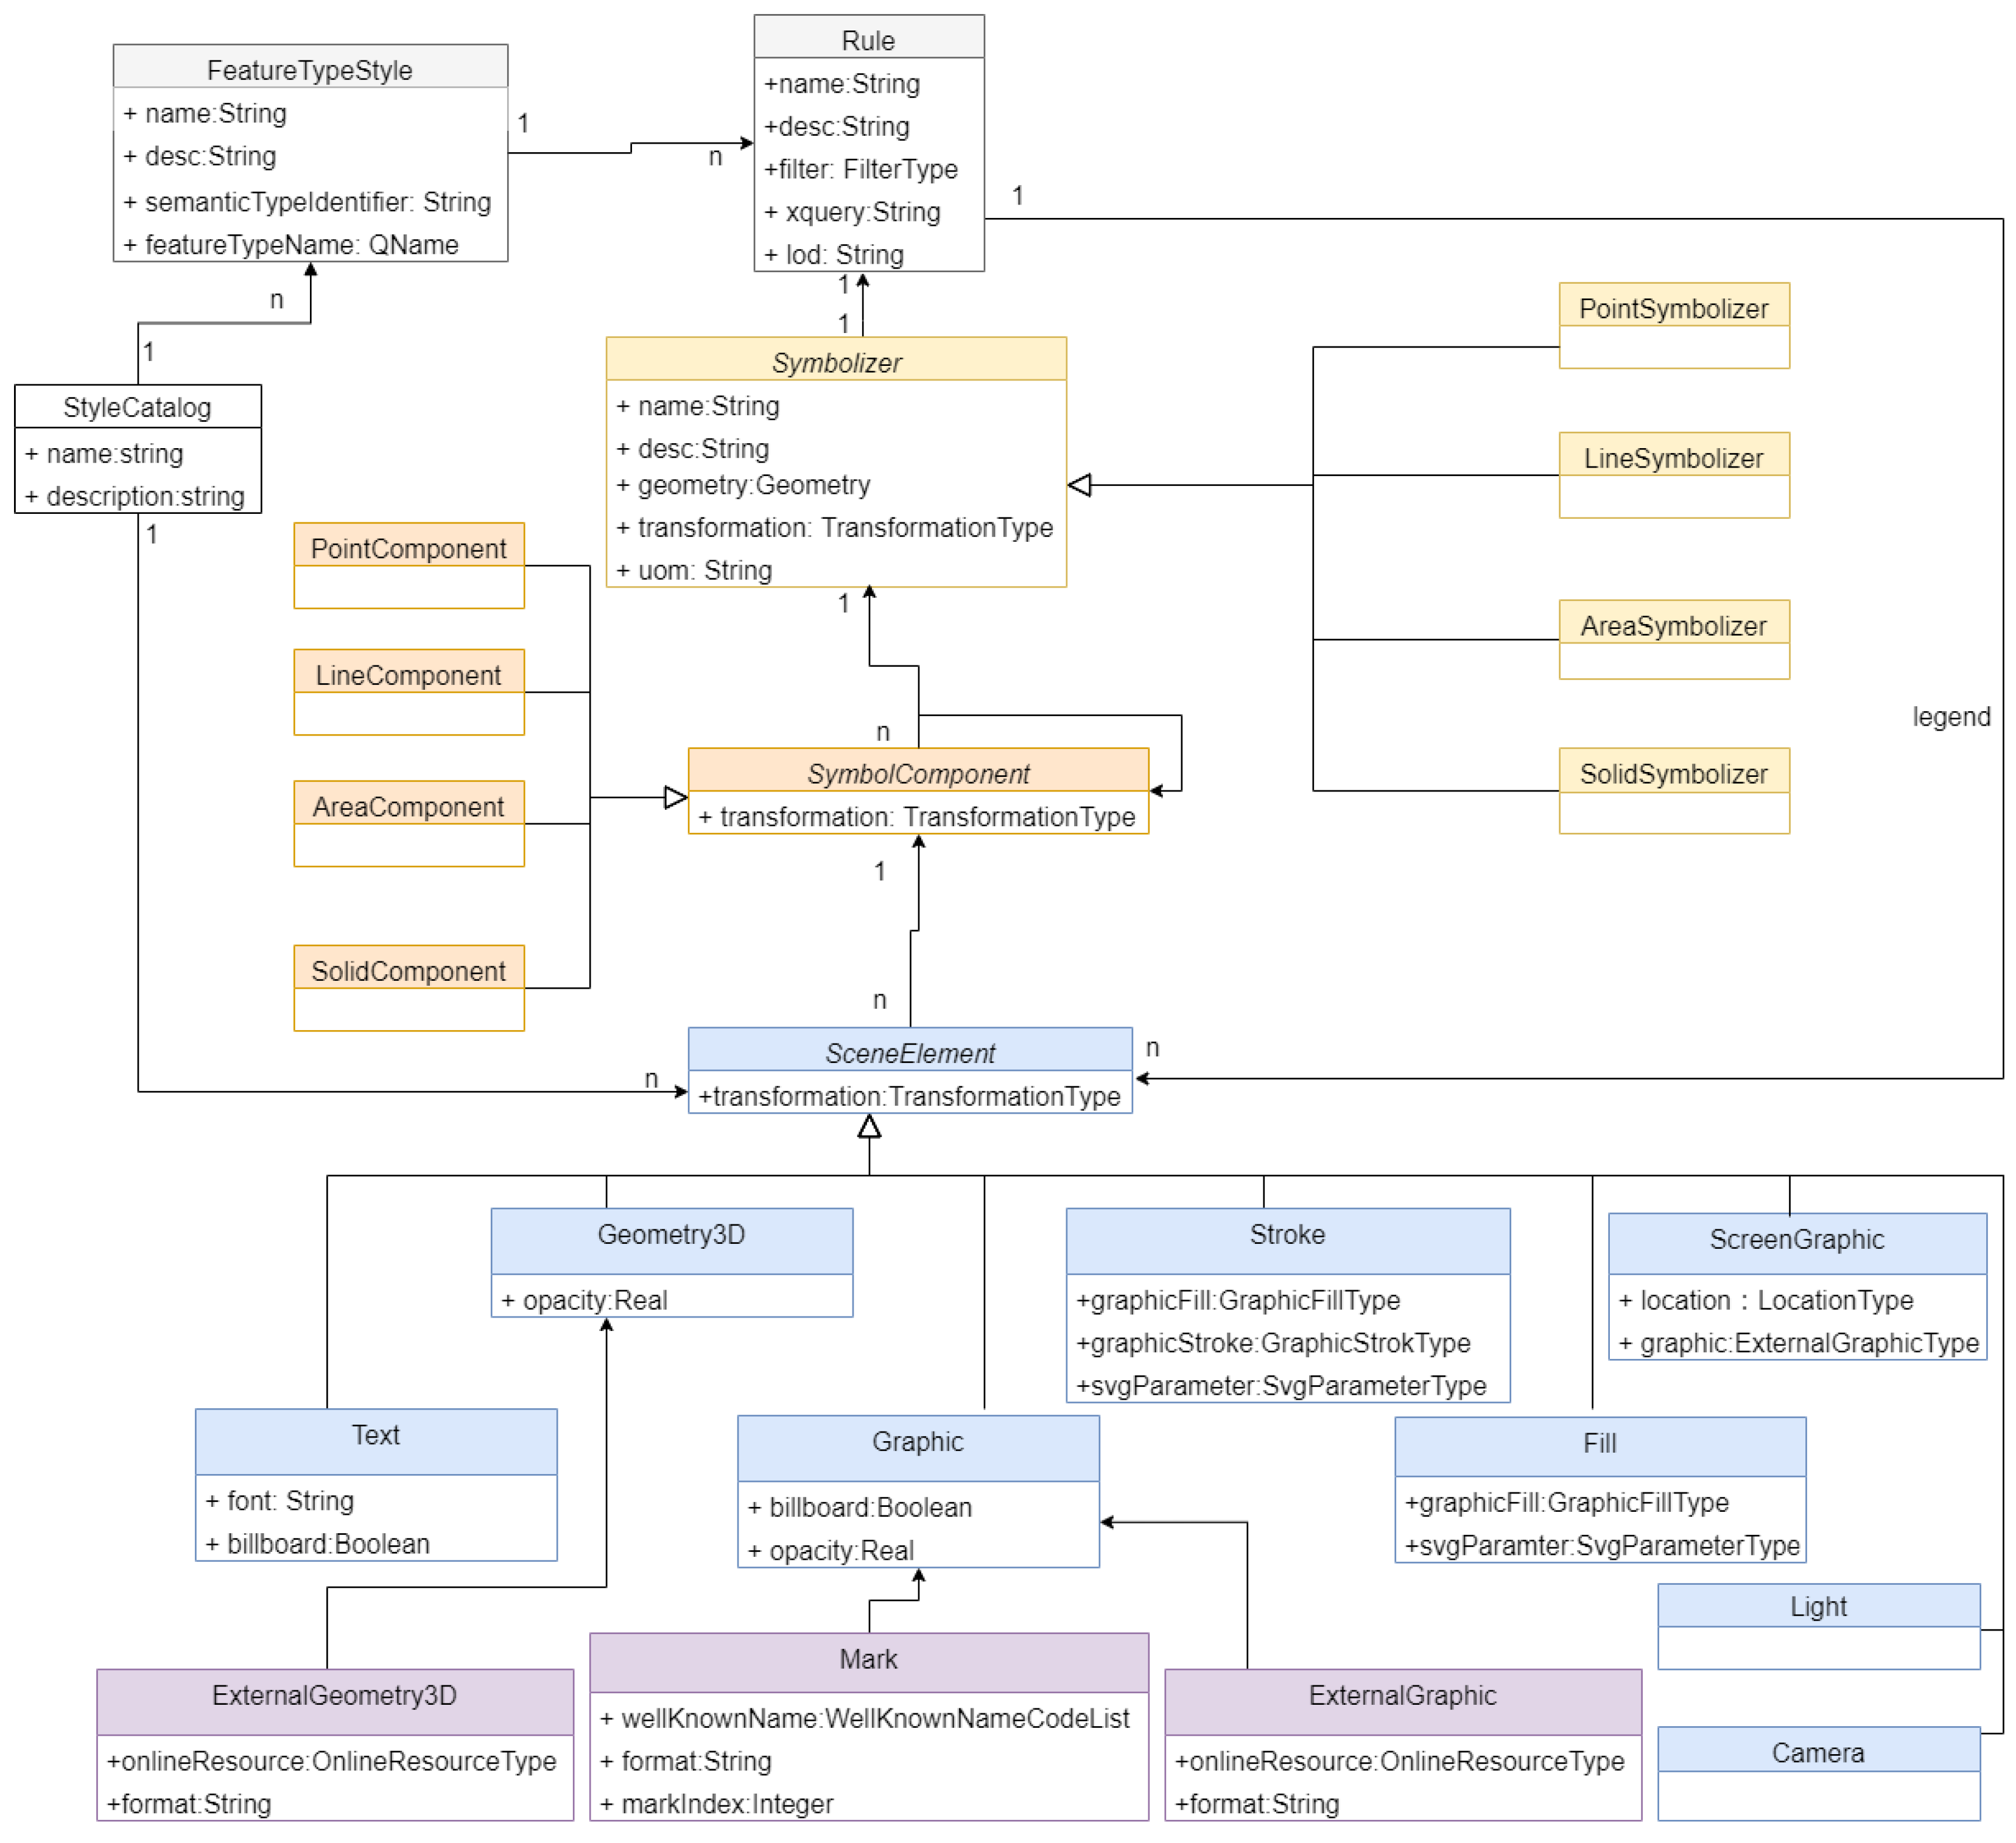
We designed a conceptual 3D SE module and demarcated its encoding in an XML schema definition (XSD).
Figure 1 shows the simplified Unified Modeling Language (UML) class diagram of the 3D SE module. We tested and improved the model multiple times during the development to ensure that it can precisely depict common 3D cadastre symbolic rules. The proposed 3D SE module of the DCM mainly links with the non-photorealistic design based on map primitives, aiming for a static presentation. The main idea behind the model design is to separate the symbolizer with its symbol component and to differentiate the symbol component from the scene graphic element. We also introduce classes and types according to some 3D cadastre mapping specialties. As illustrated in
Figure 2, we introduce
SemanticTransformation for the 3D boundary explosion and
Unbounded3DStroke for the unbounded 3D space with parameterized vertical line components. The class name in the model is kept close, if possible, to those in ISO 19117, OGC SE, and Bocher and Ertz’s model [
30].
In the proposed 3D cadastre DCM, the symbolic rule is organized by
FeatureTypeStyle class. Each
FeatureTypeStyle instance can contain one or multiple instances of
Rule class. Each
Rule instance, which encodes a symbolic rule, specifies how the features in the DLM are filtered and how the symbolizer, symbol component, and scene elements are settled and interconnected. The filter in the
Rule class implements OGC filter encoding or XML Query to control the DLM features selection. Since multiple rules can be applied to the same set of features, this model has the capability of multi-representation. The proposed SE module provides LOD tags for each representation, so the 3D scene creating application can selectively apply rules by their LOD tags. However, the explicit map generalization mechanism is not included. The dynamic design, such as the automatic viewport control [
56], and the interactive highlighting [
57] are not included. The proposed 3D SE conceptual model may lead to many encoding choices, such as XML, JSON, or a relational database schema. In this research, we translate the conceptual model to XSD and encode the proposed SE module in XML files with a similar style of OGC SE encoding. The cartographer who is familiar with OGC SE could easily understand the SE file and may easily transfer the applications at hand to support the new model.
The proposed SE module can express a large portion of the existing 3D cadastre symbology features for the 2D parcel, 3D bounded space, and 3D unbounded space. For example, a
SolidSymbolizer class represents the symbolizer of a bounded 3D legal space. Its symbol component could contain the area representing its boundary faces, the line representing the edge of its boundary faces, and the point representing the corner points of the boundary edge. The point component can be a cube solid or a sphere. The SE module only records the symbolic rules demarcated by the designer. It has not yet included the detection and resolution mechanics of the graphical conflicts, like that proposed by Neuville et al. [
58].
Figure 3 is a snapshot of a 3D scene created from a virtual scenario for demonstration.
Figure 4 shows the XML encoding of one symbolic rule used in this scene. This demonstrative virtual scenario is based on the Chinese urban cadastre and contains 2D land parcels and private 3D building legal spaces. The DLM employed is CityGML-LADM encoded cadastre exchange data, which contains the geometric and semantic cadastre information. In this 3D scene, the design employs multiple visual variables for the same attribute to strengthen the readers’ impression. The color hue of areas, the color hue of edging lines, and the shape of the vertex points together encode the difference between the 2D land parcel (gray areas, pink boundary lines, and cube vertices) and the 3D building legal space (dark blue areas, red boundary lines, and circle vertices). The fourth floor of this building, which belongs to a certain owner group, is highlighted with a vertical offset of the solid symbolizer, an outer offset of the area symbol component, and the pyramid vertex point component. The scene also contains a 3D legend demonstrating the direction of the three axes.
4.2. 3D Graphic Content Module
Explicitly describing the cartographically enriched 3D scene is valuable, as it enables the interoperation of the cartographically enriched cadastre 3D scene. The GC module of the 3D DCM is graphically oriented and stores all scene elements. It should readily be supported by a large amount of visualization and rendering platforms.
Since creating an ad hoc 3D graphic content module may not be readily supported by current 3D visualization platforms, we decided to employ existing non-proprietary 3D asset formats as the GC module encoding. We evaluated obj (ASCII encoded), COLLADA, X3D, and Keyhole Markup Language (KML) by their geometry capabilities, 3D scene information, and acceptance by visualization platforms. The comparison shows that the X3D format provides the richest features and has already been used for 3D scene encoding in a tentative 3D DCM [
25] and for 3D cadastre visualization [
27]. However, X3D is not supported by some key commercial visualization applications, such as Google Earth and Cesium. On the other hand, obj format lacks some of the necessary scene information, such as lighting. Finally, we decided to employ COLLADA and KML for GC module encoding. COLLADA has been accepted as an ISO standard and is widely supported by 3D content creation platforms, rendering engines, interactive 3D visualization platforms, and geospatial 3D platforms. As a digital asset exchange model, it enables the expression of common 3D graphic contents and 3D scene settings. We also tested KML, which provides a structural geo-spatial 3D scene description and can import COLLADA 3D objects. One advantage of COLLADA and KML is that they can be effortlessly tiled into Cesium 3D tiles to enhance performance. It is worth highlighting that the feature declared in COLLADA and KML may not be fully supported by visualization and content creation platforms. For example, Google Earth can only display the triangle and line primitive defined in COLLADA.
4.3. Supporting Applications
We constructed two programs to support the DCM-based visualization pipeline: a symbol design program to assist designers’ designing, encoding, and sharing of symbolic rules, as well as a content creation program to automate the cartographic enriching process. The symbol design program provides a human–computer interface by which cartographers can set the desired symbol design attribute and compose symbolic rules with on-the-air 3D scene feedback. This program can also read and encode 3D DCM SE files.
Figure 5 is a snapshot of the symbol design program. On the other hand, the 3D graphic content creation program, which is built on FME, automatically converts the 3D cadastre DLMs to cartographically enriched 3D scenes in COLLADA or KML format. The mechanism of symbol construction and geometry transformation is hardcoded in the program. It translates some of the scene elements, such as stroke, to a boundary-represented geometry realization in order to ensure that these elements can be displayed evenly in mainstream visualization platforms. The content creation follows the order of the symbolic rules, so the graphics created with the posterior rules will overlay those with the anterior rules.
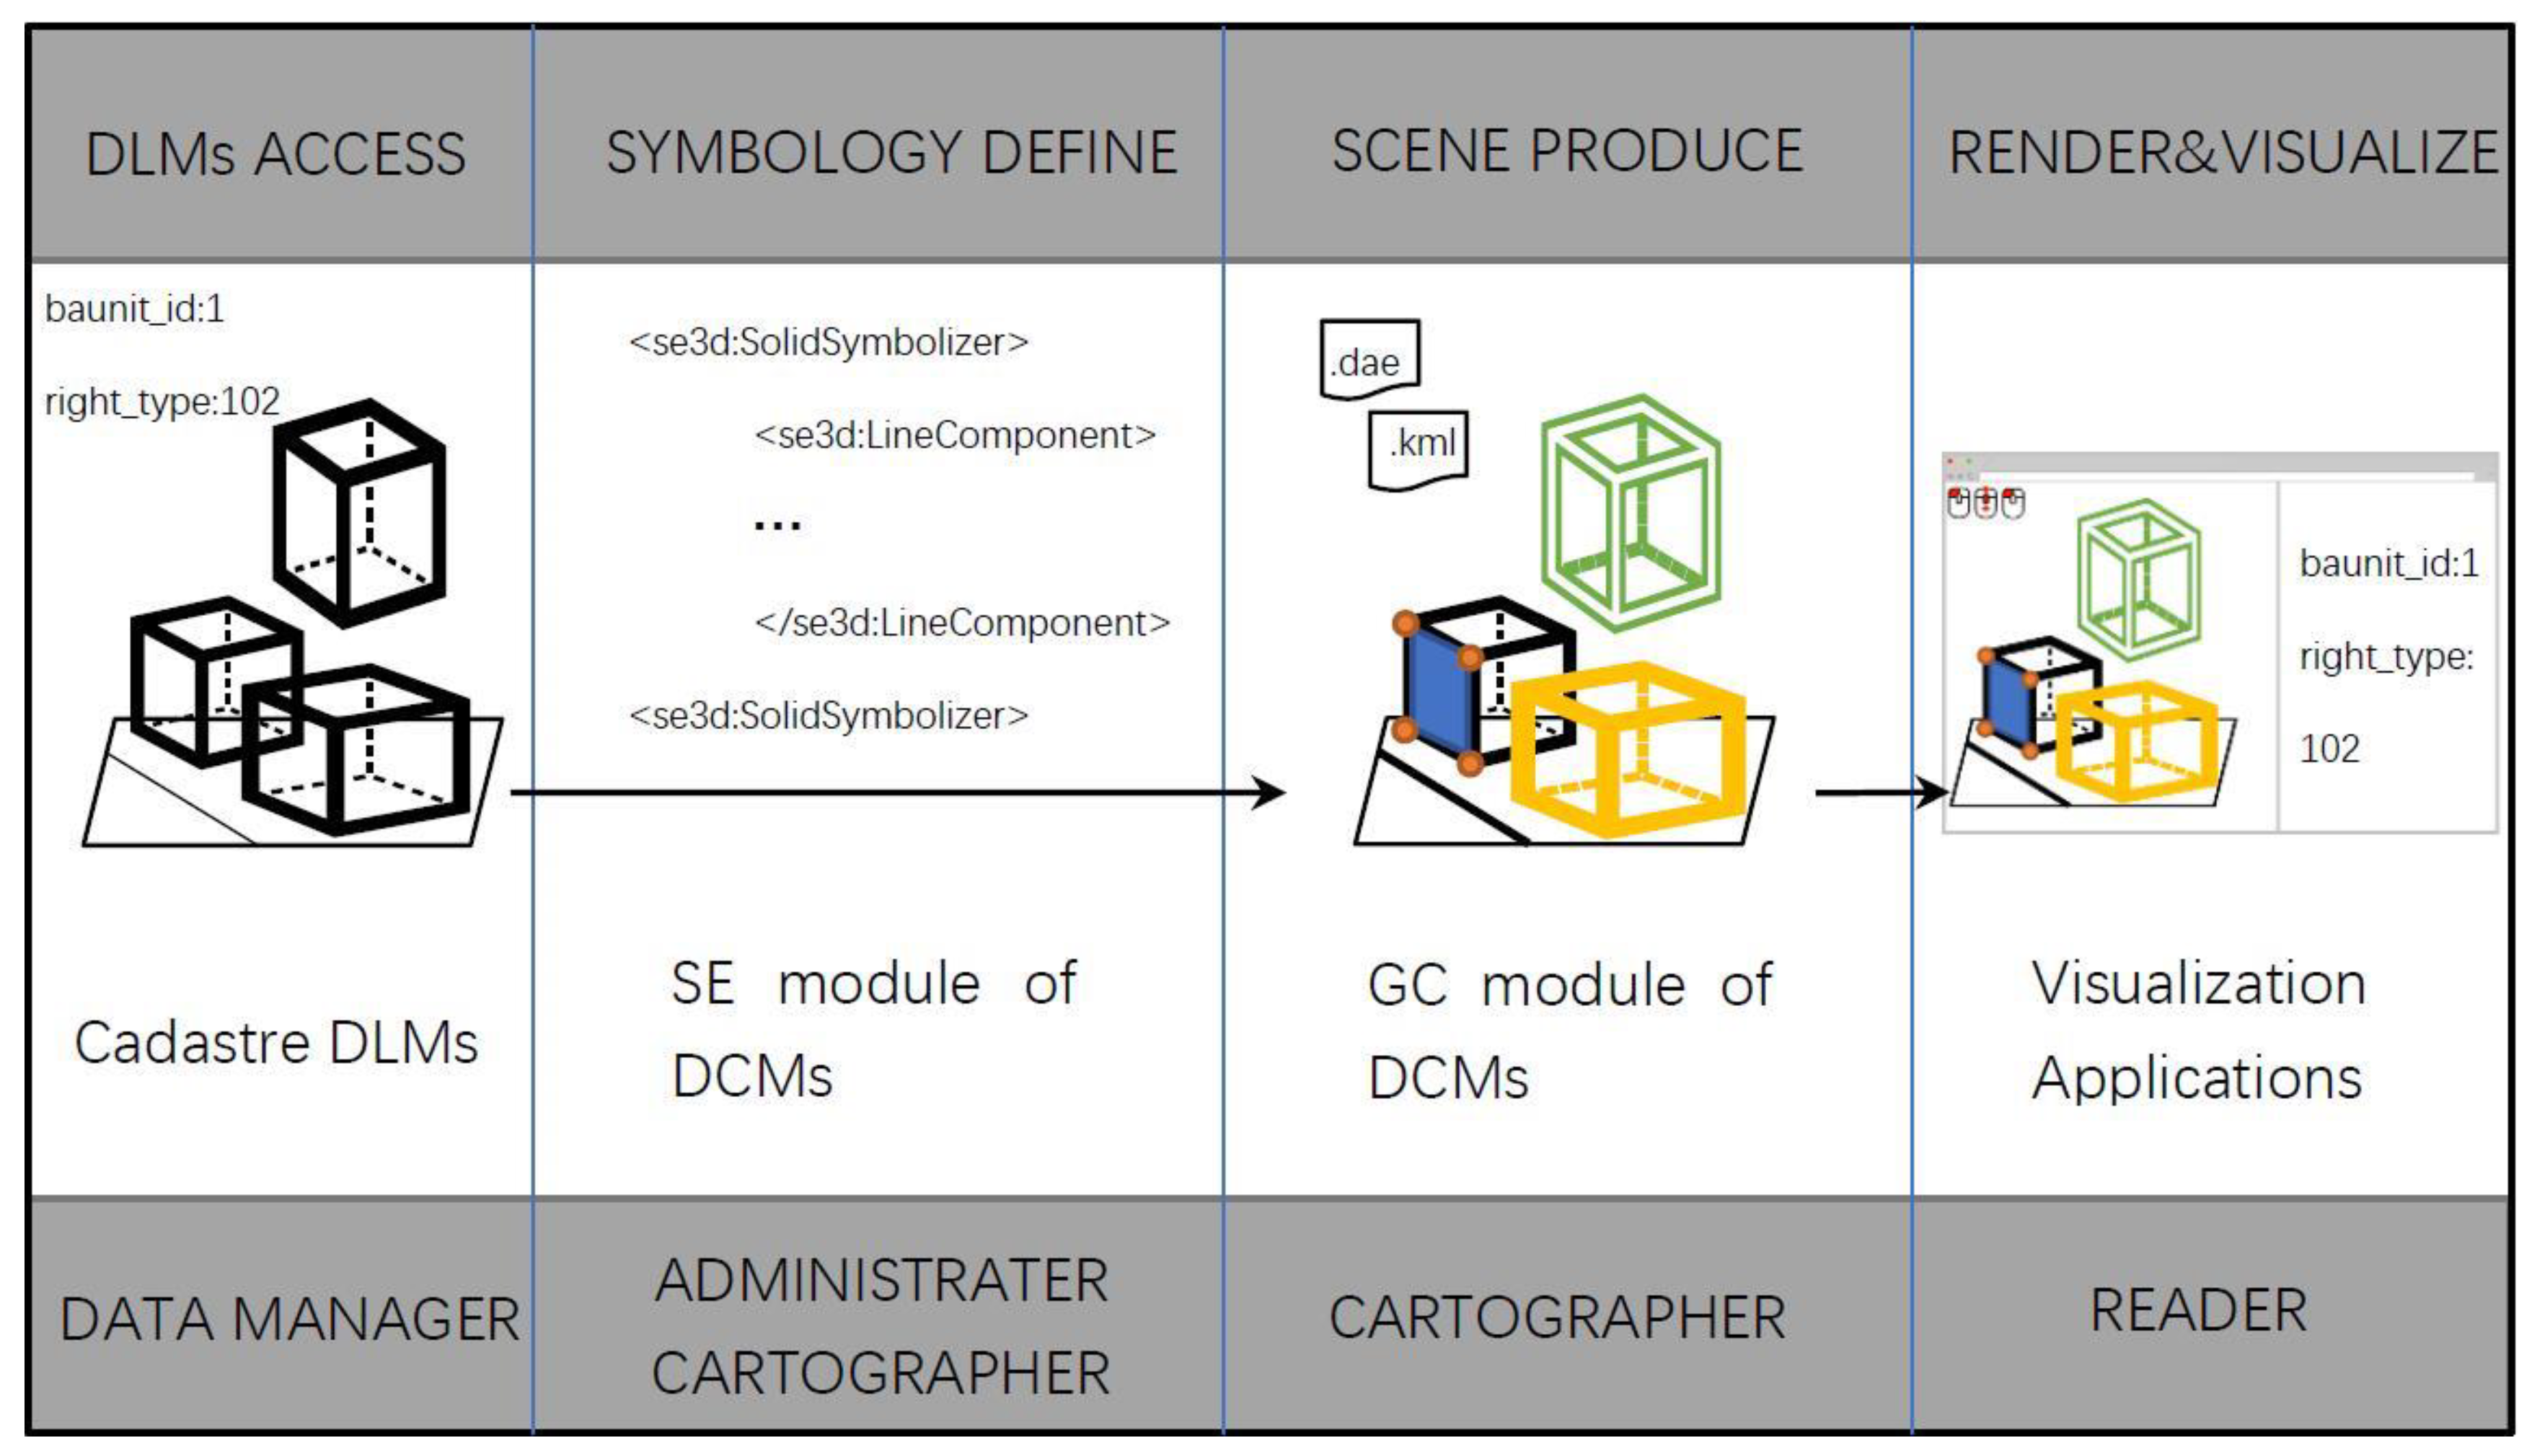
4.4. DCM-Based Cadastre Visualization Pipeline
With the help of the supporting applications, the proposed DCM could be embedded in four parts of the 3D cadastre visualization pipeline: the DLM access, symbology definition, 3D scene creation, and content display. As illustrated in
Figure 6, each part involves different user groups. First, data managers provide the DLM-encoded 3D cadastre raw data. Based on the 3D cadastre DLM, cadastre managers together with cartographers may use the SE module of the DCM to regulate symbolic rules. Cartographers may then cartographically enrich 3D cadastre DLMs and create 3D scenes following the regulations demarcated in the DCM. The 3D scenes are encoded in the GC module of the DCM. Finally, readers display the 3D graphic content on different visualization platforms and in multiple devices with a similar style.
In this visualization pipeline, the 3D cadastre DCM is the medium through which the portrayal information is transmitted between each step, providing interoperability to all the stakeholder groups and the supporting applications. It may enable designing, enriching, diffusing, and rendering systems to integrally work together and by this means provides an unambiguous manner of cartography-related information sharing and cooperation.
5. Applicability Evaluation and Results
The applicability evaluation methodology employed in this work is qualitative proof-of-concept user testing. We invited six previously interviewed cartographers to learn, practice, and evaluate the DCM-centered 3D cadastre mapping process and 12 previously interviewed cadastre readers to evaluate the mapping result. Before the test, the participants had limited experience with the DCM-based visualization pipeline and XML encoding. All user testing was carried out remotely in their own office. The test documents, data, DCM files, and questionnaires were transferred through the internet. The test is based on the Chinese urban cadastre and is organized around three 3D mapping tasks: the rule-based and automatic cartographic enrichment, symbol design cooperation, and 3D scene diffusing.
All the cartographer participants were required to describe two pre-defined styles by the SE module of the proposed DCMs with the help of the symbol design program. Each of the pre-defined styles can be expressed by a set of symbolic rules encoded in an XML encoded SE file. They then employed the content creation program to automatically create COLLADA and KML encoded cartographically enriched 3D scenes from five LADM-CityGML-based and XML-encoded 3D DLMs. Among these DLMs, two are urban cadastre scenarios in Anhui Province, China, one is an urban cadastre scenario in Zhejiang Province, and two are virtual urban cadastre scenarios. The SE file and 3D scenes created by the participants were then sent back via the internet for correctness validation.
- 2.
Symbol design cooperation
We carried out an experimental design project. Four cartographer participants were grouped into a single design team to create a usable symbology style for condominium scenarios in the Chinese urban cadastre. During the design process, each group member occupied a specific part of the symbol design and compiled a DCM SE file accordingly. All these cartographers communicated symbolic rules with other group members using SE files. By a centralized 3D DCM SE file with reference to these distributed SE files, the partial designs could be merged seamlessly and updated independently. When the design was stable, the participants used the content creation program to automatically create a series of 3D scenes by referring to the centralized 3D DCM SE file. These 3D scenes were then transferred and evaluated by all the group members for feedback.
- 3.
3D scene diffusing
The static cartographically enriched 3D scenes, which were created in the previous two tasks and encoded in both KML and COLLADA, were published online. 3D Portable Document Format (PDF) files of the 3D scene were also provided for the reader who could not install a 3D visualization application. The cadastre reader participants were invited to download these files and visualize them in interactive visualization applications. They then evaluated the visualization result and filled out an online questionnaire concerning their satisfaction concerning the visualization requirements 1–5. Due to the data availability, the information concerning the physical counterpart of 3D legal spaces was not available. As a result, the sixth visualization requirement was excluded from the test.
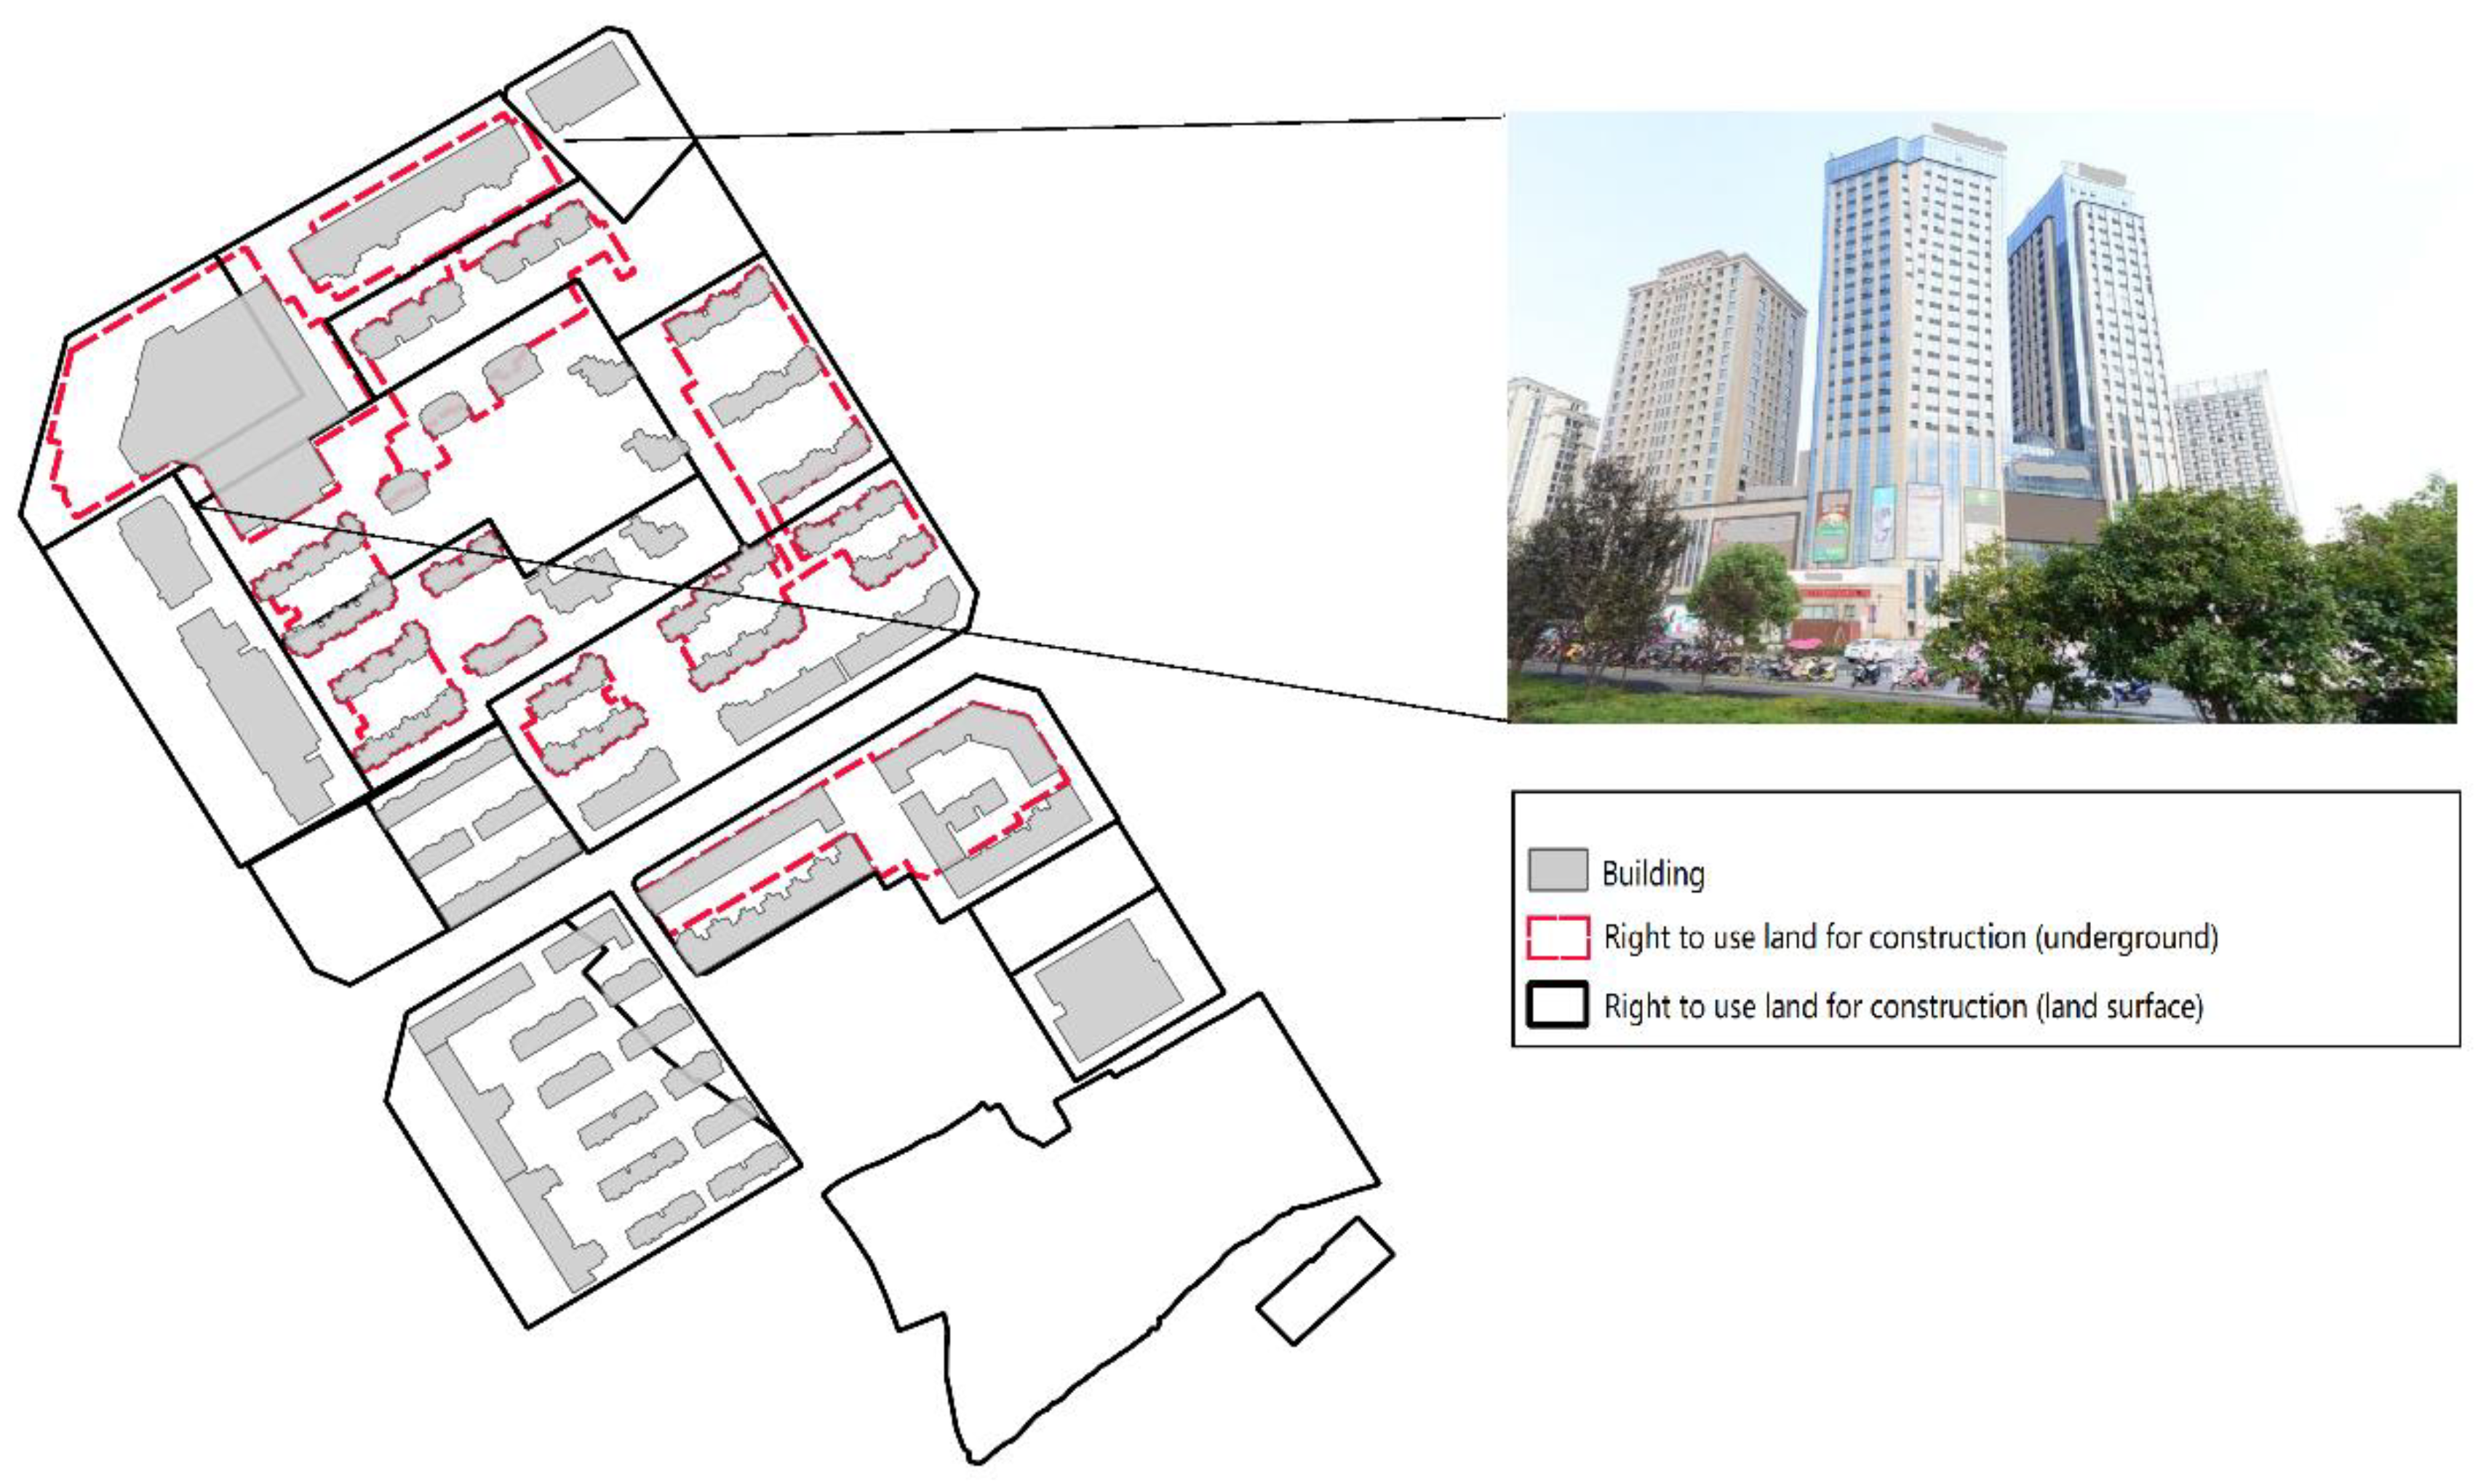
Figure 7 illustrates the 2D plot of a real urban cadastre scenario that was used in this research step. The selected scenario is at the Chinese urban cadastre sub-regional level. It involves the right to use the land for construction established on the land surface and under the surface. The right established under the land surface may not necessarily be confined to those established on the land surface. In this scenario, the 3D legal space is established based on the ownership right of buildings with residential, commercial, and office usages. Some buildings cross over several land parcels that are connected to the same party. This issue stems from the old registration system. The DLM employed is cadastre geometric and semantic data that is encoded in a CityGML-LADM exchange format.
Figure 8 illustrates a cartographically enriched 3D scene of this scenario. The DLM and DCM involved in this scenario are freely available for close examination at dcmexamples.3dcadastre.com.
Table 2 summarizes the main design rules applied. The visualization design addresses the visualization requirements 1–5.
The validation showed promising results: the participant could effectively achieve the three tested tasks. Over 100 cartographically enriched 3D scenes were created during the validation process. Using the proposed 3D DCM to achieve these tasks supports the idea that the 3D cadastre DCM-based visualization pipeline is applicable and beneficial. During the test, the symbolic rule and 3D scene related information were interchangeable. The visualization results in different platforms showed no conflict with the pre-defined symbolic rules. Furthermore, the cartographer participants clearly expressed that the DCM-based mapping paradigm was preferable to manually crafting the design and 3D scene. The twelve cadastre users recognized that the visualization results created by the DCM centered pipeline were generally satisfactory, and Visualization Requirements 1–5 were fulfilled.
The proposed DCM and visualization pipeline have deficiencies. First, the 3D annotation rule is not included in the current DCM. There are both theoretical and practical obstacles to the encoding of annotation design. For the theoretical obstacle, there is limited knowledge about the 3D cartography annotation primitives. For the practical obstacle, COLLADA lacks the direct support of 3D annotations, and the KML’s annotation mechanism may not fully satisfy dynamic annotation placing and selective presenting. Second, the same cartographically enriched 3D scene encoded in a 3D DCM may still present perceivable differences in different 3D visualization platforms due to different rendering and display settings. These settings are not yet included in the proposed 3D cadastre DCM.
6. Discussion
This research was tightly organized around the above-stated research questions. For the first research sub-question concerning the DCM design, we first collected the 3D cadastre mapping design features and proved that the existing general-purpose DCMs could not model these features well. As a result, we designed a new DCM with respect to the 3D cadastre visualization requirements and design features. For the second sub-research question concerning the added value of the DCM-centered 3D cadastre visualization pipeline, the proof-of-concept applicability evaluation of this pipeline in the Chinese urban cadastre context confirmed that it enables design cooperation, rule-based and automatic 3D cartographic enrichment, and easy 3D scenes diffusing. The visualization result fulfills a large portion of the map reader’s essential requirements and maintains a similar style in different platforms. In sum, our result demonstrates the applicability and added value of the DCM and the DCM-based visualization pipeline for 3D cadastre mapping.
This work validates a new 3D cadastre mapping paradigm that explicitly separates the cadastre modeling into two parts with different data models: a DLM for reality modeling and a DCM for portrayal modeling. Though this paradigm has presented in a few 3D cadastre prototypes [
3,
20], it has not yet to our knowledge been explicitly investigated and linked to a cartographic model. Compared with the cadastre mapping solutions that mix a DLM with graphic content [
23,
24], the main advantages of using a standalone DCM are a finer portrayal control, a more flexible implementation, and better content creation and diffusion performance. The proposed 3D cadastre DCM together with the existing 3D cadastre DLMs could provide interoperability for the entire lifecycle of 3D cadastre data gathering, managing, and mapping, benefiting cadastre-related software development, system integration, and cost reduction. The proposed DCM model also paves the way for 3D cadastre-related portrayal data transparency, mapping service, and even mapping VGI.
The proposed DCM may also provide cadastre administration and legal professionals with better control of the mapping process and 3D scene distribution. The administration and legal community can now maintain sets of explicitly DCM-encoded statutory symbolic rules and uniform 3D scene encoding to standardize the 3D cadastre visualization workflow, style, and result, thus promoting a consistent 3D cadastre visualization style for both professional and public readers. The separation of a 3D cadastre DCM from a DLM also introduces a mechanism of cadastre data protection. The cadastre manager can enable the distribution of the pre-calculated and cartographically enriched 3D DCM to certain groups of users while hiding the original DLM, which is often protected under privacy restriction or is the property of a survey company.
This paper is one part of the ongoing 3D portrayal modeling development in the geospatial domain. It advocates detaching the portrayal model from the semantically rich 3D geospatial model for better portrayal interoperability and cartography automation. It is important to distinguish the 3D portrayal model from the 3D model presented in [
8,
9]. The former is a schema that structurally describes the information involved in the cartographic enrichment of original data. On the other hand, 3D modeling represents the workflow and the result of a 3D scene creation. The DCM proposed in this study is independent of content-creation or visualization platforms. Compared with other application-independent 3D DCMs [
32,
33,
34], the highlights of our DCM design are its capability of depicting the compound and nested 3D symbol, the introduction of semantic transformation, and the inclusion of the graphic content encoding. Moreover, the research reported in this paper engages cartographers, administrators, and public readers of the 3D cadastre map for the requirements collection, model feature feedback, and empirical user test.
The proposed 3D DCM and the corresponding visualization pipeline are designed ad hoc to support the 3D cadastre mapping of the Chinese urban cadastre. On the other hand, 3D cadastre mapping is an ideal testbed. Its practitioner has a long tradition of using the formalized and regularized symbology, its portrayal employs semantically rich 3D cadastre datasets, and the large quantity of its 3D scenes calls for automated cartography enrichment. Considering that other application domains of 3D mapping may encounter similar visualization requirements and challenges as those of 3D cadastre [
7,
8], this paper could be inspiring and may contribute valuable information in that regard.
The research described in this paper serves mainly as a proof of concept. It is the first stage of 3D cadastre DCM design and implementation in the Chinese urban cadastre context. The development of the proposed 3D DCM takes advantage of the existing DCM developments and exploits researchers’ experience, which may inevitably contain subjective design decisions. Readers can develop their own SE module and choose a GC module encoding format according to their specific needs and convention. To gauge the applicability of the DCM-based cadastre visualization pipeline, this study employed qualitative proof-of-concept user testing with 18 participants. However, the number of participants was still limited, and the sampling method was convenience sampling. This may cause biased results concerning the visualization requirement, DCM design, and visualization satisfaction.
7. Conclusions
The research described in this paper addresses the interoperability problem of 3D cadastre mapping by providing a 3D digital cartographic model solution with a new model design, two supporting applications, a DCM-based visualization pipeline, and the corresponding applicability evaluation with potential cartographers and readers. The empirical result of qualitative proof-of-concept user tests shows that the proposed DCM and the DCM-centered visualization pipeline is applicable and beneficial to 3D cadastre mapping practices. The DCM-based visualization pipeline is a novel 3D cadastre mapping paradigm. It provides a mechanism to explicitly and unambiguously describe the 3D cadastre portrayal-related information and by this means enables rule-based automatic mapping, design cooperation, and scene diffusion. This new paradigm also facilitates mapping management, data protection, and portrayal services. To our knowledge, this work is the first example of explicit 3D cadastre DCM research. Moreover, the proposed DCM design extends the existing experimental general-purpose 3D DCM to meet the needs of 3D cadastre visualization.
The 3D cadastre DCM requires further refinements. We plan to improve the 3D cadastre DCM by encoding 3D annotation, establishing fine rendering control, introducing new graphic content encoding methods, and embedding the DCM in OGC 3D portrayal services. A graphic conflict resolution mechanism could also be a valuable further investigation direction. Newly developed open-source 3D formats such as i3S and compact transmission format glTF are potential candidates for 3D graphic content encoding formats. Furthermore, following the implementation and recursive optimization process of a DCM-based pilot 3D cadastre visualization system in China, we plan to invite more professional and public research participants. This is also an education process through which the potential designer and user becomes familiar with 3D cadastre, 3D cadastre maps, and the DCM-based visualization pipeline. The development of a 3D cadastre DCM can also lead to interesting future research such as 3D cadastre mapping services and regulations.


