Abstract
In central Italy, particularly in the Umbria-Marche Apennines, there are some complete, high-altitude weather stations, which are very important for assessing the climate in these areas. The mountain weather stations considered in this study were Monte Bove Sud (1917 m.a.s.l.), Monte Prata (1816 m.a.s.l.) and Pintura di Bolognola (1360 m.a.s.l.). The aim of this research was to compare the differences between the precipitation measured by the rain gauges and the data obtained by satellite using the IMERG algorithm, at the same locations. The evaluation of possible errors in the estimation of precipitation using one method or the other is fundamental for obtaining a reliable estimate of precipitation in mountain environments. The results revealed a strong underestimation of precipitation for the rain gauges at higher altitudes (Monte Bove Sud and Monte Prata) compared to the same pixel sampled by satellite. On the other hand, at lower altitudes, there was a better correlation between the rain gauge value and the IMERG product value. This research, although localised in well-defined locations, could help to assess the problems in rain detection through mountain weather stations.
1. Introduction
The aim of this study is to analyse rainfall and snowfall in mountain areas, and in particular to investigate the problem of the probable marked underestimation that affects high-altitude rain gauges. In fact, discrepancies have often been found between the data obtained from the interpolation of weather stations at altitudes below 1000 m in mountainous areas and the precipitation measured at higher altitudes [1,2]. Nevertheless, these differences, even when they are considerable, have not been sufficiently investigated in order to understand the possible malfunctions of rain gauges or to see whether it actually rains less than expected in mountain areas. Previous studies have shown that, in general, there are frequent losses of precipitation from rain gauges due to wind speed, which produces phenomena such as: snow blowing, splashing of rain drops, rain gauge wetting and evaporative loss [3,4]. However, in the mountain environment there are greater problems than in other places in collecting precipitation data; for example, it has been shown that, in some cases, wind speed can result in an underestimation of rainfall and snowfall, by up to 80% if the speed is greater than 10 m/s [5,6], while rain gauge wetting and rain drop splashing are negligible and common to rain gauges, even at lower altitudes [4]. Important errors regarding the amount of precipitation in mountain areas can produce problems for all related research. For example, a correct estimation of precipitation is necessary, not only for the evaluation of the quantity in order to better define an area climatically, but also to evaluate the actual recharge to which the reservoir is subjected [7]. It is also very important to determine snowfall, both for the assessment of groundwater recharge and for the subsistence or possible existence of ski facilities [8]. Recently, increasingly accurate and reliable data are becoming available from algorithms that interpret satellite images. A new programme based on the Global Precipitation Measurement (GPM) satellite constellation was launched in 2014 and uses the Integrated Multi-satellite Retrievals for GPM (IMERG) algorithm to obtain the most correct precipitation values possible. As a result, many researchers rely directly on the use of satellite data to estimate precipitation in a given area [9,10]. However, IMERG data are much more often calibrated using data from reference weather stations, appropriately validated by analysing the reliability of the satellite product [11]. Thus, it seems that field measurements still allow for greater accuracy where available and especially are measurements at the precise point of interest; in addition, weather stations provide the collection of other climate variables that could not otherwise be estimated without them. In some places, satellite data are used instead of rain gauges due to the poor reliability of the latter and because of the lack of them [12]. In some cases, attempts have been made to assess the differences between mountain rain gauges and satellite observations [13]; it is usual for the current literature to make an assumption regarding the reliability of rain gauges, which is not always correct, and therefore deserves to be studied in order to resolve any measurement errors. As a result, the current state-of-the-art is ambiguous with regard to an accurate understanding of the problems of rain gauges in high mountain weather stations or possible discrepancies in satellite data [14,15]. Furthermore, in order to better assess the reliability of satellite estimates and rain gauges, it would be very important to perform interpolations, taking into account validated and reliable rain gauges, even if they have a lower altitude. In one study, the performance of satellite data, improved through the use of interpolation, was evaluated in order to achieve better levels of accuracy of precipitation data [16]. To conclude, the current state of the literature leaves unsolved problems in the case of mountain environments, both with regard to the correct estimation of precipitation by rain gauges and with regard to the reliability of satellite products for measuring rainfall. In this context, the present study has the ambitious objective of solving the problems affecting mountain rain gauges and IMERG data, evaluating the possible underestimation of both altitude-based interpolations and possible climatic variables at the same weather station investigated. The aim is to be able to better quantify rainfall by assessing any errors that plague rain gauges or satellite data in the mountainous areas of central Italy in order to provide a reliable estimate and a method of interpretation for future analysis in these environments.
2. Materials and Methods
2.1. Satellite Data
There are many types of satellite-derived precipitation products, among which one in particular, Integrated Multi-satellitE Retrievals for GPM (IMERG), was chosen for its good resolution, 0.1° × 0.1°, and the good results it has shown in the literature compared to other satellite products [17]. Satellite data were collected for this study from 2010 to 2021 through the use of the IMERG, from 2014 to 2021, and the Tropical Rainfall Measuring Mission (TRMM), from 2010 to 2014. The GPM is a constellation of 10 satellites, which uses an algorithm to obtain accurate estimates of precipitation over much of the Earth’s surface [18]. The GPM constellation initiated by National Aeronautics and Space Administration (NASA) and Japan Aerospace Exploration Agency (JAXA) includes many other space agencies around the world. The satellites are equipped with two data acquisition instruments, a dual-frequency precipitation radar (DPR) and a GPM microwave imager (GMI). The DPR is a radar that provides 3D images of the structure and characteristics of the precipitation, while the GMI is a radiometer with a conical scanner that operates on several channels and provides indications of the water content of the precipitation. The IMERG algorithm in its latest version (V06) was applied to all available GPM and TRMM data in order to make the record as long and reliable as possible (2000–2021). In this study, the latest version of IMERG, V06, dated March 2019, was used, which has a very high spatial resolution of 0.1° × 0.1° and a minimum time interval of 30 min. The IMERG data are pre-calibrated by the Deutscher Wetterdienst (DWD) Global Precipitation Climatology Centre (GPCC) in order to control data bias.
2.2. Weather Stations
Weather stations have historically been the first devices for the collection of climatic data on the ground and are still among the most reliable for most of the world. The weather stations that were taken into consideration for this research were: Monte Bove Sud, 13.19 E 42.91 N (1917 m.a.s.l.), Monte Prata, 13.21 E 42.87 N (1816 m.a.s.l.) and Pintura di Bolognola, 13.23 E 42.99 N (1360 m.a.s.l.) (Figure 1). The data from these three weather stations were obtained from the Regional Weather-Hydro-Pluviometric Information System of the Civil Protection of the Marche Region. The data from the above weather stations have a daily step and were collected from 2010 to 2020, as earlier data were not available. From these weather stations, data on precipitation, prevailing wind direction, wind speed and ground snow level were extracted because they could be useful for assessing possible problems in precipitation amounts related to other climatic variables. In addition, data from other rain gauges, 27 in total, (Figure 1) close to the three mountain weather stations under investigation were collected from the above-mentioned Institution’s database in order to obtain interpolations of rainfall in the area [1,19]. All weather stations have undergone a thorough data quality control process [20].
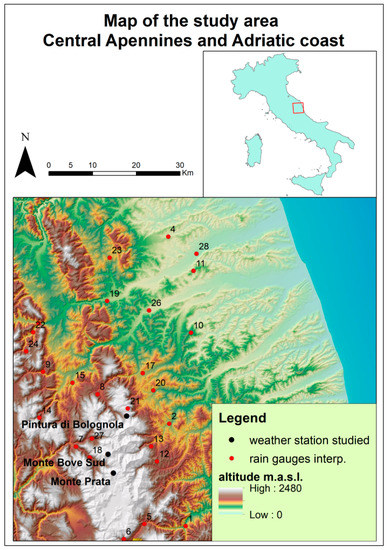
Figure 1.
Geographic map of central Italy; blue dot for the mountainous weather stations under investigation, red dot for interpolation rain gauges.
2.3. Comparison IMERG-Rain Gauges
From an operational point of view, the first step was the comparison procedure between the IMERG data and the rain gauge data of the three weather stations under examination. The comparison is based on a technique previously used by some researchers and is called point-to-pixel [5,21]; this technique takes the exact coordinates of some rain gauges and allows the acquisition of the rain gauge pixel data through the use of ArcGis 10.8 software. Then, depending on the chosen time interval, in our case the daily one, the gridded data corresponding to the rain gauge are extracted. A subtraction was carried out between the satellite and rain gauge observations, and the daily average difference was evaluated on an annual scale and for each month. Furthermore, using the snow level sensor located at each weather station studied, transforming snow cm into water equivalents, the data were compared with the rain gauge values and IMERG data. In addition, the difference in precipitation between IMERG values and rain gauge values was taken into account in relation to the daily average wind speed in m/s. The classes of average daily speeds were obtained by searching for a numerosity congruent with the significance level chosen for the survey, i.e., 95%. The methods to assess the appropriate sample size were the “sample size for one sample, continuous outcome” [22] and, to compare IMERG data with rain gauge data, the “sample size for matched samples, continuous outcome” [23]. Then, in order to investigate the discrepancies between the different rain gauges, an assessment of the prevailing winds and their speeds day-by-day was carried out, evaluating the precipitation for each class of values in order to identify any problems in rain detection. Subsequently, data from 27 validated weather stations with an altitude below 1400 m were interpolated. The method chosen was backward multiple linear regression [24], with annual precipitation as the dependent variable and five independent variables such as slope, exposure, altitude, distance from the sea and distance from the main ridge line [25]. This multiple regression model allowed the elimination of the independent variables that do not have significance (95%) in explaining variance and therefore do not improve the model, the F-test was decisive for the exclusion. The results were correlated with the IMERG satellite data to assess the difference between the interpolation and the value obtained from the IMERG analysis. Finally, a percentage increase was evaluated to make the rain gauge or IMERG data more reliable.
3. Results
3.1. Point-to-Pixel Analysis
The IMERG data were downloaded and then entered into the ArcGis 10.8 GIS software (GeoScene Information Technology Co. Ltd., Beijing, China), which allowed the correct coordinates of the three analysed weather stations to be identified and the satellite measured value to be extracted. The point-to-pixel procedure resulted in 10 years of daily IMERG precipitation data, also divided into rainfall and snowfall. The correlation of the daily IMERG data with the rain gauge data was then assessed using the Pearson correlation coefficient. The daily correlation coefficient between the IMERG data and rain gauge data showed a not very high correlation between them over 10 years. At the same time, the correlation between the monthly data and the annual data was also evaluated, as was that between the daily data for each individual year.
It is evident that the correlation is not very high in general; however, there are some situations where there is a very good correlation, as in the case of daily data of Monte Bove Sud (MB) in 2018, and situations where the correlation is particularly low, as in the case of Monte Prata (MP) in 2016 or Pintura di Bolognola (PB) in 2019 (Table 1). These correlation coefficients must be taken into account to deduce possible differences in the conditions that allowed these fluctuations to occur. In particular, these differences could be due to particular humidity conditions that make the measurement of satellite data less accurate, or there could be important winds along certain directions that affect the measurement by rain gauges, or large amount of snow, etc. The next step was to investigate both monthly and annual mean differences between IMERG and rain gauge data.

Table 1.
Correlation coefficient between IMERG and rain gauges data in the three locations: Monte Bove Sud, Monte Prata and Pintura di Bolognola.
First of all, from a graphical point of view, the annual data were analysed, which tended to show for the two weather stations at higher altitude (MB and MP) lower rainfall values than IMERG (Figure 1). On the other hand, in the case of PB, rainfall and satellite data were in better agreement, with very similar years and years alternating between higher rainfall measured either by rain gauges or by satellites (Figure 2). In particular, there is substantial agreement in the fluctuations between rain gauges and satellite data, with few discrepancies, probably signifying systematic background underestimation (Figure 2).
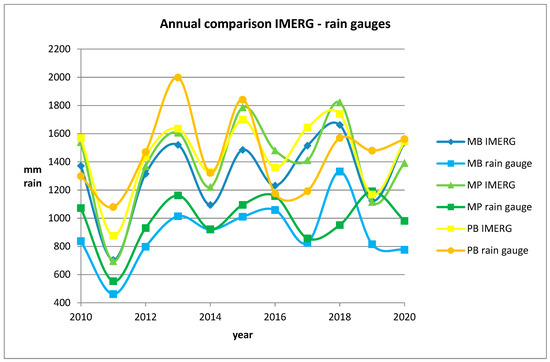
Figure 2.
Annual comparison between IMERG data and rain gauge data at the same locations: MB (Monte Bove), MP (Monte Prata), PB (Pintura di Bolognola).
3.2. Snowfall Differences
IMERG data and rain gauge data at the same locations show very high differences that have very large fluctuations between years and months (Table 2). It is also very interesting to assess the seasonal variations, which show important differences for MB and MP in autumn and winter, while for PB the seasons that differ most are spring and summer. This leads to two considerations. The first is that there are evidently errors on the part of one or both measurement methods, and the second is that the differences increase under certain climatic conditions. In order to assess whether snow days have an effect on the difference in precipitation between IMERG data and rain gauge data, all daily satellite precipitation data were selected and compared with rain gauge data on the same days. This showed an average annual snowfall difference from 2010 to 2020 of −73.8 mm for PB, 17.6 mm for MB and 16.4 mm for MP. As also shown above, MP and MB, also due to a similar altitude, have very similar differences from the IMERG data. Thus, in the case of PB, the snowfall measured by the rain gauge on the days reported by IMERG is greater than the satellite data. On the other hand, in the case of MB and MP, the snowfall from the rain gauges is in line with the IMERG data, even with higher amounts of precipitation detected by the satellite. In order to assess a possible underestimation of the IMERG and rain gauges, the daily snowfall level, measured daily using an ultrasonic sensor, was evaluated. The procedure took into account the theory that any increase in snow cover is due to snowfall; the water/snow equivalent ratio was considered to be 1:10, an average value proven in the literature, in the absence of direct detection [13].
Table 2.
Monthly and year-on-year average difference between IMERG data and data from analysed rain gauges; the unit of measurement is mm.
The calculation of water equivalents from the measured snow level shows a consistent underestimation of precipitation for both rain gauges and IMERG data (Table 3); however, in the case of the PB rain gauge, the difference is much less pronounced at 6.6%. This measured difference therefore leads to an underestimation of snowfall for both satellite data and rain gauges. Snowfall at these altitudes also has a decisive effect on annual precipitation averages, which are consequently underestimated.
Table 3.
Average annual difference (2010–2020) between snow level water equivalents (SLWE) and IMERG data and average annual difference (2010–2020) between SLWE and rain gauges data (RG); the values are given in mm (MB mm; MP mm; PB mm) and as a percentage of the annual average rainfall during the period 2010–2020 (MB%; MP%; PB%).
3.3. Wind Analysis
It was assumed that the failure to detect part of the snow or liquid precipitation could be due to errors induced by wind intensity, as highlighted in the literature [5,6]. Therefore, the difference in precipitation was assessed from both satellite data (IMERG) and rain gauges, in relation to different wind speeds. The wind speed variable was classified by merging contiguous integer values of speed in m/s, based on the statistical method “sample size for one sample, continuous outcome” to define the correct sample size to achieve the chosen objectives, which were 95% significance with an error of no more than 0.3 mm of rain. At the same time, the sample size between the two sets of IMERGs and rain gauges was evaluated using the “sample size for matched samples, continuous outcome” method with a 95% significance level, as well as a maximum error value of 0.2 mm of rain. Both sample size conditions were satisfied, so that differences between IMERG and rain gauges could be evaluated significantly at certain wind speed intervals.
Table 4 shows the common behaviour of the investigated mountain rain gauges as a function of different wind speeds. In particular, it is possible to observe that the trend of the IMERG data compared to those of the rain gauges is very similar, more pronounced in the case of MB and PB and less pronounced for MP.
Table 4.
Average annual difference (2010–2020) between snow level water equivalents (SLWE) and IMERG data and average annual difference (2010–2020) between SLWE and rain gauges data (RG); the values are given in mm (MB mm; MP mm; PB mm) and as a percentage of the annual average rainfall 2010–2020 (MB%; MP%; PB%).
It can be observed from the graph (Figure 2) that in the range from 7 to 20 m/s wind speed, the IMERG precipitation data increases, while those of the rain gauges increase less or even decrease. The differences seem to be very well correlated between the various measuring points; in fact, the Pearson correlation coefficient shows the following values: MB–MP is equal to about 0.85; MB–PB is equal to about 0.96 and MP–PB is equal to about 0.81. Thus, it can be seen that the pattern of the variation between the IMERG data and the rain gauge data is very similar between the three weather stations. In order to better understand the differences affecting the investigated weather stations, wind was also taken into account by observing the annual distribution of wind in percentage.
The prevailing direction is similar for MP and MB, correlation coefficient 0.67, while it seems to be significantly different for PB, which has approximately 0 correlation with the other two weather stations (Figure 3). In particular, the two prevailing directions for PB are W-SW and E-NE, while for MB and MP they are W-NW and S-SE. These differences are probably due to the exposure, which is equal to 278° for MP, 230° for MB and 246° for PB, but also to the geomorphology of the surrounding area. MB is somewhat shielded from the South and East by the northern part of the mountain itself, which reaches altitudes above 2000 m (Figure 4). In particular, much lower precipitation was observed at the MB rain gauge compared to the IMERG data, with daily mean wind speeds above 5 m/s for the E-SE (diff. of 2.5 mm per day) and SE-S (diff. of about 7 mm per day) directions. MP has a difference of 3.5 mm per day in the case of winds greater than 5 m/s blowing from the S-SE, while in the case of winds of the same magnitude, from the N-NE and W-SW, the rain gauge detects even more precipitation than the satellite, while for the other directions the observations are in agreement. PB has the same trend as MB, therefore with an underestimation of the rain gauge when the winds are stronger, especially for the N-NW direction (diff. of about 8 mm per day), but in general the precipitation measured by the rain gauge is higher than that measured by the satellite, compared to the other two weather stations investigated. The reason for these differences has been hypothesised to be the topography of the area, where both MB and PB are located on slopes, although with different percentages of prevailing winds, with very close and higher mountains on the north and east sides, which generates less precipitation, especially when there are strong winds. In the case of MP, it is located on a promontory within the Apennine chain, but the other mountains are at a sufficient distance not to cause significant shielding for the rain gauge (Figure 4).
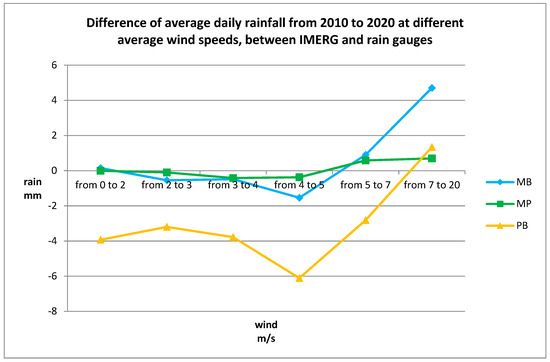
Figure 3.
Average daily rainfall from 2010 to 2020 at different average wind speeds (0–2; 2–3; 3–4; 4–5; 5–7; 7–20) for MB (Monte Bove), MP (Monte Prata), PB (Pintura di Bolognola).
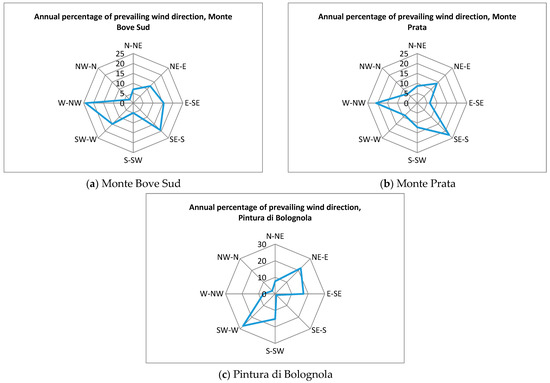
Figure 4.
Annual percentage of prevailing wind direction from 2010 to 2020.
Obviously, each case of each weather station has to be evaluated separately, but in the case of MB and PB, with the weather stations downwind for certain wind directions (Figure 5), it leads to an underestimation of the precipitation measured by the rain gauge compared to the IMERG data of about 30–50%. Obviously, although with the IMERG data there is less underestimation of the data from the high-altitude rain gauges, they cannot be considered completely reliable, as they probably also underestimate the real value of precipitation, as can be seen from the difference between the precipitation data of the PB rain gauge (at a lower altitude than the other two weather stations) and the satellite data.
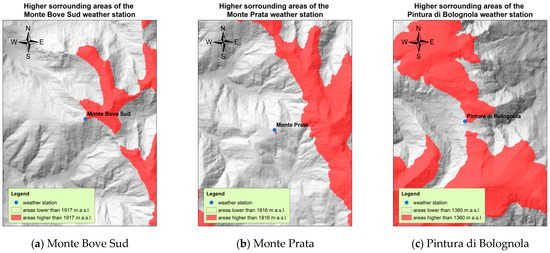
Figure 5.
Map of areas with higher altitude than the weather stations analysed.
3.4. Interpolation Comparison
In order to further assess the reliability of satellite-derived precipitation, IMERG data augmented with snowfall not detected by satellite were considered. These data were correlated with interpolations of rainfall data from validated and homogenised neighbouring weather stations at a lower altitude. This made it possible to evaluate the difference between the expected rainfall values and those measured by the satellite and corrected with the actual snowfall data. Backward multiple linear regression, chosen for the statistical analysis, made it possible to exclude independent variables that were not significant for the model. In particular, slope and exposure were excluded using the F-test because they did not add a further explanation of variance to the three considered factors of altitude, distance from the sea and distance from the main ridge. On average, the model annually, from 2010 to 2020, allowed for an explanation of variance of more than 50%, resulting from the adjusted R-squared value, which is a satisfactory value given the high variability of the precipitation parameter. The resulting model equation was used for interpolation at the three investigated weather stations and throughout the neighbouring territory, taking into account the continuous values of the independent variables on which the model is based (Table 5).
Table 5.
Cumulative annual precipitation for Monte Bove Sud (MB), Monte Prata (MP) and Pintura di Bolognola (PB), calculated through interpolation (MLR), IMERG data to which was added the real snowfall data (IMERG) and the data measured by the rain gauge (RG); x1 = altitude, x2 = distance from the sea, x3 = distance from the main ridge.
The IMERG data, to which the snowfall has been added, are much higher than those recorded by the rain gauge for both MB and MP; in fact, on average, the rain gauge records 500 mm less than the satellite data for MB and 400 mm for MP. On the other hand, PB shows a measured value about 160 mm lower than the IMERG satellite data with the addition of the detected snow. The interpolation data are much closer to the IMERG data with the addition of the snow detected than the rain gauges, both for MB and MP; however, for PB, the values from the rain gauge are higher than the interpolation result by about 200 mm and are less distant from the satellite values. In any case, it has to be considered that adding the corrected snowfall value to PB and the increased value in the case of winds above 5 m/s from the N-NW would reach values very similar to those that IMERG increased by the corrected snowfall value.
In any case, in order to statistically evaluate the closeness between the IMERG, MLR, and RG data, the standardised root mean square error (RMSSE) was calculated; RMSEE results showed that the IMERG and MLR values were closer than the RG and MLR values for the higher altitude stations MB and MP, whereas the values for the PB rain gauge were almost identical (Table 6).
Table 6.
Value of the root mean square error standardized (RMSSE) calculated on a monthly basis for Monte Bove Sud (MB), Monte Prata (MP) and Pintura di Bolognola (PB), calculated through interpolation (MLR), IMERG data to which was added the real snowfall data (IMERG) and the data measured by the rain gauge (RG).
4. Discussion
This research highlights and certifies critical issues in the detection of high-altitude precipitation that were previously only assumed to be possible. In particular, there is a difference between rain gauge data and IMERG satellite data; in the case of MB and MP, satellite data is significantly higher, while in the case of PB the satellite data is similar to the rain gauge data. In this research, we did not assume that rain gauges are reliable after appropriate data quality control procedures and useful for calibrating IMERG data [26,27], but tried to assess the weaknesses of both IMERG and rain gauge methods.
As a first step, it was decided to analyse the snowfall measured by the snow level sensors of the three weather stations studied, which revealed a serious underestimation of snowfall for satellite data and rain gauges. MB and MP have an underestimation of the snow amount compared to IMERG data of 13.4 and 15.6%, while compared to the rain gauge, there is a difference of 21.6 and 23.7%, respectively. On the other hand, Pintura di Bolognola has an underestimation of the snow amount of 11.2% for the IMERG data, while it is only 6.6% for the rain gauge. A certain degree of underestimation of rain gauges in the case of snowfall in high mountains is an established fact [28], and the underestimation percentages identified in this research are in agreement with what has been observed, for example, in northern Italy, in the Alps [29]. As explained in the results, the water/snow equivalent ratio was estimated based on existing literature, which may vary the rates of increase, but not substantially. It is significant to note that the errors in snow detection are about 8% higher for rain gauges than for satellite data in the case of MB and MP, while this result is reversed in the case of the PB weather station (6% higher error for IMERG). The IMERG estimation error is often observed in coastal and mountain environments [26], in particular in the latter there is a tendency to underestimate precipitation [30,31], and this is further confirmation of the extremely significant underestimation of the MB and MP rain gauges; while the PB weather station is in line with the satellite data, probably due to a lower elevation than the other two, which limits its underestimation [32]. Subsequently, anemometric data were studied in an attempt to explain the important differences observed in precipitation between rain gauge and satellite data. The research evaluated the amount of precipitation detected by both the satellite and the rain gauge at certain wind speeds. This analysis showed a similar pattern in the difference in precipitation between IMERG and rain gauge data. The trend showed a growth in precipitation above 5 m/s for the satellite data, while this growth was not found in the case of the rain gauge data, which was more pronounced for MB and PB and less pronounced for MP. This lack of precipitation at high wind speeds for rain gauges can certainly be due to snow blowing or the splashing of rain drops [3,4,33]. At the same time, the location of the different weather stations was also assessed, and this showed that weather stations where precipitation does not increase above 5 m/s wind speed have very close peaks that produce a shielding in some wind direction, leading to problems in rain gauge detection. An important component is left out of the analysis, namely the local atmospheric circulation, which through further analysis could provide additional information on prevailing winds not explained by the topography of the area. Finally, as further evidence of the underestimation that occurs in mountain rain gauges, an interpolation was made, taking into account weather stations with an altitude below 1400 m a.s.l. The topographic parameters of the weather stations were employed as independent variables in the multiple linear regression, backward elimination technique [1,34]. The result explained over 60% of the variance by removing the slope and exposure from the analysis as they do not favour an increase in the r-squared adjusted value, then determining a model composed of the following independent variables: altitude, distance from the main ridge line and distance from the sea. In any case, the precipitation results showed once again the serious underestimation of the high mountain rain gauges at MB and MP, while the PB rain gauge shows values in agreement and even higher than the interpolation. Finally, the annual average of IMERG was calculated with the addition of snowfall in snow/water equivalent. From this calculation, the values were much higher than the rain gauge readings for both MB and MP, while they were only slightly higher than the rain gauge readings for PB. This would lead to an underestimation of rain gauges above 1800 m by 70 to 120% and only 11% for PB. This problem in estimating real precipitation in high mountains has been highlighted by numerous other studies around the world [34]. In any case, although there is a clear improvement in the estimation of precipitation at high altitudes using IMERG satellite data augmented by the snow/water equivalent ratio, some research has shown underestimation errors, even with IMERG data in mountain environments [30].
5. Conclusions
This research highlights the poor reliability of precipitation measured by rain gauges in high mountains and recommends the use of IMERG data modified with the addition of the water/snow equivalent ratio where possible to measure snowfall levels. In the future, it would be important to consider the introduction of new sensors, at some strategic weather stations, which would allow a more accurate measurement of precipitation and which would also lead to an even more accurate calibration of IMERG measured values. This assessment is essential for many precipitation-related fields, which currently rely on incorrect quantities in areas where water recharge is greatest.
Author Contributions
Conceptualization, Matteo Gentilucci and Gilberto Pambianchi; methodology, Matteo Gentilucci and Margherita Bufalini; software, Matteo Gentilucci and Marco Materazzi; validation, Matteo Gentilucci and Fabrizio D’Aprile; formal analysis, Matteo Gentilucci; investigation, Marco Materazzi; resources, Margherita Bufalini; data curation, Matteo Gentilucci; writing—original draft preparation, Matteo Gentilucci and Gilberto Pambianchi; writing—review and editing, Gilberto Pambianchi; visualization, Matteo Gentilucci; supervision, Fabrizio D’Aprile. All authors have read and agreed to the published version of the manuscript.
Funding
This research received no external funding.
Data Availability Statement
Regione Marche—Sistema Informativo Regionale Meteo-Idro-Pluviometrico (protezionecivile.marche.it); Index of /imerg/gis (nasa.gov).
Conflicts of Interest
The authors declare no conflict of interest.
References
- Gentilucci, M.; Bisci, C.; Burt, P.; Fazzini, M.; Vaccaro, C. Interpolation of rainfall through polynomial regression in the Marche region (Central Italy). In The Annual International Conference on Geographic Information Science; Springer: Cham, Switzerland, 2018; pp. 55–73. [Google Scholar]
- Gentilucci, M.; Materazzi, M.; Pambianchi, G.; Burt, P.; Guerriero, G. Assessment of variations in the temperature-rainfall trend in the province of Macerata (Central Italy), comparing the last three climatological standard normals (1961–1990; 1971–2000; 1981–2010) for biosustainability studies. Environ. Process. 2019, 6, 391–412. [Google Scholar] [CrossRef]
- Sevruk, B. Method of Correction for Systematic Error in Point Precipitation Measurement Gauges for Operational Use; World Meteorological Oganization: Geneva, Switzerland, 1982. [Google Scholar]
- Daly, C.; Slater, M.E.; Roberti, J.A.; Laseter, S.H.; Swift, L.W., Jr. High-resolution precipitation mapping in a mountainous watershed: Ground truth for evaluating uncertainty in a national precipitation dataset. Int. J. Climatol. 2017, 37, 124–137. [Google Scholar] [CrossRef] [Green Version]
- Yu, L.; Zhang, Y.; Yang, Y. Using high-density rain gauges to validate the accuracy of satellite precipitation products over complex terrains. Atmosphere 2020, 11, 633. [Google Scholar] [CrossRef]
- Brock, F.V.; Richardson, S.J.; Richardson, S.J. Meteorological measurement systems; Oxford University Press: Oxford, UK, 2001. [Google Scholar]
- Girons Lopez, M.; Wennerström, H.; Nordén, L.Å.; Seibert, J. Location and density of rain gauges for the estimation of spatial varying precipitation. Phys. Geogr. 2015, 97, 167–179. [Google Scholar] [CrossRef] [Green Version]
- Mock, C.J.; Birkeland, K.W. Snow avalanche climatology of the western United States mountain ranges. Bull. Am. Meteorol. Soc. 2000, 81, 2367–2392. [Google Scholar] [CrossRef]
- Mahmoud, M.T.; Mohammed, S.A.; Hamouda, M.A.; Mohamed, M.M. Impact of topography and rainfall intensity on the accuracy of imerg precipitation estimates in an arid region. Remote Sens. 2021, 13, 13. [Google Scholar] [CrossRef]
- Ma, Q.; Li, Y.; Feng, H.; Yu, Q.; Zou, Y.; Liu, F.; Pulatov, B. Performance evaluation and correction of precipitation data using the 20-year IMERG and TMPA precipitation products in diverse subregions of China. Atmos. Res. 2021, 249, 105304. [Google Scholar] [CrossRef]
- Ovando, G.; Sayago, S.; Bellini, Y.; Belmonte, M.L.; Bocco, M. Precipitation estimations based on remote sensing compared with data from weather stations over agricultural region of Argentina pampas. Remote Sens. Appl. Soc. Environ. 2021, 23, 100589. [Google Scholar] [CrossRef]
- Gebremichael, M.; Bitew, M.M.; Hirpa, F.A.; Tesfay, G.N. Accuracy of satellite rainfall estimates in the Blue Nile Basin: Lowland plain versus highland mountain. Water Resour. Res. 2014, 50, 8775–8790. [Google Scholar] [CrossRef]
- Dubé, I.; Rimouski, E.W.S.O. From mm to cm… Study of Snow/Liquid Water Ratios in Quebec; The University Corporation for Atmospheric Research: Boulder, CO, USA, 2003; pp. 1–127. [Google Scholar]
- Thorne, V.; Coakeley, P.; Grimes, D.; Dugdale, G. Comparison of TAMSAT and CPC rainfall estimates with raingauges, for southern Africa. Int. J. Remote Sens. 2001, 22, 195–1974. [Google Scholar] [CrossRef]
- Sharifi, E.; Steinacker, R.; Saghafian, B. Assessment of GPM-IMERG and other precipitation products against gauge data under different topographic and climatic conditions in Iran: Preliminary results. Remote Sens. 2016, 8, 135. [Google Scholar] [CrossRef] [Green Version]
- Zhang, L.; Ren, D.; Nan, Z.; Wang, W.; Zhao, Y.; Zhao, Y.; Ma, Q.; Wu, X. Interpolated or satellite-based precipitation? Implications for hydrological modeling in a meso-scale mountainous watershed on the Qinghai-Tibet Plateau. J. Hydrol. 2020, 583, 124629. [Google Scholar] [CrossRef]
- Tang, G.; Clark, M.P.; Papalexiou, S.M.; Ma, Z.; Hong, Y. Have satellite precipitation products improved over last two decades? A comprehensive comparison of GPM IMERG with nine satellite and reanalysis datasets. Remote Sens. Environ. 2020, 240, 111697. [Google Scholar] [CrossRef]
- Skofronick-Jackson, G.; Petersen, W.A.; Berg, W.; Kidd, C.; Stocker, E.F.; Kirschbaum, D.B.; Kakar, R.; Braun, S.A.; Huffman, G.J.; Iguchi, T.; et al. The Global Precipitation Measurement (GPM) mission for science and society. Bull. Am. Meteorol. Soc. 2017, 98, 1679–1695. [Google Scholar] [CrossRef] [PubMed]
- Gentilucci, M.; Barbieri, M.; Lee, H.S.; Zardi, D. Analysis of rainfall trends and extreme precipitation in the Middle Adriatic Side, Marche Region (Central Italy). Water 2019, 11, 1948. [Google Scholar] [CrossRef] [Green Version]
- Gentilucci, M.; Barbieri, M.; Burt, P.; D’Aprile, F. Preliminary data validation and reconstruction of temperature and precipitation in Central Italy. Geosciences 2018, 8, 202. [Google Scholar] [CrossRef] [Green Version]
- Wang, S.; Liu, J.; Wang, J.; Qiao, X.; Zhang, J. Evaluation of GPM IMERG V05B and TRMM 3B42V7 Precipitation products over high mountainous tributaries in Lhasa with dense rain gauges. Remote Sens. 2019, 11, 2080. [Google Scholar] [CrossRef] [Green Version]
- Ames, M. Sequential sampling of surface-minded land to assess reclamation. Rangeland Ecol. Manag./JRMA 1993, 46, 498–500. [Google Scholar] [CrossRef] [Green Version]
- Singh, A.S.; Masuku, M.B. Sampling techniques & determination of sample size in applied statistics research: An overview. IJECM 2014, 2, 1–22. [Google Scholar]
- Bahrami, M.; Shabani, A.; Mahmoudi, M.R.; Didari, S. Determination of Effective Weather Parameters on Rainfed Wheat Yield Using Backward Multiple Linear Regressions Based on Relative Importance Metrics. Complexity 2020, 2020, 6168252. [Google Scholar] [CrossRef]
- Gentilucci, M.; Barbieri, M.; Burt, P. Climatic variations in macerata province (Central Italy). Water 2018, 10, 1104. [Google Scholar] [CrossRef] [Green Version]
- Lu, C.; Ye, J.; Fang, G.; Huang, X.; Yan, M. Assessment of GPM IMERG Satellite Precipitation Estimation under Complex Climatic and Topographic Conditions. Atmosphere 2021, 12, 780. [Google Scholar] [CrossRef]
- Tapiador, F.J.; Navarro, A.; García-Ortega, E.; Merino, A.; Sánchez, J.L.; Marcos, C.; Kummerow, C. The contribution of rain gauges in the calibration of the IMERG product: Results from the first validation over Spain. J. Hydrometeorol. 2020, 21, 161–182. [Google Scholar] [CrossRef]
- Ménégoz, M.; Gallée, H.; Jacobi, H.W. Precipitation and snow cover in the Himalaya: From reanalysis to regional climate simulations. Hydrol. Earth Syst. Sci. 2013, 17, 3921–3936. [Google Scholar] [CrossRef] [Green Version]
- Grossi, G.; Lendvai, A.; Peretti, G.; Ranzi, R. Snow precipitation measured by gauges: Systematic error estimation and data series correction in the central Italian Alps. Water 2017, 9, 461. [Google Scholar] [CrossRef] [Green Version]
- Navarro, A.; García-Ortega, E.; Merino, A.; Sánchez, J.L.; Kummerow, C.; Tapiador, F.J. Assessment of IMERG precipitation estimates over Europe. Remote Sens. 2019, 11, 2470. [Google Scholar] [CrossRef] [Green Version]
- Anjum, M.N.; Ding, Y.; Shangguan, D.; Ahmad, I.; Ijaz, M.W.; Farid, H.U.; Yagoub, Y.E.; Zaman, M.; Adnan, M. Performance evaluation of latest integrated multi-satellite retrievals for Global Precipitation Measurement (IMERG) over the northern highlands of Pakistan. Atmos. Res. 2018, 205, 134–146. [Google Scholar] [CrossRef]
- Lu, X.; Tang, G.; Wang, X.; Liu, Y.; Jia, L.; Xie, G.; Li, S.; Zhang, Y. Correcting GPM IMERG precipitation data over the Tianshan Mountains in China. J. Hydrol. 2019, 575, 1239–1252. [Google Scholar] [CrossRef]
- Gabella, M.; Speirs, P.; Hamann, U.; Germann, U.; Berne, A. Measurement of precipitation in the Alps using dual-polarization C-band ground-based radars, the GPM spaceborne Ku-band radar, and rain gauges. Remote Sens. 2017, 9, 1147. [Google Scholar] [CrossRef] [Green Version]
- Bisci, C.; Gentili, B.; Acciarri, A.; Cantalamessa, G.; Di Pancrazio, G.; Fazzini, M.; Fusari, A.; Gentilucci, M.; Invernizzi, M.C. Clean and healthy–natural hazards and resources. In Quality of Life in Urban Landscapes; Springer: Cham, Switzerland, 2018; pp. 195–204. [Google Scholar]
Publisher’s Note: MDPI stays neutral with regard to jurisdictional claims in published maps and institutional affiliations. |
© 2021 by the authors. Licensee MDPI, Basel, Switzerland. This article is an open access article distributed under the terms and conditions of the Creative Commons Attribution (CC BY) license (https://creativecommons.org/licenses/by/4.0/).