Article

Risk Assessment of Different Maize (Zea mays L.) Lodging Types in the Northeast and the North China Plain Based on a Joint Probability Distribution Model

1
College of Land Science and Technology, China Agricultural University, Beijing 100083, China
2
Key Laboratory of Remote Sensing for Agri-Hazards, Ministry of Agriculture and Rural Affairs, Beijing 100083, China
*
Author to whom correspondence should be addressed.
ISPRS Int. J. Geo-Inf. 2021, 10(11), 723; https://doi.org/10.3390/ijgi10110723
Submission received: 11 August 2021 / Revised: 21 October 2021 / Accepted: 23 October 2021 / Published: 26 October 2021
(This article belongs to the Special Issue Earth Observation and GIScience for Agricultural Applications)

Abstract

:
Mastering the lodging risk of planting environment is of great significance to the optimal layout of maize varieties and the breeding of lodging resistant varieties. However, the existing lodging risk models are still at the stage of single or multi-factors independent analysis, and lack of assessment for different lodging types. To address this issue, based on the mechanism of different lodging types, the Archimedean copula function was used to describe the joint probability distribution of wind speed and precipitation, and the lodging risk assessment model of maize was established. By comparing the goodness of fit, when the rank correlation coefficient of these two is positive and negative, the corresponding optimal joint probability distribution functions are the Gumbel copula and Frank copula. According to the spatial distribution of lodging risk, the area from Liaodong Bay northward to Tongyu, Jilin province in the Northeast and the North China Plain has a high frequency of lodging, in which the probability of stalk lodging is two to four times that of root lodging. Finally, we discussed how to apply the lodging risk distribution results to optimize the maize variety test sites to improve the efficiency and reliability of the existing test system. The method proposed in this paper comprehensively considers the synergistic effect of multiple factors and can provide technical support for other risk assessment.

1. Introduction

Lodging is a phenomenon of crop stalks from the natural upright state to an inclined state caused by external factors [1,2] and is one of the important abiotic stresses of maize (Zea mays L.). After lodging, the growth structure of maize is destroyed, leading to a decrease in photosynthetic efficiency and a large-scale maize yield reduction [3]. At the same time, the mechanical damage caused by maize lodging increases the probability of plant infection, the complexity of field management, and also increases the difficulty and cost of mechanized harvest [4]. Understanding the lodging risk in the planting environment is not only helpful for agricultural management, but also of great significance for breeding, especially for the maize multi-environment trial (MET) in China, which was selected based on qualitative experience and has a problem of low probability in lodging stress [5].
The occurrence of maize lodging is the result of interactions between maize variety characteristics and planting environment conditions. At present, the research on maize lodging focuses on the mechanism analysis, including genetic analysis, internal factors, such as plant shape differences [6,7,8], and external factors, such as differences in cultivation measures [9,10].
However, the cultivation environment, such as the meteorological conditions and soil fertility, have a great influence on lodging [2,11]. In a desert climate, winds that are not in the storm category can cause severe maize lodging because of the absence of a thick vegetative cover [12]. According to Liu Zhe et al. [5], the daily highest wind speed above 10.8 m/s may cause maize lodging, and a certain degree of precipitation that can loosen the soil will aggravate the maize lodging degree [13]. Studies on lodging risk assessment in a planting environment can be divided into two categories: one is based on the average performance of all varieties; another is to evaluate the risk probability according to the meteorological, soil and other elements in the environment.
Evaluation of environmental characteristics by varieties’ performance in a planting environment is a common method in the analysis of genetic-environment interaction and MET’s results. For example, the mean yield of all varieties can provide a quantitative grading of the environments [14,15,16], and the average lodging rate of all varieties can be used to describe the lodging stress of the environment. This method expresses the environmental characteristics indirectly through the varieties’ performance, which is very convincing. However, it relies on the experimental statistics data, which are scattered and have a limited spatial scope.
Compared with the acquisition of environmental lodging stress from field environmental data, the method based on meteorological elements in the environment is more universal. Liu Zhe et al. [5] carried out environment selection for maize lodging resistance detection by using the probability of wind in order to increase the probability of lodging stress in the experimental environment and help to fully detect new varieties. This method only considered the influence of wind, but not other factors, and thus the analysis results were not comprehensive.
Yang Yang [17] realized that the direct factors leading to maize lodging are strong wind and precipitation, but he did not describe the synergistic effect of wind and rain. Instead, he built an extreme climate probability model of wind and rain. Mi Chunqiao [11,18] calculated the maximum daily wind speed during the maize growth period and fitted its probability density function. Then, combining with planting density and soil potassium content, the lodging stress was estimated by a fuzzy synthetic evaluation in the Huang-Huai-Hai Plain, China. This method evaluated lodging stress based on multi-indicators but only analyzed the most extreme wind speed during the growth period, ignored other severe weather.
These above methods constructed probability distribution functions of meteorological factors that are related to lodging and analyzed the lodging stress of local environment in combination with other factors. Compared with field investigation methods, these methods are more maneuverable and convenient for large-scale analysis; however, they did not distinguish different lodging types. At the same time, the analysis of maize lodging risk is still in the stage of single or multi-factors independent analysis, and the synergistic effect of wind and rain is not quantified.
Mastering lodging risk in planting environment is helpful to plan agricultural management in sensitive growth periods and provide a reference test environment for lodging resistance in MET. Through reading the relevant literature, maize lodging events occurred under the synergistic effect of wind and precipitation, and different lodging types occurred in different environmental scenarios. Therefore, the aim of this study is to explore a method that can express the occurrence probability of different maize lodging types based on the mechanism of lodging.

2. Materials and Methods

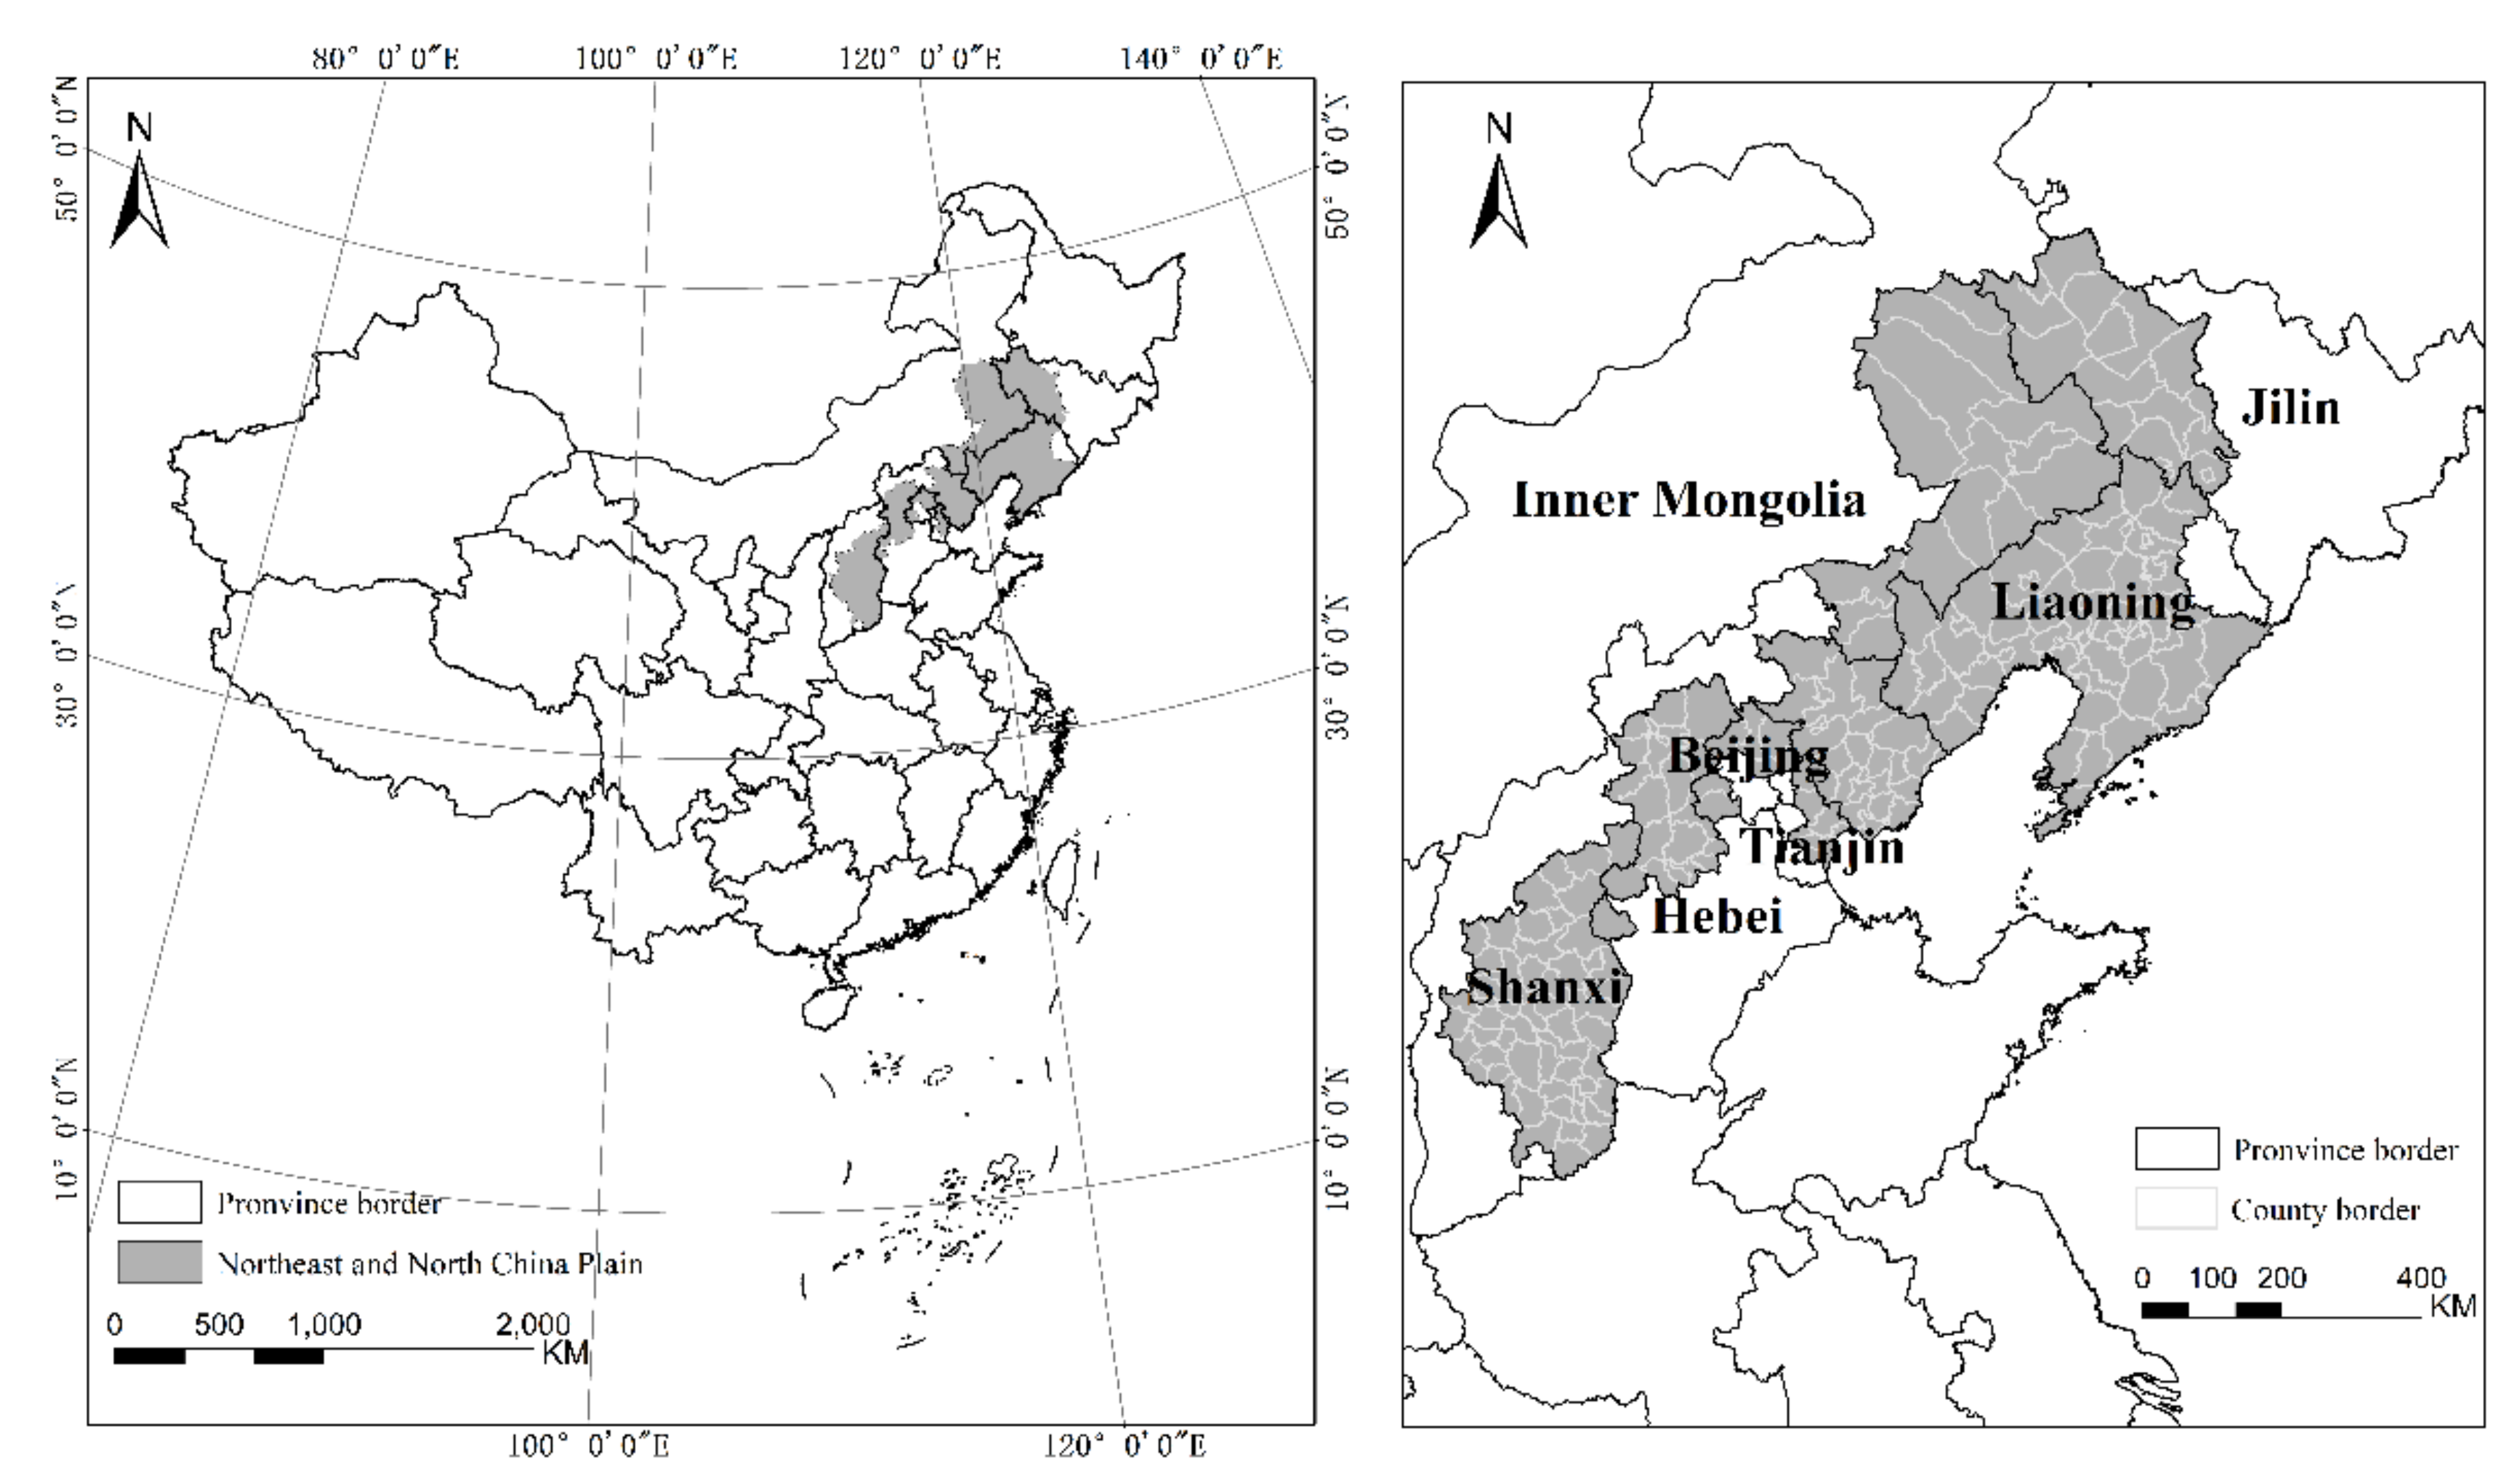
2.1. Research Area and Data

The study area is Northeast and North China Plain (Figure 1), a major maize producing area in China, which includes most of Liaoning Province, the west of Jilin, the east of Inner Mongolia, and the North of Hebei, Beijing, Tianjin and Shanxi. This area has a cold temperate semi-humid climate, with an annual active accumulated temperature of 2000–3600 °C, and an annual precipitation of 400–800 mm from west to east. This region is an important commodity grain base in China due to the superior terrain, soil, climate, and other natural conditions and high degree of mechanization implementation [19].
As lodging events of maize are closely related to the growth period, we obtained maize growth periods data from the Crop Growth and Farmland Soil Moisture dataset provided by the National Meteorological Center of China [20], which records the date of crop development rely on the agricultural meteorological stations. Historical meteorological data from 1986 to 2015 were obtained from National Meteorological Center of China [21], including the daily average rainfall, daily maximum wind speed (the maximum of the average wind speed within every 10 min of a day), and daily highest wind speed (the maximum of the average wind speed within every 3 s of a day).
The regional trial is a multi-year and multi-site variety characteristic evaluation experiment with industry authority. The lodging situation and the corresponding weather conditions of each site were recorded, which can be used as a reference for our research. In this study, the regional trial report of maize varieties from 2001 to 2011 [22,23,24,25,26,27,28,29,30,31,32] provided by National Agro-Tech Extension and Service Center were used.

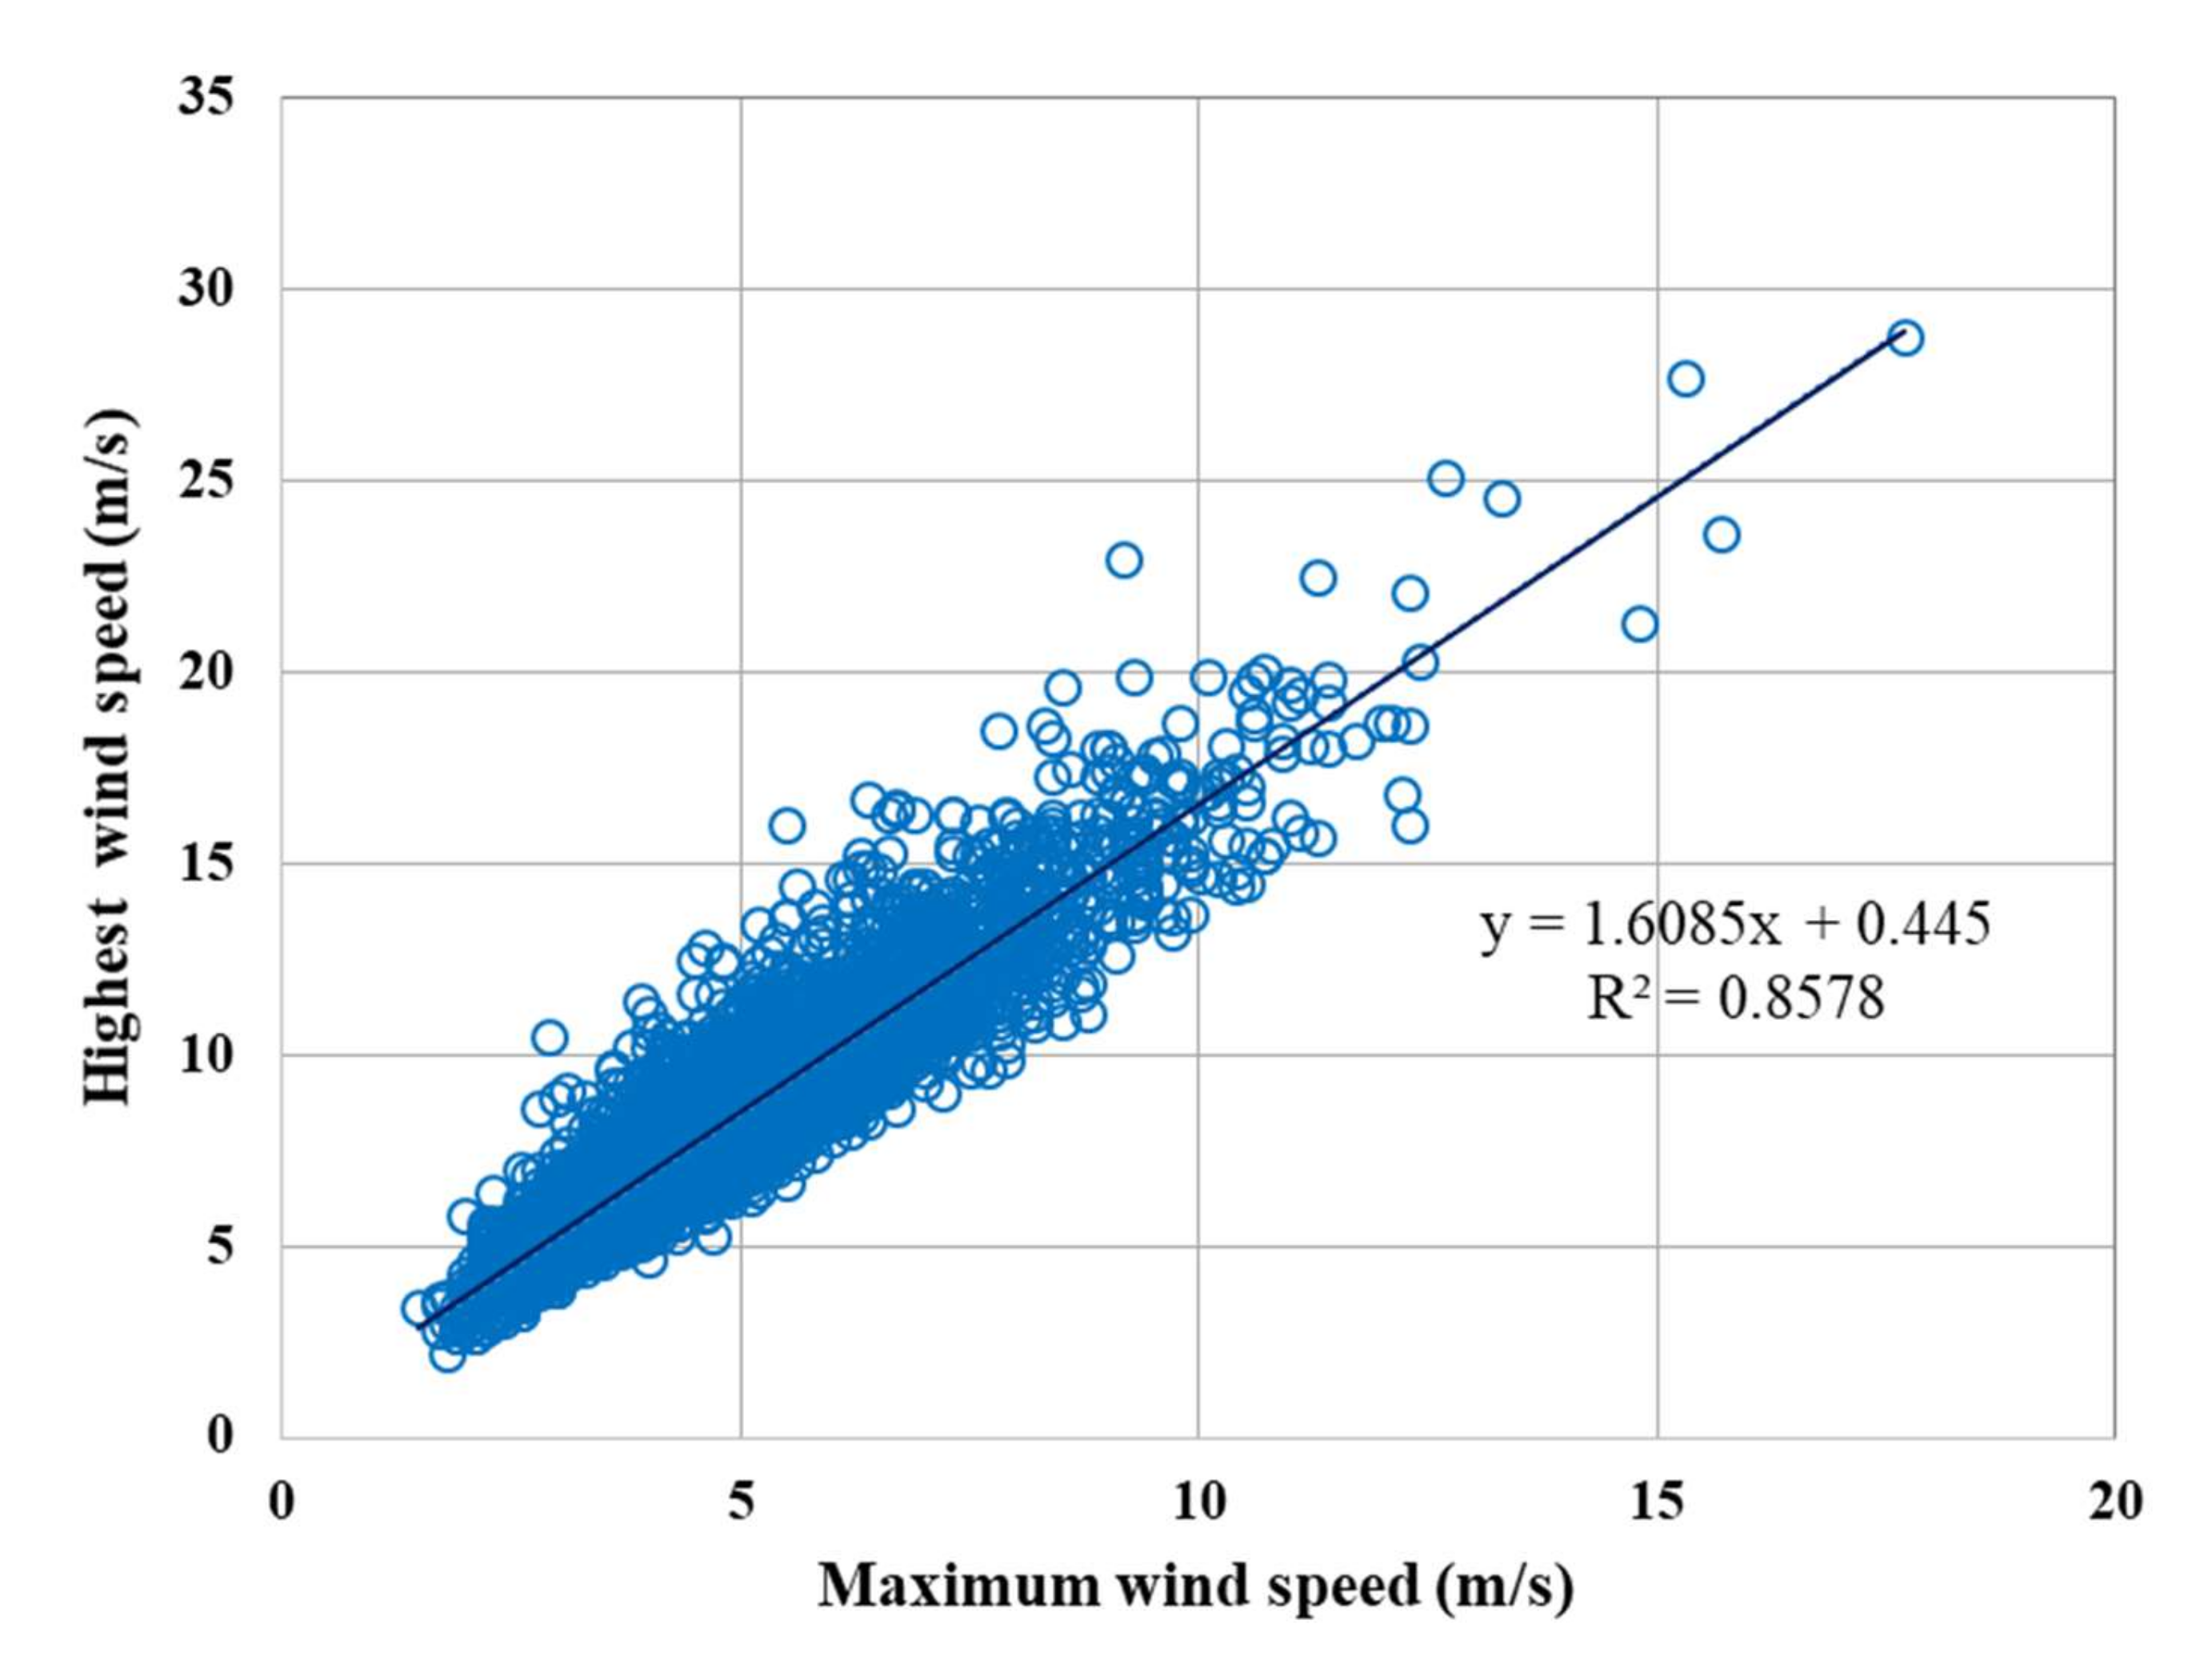
2.2. Selection of Meteorological Indicators

There are many reasons for maize lodging, including cultivation measures, such as improper planting density and fertilization ratio [33]; planting environment factors, such as strong wind and heavy rainfall [34]; and internal factors, such as the stalk strength of maize varieties [7,34]. In this paper, environmental factors were mainly analyzed, and a large number of studies showed that wind and rainfall were the most direct external factors causing maize lodging [3,35]. The lodging degree of maize is positively proportional to the size of wind speed, and the influence of precipitation on lodging is mainly in two aspects: the impact of raindrops on the plant as well as the attached gravity and making soil loose and soft.
Of course, the occurrence of maize lodging is also closely related to the growth stage [36,37]. After maize enter the jointing stage, the stem grows rapidly, and the mechanical tissue is relatively fragile, and thus it is very prone to lodging. Lodging that occurs from jointing stage to tasseling stage has little effect on the yield because of the plants’ own recovery ability. However, lodging after tasseling is difficult to restore upright due to plant extrusion, which has a great impact on yield. The sensitive period of maize lodging selected in this paper is from the tasseling stage to milking stage.
There are three indexes related to wind speed in the daily dataset of meteorological stations: the mean wind speed, maximum wind speed, and highest wind speed. According to the surface meteorological observation norms, the maximum wind speed refers to the maximum average wind speed within 10 min in a day, and the highest wind speed within 3 s, both of which can represent the extreme wind speed in a day. According to the statistics of the data from 1986 to 2015, we found that the observation records of the highest wind speed before 2005 were missing. Considering that there is a significant correlation between the maximum wind speed and highest wind speed [38] from 2005–2015 in Northeast and North China Plain (Figure 2), we selected the maximum wind speed to describe the daily extreme wind speed.
The precipitation index in the daily dataset of meteorological stations refers to the accumulated precipitation from 8 pm of the previous day to 8 pm of the same day, which represents the precipitation conditions of the day. Rainfall can loosen the soil and weaken the retention of maize roots through increasing soil moisture content [13,39]. It can be seen that the infiltration of rain on soil is a cumulative process, and the precipitation of the previous day will also have impact on crop. Thus, the rainfall of two consecutive days was selected as the index of extreme precipitation in this paper.
Unfortunately, there is no definite conclusion on the quantitative relationship between lodging degree and wind and rainfall. Therefore, according to the regional trial report of maize varieties, the description of maize lodging occurrence date, lodging degree and the intensity of corresponding meteorological elements was summarized. First, the description of meteorological elements and the occurrence degree of maize lodging was normalized, and then the meteorological elements with higher occurrence frequency were selected as the statistical objects. Finally, the corresponding relationship between maize lodging and the intensity of meteorological elements can be obtained.

2.3. Joint Probability Distribution

According to the above analysis, it can be known that the maize lodging occurred under the synergistic effect of wind and rain, that is, the expression of synergistic effect is very important. Copula function can connect the joint distribution function of multiple random variables with their edge distribution to describe the correlation between n-dimensional variables [40]. Moreover, the function is not restricted by the form of edge distribution and can combine different correlation modes organically. According to the definition of copula function, the joint distribution of specific wind speed and precipitation can be expressed as:
F(x, y) = P(X ≤ x, Y ≤ y) = C(Fx(x), Fy(y))
where F(x, y) is the joint probability distribution of wind speed x and precipitation y, and Fx(x) and Fy(y) are the optimal edge distributions of the two respectively.
In this paper, Archimedean copula with simple structure and wide representation was selected to express the joint probability distribution of wind and precipitation for two consecutive days in maize lodging sensitive period, including the Gumbel copula, Clayton copula, and Frank copula functions [41]. The equations of the three functions are as follows:
CGumbel(u,v) = exp{−[(−lnu)a + (−lnv)a]1/a} a∈ [1,+∞)
CClayton(u,v) = max{−[u−a + v−a]1/a,0} a∈ [−1,+∞)
CFrank(u,v) = −1/a ln(1 + (exp(−au) − 1)(exp(−av) − 1)/exp(−a − 1)) a∈ R
where u = Fx(x) and v = Fy(y) are the optimal edge distribution of variables x and y, α is the copula parameter, which can be estimated by Kendall’s rank correlation coefficient (Equation (6)), φ(t) is the generator of the function, corresponding to the above three functions have: φ(t) = (−lnt)θ, φ(t) = −ln[(e θt − 1)/(eθ − 1)], φ(t) = (tα − 1)/α.
It can be seen from Equation (1) that the joint probability distribution of wind and precipitation for two consecutive days is formed by the combination of their edge distributions and copula functions. Therefore, different estimation methods of function parameter (including moment estimation, maximum likelihood, and least square [42,43,44,45]) were adopted to simulate the probability distribution functions of wind and precipitation, and the Pearson correlation coefficient (Equation (5)) between the simulated value and the measured value was calculated to evaluate the goodness of fit and determine the optimal probability distribution function.
Then, the Kendall’s rank correlation coefficient (Equation (6)) between daily maximum wind speed and precipitation for two consecutive days was used to estimate the parameters of the copula function, and the sum of squares of deviation [46,47] between different copula functions and empirical copula functions was calculated to evaluate the fitting accuracy (Equation (8)).
  r ( x ,   y ) = Cov x ,   y Var x Var y
where r(x, y) represents the Pearson correlation coefficient between the simulated value x and the measured value y; Cov(x, y) is the covariance of x and y; and Var[x] and Var[y] represent the variance of x and y, respectively.
Kendall’s rank correlation coefficient [48,49,50] is a statistic used to measure the order correlation of two random variables, and the correlation is evaluated by examining whether the change trend of the two variables is consistent. When two random variables are sorted according to the size of one variable, the other is usually out of order. After sorting, the ratio of the difference between concordant pairs and discordant pairs to the total pairs is the Kendall’s correlation coefficient. The value of Kendall correlation coefficient ranges from −1 to 1, where 1 represents that the two random variables have consistent rank correlation, −1 represents that the two have completely opposite rank correlation, and 0 represents that the two are independent of each other.
τ = (nc − nd)/(n0)
where τ is the Kendall’s rank correlation coefficient; and n0, nc, and nd represent total pairs, the number of concordant pairs, and discordant pairs, respectively.
The corresponding calculation equation of n0 is as follows:
n0 = n(n − 1)/2
The joint probability distribution of wind and precipitation was obtained according to copula parameters, and then its accuracy was evaluated by OLS:
OLS = 1 n i = 1 n Ĉ i u ,   v   -   C i u ,   v 2
where Ĉ i u ,   v , C i u ,   v are the empirical probability value and the simulated probability value, respectively; and n is the number of total samples.

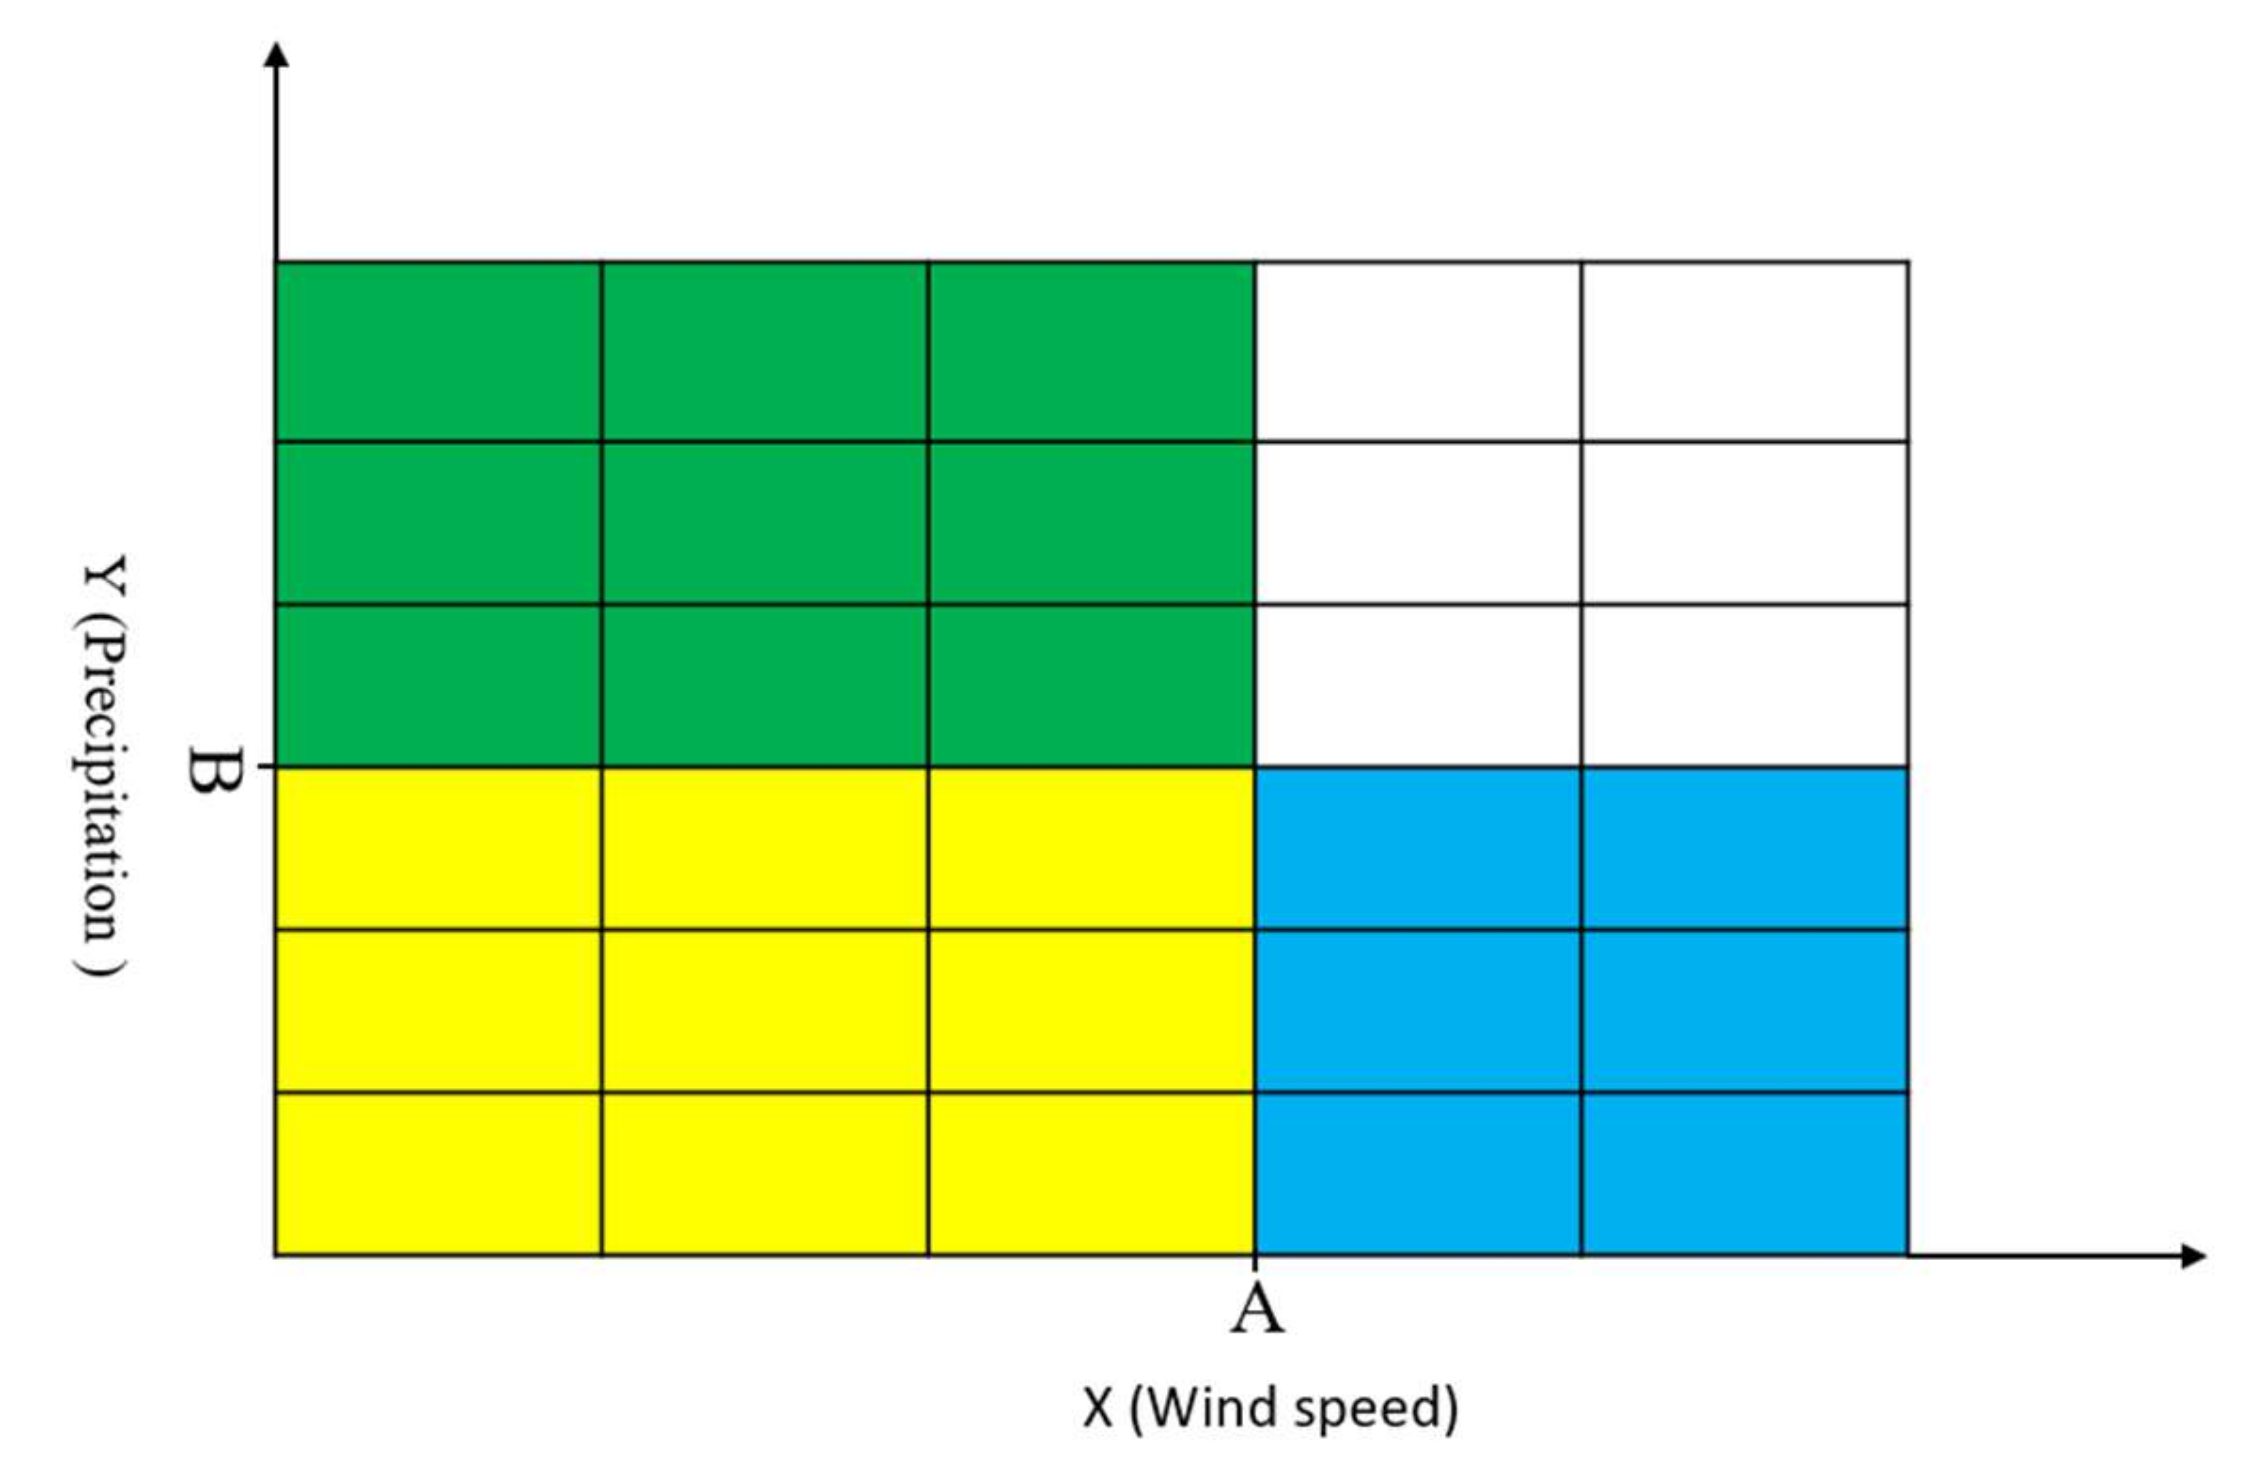
2.4. Spatial Distribution of Lodging Stress

The map of joint probability distribution is three-dimensional; therefore, the joint probability distribution map of variables X (wind speed) and Y (precipitation) was projected onto the plane to get Figure 3. The green area is the probability that the wind speed X is less than value A, and the blue area is that the precipitation Y is less than value B. The yellow area is generated by the superposition of the blue and green areas, as well as the probability in the white area is the information we want to obtain. Therefore, the probability that the wind speed X exceeds A, and the precipitation Y exceeds B can be expressed as:
P(X ≥ A, Y ≥ B) = 1 − FX(A) − FY(B) + C(FX(A),FY(B))
where FX(A), FY(B) are the probability that the wind speed X is less than A and precipitation Y is less than B respectively, C(FX(A),FY(B)) is the joint probability of A and B.
Similarly, the probability that wind speed X is greater than A and precipitation Y is less than B can be obtained:
P(X ≥ A, Y < B) = FY(B) − C(FX(A),FY(B))
Combined with the joint probability distribution and the above equations, the probability of wind speed and precipitation of each meteorological station meeting the specific threshold was obtained. Then, the maize root lodging and stalk lodging in the study area could be obtained through the spatial interpolation analysis. Considering that the size of meteorological data used in this paper is small, the inverse distance weighted interpolation (IDW) method [51,52] was chosen to avoid the maximum and minimum values appear in no original data place. Based on the principle of near similarity, IDW uses the value of sample points in the region to predict the value of unknown location. The weight of sample points close to the prediction point is greater than that of distant ones.

3. Results

The study area in this paper contains a total of 57 meteorological stations, and we could not analyze the best estimation methods of function parameter, the optimal edge probability distribution of wind and precipitation, and the most suitable copula function for each station one by one. Therefore, taking into account the altitude, latitude, and precipitation, we randomly selected five meteorological stations from north to south for analysis, including Siping, Jinlin Province; Chifeng, Inner Mongolia; Yuanping, Shanxi Province; Kailu, Inner Mongolia; and Zhangjiakou, Heibei Province. Among them, Kailu and Zhangjiakou have an average annual precipitation of 200 to 400 mm, while Siping, Chifeng and Yuanping less than 200 mm.

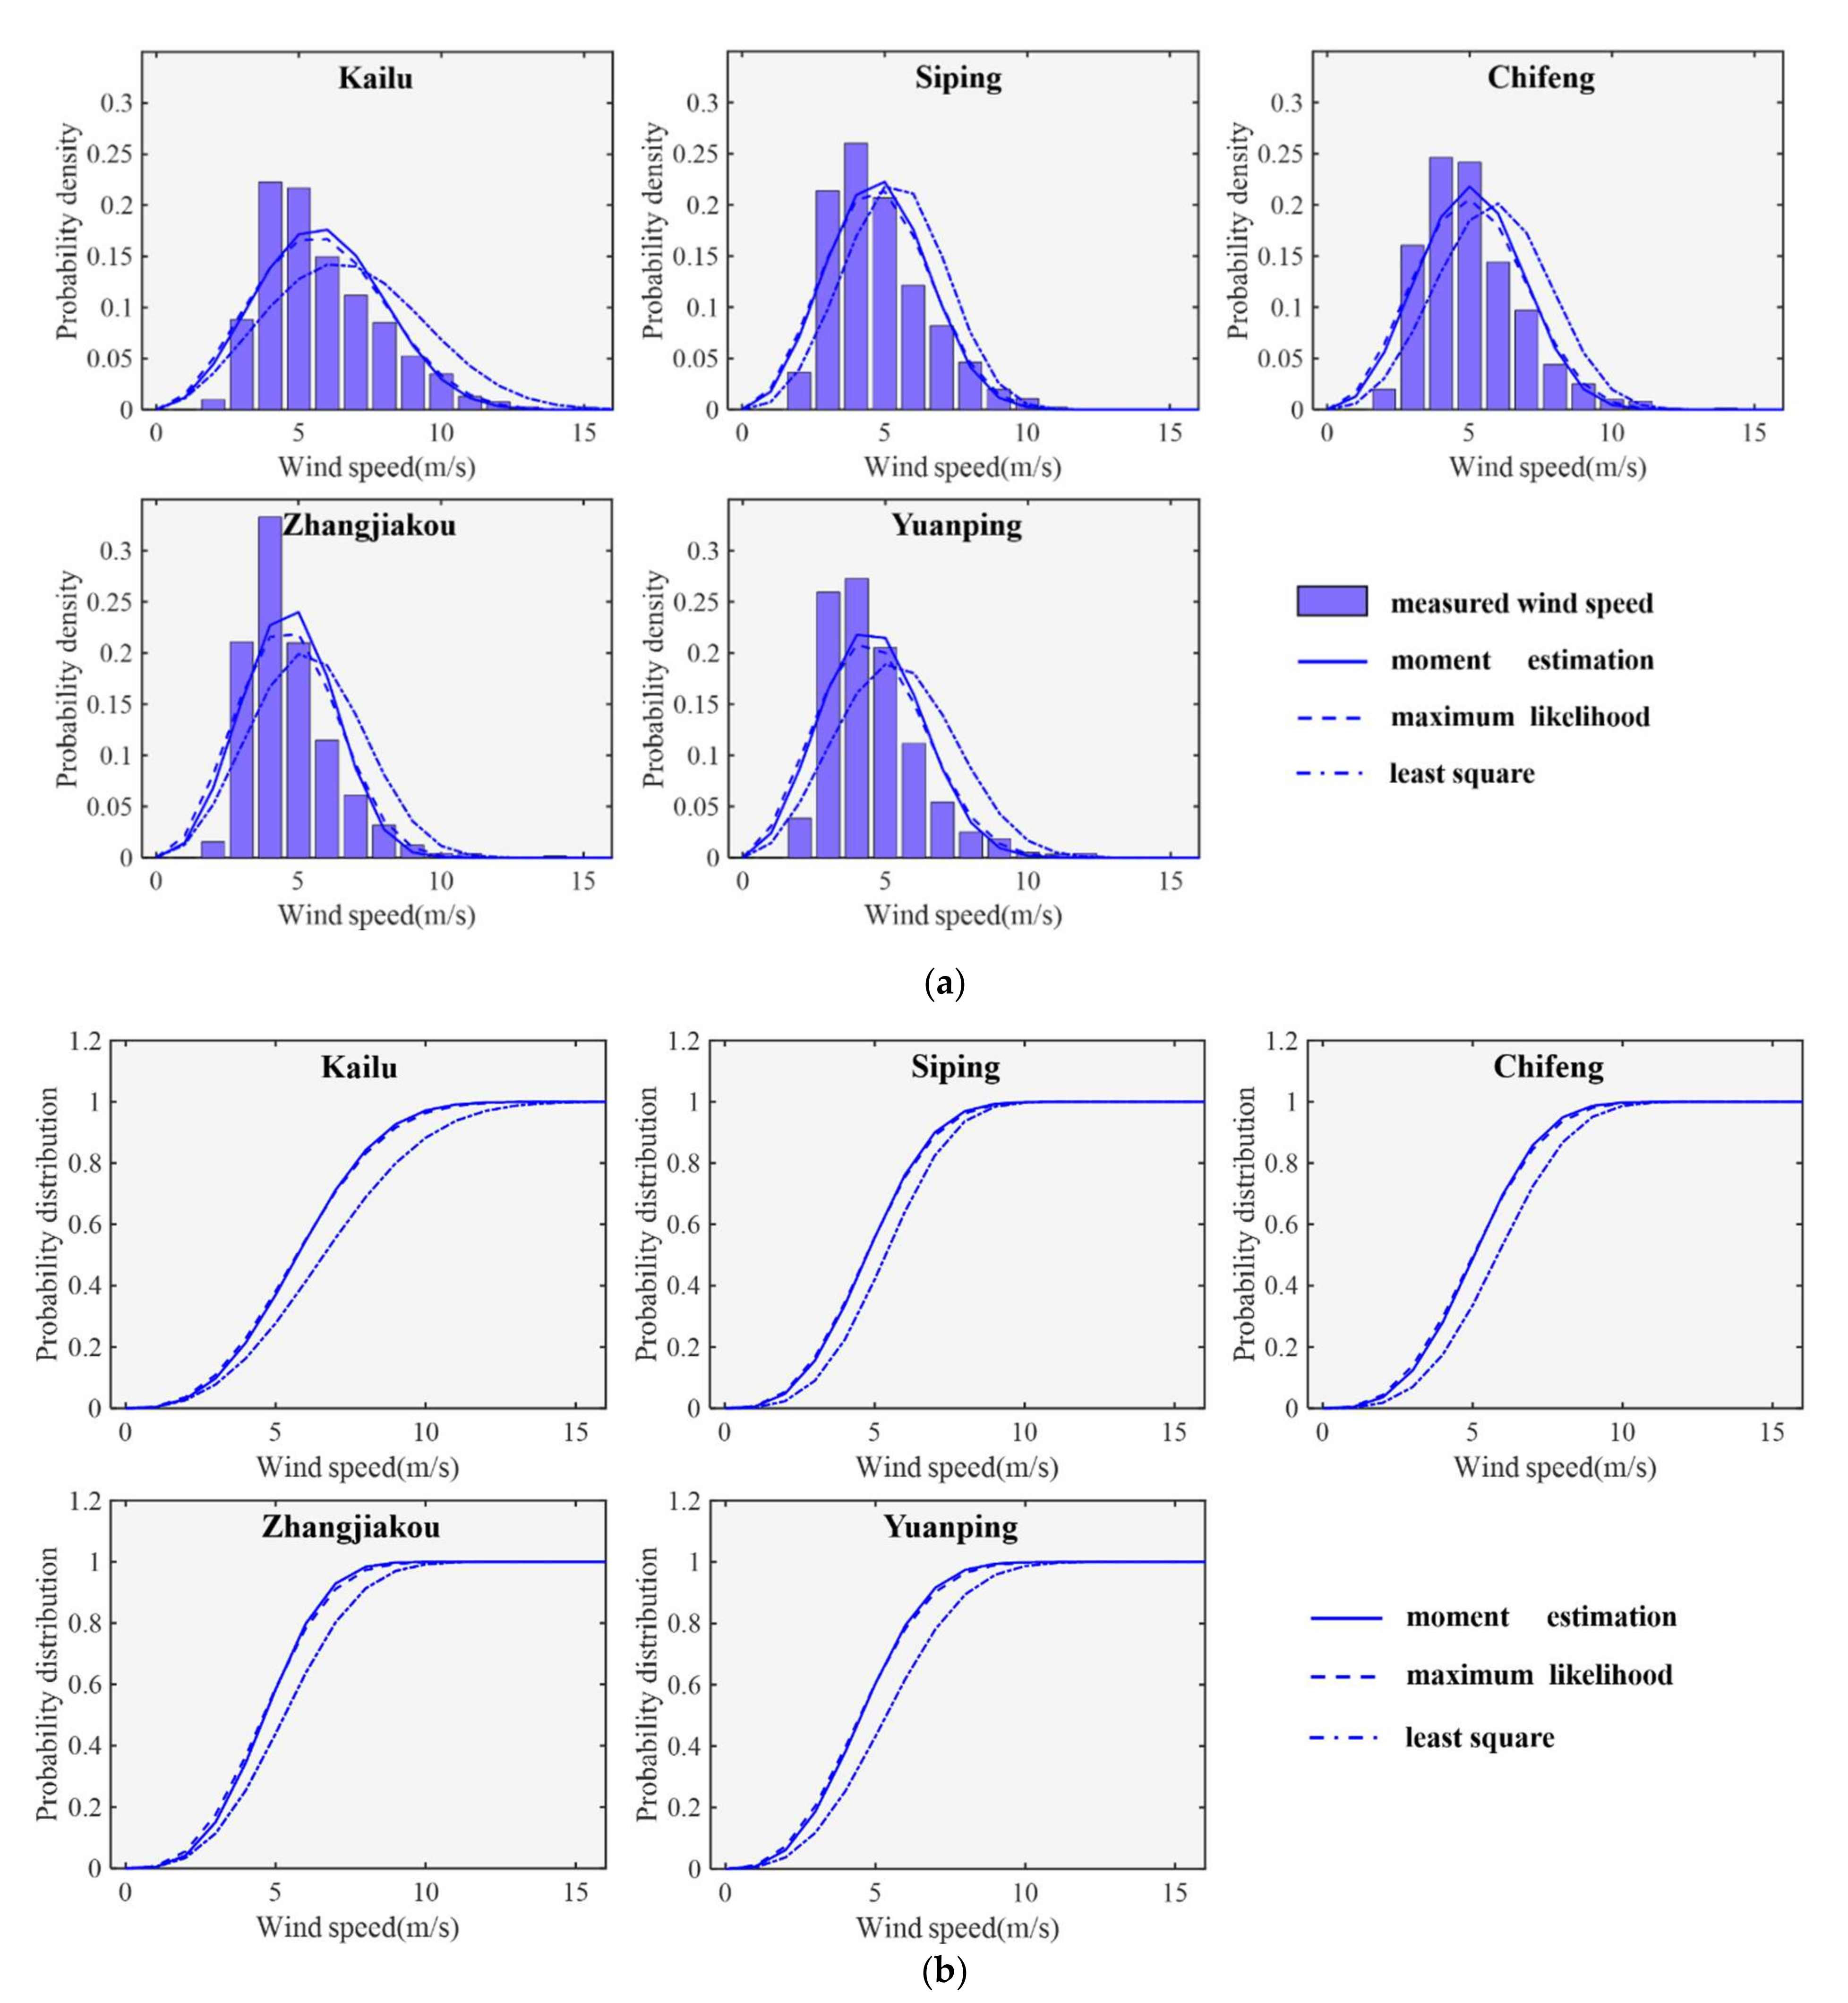
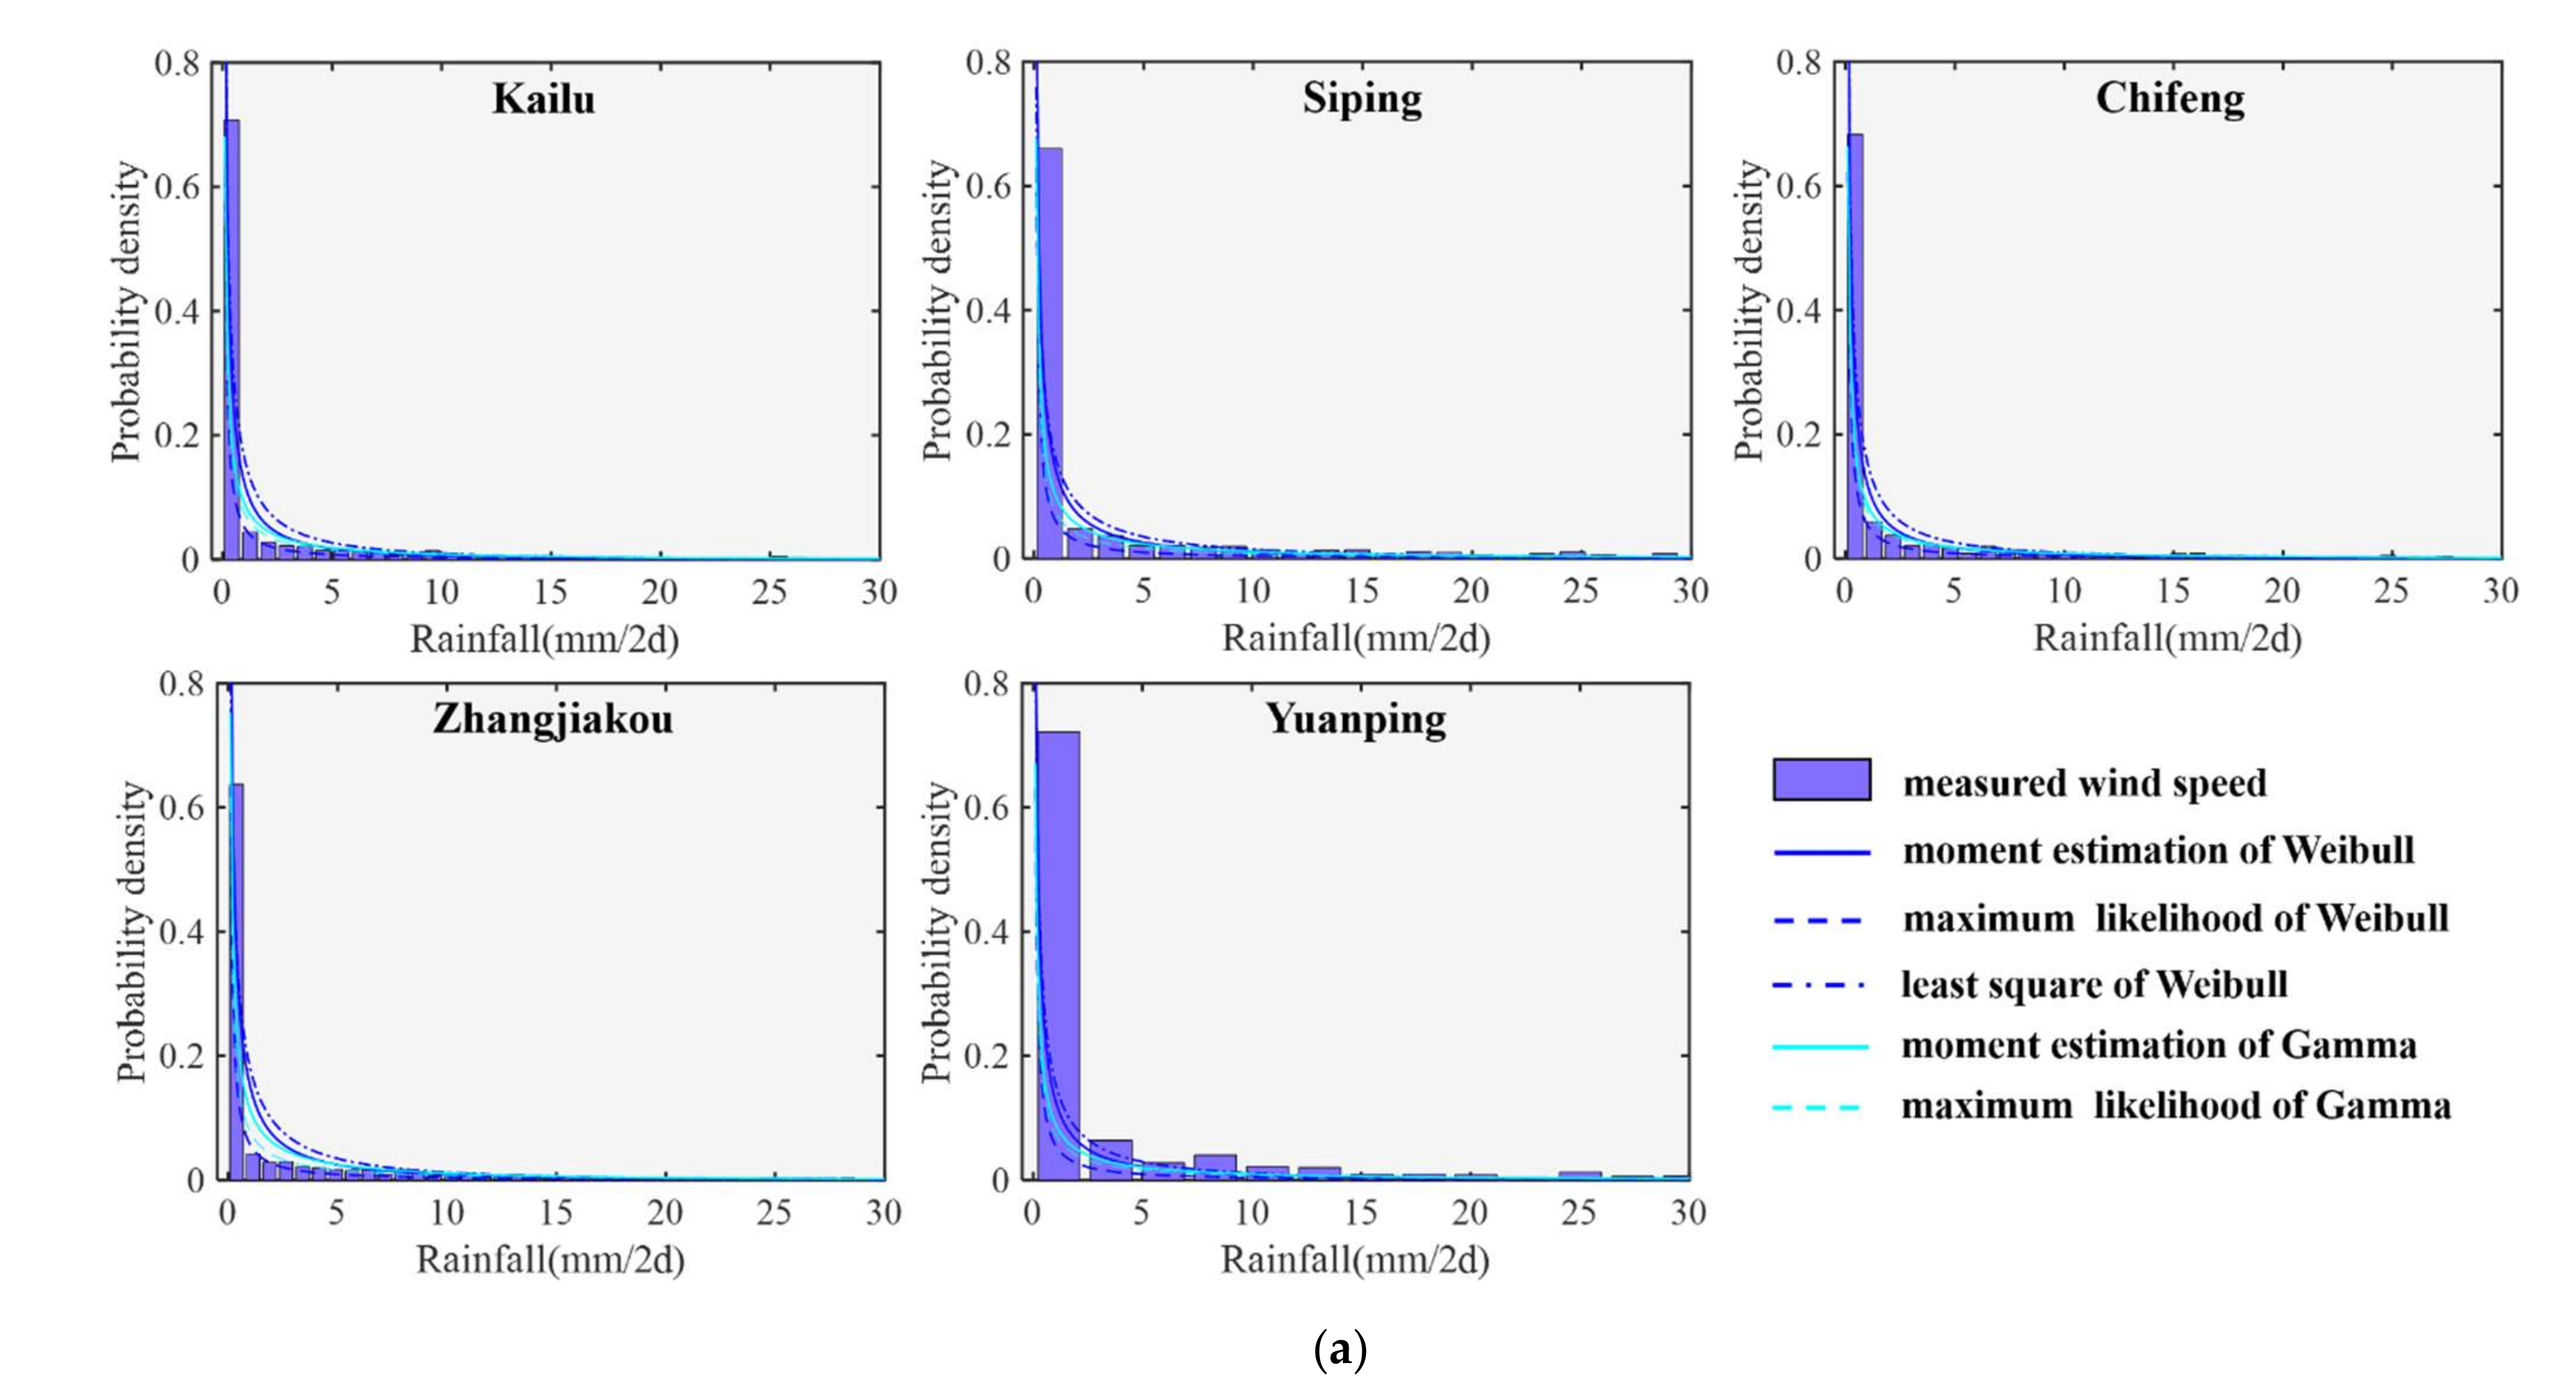
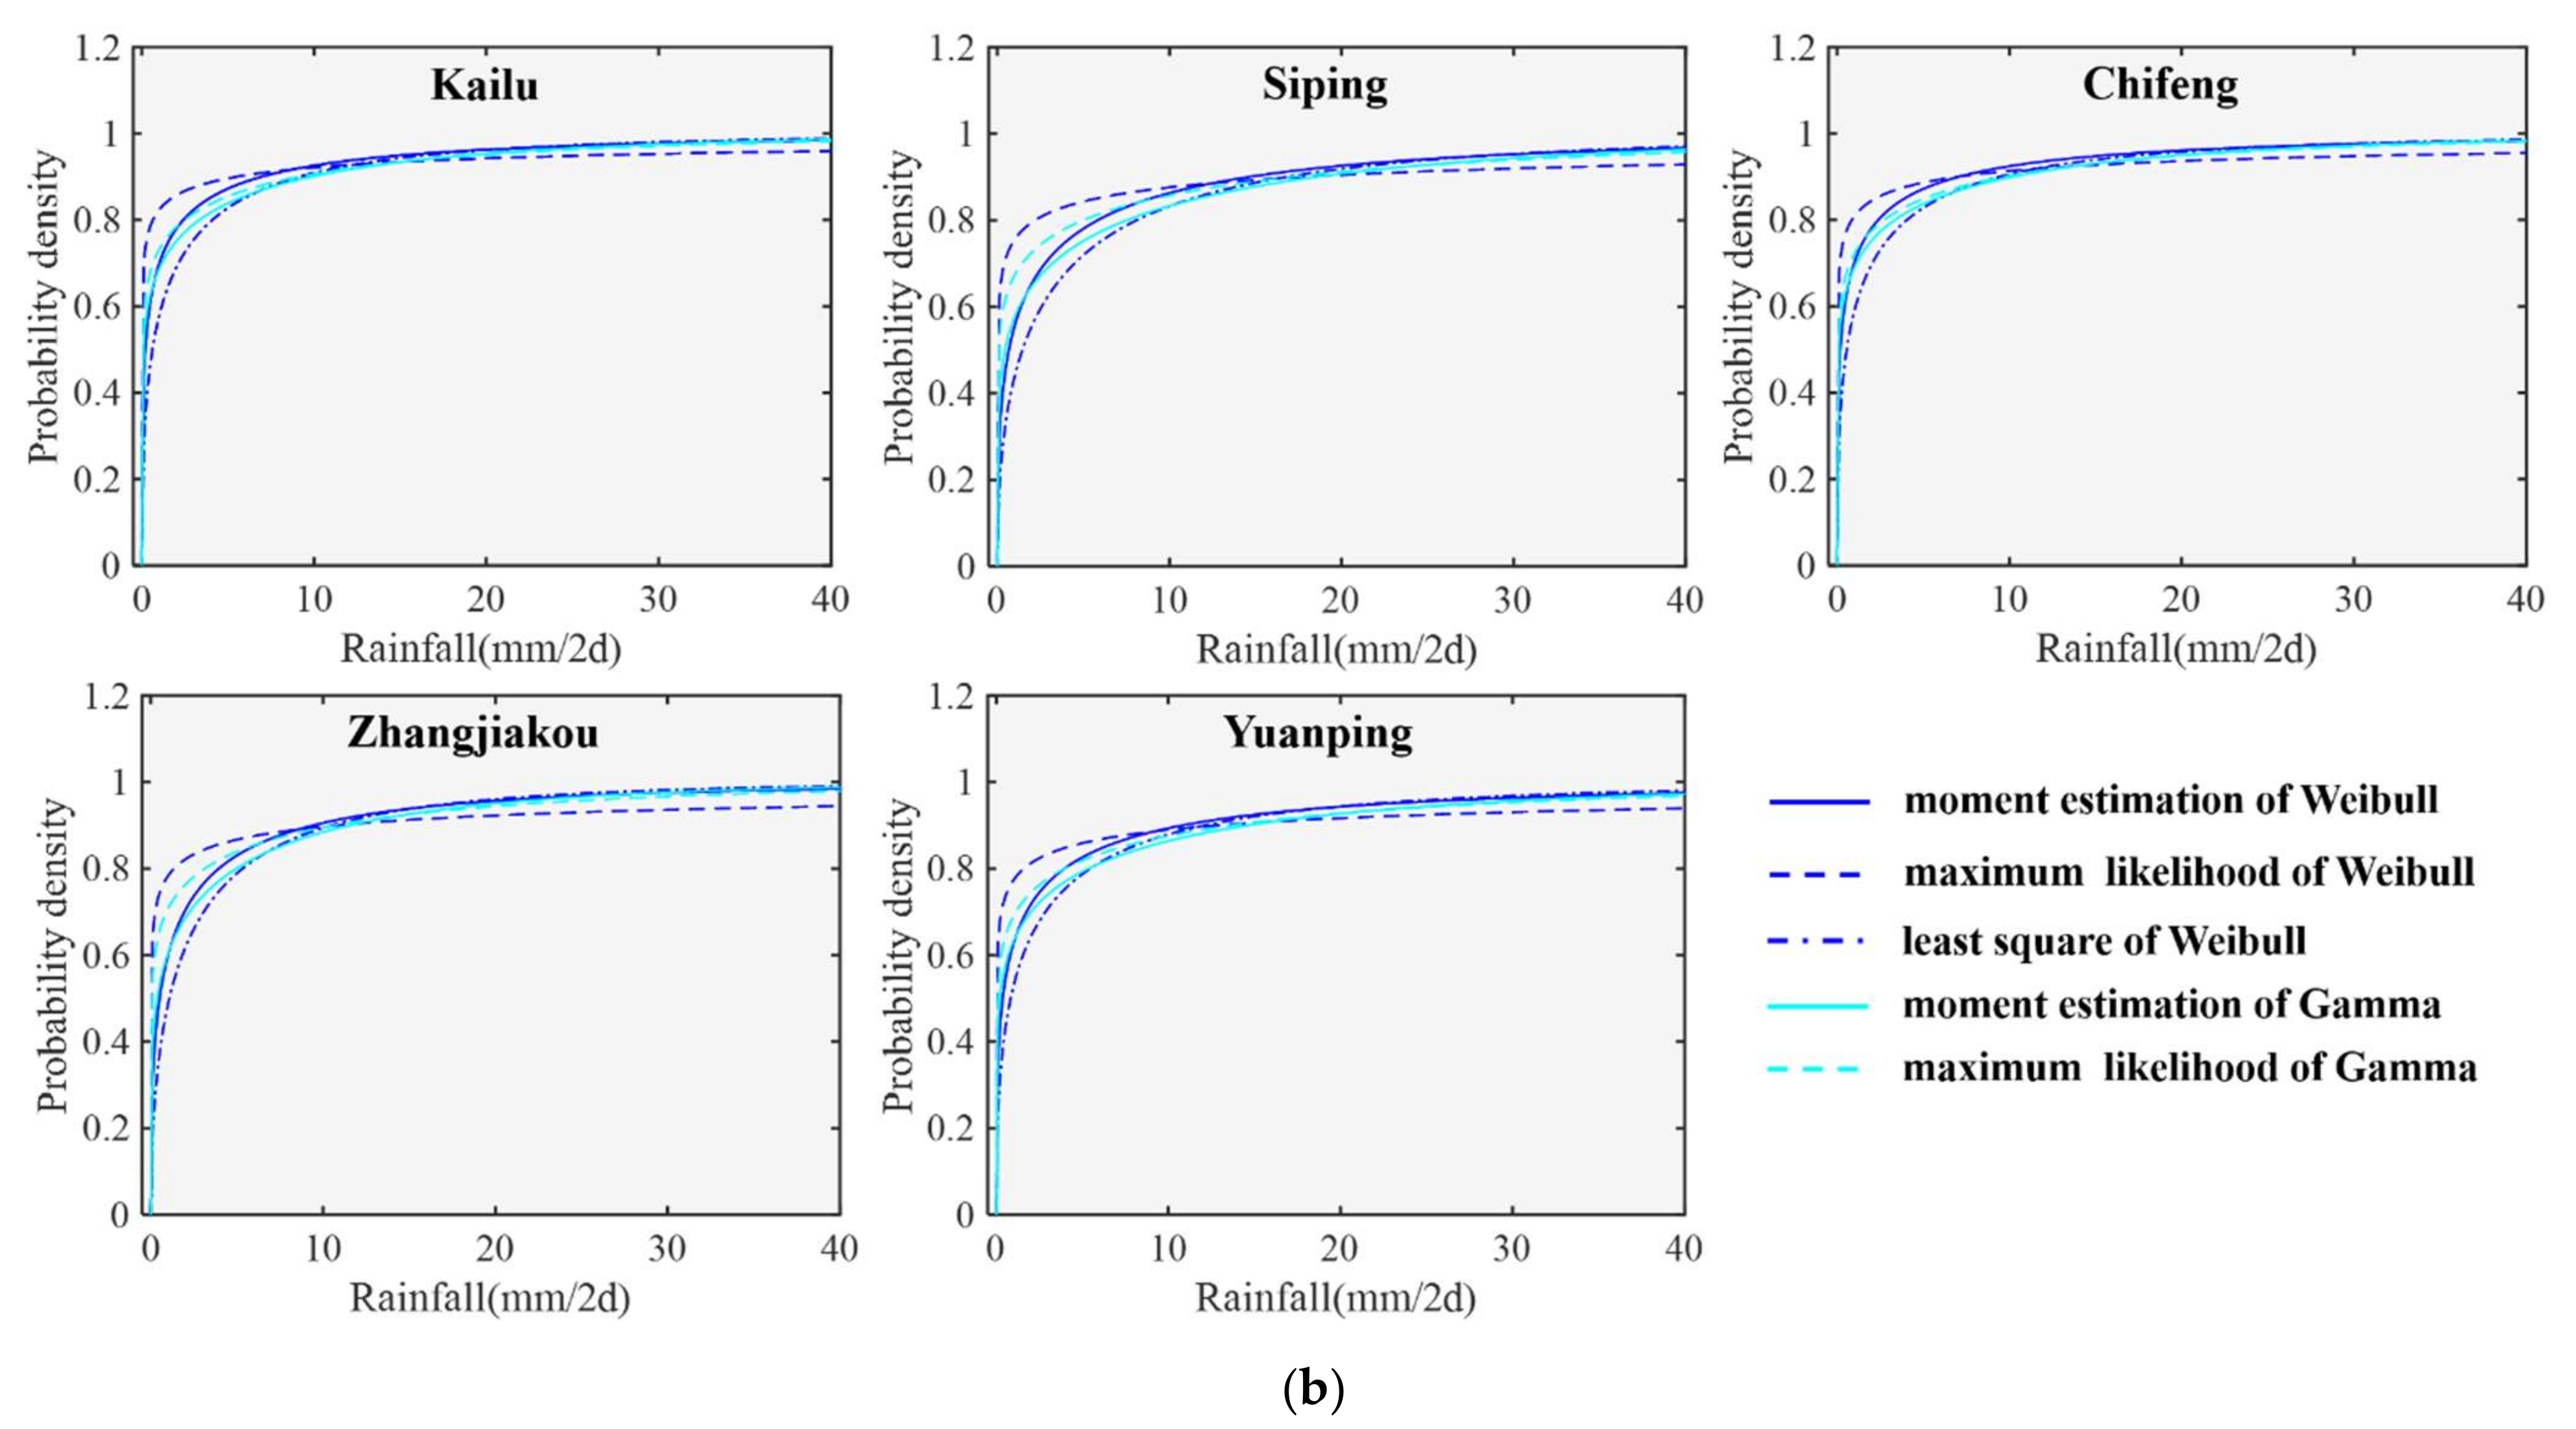
3.1. Optimal Edge Probability Distribution of Wind and Precipitation

There have been a large number of studies on the distribution of daily maximum wind speed and precipitation, which can basically determine the distribution types that they obey. Daily maximum wind speed follows a Weibull distribution [43,53], and precipitation follows Gamma or Weibull distribution [54,55]. Therefore, as described in Section 2.3, we used moment estimation, maximum likelihood, and the least squares method to determine their probability density and probability distribution function in Matlab (Matlab R2016a).
As can be seen from the probability density and probability distribution diagram (Figure 4) of the daily maximum wind speed, the probability density has the problem of insufficient estimation for peak value. The fitting performance of moment estimation and maximum likelihood is similar, while the least squares method is significantly lower than these two.
According to Equation (5), the fitting accuracy of different estimation methods was calculated (Table 1). Although the simulation results obtained by the three methods were different, they all proved that Weibull distribution could well describe the probability distribution of wind speed. The fitting performance of the moment estimation and maximum likelihood is better than that of the least square. The correlation coefficients of probability density and probability distribution are between 0.94–0.99 and 0.996–0.999, respectively, while the least square is 0.79–0.93 and 0.96–0.98. Since the fitting accuracy of the moment estimation is slightly higher than that of the maximum likelihood, the Weibull distribution based on the moment estimation was finally used in this paper.
According to the probability density and probability distribution diagram of precipitation for two consecutive days (Figure 5), it can be seen that, in most cases, the precipitation of meteorological stations is relatively small, and probability density presents an “L” distribution. The probability distribution curves obtained by Weibull based on different parameter estimation methods have great differences, while the differences based on Gamma fitting are small.
The fitting accuracy of the probability density and distribution of precipitation for two consecutive days with different models and parameter estimation methods was calculated (Table 2). Although meteorological stations with different annual average precipitation levels were selected, the accuracy did not show a different rule caused by precipitation levels.
For the probability density, the fitting performance of Weibull is better than Gamma, and the correlation coefficient is 0.91–0.97. Among this, the maximum likelihood and moment estimation method for the parameter estimation of Weibull are significantly higher than the least squares method. For the probability distribution, the fitting performance of Gamma is better than Weibull, and the correlation coefficient is 0.990–0.999. The maximum likelihood is slightly better than moment estimation method for the parameter estimation of Gamma distribution.
The fitting performance are as follows: Gamma based on maximum likelihood > Gamma based on moment estimation > Weibull based on maximum likelihood > Weibull based on moment estimation > Weibull based on least square. Since this study mainly focuses on the probability distribution of precipitation for two consecutive days, the Gamma distribution based on the maximum likelihood was finally used.
W-ME represents Weibull based on maximum likelihood method, G-ML is Gamma based on maximum likelihood method, and so on.

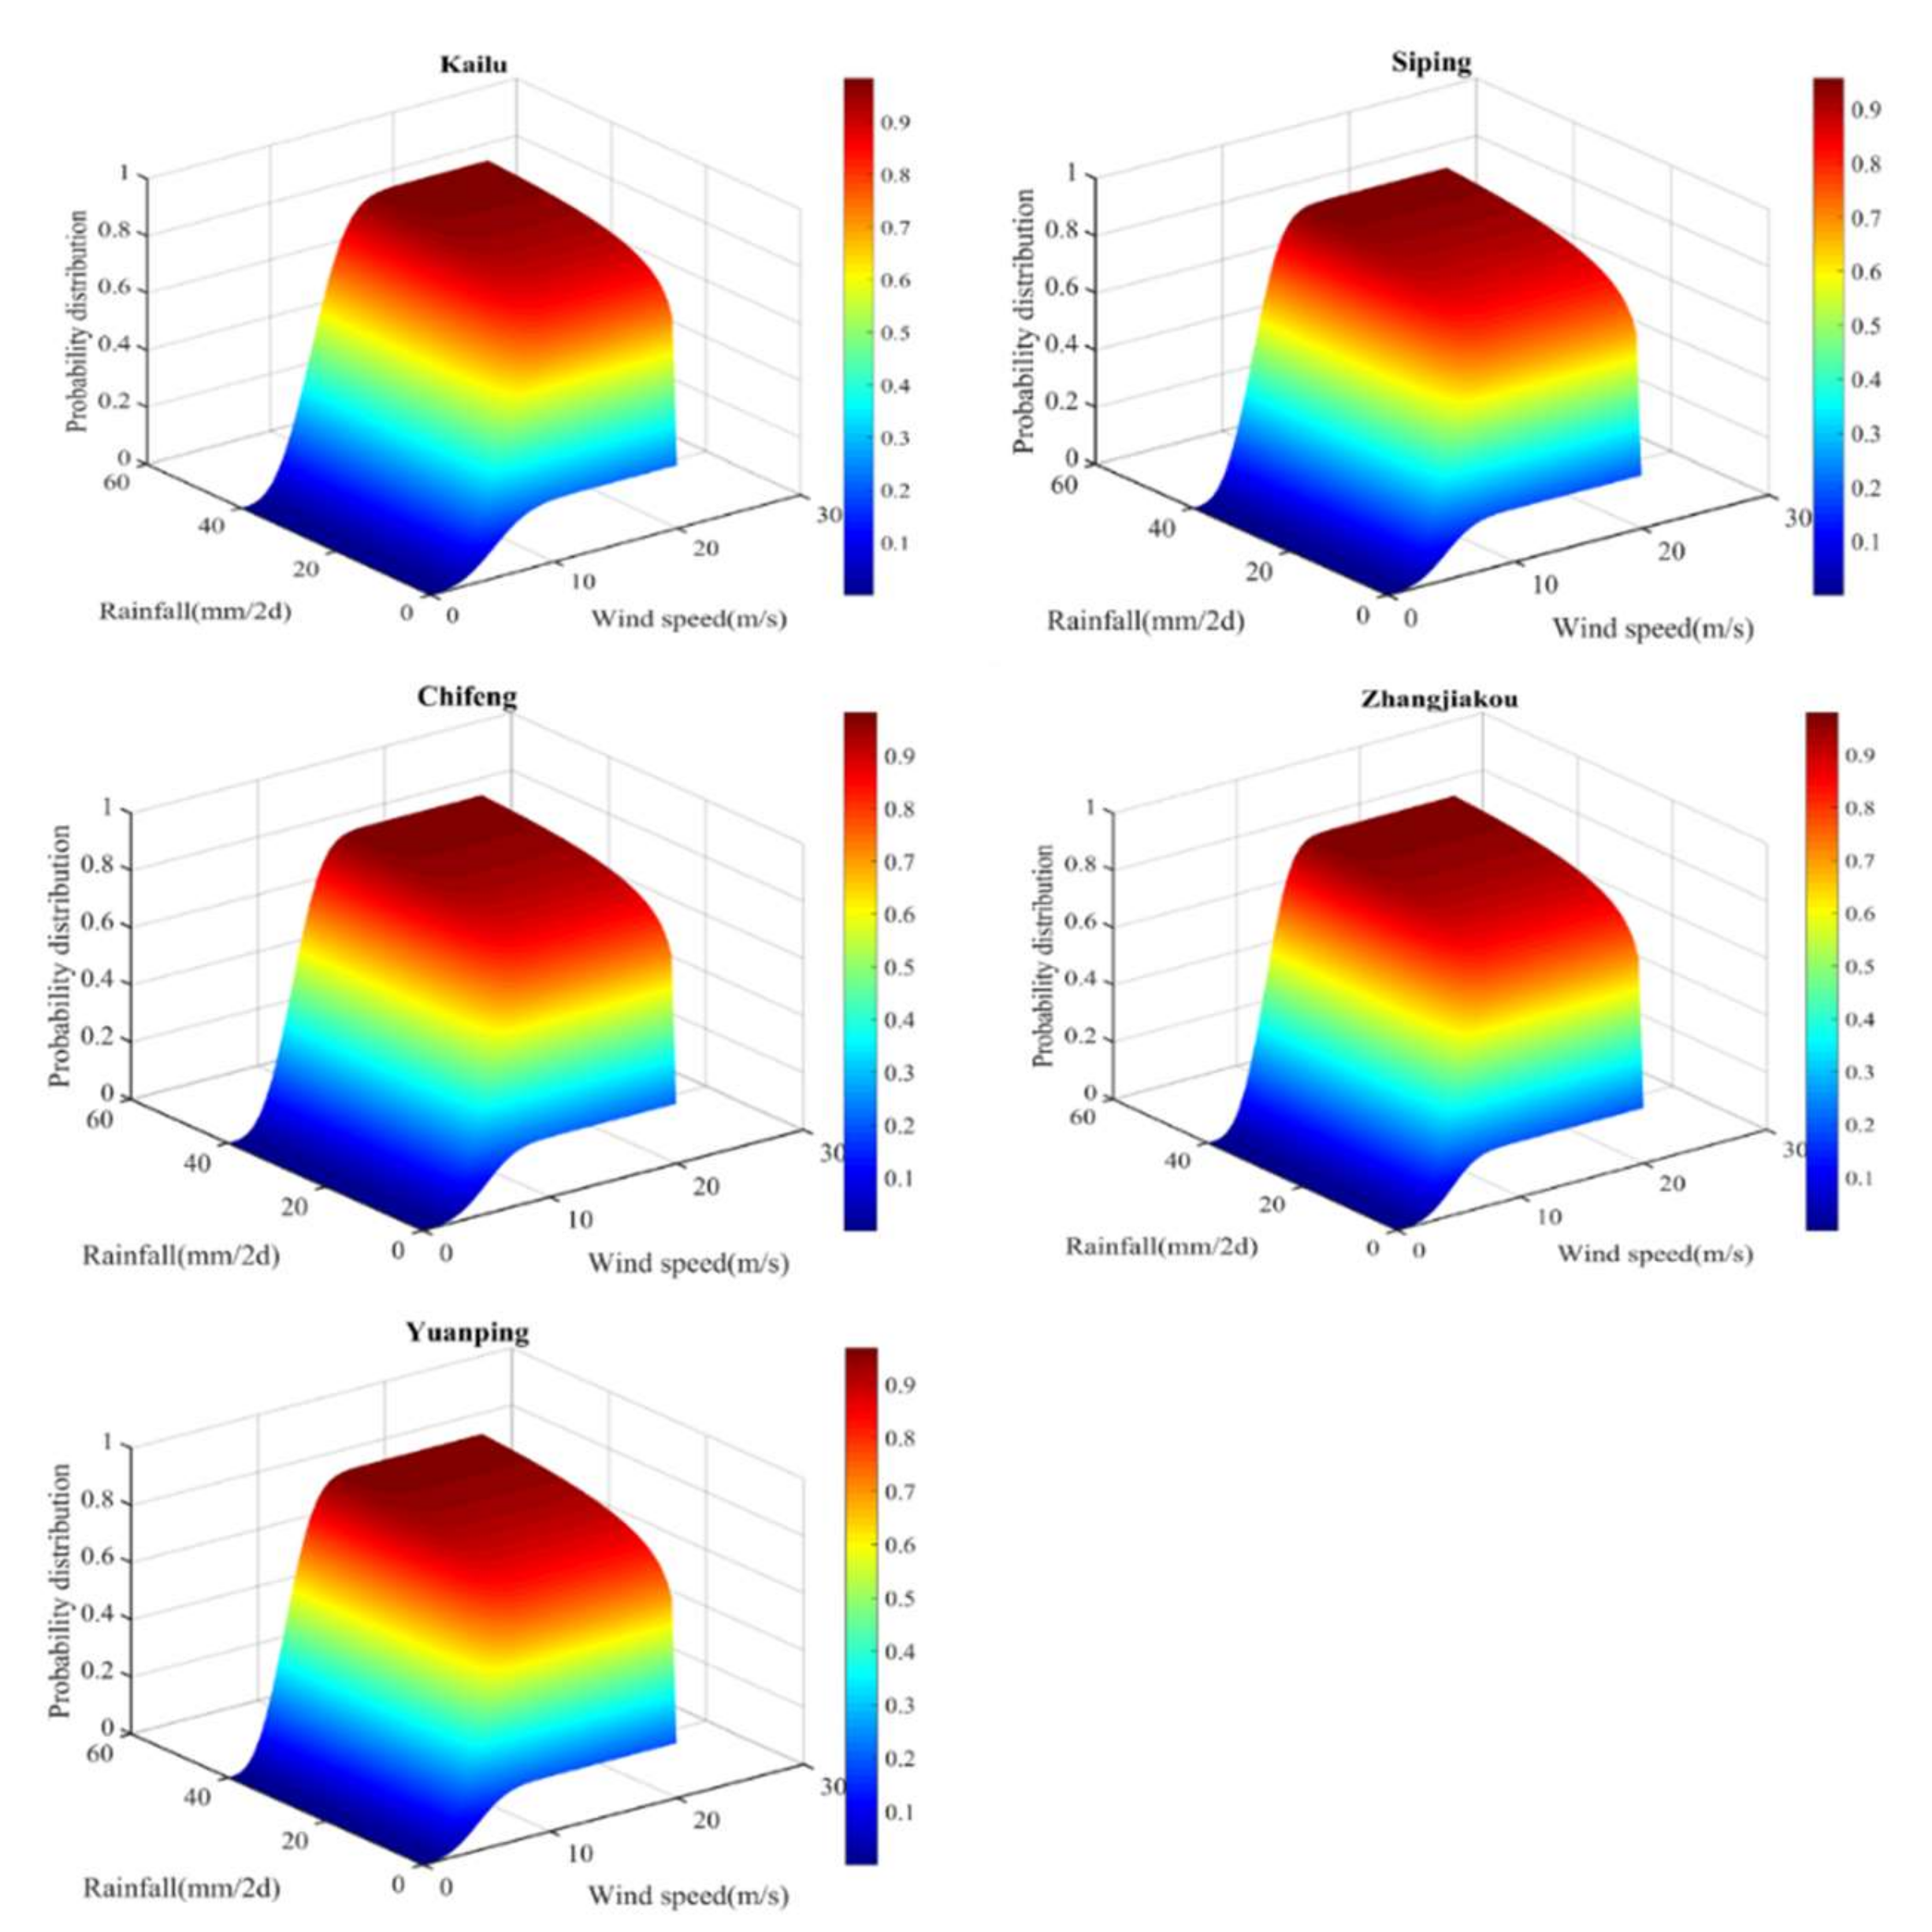
3.2. Joint Probability Distribution of Wind and Rainfall

The Kendall’s rank correlation coefficient (Equation (6)) between the maximum daily wind speed and precipitation for two consecutive days was used to estimate the parameters of the copula function, and the sum of squares of deviations between different copula functions and empirical copula function was calculated (Equation (8)) to evaluate the fitting accuracy (Table 3).
Among them, the Kendall’s rank correlation coefficient of Yuanping meteorological station was negative; therefore, the Frank copula function was finally selected for fitting; while other four meteorological stations were positive, and the fitting accuracy of the three copula functions was as follows: Gumbel copula > Frank copula > Clayton copula.
In conclusion, when there is a positive correlation between the daily maximum wind speed and precipitation at meteorological stations, the Gumbel copula function has the best performance. When there is a negative correlation, the Frank copula function would be the best choice. Figure 6 shows the joint probability distribution of wind and rainfall at each meteorological station. Taking Kailu and Siping stations for example, the joint probability distribution of the latter is flatter, indicating that the probability of extreme wind and rainfall events at this site is lower.

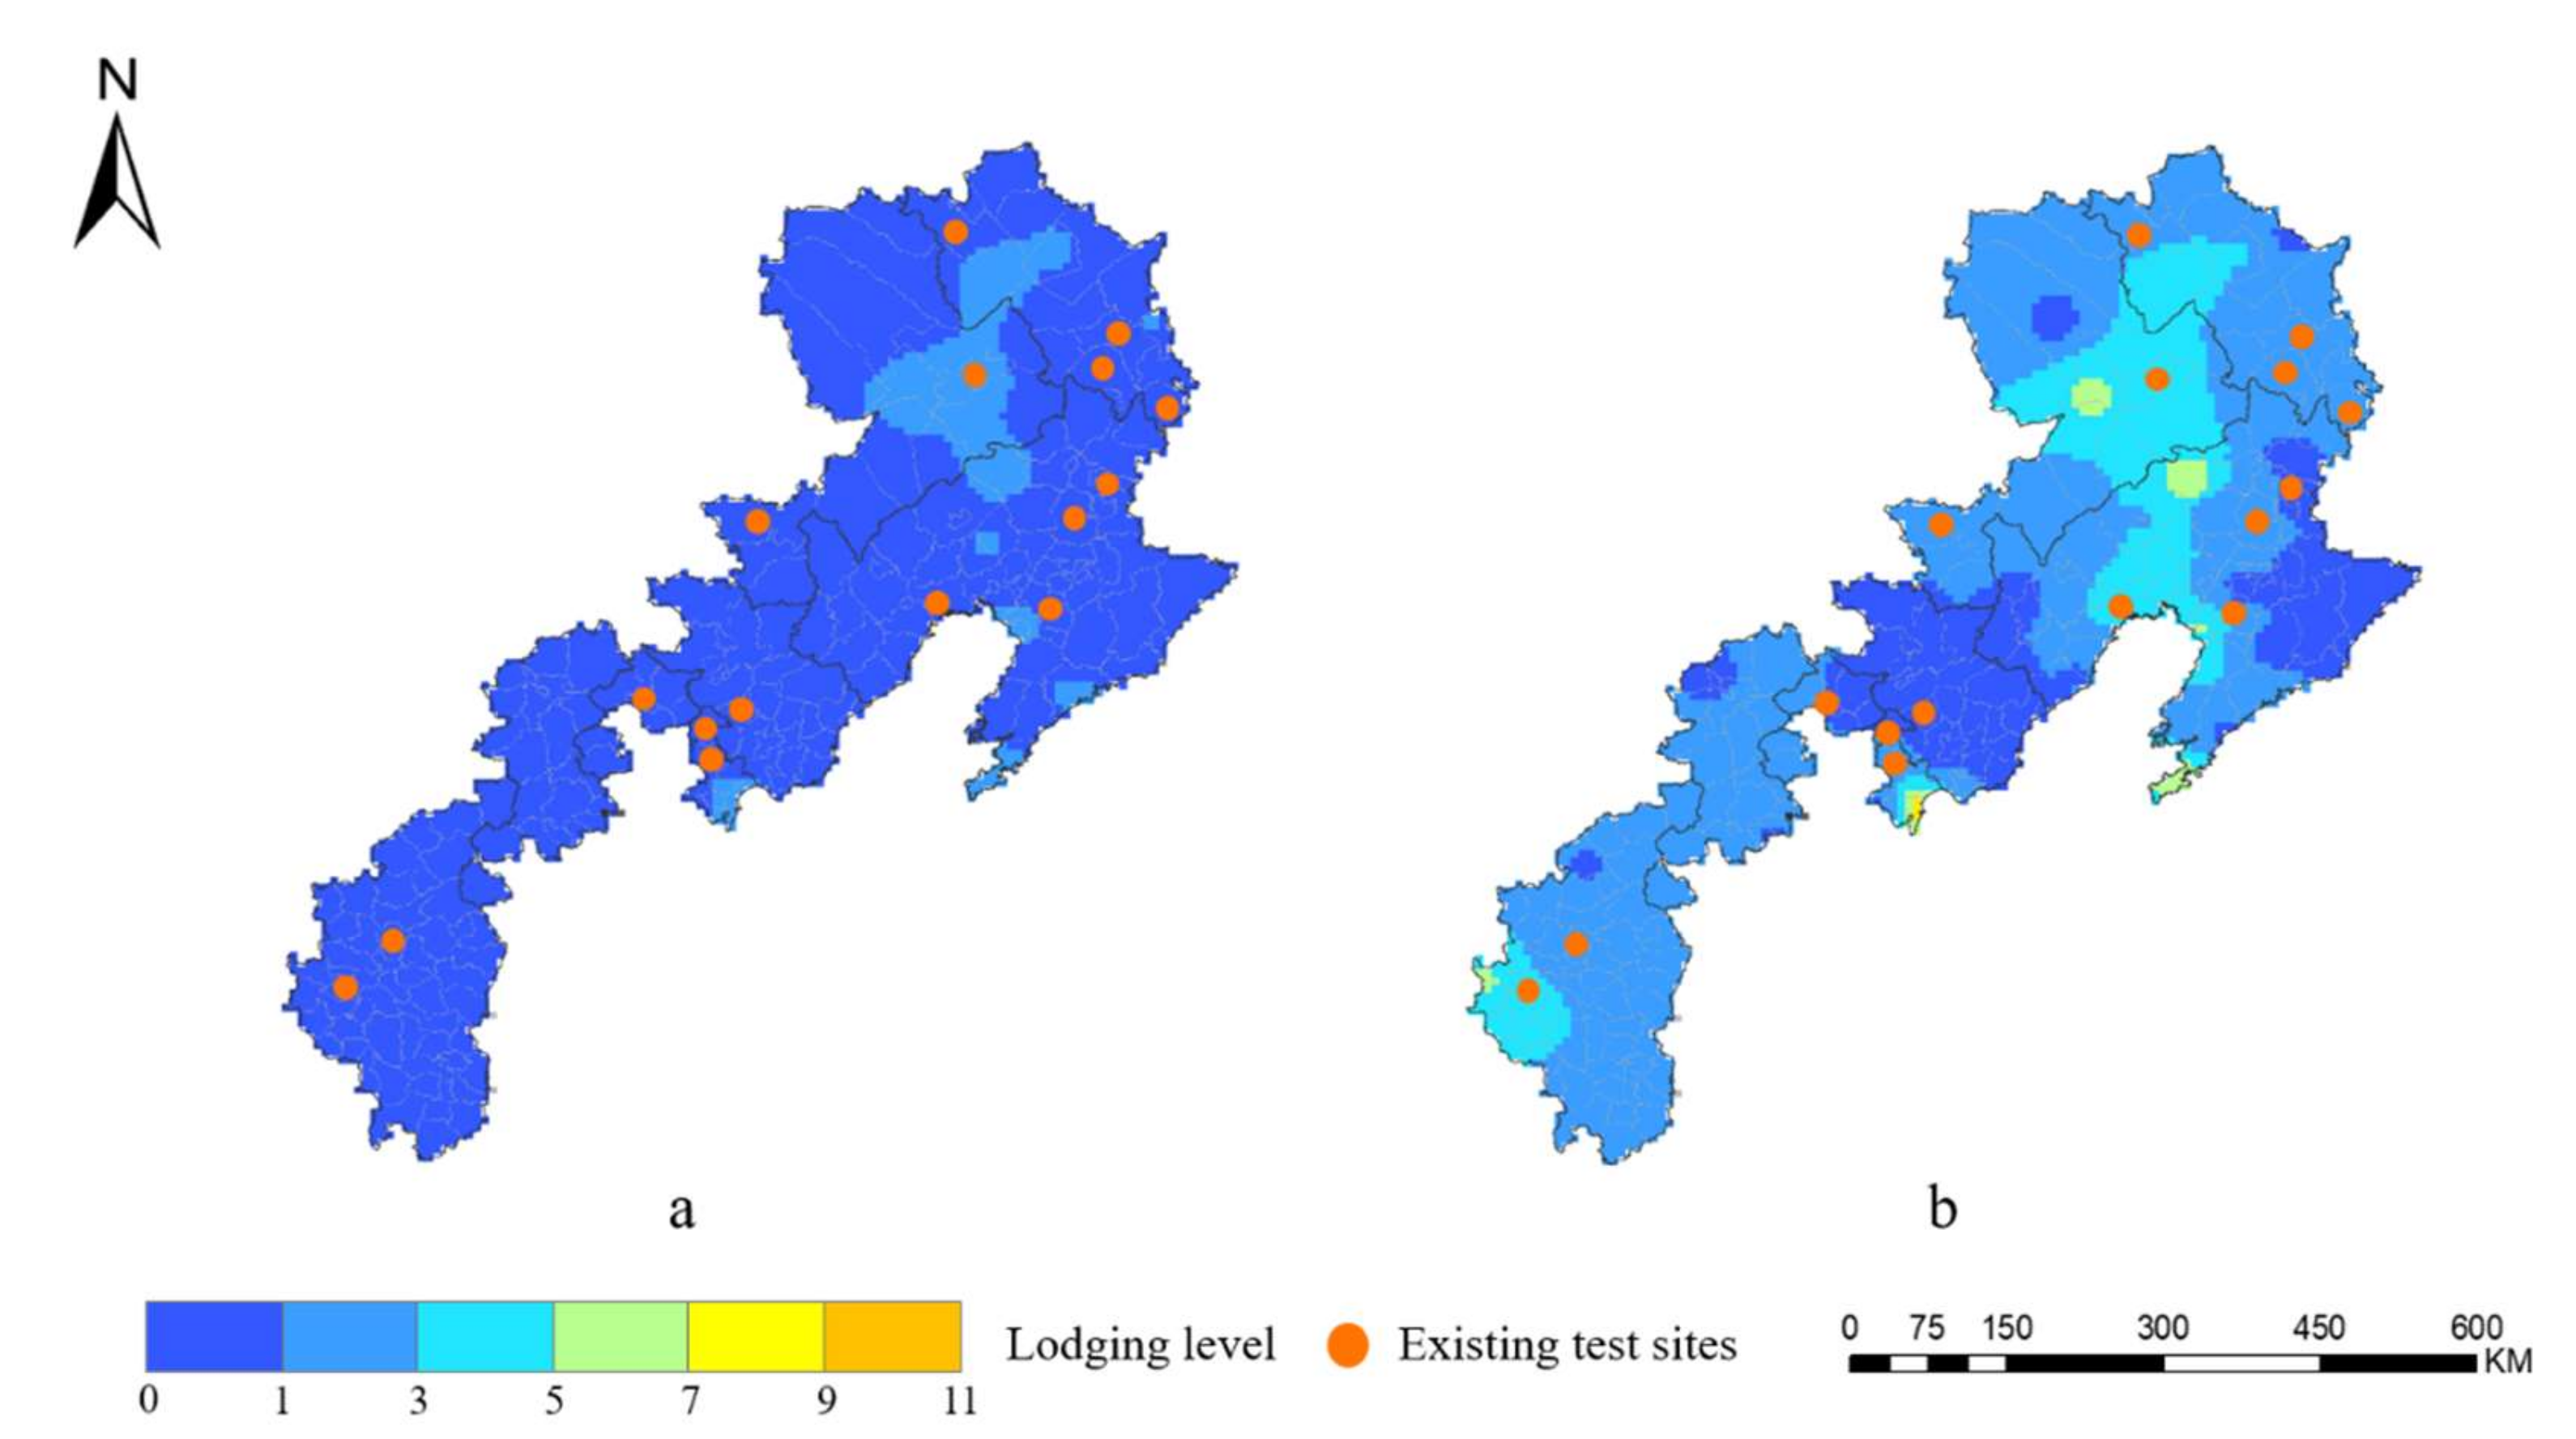
3.3. Risk Analysis of Lodging in Northeast and North China Plain

According to the content in Section 2.2, the corresponding relationship between maize lodging and meteorological elements was obtained (Table 4).
“Most”, “Partial” and “Few” represent > 75%, about 50%, <25% of maize varieties was lodging, respectively.
Lodging events are mostly caused by wind or wind and rain at the same time, and lodging caused by a single factor of precipitation account for a small proportion, which is consistent with the description in Section 2.2. This paper studied the lodging risk in the planting environment, that is, to cause a certain extent lodging to exclude the factors of the variety itself as much as possible. Therefore, we pay attention to the meteorological conditions that caused lodging of partial or more maize varieties in the regional trial report.
According to the above table, it can be known that lodging of partial maize varieties is mainly related to Fresh gale and Heavy rain and Fresh gale (there are 107 records of these two elements, while the total records corresponding to lodging of partial maize varieties is 160). Combined with the mechanism of different lodging types, the lodging type of maize corresponding to Fresh gale and Heavy rain is root lodging, while the lodging type corresponding to Fresh gale is stalk lodging.
According to the surface meteorological observation norms, Fresh gale refers to the instantaneous wind speed reaches scale 8 (17.2 m/s–20.7 m/s, see Table A1 in Appendix A for details). Since the wind speed index adopted in this paper is the daily maximum wind speed, the data of daily maximum wind speed corresponding to daily highest wind speed reaches scale 8 was calculated (Figure 7): in most areas (80% of the study area), the range of daily maximum wind speed is 7.8 m/s–13 m/s, within the range of scale of 5–6.
The threshold of saturating rain varies from region and degree of drought, in April to May is ≥10 mm in the north and central of China and ≥15 mm in the south; process rainfall (48 h) is ≥15 mm in the north and central of China and ≥20 mm in the south [56,57]. The study area in this paper is located in the north of China, and the corresponding process rainfall should be 15 mm. However, maize lodging always occurred in July–August, which is in the rainy season and different from April–May in the above regulations, and thus 10 mm was selected for analysis in this paper.
To obtain the lodging probability of each meteorological station, the precipitation threshold was set as 10 mm, and the maximum daily wind speed threshold was set as 10.8 m/s (start threshold of level 6 wind), 8.0 m/s (start threshold of level 5 wind) and 7.8 m/s. Then, the lodging risk level (lodging occurrence times) was calculated in combination with the days of lodging sensitive growth stage, and the spatial distribution diagram of root and stalk lodging under different thresholds was obtained by IDW (Figure 8) using the ArcGIS 10.2 spatial interpolation tool. At the same time, the average level of lodging events under different wind speed thresholds was calculated (Table 5).
Under the same threshold combination, the occurrence number of stalk lodging was two to four times that of root lodging, and the multiple relationship increased with the decrease of wind speed threshold. When the maximum daily wind speed > 10.8 m/s, the average occurrence number of root and stalk lodging are 0.036 and 0.068, respectively; when wind speed > 8.0 m/s, the average occurrence numbers of root and stalk lodging are 0.514 and 2.060, respectively; when the wind speed was greater than 7.8 m/s, the average occurrence number of these two are 0.599 and 2.498.
As for spatial distribution (Figure 8), when the maximum daily wind speed > 10.8 m/s, only the area with stalk lodging number ≥ 1 occurred, which was located in Tianjin, indicating that the threshold of wind speed was too large to effectively extract the lodging stress environment. When wind speed > 8.0 m/s, the regions with root lodging number ≥ 1 appeared in Tianjin and Tongyu, Jilin Province; Kailu, Inner Mongolia; and Dalian, Yingkou, and Zhangwu in Liaoning Province. At the same time, from Liaodong Bay northward to Tongyu, Jilin province, a band area with high frequency of stalk lodging was formed, and the occurrence probability in Kailu, Inner Mongolia; Dalian, Zhangwu in Liaoning Province; and Tianjin and Lvliang, Shanxi Province is relatively high. When the wind speed was greater than 7.8 m/s, the area with root lodging number ≥ 1 covered the northeast part of study area, and the area with stalk lodging number ≥ 1 covered almost the whole study area.

4. Discussion

There is only qualitative descriptions on the selection of test environment in China’s maize regional test industry standard [5], for instance according to the climate, soil conditions, and cultivation types. Based on these qualitative experiences, the probability and intensity of biotic and abiotic stress cannot be determined in test environment, and the probability of environmental stress is often low, which makes it impossible to detect the stress resistance of new varieties fully and effectively. Figure 9 shows the lodging risk level of the existing test sites, and the lodging probability of these sites is low. Only one site has the number of root lodging ≥ 1, which is difficult to meet the testing requirements.
Using the method proposed in this paper, we were able to select the environment that caused some or even more severe lodging of maize. In order to increase the probability of lodging and optimize the layout of maize test sites based on the research results, the following issues should be considered:
  • The maize lodging test sites serve to strengthen the detection of lodging resistance for new varieties; therefore, the testing environment should meet the requirements of high frequency of lodging events and moderate intensity.
  • Although the result obtained in this paper can screen out the areas with high frequency of maize root lodging and stalk lodging, there are also some areas where the degree of lodging is excessive. If test sites are arranged in these areas, most maize varieties will have lodging, which cannot achieve the purpose of distinguishing the lodging resistance ability among varieties. In conclusion, when selecting lodging environment for regional test, it is necessary to increase the upper threshold value of wind and rainfall to limit lodging intensity.
In addition, this paper only considered the influence of wind and rainfall on the lodging degree of maize. In fact, soil fertility and other factors also affect the lodging degree; for example, when maize is deficient in potassium, the stalk is thin and lodging easily occurs. In Mi Chunqiao’s [11,18] study, he considered the influence of the wind speed, planting density, and soil potassium content. In the future, we can also consider these factors and obtain more accurate spatial distribution of lodging risk. However, if this result is to serve the selection of lodging test sites, the field management of the test site is complete and potassium deficiency rarely occurs; thus, the weight of each factor can be adjusted to make the results more reasonable.

5. Conclusions

Mastering the lodging risk situation in the planting environment of maize is important for accurately selecting the lodging testing environment and assisting the detection of lodging resistance. This also has guiding significance for implementing agronomic inputs, such as fertilization. In view of the synergistic mechanism of multiple meteorological elements in lodging events, this study used the Archimedean copula function to fit the joint probability distribution of wind speed and precipitation. The spatial distribution of maize root and stalk lodging was obtained through combining with the occurrence situation of different lodging types. The main conclusions are as follows:
  • By comparing different estimation methods of function parameter and different probability distribution functions, the most suitable probability distribution functions of daily maximum wind speed and precipitation were the Weibull and Gamma functions, respectively, and the corresponding parameter estimation methods were the moment estimation and maximum likelihood method.
  • Copula functions are not limited by the edge distribution form. When the correlations between the maximum wind speed and precipitation are positive and negative, the most suitable joint probability functions are the Gumbel copula and Frank copula, respectively.
  • The area from Liaodong Bay northward to Tongyu, Jilin province in Northeast and North China Plain had a high frequency of lodging, in which the probability of stalk lodging was two to four times that of root lodging. The average occurrence number of root lodging and stalk lodging were 0.514 and 2.06, respectively (the threshold of maximum daily wind speed was 8.0 m/s).
Different from previous studies that only considered a single meteorological factor or the independent distribution of multiple elements on maize lodging, this paper considered the synergistic effect of wind and rainfall on maize lodging, and distinguished the occurrence scenarios of different lodging types, which was more in line with the actual situation. In order to help in stress resistance detection in the process of maize breeding, the layout of maize lodging test sites can be conducted on this basis to further optimize the existing maize variety test sites. In future research, we will optimize our lodging risk assessment models by considering other factors on lodging, such as the planting density and soil texture.

Author Contributions

Conceptualization, Xiaodong Zhang, Shaoming Li and Zhe Liu; methodology, Zhe Liu and Xuli Zan; formal analysis, Xuli Zan and Zhe Liu; investigation, Xuli Zan, Xiang Gao and Wei Liu; data curation, Ziyao Xing, Xiang Gao and Wei Liu; writing—review and editing, Zhe Liu and Xuli Zan; visualization, Ziyao Xing and Xuli Zan. All authors have read and agreed to the published version of the manuscript.

Funding

This research was funded by National Key Research and Development Program of China, grant number 2021YFE0205100.

Institutional Review Board Statement

Not applicable.

Informed Consent Statement

Not applicable.

Data Availability Statement

Not applicable.

Conflicts of Interest

The authors declare no conflict of interest.

Appendix A

Table A1. The scale of wind force summary. (Unit: m/s).
Wind scale0123456
Wind nameCalmLight
air
Light
breeze
Gentle breezeModerate breezeFresh
breeze
Strong breeze
Wind speed0–20.3–1.51.6–3.33.4–5.45.5–7.98.0–10.710.8–13.8
Wind scale789101112
Wind nameModerate
gale
Fresh
gale
Strong
gale
Whole
gale
StormHurricane
Wind speed13.9–17.117.2–20.720.8–24.424.5–28.428.5–32.632.7–36.9

References

  1. Cheng, F.L.; Xiong, D.U.; Liu, M.X.; Jin, X.L.; Cui, Y.H. Lodging of summer maize and the effects on grain yield. J. Maize Ences 2011, 19, 105–108. [Google Scholar]
  2. Sekhon, R.S.; Joyner, C.N.; Ackerman, A.J.; McMahan, C.S.; Cook, D.D.; Robertson, D.J. Stalk bending strength is strongly associated with maize stalk lodging incidence across multiple environments. Field Crop. Res. 2020, 249, 107737. [Google Scholar] [CrossRef]
  3. Liu, S.; Song, F.; Liu, F.; Zhu, X.; Xu, H. Effect of planting density on root lodging resistance and its relationship to nodal root growth characteristics in maize (Zea mays L.). J. Agric. Sci. 2012, 4, 182. [Google Scholar] [CrossRef] [Green Version]
  4. Ma, D.; Xie, R.; Liu, X.; Niu, X.; Hou, P.; Wang, K.; Lu, Y.; Li, S. Lodging-related stalk characteristics of maize varieties in China since the 1950s. Crop Sci. 2014, 54, 2805–2814. [Google Scholar] [CrossRef]
  5. Liu, Z.; Li, S.M.; Yang, J.Y.; Yang, Y.; Zhu, D.H. Method of test environments selection for corn lodging resistance. Nongye Gongcheng Xuebao/Trans. Chin. Soc. Agric. Eng. 2010, 26, 167–171. [Google Scholar]
  6. Hondroyianni, E.; Papakosta, D.K.; Gagianas, A.; Tsatsarelis, K.A. Corn stalk traits related to lodging resistance in two soils of differing salinity. Maydica 2000, 45, 125–133. [Google Scholar]
  7. Robertson, D.J.; Julias, M.; Lee, S.Y.; Cook, D.D. Maize stalk lodging: Morphological determinants of stalk strength. Crop Sci. 2017, 57, 926–934. [Google Scholar] [CrossRef] [Green Version]
  8. Robertson, D.J.; Lee, S.Y.; Julias, M.; Cook, D.D. Maize Stalk Lodging: Flexural Stiffness Predicts Strength. Crop Sci. 2016, 56, 1711–1718. [Google Scholar] [CrossRef] [Green Version]
  9. Bian, D.; Jia, G.; Cai, L.; Ma, Z.; Eneji, A.E.; Cui, Y. Effects of tillage practices on root characteristics and root lodging resistance of maize. Field Crop. Res. 2016, 185, 89–96. [Google Scholar] [CrossRef]
  10. Shi, D.; Li, Y.; Zhang, J.; Liu, P.; Zhao, B.; Dong, S. Effects of plant density and nitrogen rate on lodging-related stalk traits of summer maize. Plant Soil Environ. 2016, 62, 299–306. [Google Scholar]
  11. Mi, C.; Zhang, X.; Li, S.; Yang, J.; Zhu, D.; Yang, Y. Assessment of environment lodging stress for maize using fuzzy synthetic evaluation. Math. Comput. Model. 2011, 54, 1053–1060. [Google Scholar] [CrossRef]
  12. Esechie, H.; Rodriguez, V.; Al-Asmi, H. Comparison of local and exotic maize varieties for stalk lodging components in a desert climate. Eur. J. Agron. 2004, 21, 21–30. [Google Scholar] [CrossRef]
  13. Wang, H.L.; Wu, R.H.; Zhu, K.; Zhang, Y.C.; Zhang, Y.J.; Sun, J.W. Reviews of Causes and Control of Maize Lodging. J. Henan Agric. Sci. 2011, 40, 1–5. [Google Scholar]
  14. Finlay, K.W.; Wilkinson, G.N.; Finlay, K.W.; Wilkinson, G.N. The analysis of adaptation in a plant-breeding programme. Aust. J. Agric. Res. 1963, 14, 742–754. [Google Scholar] [CrossRef] [Green Version]
  15. Costa-Neto, G.M.F.; Morais, O.P., Jr.; Heinemann, A.B.; de Castro, A.P.; Duarte, J.B. A novel GIS-based tool to reveal spatial trends in reaction norm: Upland rice case study. Euphytica 2020, 216, 1–16. [Google Scholar]
  16. Mi, C.; Li, S.; Zhang, X.; Yang, J.; Zhu, D.; Zhe, L. Predicting the yield of varieties of maize in a target environment using regression analysis. Math. Comput. Model. 2011, 54, 1010–1015. [Google Scholar] [CrossRef]
  17. Yang, Y. Study and Application of Methods for Predicting Corn Lodging Stress Using Environment Factors. Ph.D. Thesis, China Agricultural University, Beijing, China, 2012. [Google Scholar]
  18. Mi, C. Maize Variety Suitability Evaluation based on GIS. Ph.D. Thesis, China Agricultural University, Beijing, China, 2012. [Google Scholar]
  19. Guo, Q.F.; Wang, Q.C.; Wang, L.M. Maize Cultivation in China; Shanghai Scientific & Technical Publishers: Shanghai, China, 1986. [Google Scholar]
  20. Crop Growth and Farmland Soil Moisture Dataset. Available online: http://www.nmic.cn/data/cdcdetail/dataCode/AGME_AB2_CHN_TEN.html (accessed on 10 August 2021).
  21. Daily Dataset of Surface Climatic Data. Available online: http://www.nmic.cn/data/cdcdetail/dataCode/SURF_CLI_CHN_MUL_DAY_CES_V3.0.html (accessed on 10 August 2021).
  22. Liao, Q.; Sun, S. Dynamics of New Maize Varieties in China: Regional Trial Report of National Maize Varieties in 2001; China Agricultural Science and Technology Press: Beijing, China, 2002. [Google Scholar]
  23. National Agro-Tech Extension and Service Center. Dynamics of New Maize Varieties in China: Regional Trial Report of National Maize Varieties in 2002; China Agricultural Science and Technology Press: Beijing, China, 2003. [Google Scholar]
  24. National Agro-Tech Extension and Service Center. Dynamics of New Maize Varieties in China: Regional Trial Report of National Maize Varieties in 2003; China Agricultural Science and Technology Press: Beijing, China, 2004. [Google Scholar]
  25. National Agro-Tech Extension and Service Center. Dynamics of New Maize Varieties in China: Regional Trial Report of National Maize Varieties in 2004; China Agricultural Science and Technology Press: Beijing, China, 2005. [Google Scholar]
  26. National Agro-Tech Extension and Service Center. Dynamics of New Maize Varieties in China: Regional Trial Report of National Maize Varieties in 2005; China Agricultural Science and Technology Press: Beijing, China, 2006. [Google Scholar]
  27. National Agro-Tech Extension and Service Center. Dynamics of New Maize Varieties in China: Regional Trial Report of National Maize Varieties in 2006; China Agricultural Science and Technology Press: Beijing, China, 2007. [Google Scholar]
  28. National Agro-Tech Extension and Service Center. Dynamics of New Maize Varieties in China: Regional Trial Report of National Maize Varieties in 2007; China Agricultural Science and Technology Press: Beijing, China, 2008. [Google Scholar]
  29. National Agro-Tech Extension and Service Center. Dynamics of New Maize Varieties in China: Regional Trial Report of National Maize Varieties in 2008; China Agricultural Science and Technology Press: Beijing, China, 2009. [Google Scholar]
  30. National Agro-Tech Extension and Service Center. Dynamics of New Maize Varieties in China: Regional Trial Report of National Maize Varieties in 2009; China Agricultural Science and Technology Press: Beijing, China, 2010. [Google Scholar]
  31. National Agro-Tech Extension and Service Center. Dynamics of New Maize Varieties in China: Regional Trial Report of National Maize Varieties in 2010; China Agricultural Science and Technology Press: Beijing, China, 2011. [Google Scholar]
  32. National Agro-Tech Extension and Service Center. Dynamics of New Maize Varieties in China: Regional Trial Report of National Maize Varieties in 2011; China Agricultural Science and Technology Press: Beijing, China, 2012. [Google Scholar]
  33. Ling, G.; Jianjun, H.; Bin, Z.; Tao, L.; Rui, S.; Ming, Z. Effects of Population Density on Stalk Lodging Resistant Mechanism and Agronomic Characteristics of Maize. J. Acta Agron. Sinica. 2007, 10, 1688–1695. [Google Scholar]
  34. Jun, X.; Xie, R.-Z.; ZHANG, W.-F.; WANG, K.-R.; Peng, H.; Bo, M.; Ling, G.; Shaokun, L. Research progress on reduced lodging of high-yield and-density maize. J. Integr. Agric. 2017, 16, 2717–2725. [Google Scholar]
  35. Xu, L.; Huang, S.; Gang, C.; Tao, H.; Pu, W. The Research Progress in Anti-lodging Cultivation Techniques of Maize. J. Crops. 2012, 01, 5–8. [Google Scholar]
  36. Xue, J.; Wang, K.; Xie, R.; Gou, L.; Zhang, W.; Ming, B.; Hou, P.; Li, S. Research progress of maize lodging during late stage. Sci. Agric. Sin. 2018, 51, 1845–1854. [Google Scholar]
  37. Qun, W.; Jun, X.; Chen, J.-l.; Fan, Y.-h.; Zhang, G.-Q.; Xie, R.-Z.; Bo, M.; Peng, H.; Wang, K.-R.; Li, S.-K. Key indicators affecting maize stalk lodging resistance of different growth periods under different sowing dates. J. Integr. Agric. 2020, 19, 2419–2428. [Google Scholar]
  38. Chen, J. Relationship between Maximum 10-Minute Average Wind Speed and Maximum Instantaneous Wind Speed and Estimating Equation. Meteorol. Mon. 2001, 10, 38–41. [Google Scholar]
  39. Feng, G.; Huang, C.L.; Xing, J.F. The Research Progress in Lodging Resistance of Maize. Crops 2008, 4, 12–14. [Google Scholar]
  40. Okhrin, O.; Tetereva, A. The realized hierarchical Archimedean Copula in risk modelling. Econometrics 2017, 5, 26. [Google Scholar] [CrossRef] [Green Version]
  41. Genest, C.; Nešlehová, J.; Ziegel, J. Inference in multivariate Archimedean copula models. Test 2011, 20, 223. [Google Scholar] [CrossRef]
  42. Al-Fawzan, M.A. Methods for Estimating the Parameters of the Weibull Distribution. King Abdulaziz City for Science and Technology, Saudi Arabia. 2000. Available online: https://www.researchgate.net/publication/228558841_Methods_for_Estimating_the_Parameters_of_the_Weibull_Distribution/stats (accessed on 26 October 2021).
  43. Bhattacharya, P.; Bhattacharjee, R. A study on Weibull distribution for estimating the parameters. J. Appl. Quant. Methods 2010, 5, 234–241. [Google Scholar] [CrossRef]
  44. Islam, M.; Saidur, R.; Rahim, N. Assessment of wind energy potentiality at Kudat and Labuan, Malaysia using Weibull distribution function. Energy 2011, 36, 985–992. [Google Scholar] [CrossRef]
  45. Saleh, H.; Aly, A.A.E.-A.; Abdel-Hady, S. Assessment of different methods used to estimate Weibull distribution parameters for wind speed in Zafarana wind farm, Suez Gulf, Egypt. Energy 2012, 44, 710–719. [Google Scholar] [CrossRef]
  46. Zhang, X.; Ran, Q.X.; Xia, J.; Song, X.Y. Jointed distribution function of water quality and water quantity based on Copula. J. Hydraul. Eng. 2011, 42, 483–489. [Google Scholar]
  47. Guo, S.; Yan, B.; Xiao, Y.; Fang, B.; Zhang, N. Multivariate Hydrological Analysis and Estimation. J. China Hydrol. 2008, 3, 1–7. [Google Scholar]
  48. Genest, C.; Rivest, L.-P. Statistical inference procedures for bivariate Archimedean copulas. J. Am. Stat. Assoc. 1993, 88, 1034–1043. [Google Scholar] [CrossRef]
  49. Han, X.Y. Wind Characteristics of Typhoons and Statistical Analysis of Wind Velocity and Rainfall Intensity Joint Probability Distribution. Ph.D. Thesis, Hunan University of Science and Technology, Xiangtan, China, 2015. [Google Scholar]
  50. Wu, Z.K.; Zhao, L.; Ge, Y.J. Statistical analysis of wind velocity and rainfall intensity joint probability distribution of Shanghai area in typhoon condition. Acta Aerodyn. Sin. 2010, 28, 393–399. [Google Scholar]
  51. Song, L.; Tian, Y.; Lun, W.U.; Zhang, H. On Comparison of Spatial Interpolation Methods of Daily Rainfall Data:A Case Study of Shenzhen. Geo.-Inf. Sci. 2008, 5, 566–572. [Google Scholar]
  52. Zhang, J.; Guo, L.; Zhang, X. Effects of interpolation parameters in inverse distance weighted method on DEM accuracy. J. Geomat. Sci. Technol. 2012, 29, 51–56. [Google Scholar]
  53. Ozay, C.; Celiktas, M.S. Statistical analysis of wind speed using two-parameter Weibull distribution in Alaçatı region. Energy Convers. Manag. 2016, 121, 49–54. [Google Scholar] [CrossRef]
  54. Sharma, M.A.; Singh, J.B. Use of probability distribution in rainfall analysis. N. Y. Sci. J. 2010, 3, 40–49. [Google Scholar]
  55. Wilks, D.S. Rainfall intensity, the Weibull distribution, and estimation of daily surface runoff. J. Appl. Meteorol. Climatol. 1989, 28, 52–58. [Google Scholar] [CrossRef] [Green Version]
  56. Bian, T.; Guocui, L.I.; Sun, Y.; Che, S. Temporal and Spatial Features of the First Soaking Rain in Spring in Shijiazhuang. J. Arid Meteorol. 2010, 28, 179–183. [Google Scholar]
  57. Qian, J.X.; Wang, Z.H.; Zhao, G.X. Analysis on Rainfall Feature and Its Probablity in Earlier Maize Growth Period in Shanxi Province. J. Maize Ences 2006, 5, 163–165. [Google Scholar]
Figure 1. Diagram of the study area.
Ijgi 10 00723 g001
Figure 2. Corresponding relation between maximum wind speed and highest wind speed from 2005 to 2015 in the Northeast and North China Plain.
Ijgi 10 00723 g002
Figure 3. Planar projection of the joint probability distribution.
Ijgi 10 00723 g003
Figure 4. Probability density and probability distribution diagram of daily maximum wind speed. (a) Probability density and (b) probability distribution.
Ijgi 10 00723 g004
Figure 5. Probability density and probability distribution diagram of precipitation. (a) Probability density and (b) probability distribution.
Ijgi 10 00723 g005aIjgi 10 00723 g005b
Figure 6. Joint probability distribution of wind and rain.
Ijgi 10 00723 g006
Figure 7. The distribution of the daily maximum wind speed.
Ijgi 10 00723 g007
Figure 8. Spatial distribution of the maize root and stalk lodging level. Levels 0 to 11 are lodging occurrence times in the sensitive growth stage, while the lodging degree is partial and above, “a” series represent the distribution of maize root lodging, “b” series represent the distribution of maize stalk lodging, and X and Y, respectively, represent the maximum daily wind speed and precipitation.
Ijgi 10 00723 g008
Figure 9. Lodging risk level for existing test sites. Levels 0 to 11 are lodging occurrence times in sensitive growth stage while lodging degree is partial and above, (a,b) represent the level of root and stalk lodging risk, respectively.
Ijgi 10 00723 g009
Table 1. Accuracy evaluation of probability density and probability distribution for daily maximum wind speed.
Meteorological Stationr (Probability Density)R (Probability Distribution)
Moment
Estimation
Maximum LikelihoodLeast
Square
Moment
Estimation
Maximum LikelihoodLeast
Square
Kailu0.9500.9520.8200.9970.9970.980
Siping0.9470.9490.8270.9970.9970.982
Chifeng0.9550.9560.8170.9970.9970.978
Zhangjiakou0.9520.9540.8250.9970.9970.982
Yuanping0.9440.9420.7990.9960.9960.973
Table 2. Accuracy evaluation of probability density and probability distribution for precipitation.
Meteorological Stationr (Probability Density)R (Probability Distribution)
W-MEW-MLW-LSG-MEG-MLW-MEW-MLW-LSG-MEG-ML
Kailu0.9550.9640.9330.9270.9320.9810.9940.9750.9970.999
Siping0.9500.9650.9260.9260.9370.9780.9860.9730.9950.996
Chifeng0.9640.9700.9460.9370.9400.9910.9930.9880.9990.999
Zhangjiakou0.9400.9630.9080.9200.9350.9800.9890.9740.9950.996
Yuanping0.9720.9720.9640.9440.9470.9870.9500.9780.9970.994
Table 3. Sum of squares of deviations for copula.
Meteorological
Station
Gumbel CopulaClayton CopulaFrank Copula
Kailu0.00300.00690.0038
Siping0.00680.00880.0080
Chifeng0.00740.00770.0074
Zhangjiakou0.00710.01010.0085
Yuanping//0.0088
Table 4. The corresponding relationship between maize lodging and meteorological elements (Unit: time).
Meteorological
Elements
Occurrence Degree of Maize Lodging
AllMostPartialFewWithout Record
Storm and Rainstorm27256/
Fresh gale and Rainstorm132518
Fresh gale and Heavy rain/9621513
Typhoon12311
Fresh gale12451314
Table 5. The occurrence numbers of lodging events.
Wind Speed
Threshold (m/s)
MaximumMinimumAverage
Root
Lodging
Stalk
Lodging
Root
Lodging
Stalk
Lodging
Root
Lodging
Stalk
Lodging
>10.80.5481.265000.0360.068
>8.02.0987.8800.0070.0110.5142.060
>7.82.2538.6900.0110.0150.5992.498
The occurrence number of lodging is the product of lodging probability and lodging sensitive growth stage days, which is not rounded so as to compare the difference in lodging probability.
Publisher’s Note: MDPI stays neutral with regard to jurisdictional claims in published maps and institutional affiliations.

