
Usability of WebXR Visualizations in Urban Planning


Abstract
:1. Introduction
1.1. XR Spectrum and Terminology
1.2. XR in Urban Planning and GIS
2. Materials and Methods
2.1. Development of the WebXR Application
2.2. Usability Testing and Survey
3. Results
3.1. Numerical Evaluation
3.2. Problems with WebXR Identified by the Users
3.3. Possibilities of Using WebXR in Urban Planning
3.4. Observations from the Software Development Process
4. Discussion
5. Study Limitations
6. Conclusions
Author Contributions
Funding
Institutional Review Board Statement
Informed Consent Statement
Data Availability Statement
Acknowledgments
Conflicts of Interest
References
- Batty, M.; Dodge, M.; Jiang, B.; Hudson-Smith, A. GIS and Urban Design. Available online: https://discovery.ucl.ac.uk/id/eprint/224/ (accessed on 7 August 2021).
- Yeh, A.G. Urban planning and GIS. Geogr. Inf. Syst. 1999, 2, 1. [Google Scholar]
- Rathore, M.M.; Ahmad, A.; Paul, A.; Rho, S. Urban planning and building smart cities based on the internet of things using big data analytics. Comput. Netw. 2016, 101, 63–80. [Google Scholar] [CrossRef]
- Raetzsch, C.; Pereira, G.; Vestergaard, L.S.; Brynskov, M. Weaving seams with data: Conceptualizing city APIs as elements of infrastructures. Big Data Soc. 2019, 6, 2053951719827619. [Google Scholar] [CrossRef] [Green Version]
- Belal, A.; Shcherbina, E. Smart-technology in city planning of post-war cities. IOP Conf. Ser. Mater. Sci. Eng. 2018, 365, 022043. [Google Scholar] [CrossRef]
- Caragliu, A.; Del Bo, C. Smartness and European urban performance: Assessing the local impacts of smart urban attributes. Innov. Eur. J. Soc. Sci. Res. 2012, 25, 97–113. [Google Scholar] [CrossRef]
- Datta, A. ‘Cityzens become netizens’: Hashtag citizenships in the making of India’s 100 smart cities. In Creating Smart Cities; Coletta, C., Evans, L., Heaphy, L., Kitchin, R., Eds.; Routledge: London, UK, 2018; pp. 131–143. [Google Scholar]
- Wiig, A. The empty rhetoric of the smart city: From digital inclusion to economic promotion in Philadelphia. Urban Geogr. 2016, 37, 535–553. [Google Scholar] [CrossRef]
- Krivý, M. Towards a critique of cybernetic urbanism: The smart city and the society of control. Plan. Theory 2018, 17, 8–30. [Google Scholar] [CrossRef]
- Kitchin, R.; Dodge, M. The (In) security of smart cities: Vulnerabilities, risks, mitigation, and prevention. J. Urban Technol. 2019, 26, 47–65. [Google Scholar] [CrossRef] [Green Version]
- Hollands, R.G. Will the real smart city please stand up? Intelligent, progressive or entrepreneurial? City 2008, 12, 303–320. [Google Scholar] [CrossRef]
- Sadowski, J.; Bendor, R. Selling smartness: Corporate narratives and the smart city as a sociotechnical imaginary. Sci. Technol. Hum. Values 2019, 44, 540–563. [Google Scholar] [CrossRef] [Green Version]
- Caragliu, A.; Del Bo, C.; Nijkamp, P. Smart cities in Europe. J. Urban Technol. 2011, 18, 65–82. [Google Scholar] [CrossRef]
- Allam, Z.; Newman, P. Redefining the smart city: Culture, metabolism and governance. Smart Cities 2018, 1, 4–25. [Google Scholar] [CrossRef] [Green Version]
- Chen, M.; Lin, H. Virtual Geographic Environments (VGEs): Originating from or beyond Virtual Reality (VR)? Int. J. Digit. Earth 2018, 11, 329–333. [Google Scholar] [CrossRef] [Green Version]
- Evans, L. The Reemergence of Virtual Reality; Routledge: London, UK, 2018; ISBN 978-1-351-00930-0. [Google Scholar]
- Berkman, M.I.; Akan, E. Presence and immersion in virtual reality. In Encyclopedia of Computer Graphics and Games; Lee, N., Ed.; Springer International Publishing: Cham, Switzerland, 2019; pp. 1–10. ISBN 978-3-319-08234-9. [Google Scholar]
- Bodum, L. Future directions for hypermedia in urban planning. In Spatial Multimedia and Virtual Reality; Camara, A., Raper, J., Eds.; CRC Press: Boca Raton, FL, USA, 1999; pp. 21–34. [Google Scholar]
- Ball, J. Towards a methodology for mapping ‘regions for sustainability’ using PPGIS. Prog. Plan. 2002, 58, 81–140. [Google Scholar] [CrossRef]
- Kamel Boulos, M.N.; Lu, Z.; Guerrero, P.; Jennett, C.; Steed, A. From urban planning and emergency training to Pokémon Go: Applications of Virtual Reality GIS (VRGIS) and Augmented Reality GIS (ARGIS) in personal, public and environmental health. Int. J. Health Geogr. 2017, 16, 7. [Google Scholar] [CrossRef] [Green Version]
- Batty, M. Virtual reality in geographic information systems. In The Handbook of Geographic Information Science; Wilson, J.P., Fortheringham, A.S., Eds.; Blackwell: Oxford, UK, 2008; pp. 317–334. [Google Scholar]
- Unwin, D.J.; Fisher, P. Virtual Reality in Geography; Taylor & Francis: London, UK; New York, NY, USA, 2002; ISBN 978-0-203-30585-0. [Google Scholar]
- Lü, G.; Batty, M.; Strobl, J.; Lin, H.; Zhu, A.-X.; Chen, M. Reflections and Speculations on the progress in Geographic Information Systems (GIS): A geographic perspective. Int. J. Geogr. Inf. Sci. 2019, 33, 346–367. [Google Scholar] [CrossRef]
- Craglia, M.; Goodchild, M.F.; Annoni, A.; Camara, G.; Gould, M.; Kuhn, W.; Mark, D.; Masser, I.; Maguire, D.; Liang, S.; et al. Next-generation digital earth: A position paper from the vespucci initiative for the advancement of geographic information science. Int. J. Spat. Data Infrastruct. Res. 2008, 3, 146–167. [Google Scholar]
- Batty, M. Digital twins. Environ. Plan. B Urban Anal. City Sci. 2018, 45, 817–820. [Google Scholar] [CrossRef]
- Pangilinan, E.; Lukas, S.; Mohan, V. Creating Augmented and Virtual Realities: Theory and Practice for Next-Generation Spatial Computing; O’Reilly Media, Inc.: Newton, MA, USA, 2019; ISBN 978-1-4920-4414-7. [Google Scholar]
- Çöltekin, A.; Lochhead, I.; Madden, M.; Christophe, S.; Devaux, A.; Pettit, C.; Lock, O.; Shukla, S.; Herman, L.; Stachoň, Z.; et al. Extended reality in spatial sciences: A review of research challenges and future directions. ISPRS Int. J. Geo-Inf. 2020, 9, 439. [Google Scholar] [CrossRef]
- Maclntyre, B.; Smith, T.F. Thoughts on the future of WebXR and the immersive web. In Proceedings of the 2018 IEEE International Symposium on Mixed and Augmented Reality Adjunct (ISMAR-Adjunct), Munich, Germany, 16–20 October 2018; pp. 338–342. [Google Scholar]
- Chalmers, D.J. The virtual and the real. Disputatio 2017, 9, 309–352. [Google Scholar] [CrossRef] [Green Version]
- Unity Real-Time Development Platform|3D, 2D VR & AR Engine. Available online: https://unity.com/ (accessed on 8 September 2021).
- Paradiso, J.A.; Landay, J.A. Guest editors’ introduction: Cross-reality environments. IEEE Pervasive Comput. 2009, 8, 14–15. [Google Scholar] [CrossRef]
- Milgram, P.; Kishino, F. A taxonomy of mixed reality visual displays. IEICE Trans. Inf. Syst. 1994, 77, 1321–1329. [Google Scholar]
- Microsoft HoloLens|Mixed Reality Technology for Business. Available online: https://www.microsoft.com/en-us/hololens (accessed on 8 September 2021).
- Augmented Reality Platform for Enterprise|Magic Leap. Available online: https://www.magicleap.com/en-us (accessed on 8 September 2021).
- Speicher, M.; Hall, B.D.; Nebeling, M. What is mixed reality? CHI 2019. [Google Scholar] [CrossRef]
- Van Krevelen, D.W.F.; Poelman, R. A survey of augmented reality technologies, applications and limitations. Int. J. Virtual Real. 2010, 9, 1–20. [Google Scholar] [CrossRef] [Green Version]
- Holz, T.; Campbell, A.G.; O’Hare, G.M.; Stafford, J.W.; Martin, A.; Dragone, M. Mira—Mixed reality agents. Int. J. Hum.-Comput. Stud. 2011, 69, 251–268. [Google Scholar] [CrossRef] [Green Version]
- Maas, M.J.; Hughes, J.M. Virtual, Augmented and mixed reality in K–12 education: A review of the literature. Technol. Pedagog. Educ. 2020, 29, 231–249. [Google Scholar] [CrossRef]
- Steuer, J. Defining virtual reality: Dimensions determining telepresence. J. Commun. 1992, 42, 73–93. [Google Scholar] [CrossRef]
- Loureiro, S.M.C.; Guerreiro, J.; Ali, F. 20 Years of research on virtual reality and augmented reality in tourism context: A text-mining approach. Tour. Manag. 2020, 77, 104028. [Google Scholar] [CrossRef]
- Lanier, J. Dawn of the New Everything: A Journey through Virtual Reality; Random House: New York, NY, USA, 2017. [Google Scholar]
- Heim, M. Virtual Realism; Oxford University Press: New York, NY, USA, 2000. [Google Scholar]
- MacEachren, A.M.; Edsall, R.; Haug, D.; Baxter, R.; Otto, G.; Masters, R.; Fuhrmann, S.; Qian, L. Virtual environments for geographic visualization: Potential and challenges. In Proceedings of the 1999 Workshop on New Paradigms in Information Visualization and Manipulation in Conjunction with the Eighth ACM Internation Conference on Information and Knowledge Management, Kansas, MO, USA, 2–6 November 1999; pp. 35–40. [Google Scholar]
- Sherman, W.R.; Craig, A.B. Understanding Virtual Reality; Elsevier: Amsterdam, The Netherlands, 2003; ISBN 978-1-55860-353-0. [Google Scholar]
- Saposnik, G.; Cohen, L.G.; Mamdani, M.; Pooyania, S.; Ploughman, M.; Cheung, D.; Shaw, J.; Hall, J.; Nord, P.; Dukelow, S.; et al. Efficacy and safety of non-immersive virtual reality exercising in stroke rehabilitation (EVREST): A randomised, multicentre, single-blind, controlled trial. Lancet Neurol. 2016, 15, 1019–1027. [Google Scholar] [CrossRef] [Green Version]
- Lin, H.; Gong, J. Exploring virtual geographic environments. Geogr. Inf. Sci. 2001, 7, 1–7. [Google Scholar] [CrossRef]
- Immersive Web Community Group. Available online: https://www.w3.org/community/immersive-web/ (accessed on 8 September 2021).
- Huang, B.; Lin, H. GeoVR: A web-based tool for virtual reality presentation from 2D GIS Data. Comput. Geosci. 1999, 25, 1167–1175. [Google Scholar] [CrossRef]
- Huang, B.; Jiang, B.; Li, H. An Integration of GIS, virtual reality and the internet for visualization, analysis and exploration of spatial data. Int. J. Geogr. Inf. Sci. 2001, 15, 439–456. [Google Scholar] [CrossRef]
- Doyle, S.; Dodge, M.; Smith, A. The potential of web-based mapping and virtual reality technologies for modelling urban environments. Comput. Environ. Urban Syst. 1998, 22, 137–155. [Google Scholar] [CrossRef]
- Haklay, M.E. Virtual reality and GIS: Applications, trends and directions. In Virtual Reality in Geography; CRC Press: Boca Raton, FL, USA, 2002; ISBN 978-0-429-21999-3. [Google Scholar]
- Lin, H.; Chen, M.; Lu, G.; Zhu, Q.; Gong, J.; You, X.; Wen, Y.; Xu, B.; Hu, M. Virtual geographic environments (VGEs): A new generation of geographic analysis tool. Earth-Sci. Rev. 2013, 126, 74–84. [Google Scholar] [CrossRef] [Green Version]
- Guo, Y.; Du, Q.; Luo, Y.; Zhang, W.; Xu, L. Application of augmented reality gis in architecture. Int. Arch. Photogramm. Remote. Sens. Spat. Inf. Sci. 2008, 37, 331–336. [Google Scholar]
- De Freitas, M.R.; Ruschel, R.C. What Is Happening to Virtual and Augmented Reality Applied to Architecture? In Proceedings of the Open Systems: Proceedings of the 18th International Conference on Computer-Aided Architectural Design Research in Asia (CAADRIA 2013); Stouffs, R., Janssen, P., Roudavski, F., Tunçer, B., Eds.; The Association for Computer-Aided Architectural Design Research in Asia (CAADRIA): Hong Kong, China; Center for Advanced Studies in Architecture (CASA), Department of Architecture-NUS: Singapore, 2013; pp. 407–416. [Google Scholar]
- Koutsabasis, P.; Vosinakis, S.; Malisova, K.; Paparounas, N. On the value of virtual worlds for collaborative design. Des. Stud. 2012, 33, 357–390. [Google Scholar] [CrossRef] [Green Version]
- Portman, M.E.; Natapov, A.; Fisher-Gewirtzman, D. To go where no man has gone before: Virtual reality in architecture, landscape architecture and environmental planning. Comput. Environ. Urban Syst. 2015, 54, 376–384. [Google Scholar] [CrossRef]
- Jiang, L.; Maffei, L.; Masullo, M. Developing an online virtual reality application for e-participation in urban sound planning. In Proceedings of the EuroRegio, Leeds, UK, 13 June 2016. [Google Scholar]
- Meenar, M.; Kitson, J. Using multi-sensory and multi-dimensional immersive virtual reality in participatory planning. Urban Sci. 2020, 4, 34. [Google Scholar] [CrossRef]
- McGarrigle, C. Augmented interventions: Re-defining urban interventions with AR and Open Data. In Augmented Reality Art: From an Emerging Technology to a Novel Creative Medium; Geroimenko, V., Ed.; Springer Series on Cultural Computing; Springer International Publishing: Cham, Switzerland, 2014; pp. 81–95. ISBN 978-3-319-06203-7. [Google Scholar]
- Cirulis, A.; Brigmanis, K.B. 3D Outdoor augmented reality for architecture and urban planning. Procedia Comput. Sci. 2013, 25, 71–79. [Google Scholar] [CrossRef] [Green Version]
- Zhang, X.; Han, Y.; Hao, D.; Lv, Z. ARGIS-based outdoor underground pipeline information system. J. Vis. Commun. Image Represent. 2016, 40, 779–790. [Google Scholar] [CrossRef]
- Xu, C.; Wong, D.W.; Yang, C. Evaluating the “Geographical Awareness” of individuals: An exploratory analysis of twitter data. Cartogr. Geogr. Inf. Sci. 2013, 40, 103–115. [Google Scholar] [CrossRef]
- Ma, Y.; Wright, J.; Gopal, S.; Phillips, N. Seeing the invisible: From imagined to virtual urban landscapes. Cities 2020, 98, 102559. [Google Scholar] [CrossRef]
- Kitchin, R.; Young, G.W.; Dawkins, O. Planning and 3D spatial media: Progress, prospects, and the knowledge and experiences of local government planners in Ireland. Plan. Theory Pract. 2021, 1–19. [Google Scholar] [CrossRef]
- Ball, J.; Capanni, N.; Watt, S. Virtual reality for mutual understanding in landscape planning. Int. J. Inf. Commun. Eng. 2007, 1, 661–671. [Google Scholar]
- Schrom-Feiertag, H.; Stubenschrott, M.; Regal, G.; Matyus, T.; Seer, S. An interactive and responsive virtual reality environment for participatory urban planning. In Proceedings of the Symposium on Simulation for Architecture and Urban Design SimAUD, Online, 25 May 2020; pp. 119–125. [Google Scholar]
- Howard, T.L.J.; Gaborit, N. Using virtual environment technology to improve public participation in urban planning process. J. Urban Plan. Dev. 2007, 133, 233–241. [Google Scholar] [CrossRef]
- Van Leeuwen, J.P.; Hermans, K.; Jylhä, A.; Quanjer, A.J.; Nijman, H. Effectiveness of virtual reality in participatory urban planning: A case study. In Proceedings of the 4th Media Architecture Biennale Conference, Association for Computing Machinery, New York, NY, USA, 13 November 2018; pp. 128–136. [Google Scholar]
- Cunningham, S.J.; Jones, M. Autoethnography: A tool for practice and education. In Proceedings of the 6th ACM SIGCHI New Zealand Chapter’s International Conference on Computer-Human Interaction: Making CHI Natural, New York, NY, USA, 7 July 2005; pp. 1–8. [Google Scholar]
- Three.Js–JavaScript 3D Library. Available online: https://threejs.org/ (accessed on 8 September 2021).
- WebXR Device API-Web APIs|MDN. Available online: https://developer.mozilla.org/en-US/docs/Web/API/WebXR_Device_API (accessed on 8 September 2021).
- GitHub-NikLever/CanvasUI: A Three.JS WebXR UI. Enabling Easy UI Creation for Immersive-vr Sessions. Available online: https://github.com/NikLever/CanvasUI (accessed on 8 September 2021).
- Portal SIP Poznań. Available online: https://sip.poznan.pl/sip/ (accessed on 8 September 2021).
- GitHub-Domlysz/BlenderGIS: Blender Addons to Make the Bridge between Blender and Geographic Data. Available online: https://github.com/domlysz/BlenderGIS (accessed on 8 September 2021).
- Orylski, M. Prototype Application that Tests the Possibilities of WebXr Technology in Spatial Planning; 2021. Available online: https://moonshroom.github.io/Spatial_WebXR/ (accessed on 25 October 2021).
- Falco, E. Digital community planning: The open source way to the top of arnstein’s ladder. Int. J. E-Plan. Res. 2016, 5, 1–22. [Google Scholar] [CrossRef]
- Haklay, M.; Tobón, C. Usability evaluation and PPGIS: Towards a user-centred design approach. Int. J. Geogr. Inf. Sci. 2003, 17, 577–592. [Google Scholar] [CrossRef]
- Finstad, K. The system usability scale and non-native english speakers. J. Usability Stud. 2006, 1, 185–188. [Google Scholar]
- Brooke, J. SUS-A quick and dirty usability scale. Usability Eval. Ind. 1996, 189, 4–7. [Google Scholar]
- Rzeszewski, M.; Kotus, J. Usability and usefulness of internet mapping platforms in participatory spatial Planning. Appl. Geogr. 2019, 103, 56–69. [Google Scholar] [CrossRef]
- Akagi, M. Qgis2threejs Plugin. 2021. Available online: https://plugins.qgis.org/plugins/Qgis2threejs/ (accessed on 25 October 2021).
- Nielsen, J. Guerrilla HCI: Using discount usability engineering to penetrate the intimidation barrier. In Cost-Justifying Usability; Bias, R.G., Mayhew, D.J., Eds.; Academic Press, Inc.: Orlando, FL, USA, 1994; pp. 245–272. ISBN 978-0-12-095810-8. [Google Scholar]
- Zhao, J.; Coleman, D.J. An empirical assessment of a web-based ppgis prototype. In Proceedings of the 45th Annual Conference of the Urban and Regional Information Systems Association, Citeseer, Park Ridge, IL, USA, 3 April 2007. [Google Scholar]


| Name | Description | Screenshot Example |
|---|---|---|
| AR1—Display | Displaying a detailed 3D model on a flat surface |  |
| AR2—Measuring | Measuring distance on any flat surface and recalculation in a given scale |  |
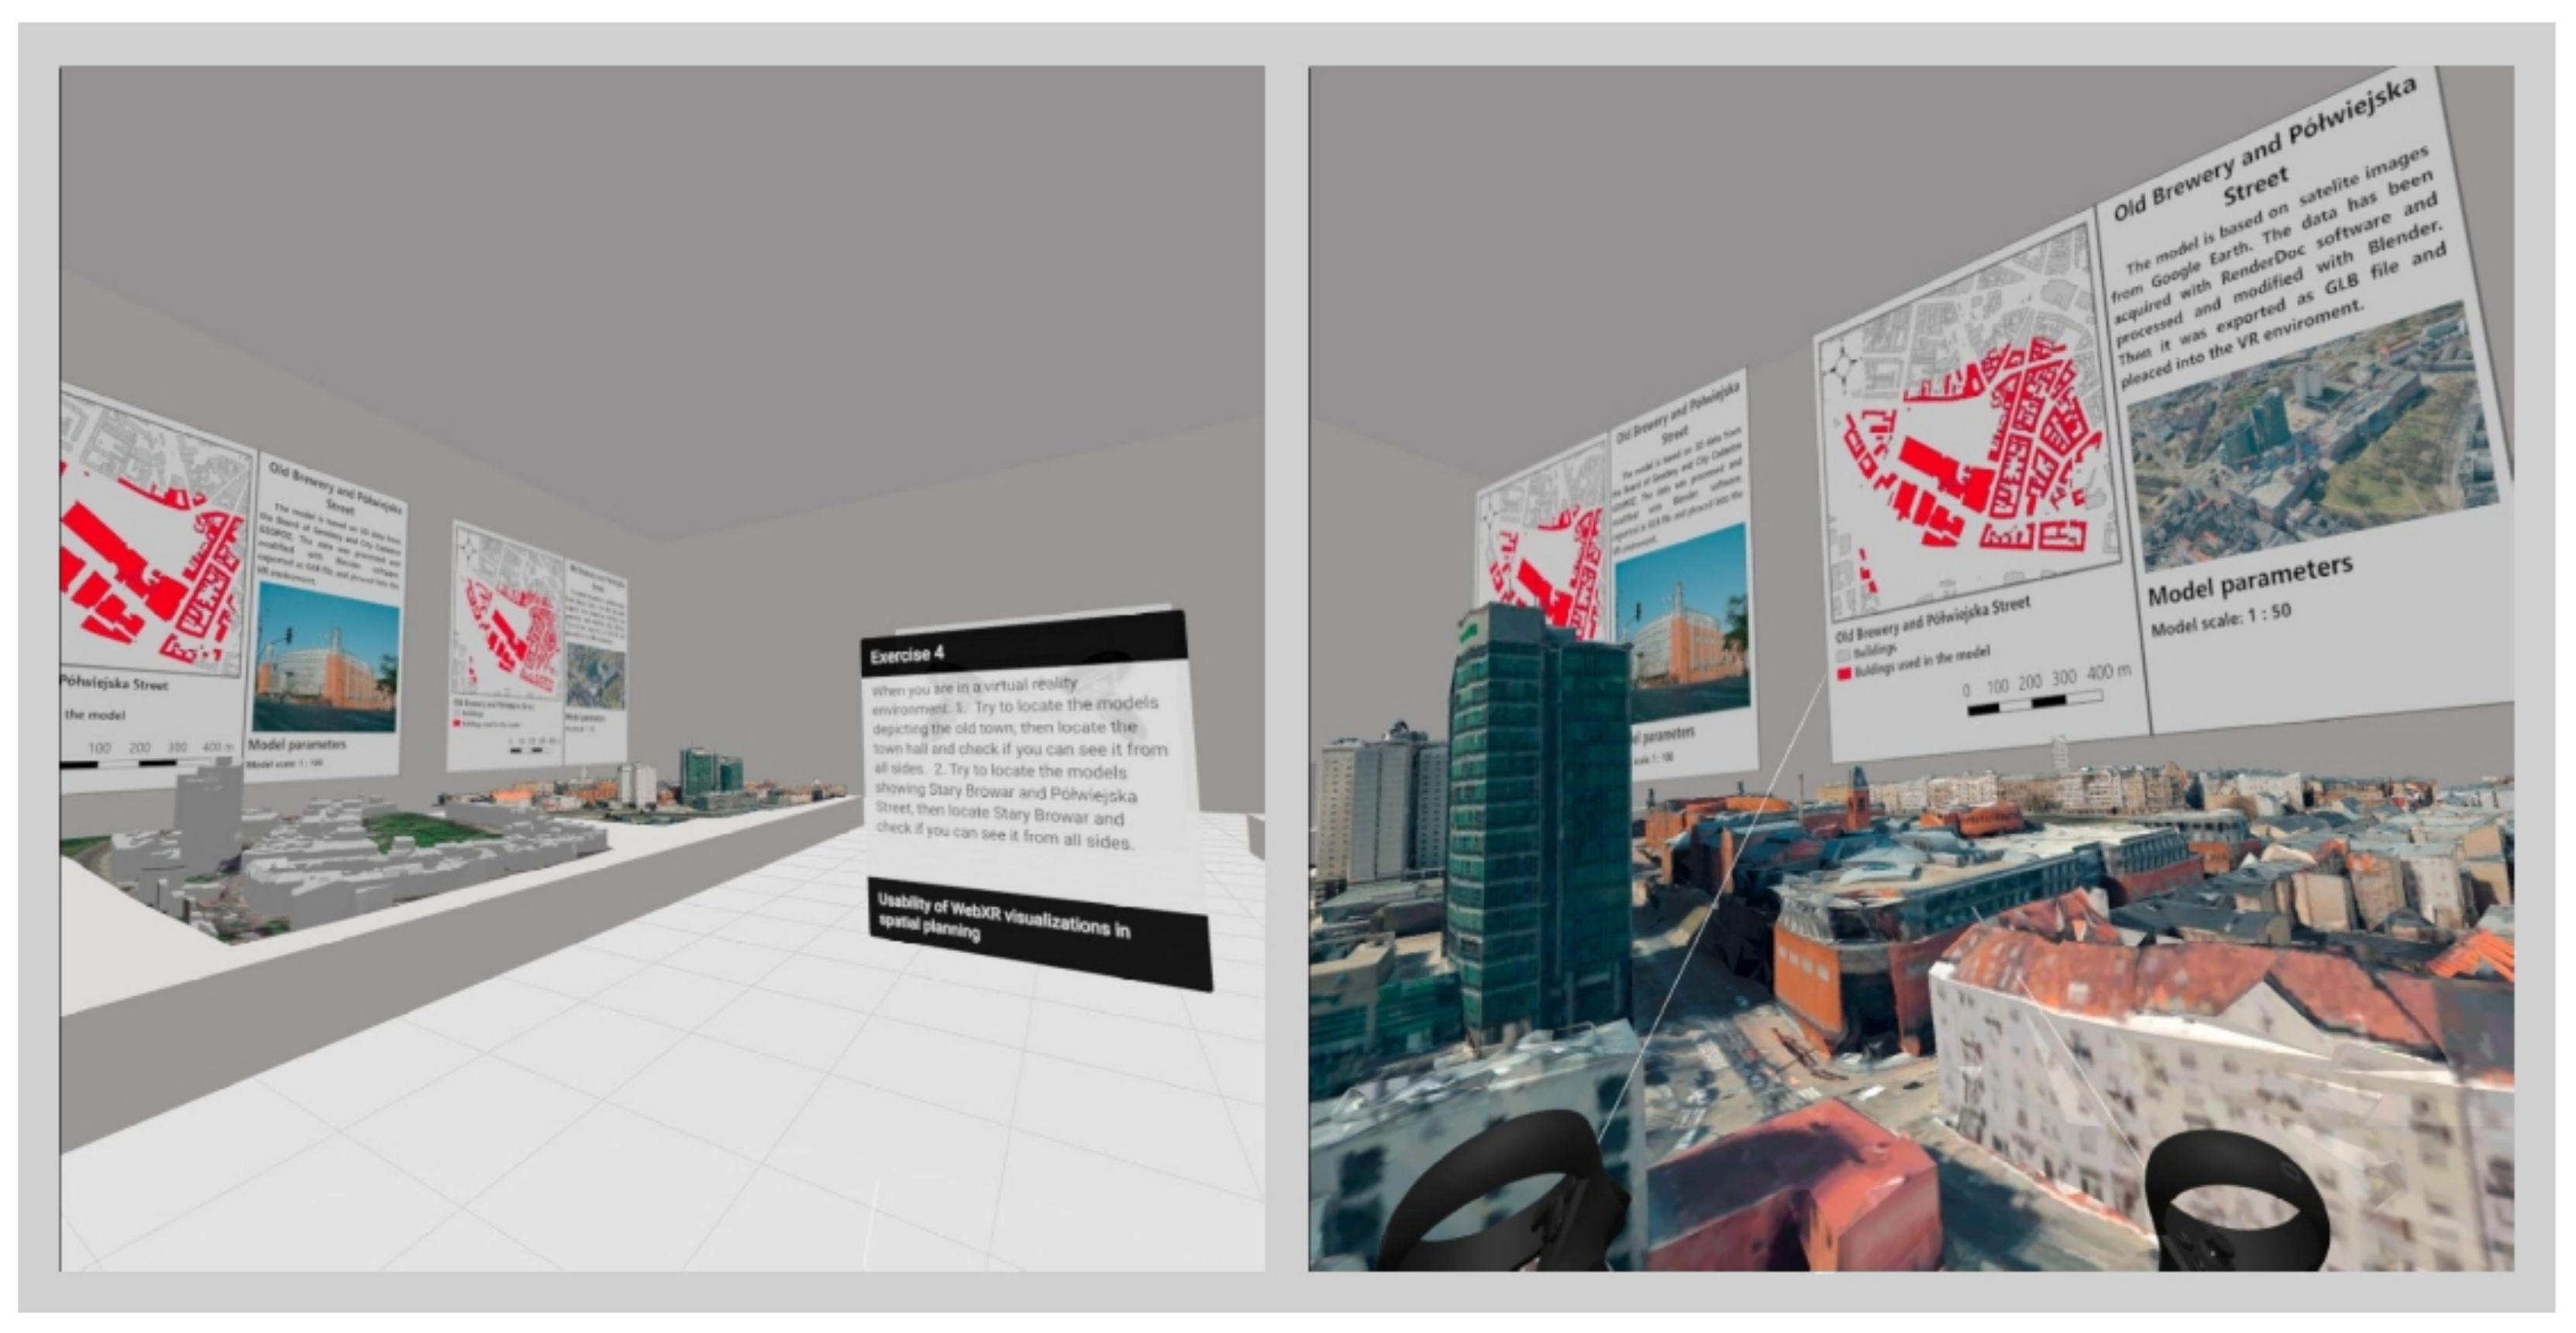
| VR1—Display | Virtual gallery of four different 3D scale models. Users can navigate freely through the environment | 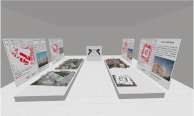 |
| VR2—Zoning map | Virtual 3D display of a small area in Poznan with buildings and the zoning map with a legend | 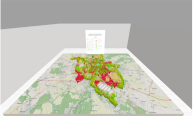 |
| VR3—Area renovation proposition | 3D visualization of proposed changes in one of Poznan parks. Users can walk and run through the model. | 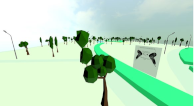 |
| VR4—Virtual walk | Poznan Old City 3D model rendered with textures. Users can walk and run through the model. | 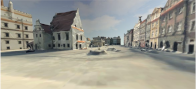 |
| Participant | Gender | Age | Profession |
|---|---|---|---|
| P1 | Male | 18–25 | researcher/academic teacher |
| P2 | Female | 31–50 | architect/urban planner |
| P3 | Male | 31–50 | architect/urban planner |
| P4 | Male | 18–25 | researcher/academic teacher |
| P5 | Female | 18–25 | urban planning student |
| P6 | Female | 18–25 | urban planning student |
| P7 | Male | 31–50 | architect/urban planner |
| P8 | Male | 26–30 | researcher/academic teacher |
| P9 | Male | 18–25 | GIS specialist |
| P10 | Male | 18–25 | GIS specialist |
| P11 | Male | 18–25 | GIS specialist |
| P12 | Female | 26–30 | researcher/academic teacher |
| P13 | Female | 26–30 | GIS specialist |
| P14 | Female | 31–50 | architect/urban planner |
| P15 | Male | 31–50 | architect/urban planner |
| Environment | Task Description |
|---|---|
| AR1—Display | Try to place the model on a surface. After loading the model, try to locate the main entrance to the WNGIG building. |
| AR2—Measuring | Measure the distance between the points indicated on the map (from 1 to 2; from 2 to 3; from 1 to 4). Try to verify its correctness. |
| VR1—Display | When you are in a virtual reality environment: 1. Try to locate the models depicting the old town, then locate the town hall and check if you can see it from all sides. 2. Try to locate the models showing Stary Browar and Półwiejska Street, then locate Stary Browar and check if you can see it from all sides. |
| VR2—Zoning map | When you find yourself in a virtual reality environment, approach the legend and check how the areas called fortifications are marked on the map, then try to locate the largest of them on the map. |
| VR3—Area renovation proposition | When you are in a virtual reality environment, try to locate the areas marked in yellow and blue, and then reach them by moving along the park’s paths. |
| VR4—Virtual walk | Once you are in a virtual reality environment, try walking and seeing the buildings located in the central part of the Poznan market square. |
| General Rating (Perceived Usefulness in Urban Planning) | |||||||
|---|---|---|---|---|---|---|---|
| Participant | SUS Score | AR1 | AR2 | VR1 | VR2 | VR3 | VR4 |
| P1 | 85 | 5 (5) | 5 (5) | 5 (5) | 5 (5) | 5 (5) | 5 (5) |
| P2 | 90 | 4 (5) | 4 (5) | 5 (5) | 4 (5) | 5 (4) | 5 (5) |
| P3 | 85 | 4 (5) | 4 (4) | 5 (5) | 4 (5) | 5 (5) | 5 (5) |
| P4 | 73 | 5 (5) | 3 (5) | 5 (5) | 3 (4) | 5 (4) | 5 (3) |
| P5 | 83 | 5 (5) | 5 (5) | 5 (5) | 5 (5) | 5 (5) | 5 (5) |
| P6 | 67 | 3 (4) | 4 (4) | 4 (5) | 4 (5) | 4 (4) | 4 (5) |
| P7 | 70 | 4 (4) | 5 (4) | 5 (4) | 2 (2) | 5 (5) | 4 (4) |
| P8 | 80 | 4 (4) | 3 (2) | 5 (4) | 4 (4) | 4 (5) | 4 (4) |
| P9 | 65 | 5 (5) | 4 (3) | 5 (5) | 4 (4) | 4 (5) | 5 (4) |
| P10 | 70 | 3 (2) | 2 (1) | 4 (3) | 2 (1) | 2 (4) | 4 (3) |
| P11 | 90 | 3 (4) | 2 (2) | 5 (4) | 2 (2) | 4 (5) | 4 (5) |
| P12 | 70 | 4 (4) | 5 (4) | 5 (5) | 3 (5) | 5 (5) | 4 (4) |
| P13 | 67 | 3 (5) | 3 (3) | 5 (5) | 3 (5) | 5 (5) | 4 (4) |
| P14 | 73 | 5 (5) | 4 (5) | 5 (5) | 4 (5) | 3 (5) | 5 (5) |
| P15 | 83 | 3 (4) | 3 (3) | 4 (5) | 5 (5) | 4 (5) | 5 (3) |
| AR1 | AR2 | VR1 | VR2 | VR3 | VR4 | |
|---|---|---|---|---|---|---|
| Mean general rating (SD) | 4.00 (0.85) | 3.73 (1.03) | 4.80 (0.41) | 3.60 (1.05) | 4.33 (0.90) | 4.53 (0.51) |
| Mean perceived usefulness in urban planning (SD) | 4.40 (0.82) | 3.67 (1.29) | 4.67 (0.62) | 4.13 (1.36) | 4.73 (0.46) | 4.27 (0.80) |
| Pros | Cons |
|---|---|
| Access to developing tools and software within GIS and web development ecosystems | Weak graphical optimization |
| Easy debugging using tools like Chrome Dev Tools | Current lack of examples and ready to use scripts |
| Ability to share virtual environments with wide range of devices and users | Necessity of extensive manual optimization and simplification of 3D models. |
| Extensive catalog of software libraries that can be used in the development process | Physical limitations of the development process—e.g., motion sickness |
| Lack of the necessity to rely on gaming engines like Unity 3D and Unreal Engine | Anchoring problems with AR solutions |
Publisher’s Note: MDPI stays neutral with regard to jurisdictional claims in published maps and institutional affiliations. |
© 2021 by the authors. Licensee MDPI, Basel, Switzerland. This article is an open access article distributed under the terms and conditions of the Creative Commons Attribution (CC BY) license (https://creativecommons.org/licenses/by/4.0/).
Share and Cite
Rzeszewski, M.; Orylski, M. Usability of WebXR Visualizations in Urban Planning. ISPRS Int. J. Geo-Inf. 2021, 10, 721. https://doi.org/10.3390/ijgi10110721
Rzeszewski M, Orylski M. Usability of WebXR Visualizations in Urban Planning. ISPRS International Journal of Geo-Information. 2021; 10(11):721. https://doi.org/10.3390/ijgi10110721
Chicago/Turabian StyleRzeszewski, Michał, and Matuesz Orylski. 2021. "Usability of WebXR Visualizations in Urban Planning" ISPRS International Journal of Geo-Information 10, no. 11: 721. https://doi.org/10.3390/ijgi10110721
APA StyleRzeszewski, M., & Orylski, M. (2021). Usability of WebXR Visualizations in Urban Planning. ISPRS International Journal of Geo-Information, 10(11), 721. https://doi.org/10.3390/ijgi10110721