
Crime Prevention Based on the Strategic Mapping of Living Conditions


Abstract
:1. Introduction
2. Materials and Methods
2.1. Material
- Education—pre-upper-secondary education (% of pop.);
- Employment rate—employed persons aged 20–64 (% of pop.);
- Income—net median income 20+ years (SEK);
- Foreign background—population of foreign background (% of pop.);
- Marital status—single parents with children still living at home (% of pop.);
- Population per square kilometer (pop/km2).
- An exposed area is a geographically defined space, characterized by low socio-economic status, in which criminal actors have an impact on the local community. This impact can be exerted via direct pressure on people, organizations, and businesses—for example, via threats and extortion—or indirectly, via acts of public violence that risk harming third-party citizens, open drug trafficking, and dissatisfaction with societal institutions. In consequence, residents in the exposed areas may experience insecurity and fear, which leads to a reduced tendency to report crime and to participate in the legal process. The situation is considered serious.
- In a particularly exposed area, the situation is even more serious. From a police perspective, such areas are characterized by a general reluctance among the population to participate in legal proceedings. There are also systematic threats and acts of violence against witnesses, injured parties, and those who oppose criminals. The situation in these areas makes it almost impossible for the police to carry out their mission. This serious situation also tends to become normalized. Residents and other actors no longer reflect on the fact that their area is different from other areas. Particularly exposed areas are further characterized by pronounced features of parallel social structures and extremism, e.g., systematic violations of religious freedoms, or powerful fundamentalist influences that restrict human rights and freedoms. These areas may also have residents who travel abroad to participate in armed conflicts and a high concentration of criminals. In addition, the presence of several adjacent particularly exposed areas poses a greater risk of more geographically widespread criminal activities and networks.
- Risk areas constitute an intermediate level between exposed and particularly exposed areas. The situation is serious, and there is a risk that the area will become a particularly exposed area if no efforts are made to curb this development. Negative developments in a risk area can be prevented if adequate measures are implemented [30].
2.2. Methods
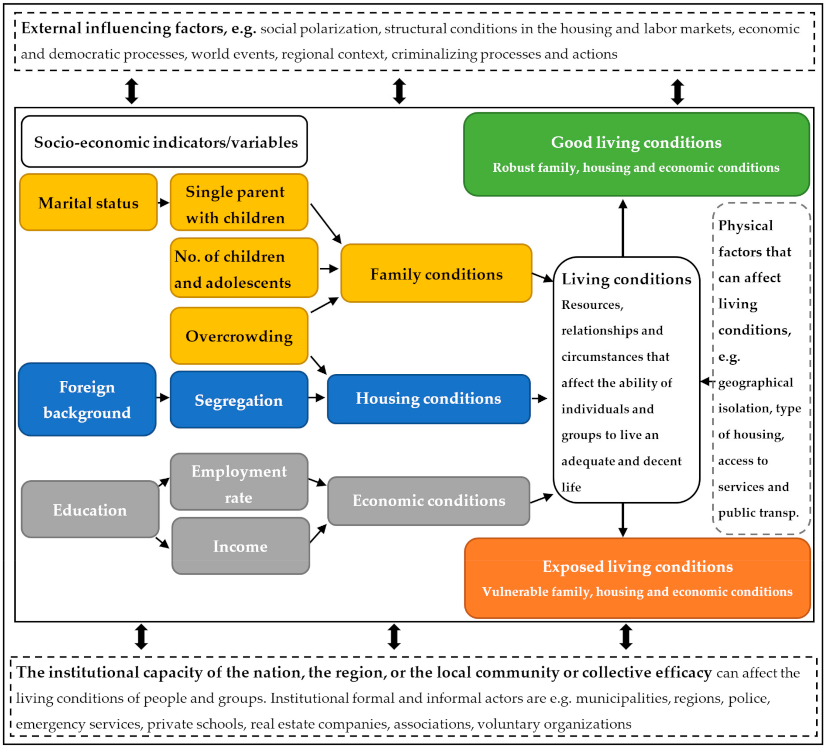
- Each of the variables presented above (education, employment rate, income, foreign background, single parents with children still living at home, and population per square kilometer) were divided into five numeric classes, with the values in the lowest class being assigned a numerical value of 1, and with those in the highest class being given a value of 5. An example is the division of the median income variable into five classes. This division is based on Statistics Sweden’s official classification of income intervals (gross income before tax) of the population aged 20 and over: Quartile 1: 0–163,617 SEK; Quartile 2: 163,618–280,169 SEK; Quartile 3: 280,170–400,577 SEK; and Quartile 4: SEK 400,578 SEK or more [37]. In addition to the four quartile classes, a fifth class has been added for those with an income of more than SEK 500,000 (see Table 1). The lowest income class is assigned a value of 1, the second-lowest a value of 2, and so on. All variables, intermediate descriptions, and classification methods, along with the number of mapped 250 × 250 m grids for each variable and also the motivation of classes and data sources, are presented in Table 1.
- The variables were then combined into three intermediate indices—family, housing, and economic conditions—by adding the classified values for all variables included in a given index and then dividing by the number of variables. For example, the intermediate index for economic conditions is calculated as follows: the values for the variables education, employment rate, and income were summed, and then divided by 3. The maximum value per mapped 250 × 250 m grid—corresponding to good economic conditions in our model—is therefore 5 ((5 + 5 + 5)/3). The lowest possible value per grid—vulnerable (or poor) economic conditions—is 1 ((1 + 1 + 1)/3). The intermediate indices for housing (segregation) conditions (variable: foreign background) and family conditions (variables: overcrowding—population per km2; single parents with children still living at home) were calculated in the same way.
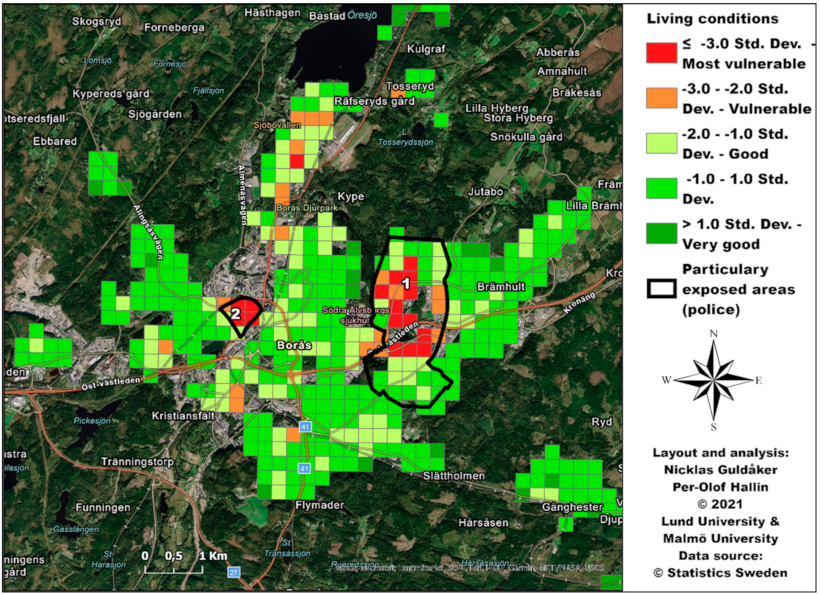
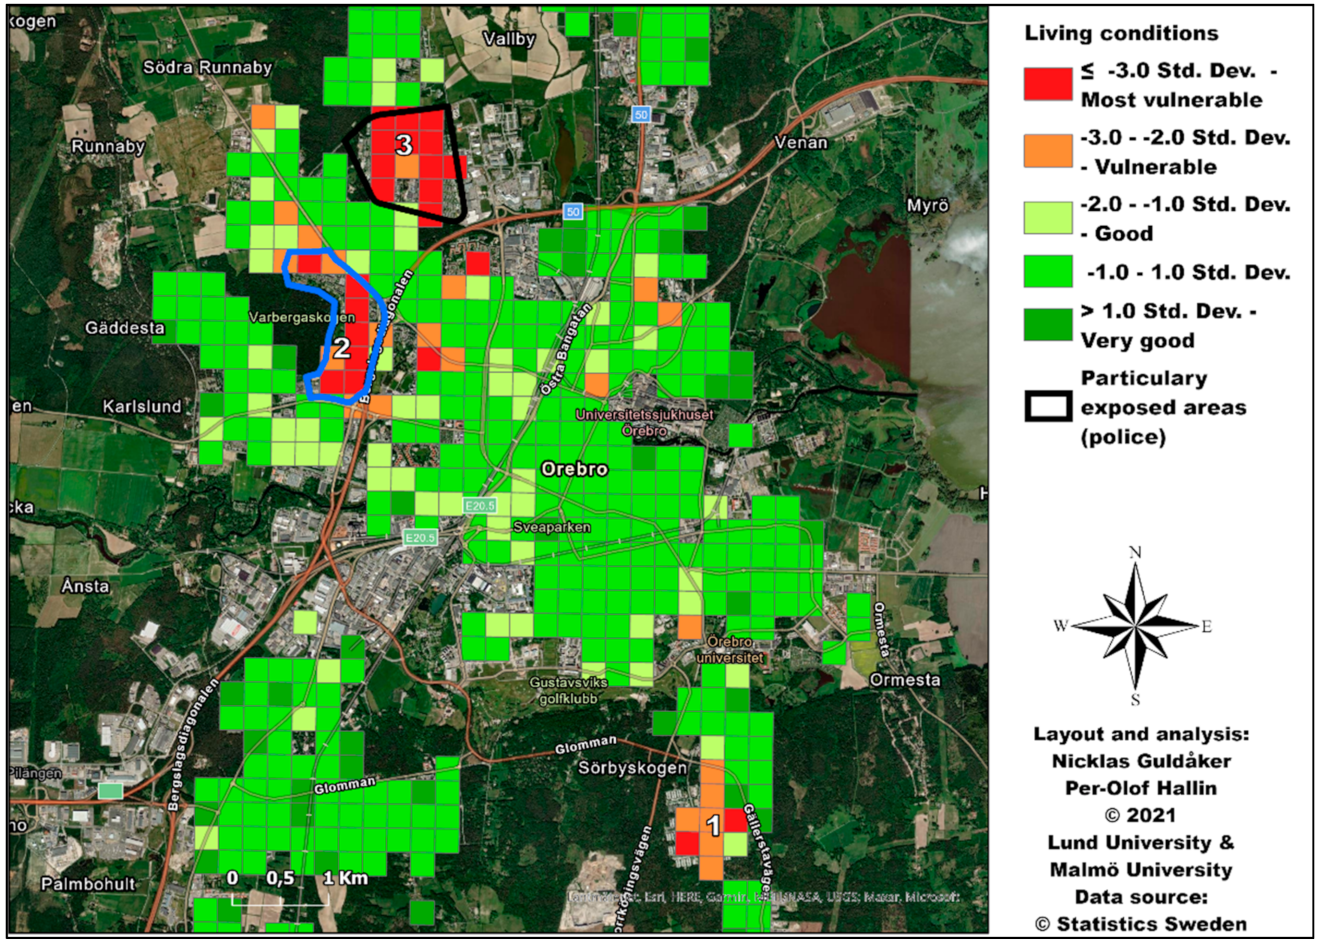
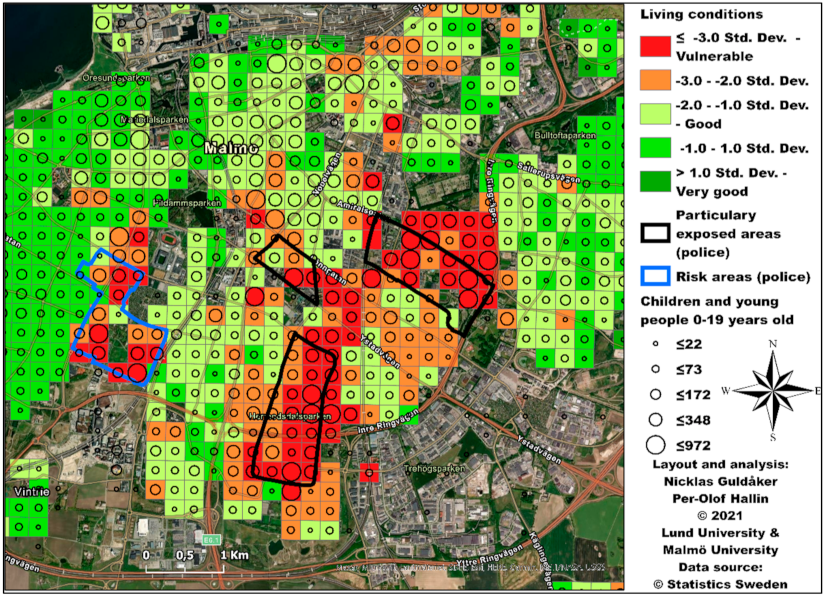
- The final living conditions index was also calculated in the same way: the values of all three intermediate indices were given the same weight and then added and divided by 3. The index values for different levels of living conditions were then classified in a range between 1 and 5. Since the index values are normally distributed, the classification and mapping have been based on standard deviations from the mean value (Figure 3).
- The mapped living conditions index was then overlaid onto the two police-defined datasets.
3. Theory
4. Results
5. Discussion and Conclusions
Author Contributions
Funding
Institutional Review Board Statement
Informed Consent Statement
Data Availability Statement
Acknowledgments
Conflicts of Interest
References
- Wilkinson, R.G.; Pickett, K. The Spirit Level: Why Greater Equality Makes Societies Stronger, 1st ed.; Bloomsbury Publishing PLC: New York, NY, USA, 2011. [Google Scholar]
- SOU. It’s about Equal Health. Starting Points for the Commission’s Further Work: Commission Interim Report on Equal Health (In Swedish with the Title: Det Handlar om Jämlik Hälsa. Utgångspunkter för Kommissionens Vidare Arbete: Delbetänkande Från Kommissionen för Jämlik Hälsa); Ministry of Social Affairs: Stockholm, Sweden, 2016; p. 55. [Google Scholar]
- Skolverket. What Affects the Results in Swedish Primary and Lower Secondary School? Knowledge Overview of the Importance of Various Factors (In Swedish with the Title: Vad Påverkar Resultaten i Svensk Grundskola? Kunskapsöversikt om Betydelsen av Olika Faktorer); The Swedish National Agency for Education: Stockholm, Sweden, 2009. [Google Scholar]
- Skolverket. PISA 2015 15-Year-Olds’ Knowledge of Science, Reading Comprehension and Mathematics. (In Swedish with the Title: PISA 2015 15-Åringars Kunskaper i Naturvetenskap, Läsförståelse och Matematik); Report 450; The Swedish National Agency for Education: Stockholm, Sweden, 2016. [Google Scholar]
- Nilsson, A.; Estrada, F.; Bäckman, O. The unequal crime drop: Changes over time in the distribution of crime among individuals from different socioeconomic backgrounds. Eur. J. Criminol. 2017, 14, 586–605. [Google Scholar] [CrossRef]
- Guldåker, N.; Hallin, P.-O. Spatio-temporal patterns of intentional fires, social stress and socio-economic determinants: A case study of Malmö, Sweden. Fire Saf. J. 2014, 70, 71–80. [Google Scholar] [CrossRef] [Green Version]
- Guldåker, N.; Hallin, P.-O. Livsvillkor och strategisk lägesbild. In Att vända Utvecklingen—Från Utsatta Områden till Trygghet och Delaktighet; Gerell, M., Hallin, P.-O., Nilvall, K., Westerdahl, S., Eds.; Malmö University publications in urban studies (MAPIUS) 26; Malmö University: Malmö, Sweden, 2020; Volume 26, pp. 181–188. [Google Scholar]
- Hallin, P.-O.; Westerdahl, S. Utsatta livsvillkor. In Att vända Utvecklingen: Från Utsatta Områden till Trygghet och Delaktighet; Gerell, M., Hallin, P.-O., Nilvall, K., Westerdahl, S., Eds.; Malmö University publications in urban studies (MAPIUS) 26; Malmö University: Malmö, Sweden, 2020; pp. 24–40. [Google Scholar]
- Nilsson, J.; Hallin, P.-O.; Tykesson Klubien, M.; Guldåker, N. Skillnader i Brandförekomst Inom och Mellan olika Storstadsområden—En Statistisk Analys; Department of Human Geography: Lund, Sweden; Urban Studies, Malmö University: Malmö, Sweden, 2018. [Google Scholar]
- Allik, M.; Leyland, A.; Travassos Ichihara, M.Y.; Dundas, R. Creating small-area deprivation indices: A guide for stages and options. J. Epidemiol. Community Health 2020, 74, 20–25. [Google Scholar] [CrossRef] [Green Version]
- Agnew, R. Foundation for a General Strain Theory of Crime and Delinquency. Criminology 1992, 30, 47–87. [Google Scholar] [CrossRef]
- Agnew, R. Pressured into Crime. An Overview of General Strain Theory; Oxford University Press: New York, NY, USA, 2010. [Google Scholar]
- Merton, R.K. Social Structure and Anomie. Am. Sociol. Rev. 1938, 3, 672–682. [Google Scholar] [CrossRef]
- Merton, R.K. Social Theory and Social Structure; Enlarged Edition ed.; The Free Press: New York, NY, USA, 1968. [Google Scholar]
- Park, R.E.; Burgess, E.W. Introduction to the Science of Society; The University of Chicago Press: Chicago, IL, USA, 1921/1933.
- Sampson, R.J.; Raudenbush, S.W.; Earls, F. Neighborhoods and violent crime: A multilevel study of collective efficacy. Science 1997, 277, 918–924. [Google Scholar] [CrossRef] [PubMed]
- Shaw, C.R.; Zorbaugh, F.M.; McKay, H.D.; Cottrell, L.S. Delinquency Areas: A Study of the Geographic Distribution of School Truants, Juvenile Delinquents, and Adult Offenders in Chicago; University of Chicago Press: Chicago, IL, USA, 1929; Volume xxi, 214p. [Google Scholar]
- Lightowlers, C.; Pina-Sánchez, J.; McLaughlin, F. The role of deprivation and alcohol availability in shaping trends in violent crime. Eur. J. Criminol. 2021. [Google Scholar] [CrossRef]
- Sampson, R.J.; Groves, W.B. Community Structure and Crime: Testing Social-Disorganization Theory. Am. J. Sociol. 1989, 94, 774–802. [Google Scholar] [CrossRef] [Green Version]
- Kornhauser, R.R. Social Sources of Delinquency: An Appraisal of Analytic Models; University of Chicago Press: Chicago, IL, USA, 1978. [Google Scholar]
- Lee, Y.J.; Eck, J.E.; SooHyun, O.; Martinez, N.N. How concentrated is crime at places? A systematic review from 1970 to 2015. Crime Sci. 2017, 6, 6. [Google Scholar] [CrossRef]
- Ilijazi, V.; Milic, N.; Milidragovic, D.; Popovic, B. An Assessment of Police Officers’ Perception of Hotspots: What Can Be Done to Improve Officers’ Situational Awareness? ISPRS Int. J. Geo-Inf. 2019, 8, 260. [Google Scholar] [CrossRef] [Green Version]
- Watson, D.; Johnson, L.M.; Pino, N.; Morgan, P. Police perceptions of residents in a high-crime area in Trinidad and Tobago: Community framing and crime wars. Criminol. Crim. Justice 2019, 21, 3–20. [Google Scholar] [CrossRef]
- Ratcliffe, J.H.; McCullagh, M.J. Chasing Ghosts? Police Perception of High Crime Areas. Br. J. Criminol. 2001, 41, 330–341. [Google Scholar] [CrossRef] [Green Version]
- Stein, R.E.; Griffith, C. Resident and Police Perceptions of the Neighborhood: Implications for Community Policing. Crim. Justice Policy Rev. 2015, 28, 139–154. [Google Scholar] [CrossRef]
- Vallejo Velazquez, M.; Kounadi, O.; Podor, A. Analysis and mapping of crime perception: A quantitative approach of sketch maps. AGILE GIScience Ser. 2020, 1, 20. [Google Scholar] [CrossRef]
- Lopez, N.; Lukinbeal, C. Comparing Police and Residents′ Perceptions of Crime in a Phoenix Neighborhood using Mental Maps in GIS. Yearb. Assoc. Pac. Coast Geogr. 2010, 72, 33–55. [Google Scholar] [CrossRef]
- Sun, I.Y.; Triplett, R.A. Differential perceptions of neighborhood problems by police and residents. Polic. Int. J. Police Strateg. Manag. 2008, 31, 435–455. [Google Scholar] [CrossRef]
- Gerell, M.; Puur, M.; Guldåker, N. Swedish conditions? Characteristics of locations the Swedish police label as vulnerable. Available online: https://osf.io/3ndsw/ (accessed on 15 April 2021).
- NOA. Criminal Impact in the Local Community—A Situation Awareness for the Development in Vulnerable Areas (In Swedish with the Title: Kriminell Påverkan i Lokalsamhället—En Lägesbild för Utvecklingen i Utsatta Områden); Nationella Opertiva Avdelningen (NOA), Polismyndigheten (Swedish Police): Stockholm, Sweden, 2019. [Google Scholar]
- Aneshensel, C.S. Social Stress: Theory and Research. Annu. Rev. Sociol. 1992, 18, 15–38. [Google Scholar] [CrossRef]
- Cutrona, C.E.; Wallace, G.; Wesner, K.A. Neighborhood Characteristics and Depression: An Examination of Stress Processes. Curr. Dir. Psychol. Sci. 2006, 15, 188–192. [Google Scholar] [CrossRef] [Green Version]
- Weatherburn, D.; Lind, R.L. What Mediates the Macro-Level Effects of Economic and Social Stress on Crime? Aust. New Zealand J. Criminol. 2006, 39, 384–397. [Google Scholar] [CrossRef]
- Guldåker, N.; Tykesson, M. Social stress och sociala risker i två städer—ett analysexempel. In Att Laga Revor i Samhällsväven—Om Social Utsatthet och Sociala Risker i Den Postindustriella Staden; Malmö University Publications in Urban Studies: Malmö, Sweden, 2014; Volume 18, pp. 60–82. [Google Scholar]
- Gerell, M. Collective efficacy and arson: The case of Malmö. J. Scand. Stud. Criminol. Crime Prev. 2017, 18, 35–51. [Google Scholar] [CrossRef]
- SCB. DeSO—Demografiska statistikområden. Available online: https://www.scb.se/hitta-statistik/regional-statistik-och-kartor/regionala-indelningar/deso---demografiska-statistikomraden/ (accessed on 16 September 2021).
- SCB. Definitions and Sources for Statistics Sweden’s Market Profiles (In Swedish with the Title: Definitioner och Källor för Scb:s Marknadsprofiler). Available online: https://www.scb.se/vara-tjanster/regionala-statistikprodukter/marknadsprofiler/definitioner-och-kallor-for-scbs-marknadsprofiler/ (accessed on 10 March 2021).
- Morris, R.; Carstairs, V. Which deprivation? A comparison of selected deprivation indexes. J. Public Health Med. 1991, 13, 318–326. [Google Scholar] [CrossRef]
- Gerell, M. Neighborhoods without Community: Collective Efficacy and Crime in Malmö, Sweden. Ph.D. Thesis, Malmö University, Malmö, Sweden, 2017; p. 168. [Google Scholar]
- SCB. Urban areas in Sweden (In Swedish with the Title: Tätorter i Sverige). Available online: https://www.scb.se/hitta-statistik/sverige-i-siffror/miljo/tatorter-i-sverige/ (accessed on 10 March 2021).
- Brisson, D.; Roll, S. The Effect of Neighborhood on Crime and Safety: A Review of the Evidence. J. Evid. Based Soc. Work 2012, 9, 333–350. [Google Scholar] [CrossRef] [PubMed]
- Sampson, R.J.; Morenoff, J.D.; Gannon-Rowley, T. Assessing “Neighborhood Effects”: Social Processes and New Directions in Research. Annu. Rev. Sociol. 2002, 28, 443–478. [Google Scholar] [CrossRef] [Green Version]
- Calderoni, F.; Maria Campedelli, G.; Comunale, T.; Marchesi, M.E.; Savona, E.U. Recruitment into organised criminal groups: A systematic review. Trends Issues Crime Crim. Justice 2020, 583, 1–27. [Google Scholar] [CrossRef]
- Deas, I.; Robson, B.; Wong, C.; Bradford, M. Measuring Neighbourhood Deprivation: A Critique of the Index of Multiple Deprivation. Environ. Plan. C Gov. Policy 2003, 21, 883–903. [Google Scholar] [CrossRef]
- Decancq, K.; Lugo, M.A. Weights in Multidimensional Indices of Wellbeing: An Overview. Econom. Rev. 2013, 32, 7–34. [Google Scholar] [CrossRef]


| Intermediate Description | Variable | Classification Method and Classes | No. of Grids | Motivation of Classes | Source and Comments |
|---|---|---|---|---|---|
| Economic conditions | Education—Pre-upper-secondary education (%) | Classification based on mean and standard deviations (normal distribution), rounded to the nearest integer; mean value = 12.7 Class 1: 49.1–100% Class 2: 23.1–49% Class 3: 10.1–23% Class 4: 3.1–10% Class 5: 0–3% | 85,632 | The lower the level of education, the greater the risk of economic marginalization. | Statistics Sweden (SCB) Year of collection: 2018 |
| Employment rate (%) | Classification based on mean and standard deviations (normal distribution), rounded to the nearest integer; mean value = 79.6 Class 1: 0–43% Class 2: 43.1–59% Class 3: 59.1–75% Class 4: 75.1–90% Class 5: 90–100% | 81,672 | The lower the employment rate, the greater the risk of economic marginalization. | Statistics Sweden (SCB) Year of collection: 2018 | |
| Income (SEK) | Quartiles + 1 extra added class; mean value = 269,995 Class 1: 0–163,617 SEK Class 2: 163,618–280,169 Class 3: 280,170–400,577 Class 4: 400,578–500,000 Class 5 (added): over 500,000 | 94,612 | The lower the income, the greater the risk of economic marginalization. | Statistics Sweden Year of collection: 2016 The division is based on Statistics Sweden’s official classification of the median income intervals (gross income before tax) of the population aged 20 and over. | |
| Family conditions | Marital status–single parents (%) | Classification based on mean and standard deviations (values not normally distributed), rounded to the nearest integer; mean value = 5.08 Class 1: 20.1–100% Class 2: 15.1–20% Class 3: 8.1–15% Class 4: 3.1–8% Class 5: 0–3% | 97,344 | The higher the proportion of single parents with children living at home, the greater the risk of vulnerable family conditions. | Statistics Sweden Year of collection: 2018 |
| Population per km2 | Classification based on mean and standard deviations (values not normally distributed), rounded to the nearest integer; mean value = 1303 Class 1: 8500.1–79,799 Class 2: 5000.1–8500 Class 3: 2500.1–5000 Class 4: 1000.1–2500 Class 5: 0–1000 | 105,613 | The higher the population density, the greater the risk of vulnerable family conditions. | Statistics Sweden Year of collection: 2018 | |
| Housing conditions (segregation) | Foreign background (%) | Classification based on mean and standard deviations (values not normally distributed), rounded to the nearest integer; mean value = 15.6 Class 1: 70.1–100% Class 2: 50.1–70% Class 3: 25.1–50% Class 4: 10.1–25% Class 5: 0–10% | 108,113 | The higher the proportion of the population with a foreign background, the higher the risk of segregation and vulnerable housing conditions. | Statistics Sweden Year of collection: 2018 |
| Index | Classification Method | No. of Grids |
|---|---|---|
| Economic conditions | Classification based on mean and standard deviations (normal distribution); mean value = 3.29 | 69,567 |
| Family conditions | Classification based on mean and standard deviations (values are not normally distributed); mean value = 4.16 | 69,567 |
| Housing conditions (segregation) | Classification based on mean and standard deviations (values are not normally distributed); mean value = 4.08 | 108,113 |
| Living conditions | Classification based on mean and standard deviations (normal distribution); mean value = 3.84 | 69,567 |
| Living Conditions | No. of Intersecting Grids | % of Intersecting Grids | Tot. No. of Grids | % Grids of Total |
|---|---|---|---|---|
| Vulnerable (red and orange) ≤−2.0 Std. Dev. | 801 | 61.33 | 2787 | 4.01 |
| Good (light green and green) −2.0 to 1.0 Std. Dev. | 499 | 38.21 | 54,978 | 79.03 |
| Very good (dark green) >1.0 Std. Dev. | 6 | 0.46 | 11,802 | 16.96 |
| Total | 1306 | 100 | 69,567 | 100 |
Publisher’s Note: MDPI stays neutral with regard to jurisdictional claims in published maps and institutional affiliations. |
© 2021 by the authors. Licensee MDPI, Basel, Switzerland. This article is an open access article distributed under the terms and conditions of the Creative Commons Attribution (CC BY) license (https://creativecommons.org/licenses/by/4.0/).
Share and Cite
Guldåker, N.; Hallin, P.-O.; Nilvall, K.; Gerell, M. Crime Prevention Based on the Strategic Mapping of Living Conditions. ISPRS Int. J. Geo-Inf. 2021, 10, 719. https://doi.org/10.3390/ijgi10110719
Guldåker N, Hallin P-O, Nilvall K, Gerell M. Crime Prevention Based on the Strategic Mapping of Living Conditions. ISPRS International Journal of Geo-Information. 2021; 10(11):719. https://doi.org/10.3390/ijgi10110719
Chicago/Turabian StyleGuldåker, Nicklas, Per-Olof Hallin, Kim Nilvall, and Manne Gerell. 2021. "Crime Prevention Based on the Strategic Mapping of Living Conditions" ISPRS International Journal of Geo-Information 10, no. 11: 719. https://doi.org/10.3390/ijgi10110719
APA StyleGuldåker, N., Hallin, P.-O., Nilvall, K., & Gerell, M. (2021). Crime Prevention Based on the Strategic Mapping of Living Conditions. ISPRS International Journal of Geo-Information, 10(11), 719. https://doi.org/10.3390/ijgi10110719