Article

Exploring the Influence Mechanism of Attractiveness on Wuhan’s Urban Commercial Centers by Modifying the Classic Retail Model

School of Architecture and Urban Planning, Huazhong University of Science and Technology, Wuhan 430074, China
*
Author to whom correspondence should be addressed.
ISPRS Int. J. Geo-Inf. 2021, 10(10), 652; https://doi.org/10.3390/ijgi10100652
Submission received: 21 July 2021 / Revised: 13 September 2021 / Accepted: 22 September 2021 / Published: 28 September 2021
(This article belongs to the Special Issue Geo-Information Science in Planning and Development of Smart Cities)

Abstract

:
The attractiveness of commercial centers is one of the core issues in urban and rural planning research. To deepen the theoretical understanding of attractiveness and optimize modeling, we empirically analyzed the factors and mechanisms influencing the attractiveness of Wuhan’s commercial centers by improving the classic retail model and testing the age differentiation of mechanisms. The results indicate the following: (1) there is an obvious attractiveness gap in the commercial centers examined, and six have not met their planning expectations; (2) intensive and abundant shopping services, domestic services, sports and leisure services, and medical care services all promote attractiveness, but their impact on customers of different ages varies greatly. For young consumers, shopping services have the greatest effect on attractiveness, whereas for middle-aged and elderly consumers, sports and leisure services have the greatest effect; (3) the accumulation of length of development increases the likelihood of young people’s patronage, but the effect is weak; (4) traffic resistance shows a stable inhibitory effect, and middle-aged and elderly people are more sensitive to travel time than youth; (5) improving the retail model is effective, and the model is more powerful in explaining young consumers. This research also puts forward policy recommendations for the commercial centers’ industry configuration, new and old combinations, and traffic accessibility, and then proposes planning countermeasures for Wuhan’s city- and-county-level commercial center layout, local commercial land morphology organization, and the construction optimization of commercial centers that have not met expectations.

1. Introduction

Business is the backbone of a country’s economy [1]. Statistics from 2017 to 2019 show that more than 20% of the added value of China’s tertiary industry comes from the retail, catering, wholesale, and accommodation industries. Commercial consumption is at the core of China’s national strategy [2]. In 2019, the General Office of the State Council issued the “Opinions on Accelerating the Development of Circulation and Promoting Commercial Consumption”, requiring all localities to compensate for the shortcomings, strengths, and weaknesses in the supply of their goods and services and calling for the optimization and mining of the consumption environment and power. After 2020, the momentum of international circulation weakened, and the dependence of “consumer cities” on the domestic cycle has increased. Therefore, a popular commercial center is of great significance in boosting the economy, improving quality of life, and enhancing the reputation of urban investment [3].
There are many definitions of “commercial centers” in China’s economic and planning industry, including the collective designation of various types of commercial centers at all levels (Shanghai Commercial Center Classification Specification [DB31/T261-2001], Wuhan City Commercial Center Classification Specification [DB42/T238-2003]), or “the areas where the prosperous degree, the number of facilities, and the number of consumers is significantly higher than the general area [4]”. In the present empirical analysis, “commercial center” refers to a contiguous area where retail and catering outlets are highly concentrated. The concept of the attractiveness of a commercial center is based on the interaction between customers and commercial spaces. Commonly used perspectives for determining attractiveness include customer satisfaction, transaction rate, per capita consumption, passenger flow per unit area, and visit frequency [5]. In this study, we use spatial interaction probability to characterize attractiveness, which refers to the probability that any commercial center will be visited by people from any place [6].
Wuhan ranks among the top three sub-provincial cities for the total retail sales of consumer goods, with a high degree of retail participation (China’s New Retail City Index Report 2018), and the age distribution of consumers is relatively balanced [7]. However, the 2016–2020 Wuhan City Commercial Network Layout Plan is about to expire. As such, it is worth considering whether the new round of planning should adjust the level of some commercial centers. Furthermore, how can the list of city-level or county-level commercial centers be increased or decreased? How can the organizational form and scale of commercial land be refined in the new version of Wuhan’s national territory spatial planning? To balance business development and create a prosperous business district, how can Wuhan implement effective attractive upgrade measures for “defective commercial centers?” To answer the questions above, scientific argumentation is required [8,9]. However, deficiencies in the effects of business type and duration, age differentiation of mechanisms, modeling, and solving are present in existing theories. Therefore, this research aims to address these limitations in understanding attractiveness and then supplement the theoretical basis for commercial center layout and land-use optimization.
In this paper, we first review the theoretical progress of the attractiveness of commercial centers; we then describe the data and methods used for measuring and analyzing attractiveness before describing the attractive features of Wuhan’s commercial centers and revealing the mechanism of attractiveness and its age differentiation. Finally, we provide policy recommendations for improving the layout and land use of commercial centers and upgrading the attractiveness of the commercial centers that have not met expectations.

2. Literature Review

2.1. Factors Affecting the Attractiveness of Commercial Centers

Numerous literature studies have shown that commercial scale, traffic resistance and competitive relationship have a significant impact on the attractiveness of commercial centers [10,11,12,13,14]. For example, Reilly (1929) and Huff (1963), successively revised the classic retail model to confirm that the attractiveness of a commercial center is directly proportional to its size and inversely proportional to the time and distance required to reach the commercial center [15,16]. Wilson et al. (1967, 1978, 2008, 2011, 2017) has repeatedly demonstrated the influence of commercial scale on attractiveness by continuously optimizing the retail model in his researchs [17,18,19,20,21]. Christaller (1933) put forward three principles in his central place theory, among which the principle of optimal transportation points out: When shopping, customers tend to choose the nearest commercial center in order to achieve the lowest travel cost [22]. Western scholars quantified the role of competition among commercial centers as early as the 1970s, and its role has been repeatedly verified. For example, Piovani et al. (2017) found that the number, level and scale of commercial centers in a system will constantly change in the course of competition, and eventually tend to be stable and balanced [20]. Research by Schlaich et al. (2020) revealed that location and size adjustments to already planned retail centers in a town can yield a 10% increase in estimated store visits [23].
In addition to the three influencing factors of commercial scale, traffic resistance and competitive relationship, scholars have also extensively analyzed other factors such as length of development and industry density; the impact of these two factors vary greatly, so they have not been merged into a unified analysis framework. Zhou Suhong et al. (2008) concluded that the maturity of a commercial center is one of the important factors that affect consumers’ preference [24]. Tan Yitian (2019) also found that with the development of time, most established commercial centers will have a more fixed passenger flow, and some small commercial centers may be diverted or eliminated [25]. Nevin and Bellenger et al. (1977) pointed out that the combination of different types of industries within commercial centers has a great impact on consumers’ patronage [26]. According to Bacon (1995), the combination of various types of industries can make it synergistic and provide customers with more choices [27].

2.2. Development of the Retail Model

The retail model was derived from the Newtonian gravity model. Initially, the retail model contained only two variables, population and distance, and the focus of the investigation was the coefficient of distance [15]. Later, the general paradigm of the retail location model was abstracted from the central place theory [21]. Out of doubt about the retail service blank area and fixed customer shares, Huff (1963) revised the model into a probability model, defined non-fixed distance parameters, and supplemented the competitive relationship between commercial facilities [16]. The introduction of the transportation model expands the quantitative relationship between the distribution of retail centers and the travel costs of travelers [28]. In 1970, mathematical geographer Alan.G.Wilson improved the gravity model and the activity distribution model from a statistical perspective and built a spatial interaction model of travel distribution between different locations [29]. In the early days, the commuting flow between one’s residence and work was often used as an example [17]. However, after 1985, an urban retail system was introduced [30]. The retail model of social physics and statistical mechanics, which is based on the maximization of entropy, has since been widely used. For example, it has been used to cross-predict the dynamic trend of the retail system with thermophysics and ecology [18], it has been combined with percolation theory to explain the influence of traffic networks on the attractiveness of commercial centers [20], and it has been used with the differential equation system to simulate the evolutionary forces of the retail space structure [31]. The model structure has remained relatively stable since [23].

2.3. Age Influences the Choice of Shopping Destination

The innovation of transportation and the evolution of urban commerce have expanded the scope of the business district and the reachable range of residents [32], thereby transforming the spatial interaction between the commercial center and its consumers [33,34]. China’s urban space is moving toward multicenter networking [35]. Consumers favor different shopping destinations, and their preferences are influenced by several factors, including age. For example, large shopping malls may not be as attractive to the elderly as street shops. Therefore, the attraction mechanisms of commercial centers may be different for consumers of different ages [36,37,38,39,40,41].
Existing studies have three shortcomings: (1) although the positive effects of diversification have been confirmed, how different business types contribute to attractiveness remains indistinct; (2) more evidence is required to determine whether development length has a significant positive or negative effect on business center attractiveness; (3) the theoretical understanding of how the attraction mechanism differs among customers of different ages remains relatively limited. To address these shortcomings, this study uses modeling ideas from social physics and statistical mechanics to improve the classic retail gravity model. To do so, it includes the variables of industry density and length of development. Furthermore, an age control group experiment was conducted to test the variation and robustness of the attractiveness mechanism (Figure 1).

3. Material and Methods

3.1. Commercial Centers

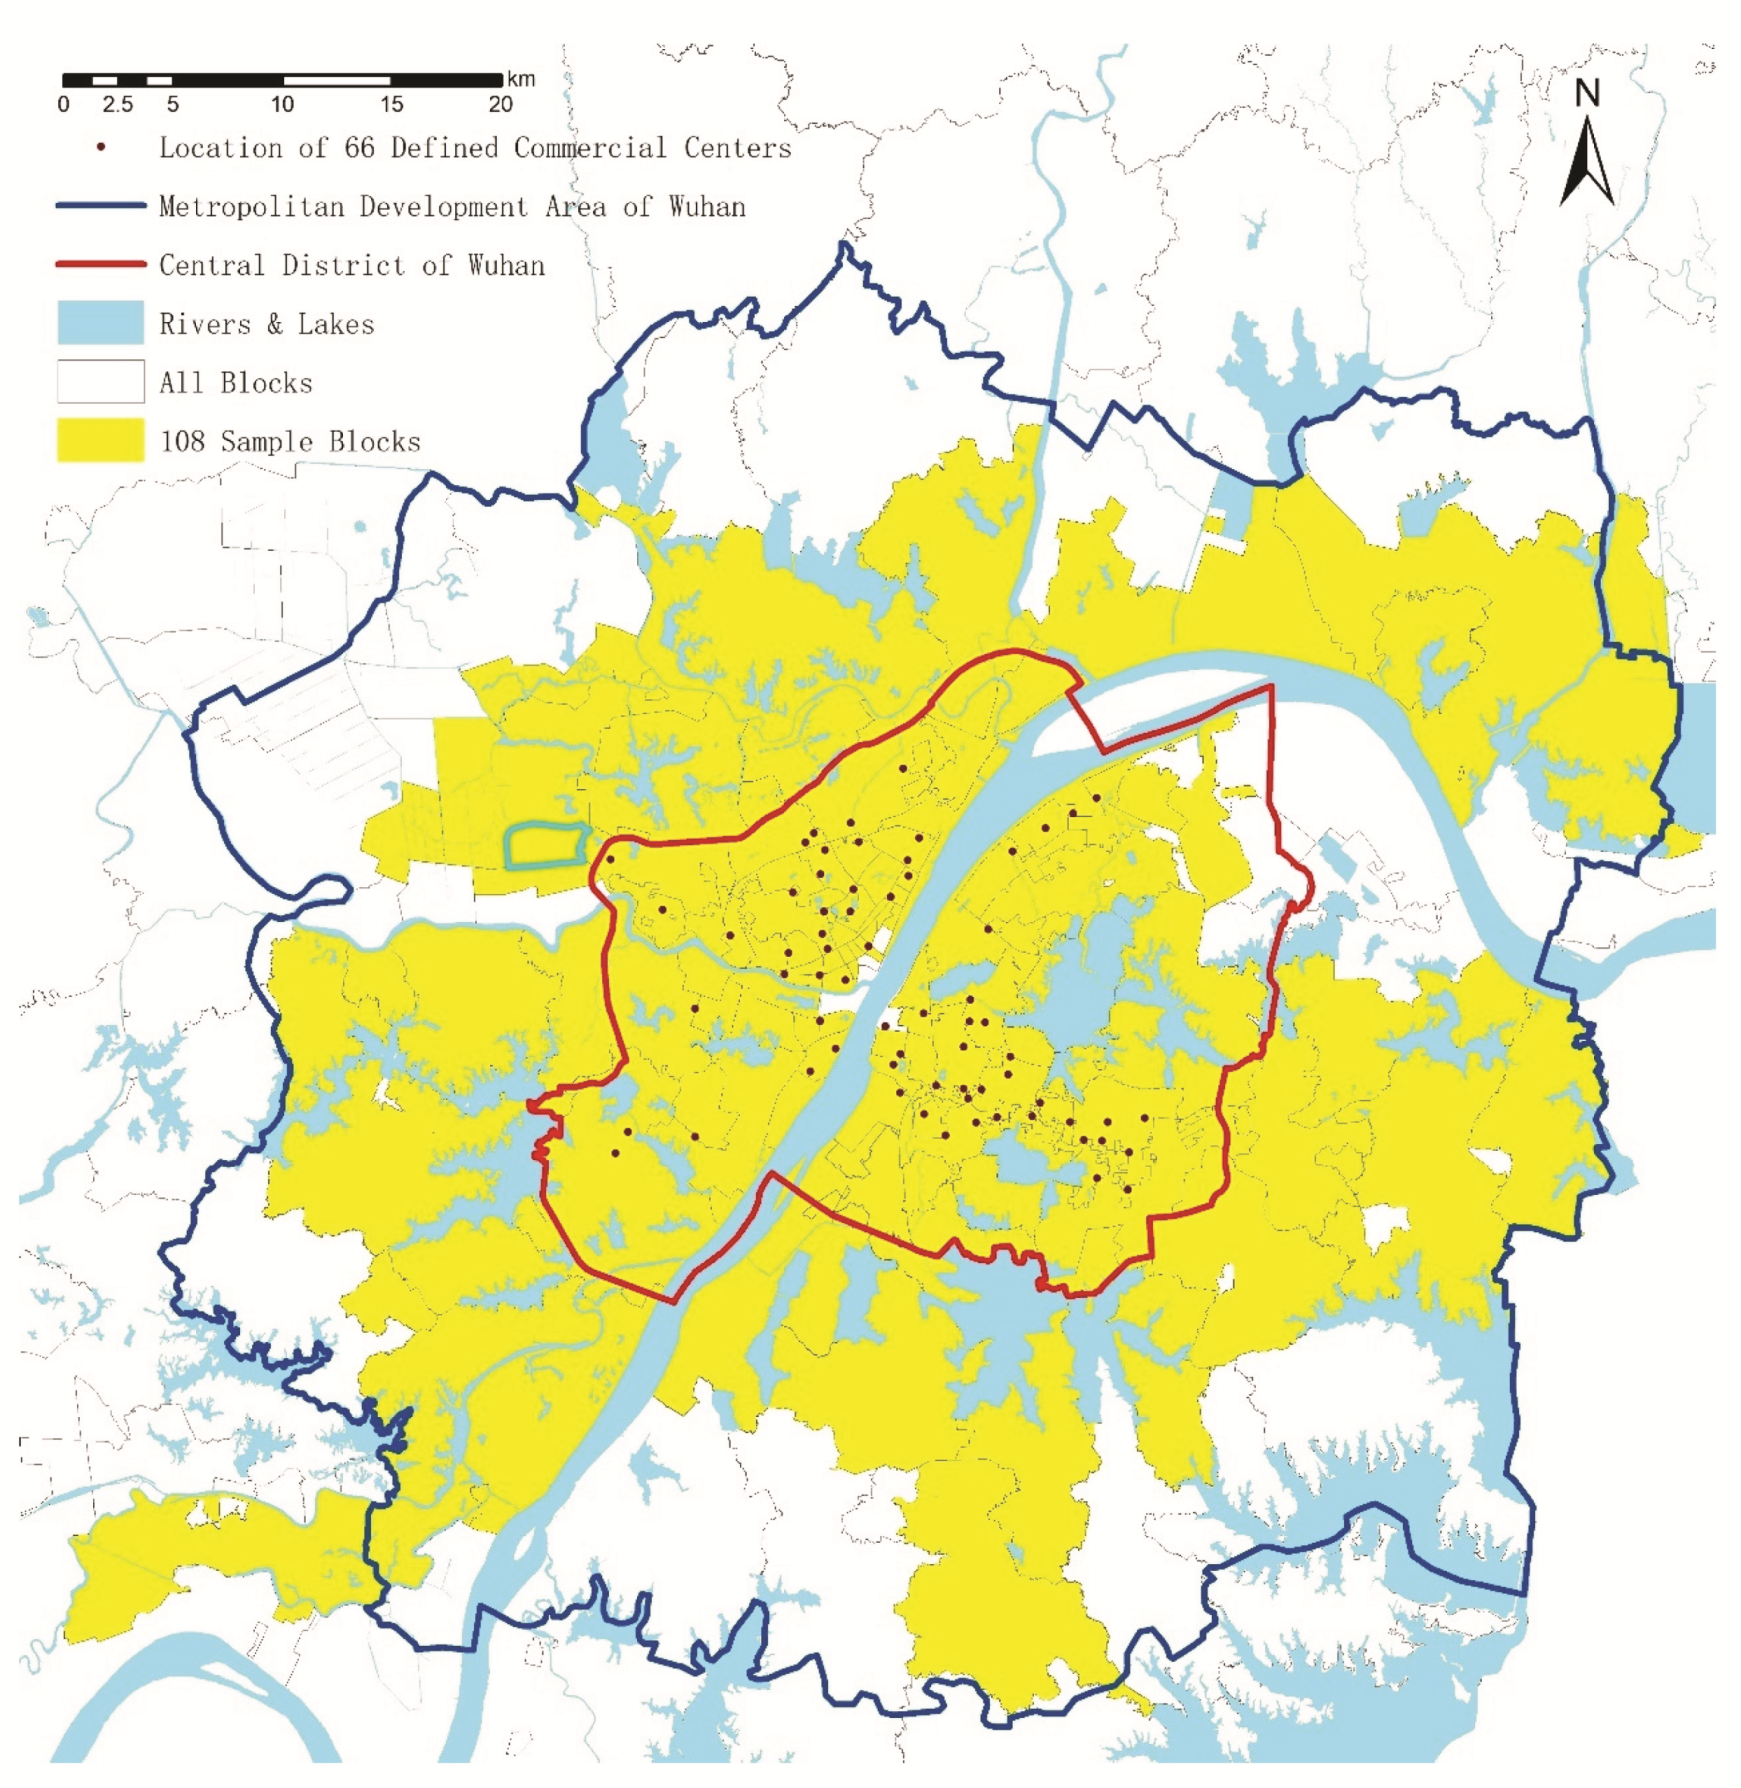
Based on the Wuhan Commercial Network Layout Plan (2016–2020) and the Wuhan City Master Plan (2010–2020), we defined 66 commercial centers in the central district (including 6 City-level, 21 County-level and 39 Community-level; each commercial center is assigned a serial number) (Figure 1, Table 1) accroding to name, classification, location, and scale of the commercial center. The definition is supplemented by the kernel density of POI (Point of Interest) and thermal analysis of people during lunch hours and weekend evenings [42], following the principles of location and level coverage.

3.2. Sample Blocks

Of 186 blocks in Wuhan, a total of 108 sample blocks were screened (Figure 2). The number of effective identifications in any township administrative area was counted according to the residential location of the LBS (Location Based Services) data after denoising. Based on the population data of Wuhan’s community and village committees, the population of each block was calculated, and the ratio was based on the number of valid identifications and the population; to identify sample blocks, the sampling ratio thresholds based on population ranged from 1% to 30%. According to the results (Figure 3), the sample blocks are concentrated in the Wuhan urban development area, and a large majority of blocks in the main urban area are included in the sample.

3.3. Data Sources

Six types of basic data were used:
(a) Interaction data between commercial centers and blocks.
A total of 7128 pieces of data were used, and the calculation basis was the LBS data. LBS data were collected from 31 August to 13 September 2019 (holidays and periods of rain and snow were avoided), the data collection period includes 17:00 to 22:00 on weekdays and from 10:00 to 22:00 on weekends. Data were collected from 66 defined commercial centers. The employment and residence information of customers were collected simultaneously, and the employment interference in the commercial center was eliminated; the counting points of passers-by in the commercial center were de-noised, as were the residential and employment points on the water and streets. Each effective customer in a business center has a unique ID in the LBS data field.
(b) Construction area data of commercial centers.
The calculation was based on the building profile data collected in 2018. The floorspace data of any commercial center was obtained through multiple methods such as property management interviews, access to public construction materials, field investigations, etc.
(c) Time-consuming traffic data between the commercial centers and blocks.
The time-consuming data were collected from the AutoNavi Map API (AutoNavi Open Platform is a leading domestic technology LBS service provider, with advanced data fusion technology and massive data processing capabilities. The services provided by AutoNavi Open Platform include maps, positioning, navigation, search, path planning, indoor maps, etc.).When “origin” (refer to ‘blocks’) and “detination” (refer to ‘commercial centers’) are inputted, the platform will automatically output “route” (refer to the shortest path from ‘origin’ to ‘destination’) and “duration” (refer to the shortest travel time from ‘origin’ to ‘destination’) data. We collected data on four types of transportation, namely walking, driving, riding, and public transportation (including transfer time), and averaged their “duration” to obtain time-consuming traffic data.
(d) POI data of the business types of commercial centers.
This information was collected from the AutoNavi Map API, and the data were collected in September 2019. These data distinguish six types of business industries: shopping service, catering, domestic service, sport leisure, medical care, and accommodation service (Figure 4). We remove the POIs located outside the commercial centers and divide the number of POIs for each type of industry by the shape area of the commercial center to get the industry type density per unit area.
(f) Data on the length of commercial center development.
According to the field survey and network information collection, the representative commercial buildings of any commercial center were identified. Their completion or opening dates were then identified, and the length of development as of September 2019 was calculated.
(g) Average age of the residents in blocks.
Based on the population data of Wuhan’s community and village committees, the average age of the community/village committee was calculated and weighted according to age group and the population of each age group. The average age of residents in blocks is defined as the second average of the age of the community/village committee within the administrative area.
In order to eliminate the influence of dimensions, when writing the Matlab programming code, we standardized the three types of data: “commercial floorspace”, “length of development” and “industry density”, using the “dispersion standardization” method, which is: linearizing the original data and making the result fall into the interval 0 to 1.

3.4. Research Methods

3.4.1. Expanding the Retail Model

The classic retail model of social physics and statistical mechanics is as follows [20]:
T i j = p i W j α e x p ( β C i j ) j W j α e x p ( β C i j )  
where T i j represents the passenger flow from residence i to commercial center j (usually expressed by the number of customers). p i is the total number of visitors from residence i (expressed by population), W j is the construction area of commercial center j, C i j is the comprehensive cost from i to j (expressed by distance or time consumption), and α and β are the adjustment coefficients of W and C, respectively. j W j α e x p ( β C i j ) plays a role of a partition function and used to represent the competitve environment. We usually define j T i j = p i .
The form of the flows in Equation (1) comes out of an entropy maximising process, and is obtained under the constraints that come from the observed data: the population’s p i , the aggregated floorspace’s W j and the cost matrix’s C i j spatial distribution. This means that the set of flows T i j are an equilibrium configuration, that depends on the input data as well as on the values of the parameters α and β. Any small change in the input data would yield a rapid reconfiguration to a new attractor state. We can therefore interpret this process as a fast dynamics one [20]. Moreover, we can see how these flows are defined by two parameters α and β: α which sets the scaling between the attractiveness and the floorspace of a retailer and β which tunes the cost of traffic. In the process of expanding the classic model, scholars have proved that α is greater than 0 and the value converges toward 1; and the value of β is discrete but always greater than 0.
We made the following adjustments to the classic retail model: (i) we used the number of visitors to define T i j and p i , so it can truly reflect the multifrequency and multidestination characteristics of modern consumer behavior. Therefore, we redefined Tij as the number of visitors from residence i to business center j, and pi as the total number of visitors from residence i to all commercial centers; (ii) We added the factors of length of development Lj and total industry density Dj to the model, and expanded e x p ( β C i j ) to e x p ( a C i j + b L j + c D j ) . According to Section 3.3, we decomposed Dj into {kn}, i.e.,
D j = n k n ( n = 1 , 2 , 3 , , 6 )  
with k 1 , k 2 , k 3 , , k 6 respectively represent the density of shopping service, catering, domestic service, sport and leisure, medical care, and accommodation service.
(iii) Since the value of α always converges to 1, we defined α = 1. As one can see in Section 2.1, traffic cost has a stable negative impact on the attractiveness of commercial centers, while the impact of industry density is relatively positive. Besides, the impact of length of development is somewhat unstable, but most of the time it is positive. In that case, we assume a < 0, b > 0, c > 0.
Based on the above adjustments, we defined the spatial interaction probability as P r o b i j = T i j p i . The improved model expression is as follows:
P r o b i j = W j e x p ( a C i j + b L j + c n k n ) j W j e x p ( a C i j + b L j + c n k n )  
In Equation (3), we defined residence i as 108 sample blocks and j as 66 commercial centers. W j was used to express the commercial floorspace; k n represents the density of six different industry and n k n was used to express the total density; L j was used to express the length of development of the commercial center; C i j was used to express the traffic cost (time or distance).

3.4.2. Building a Matrix of Spatial Interaction Flows

The location service data, including the visitor’s business center code and visit time, are associated with the visitor’s residence latitude and longitude data using the visitor ID. We reserved circumstances in which a customer visits multiple commercial centers in a single day; if a customer visits the same commercial center multiple times in a single day, it is counted as one spatial interaction. We used 108 sample blocks as the statistical unit, then added all the block IDs to the total number of spatial interactions in 66 commercial centers pi to summarize the number of interactions from all block IDs to each commercial center, namely Tij. Furthermore, we established a data matrix for the number of interactions between the sample blocks and commercial center spaces.

3.4.3. Solving the Optimal Model Using MATLAB

To solve this problem, we compiled a calculation program. The input data include the spatial interaction probability matrix whose elements represent the probabilities of i patronizing j (108 rows × 66 columns), the spatial interaction flow matrix whose elements represent the flows (or ‘interaction’) between i and j (108 rows × 66 columns), the total number of visits to township streets (108 rows × 1 column), the commercial center block traffic time matrix (108 rows × 66 columns), sample block number (108 rows × 2 columns), and commercial center attributes (66 rows × 10 columns). By changing the independent variables, we compared the model output results to find the optimal model, which was selected based on reliability and T-stat significance and the principle of maximum R2 and minimum error.

3.4.4. Conducting Age Group Controlled Experiments

The results of 108 sample blocks show that the average age of the Wuhan Iron and Steel Plant is the oldest, with a value of 46.99. The average age of the Miaoshan Office is the youngest, with a value of 25.17. In 2015, the average life expectancy in Wuhan was 80.27 years. We took 40 years as the boundary and divided the 108 sample blocks into two groups. Among them, 74 and 34 sample blocks had an average age greater and less than 40 years. Based on the two age group blocks, we differentiated the modeling. By this way, we will not only compare the modeling results between age groups but also with the modeling results for all ages.

4. Results and Analysis

4.1. Attractive Characteristics of Wuhan’s Commercial Center

4.1.1. Obvious Attractiveness Gap

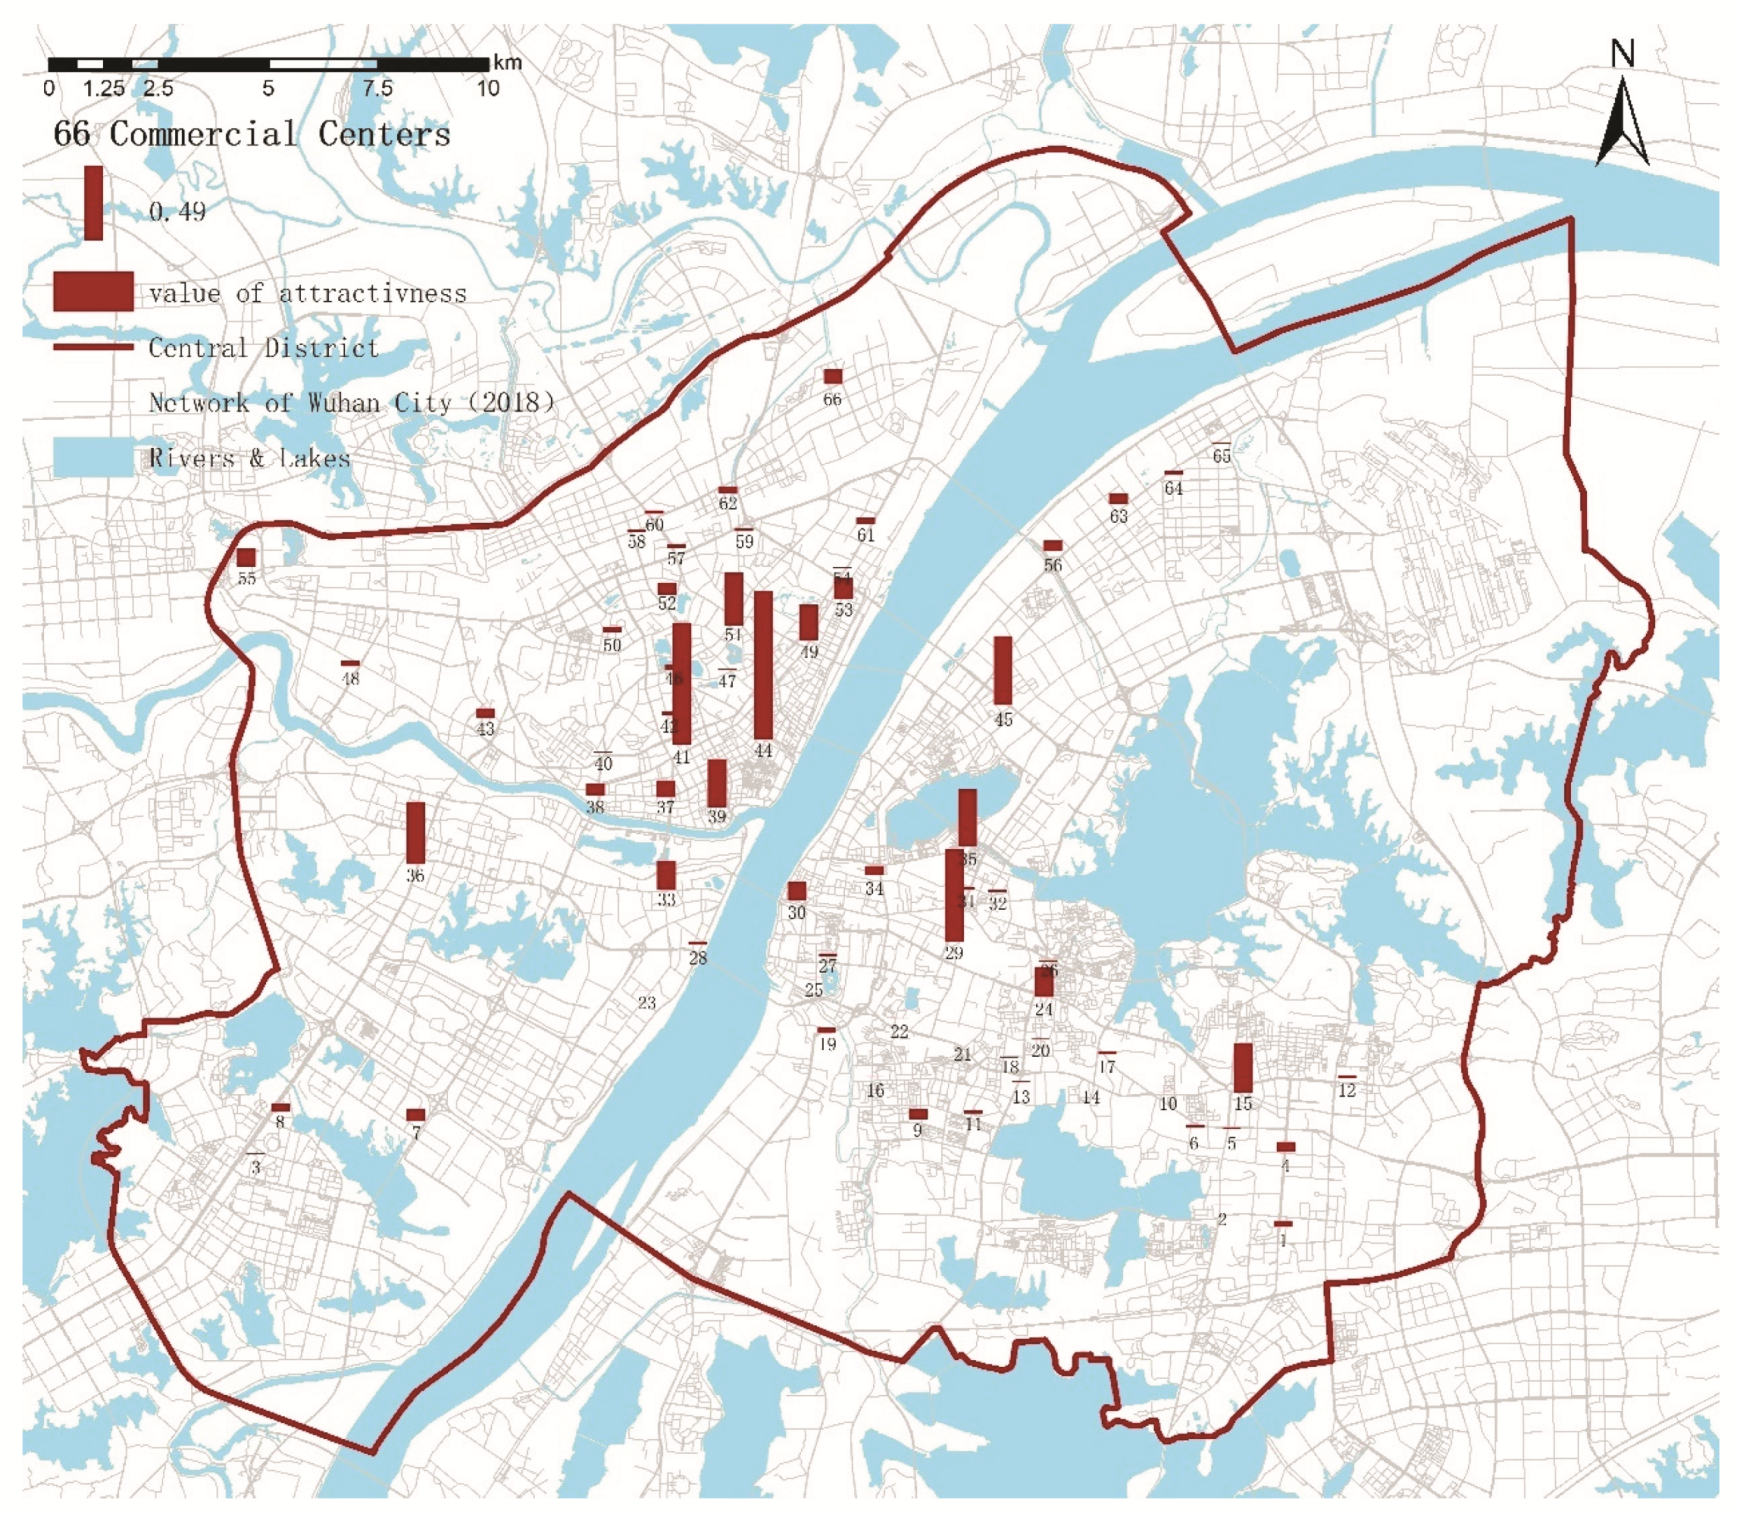
Based on the spatial interaction probability matrix (Table 2), we calculated the median value of the attractiveness of any commercial centers and normalized it, with their values converge between 0 to 1 (Figure 5). Figure 4 shows that there are a few commercial centers (such as No. 29, No. 36, No. 41, and No. 44 et al.) that are significantly more attractive than others. Meanwhile, the attractiveness of most commercial centers is still relatively low, and their values tend to be similar. It’s not hard to see that the attractiveness level of Wuhan’s commercial centers is polarized and the gap between them is very large.

4.1.2. Six Commercial Centers Are Less Attractive Than Planned

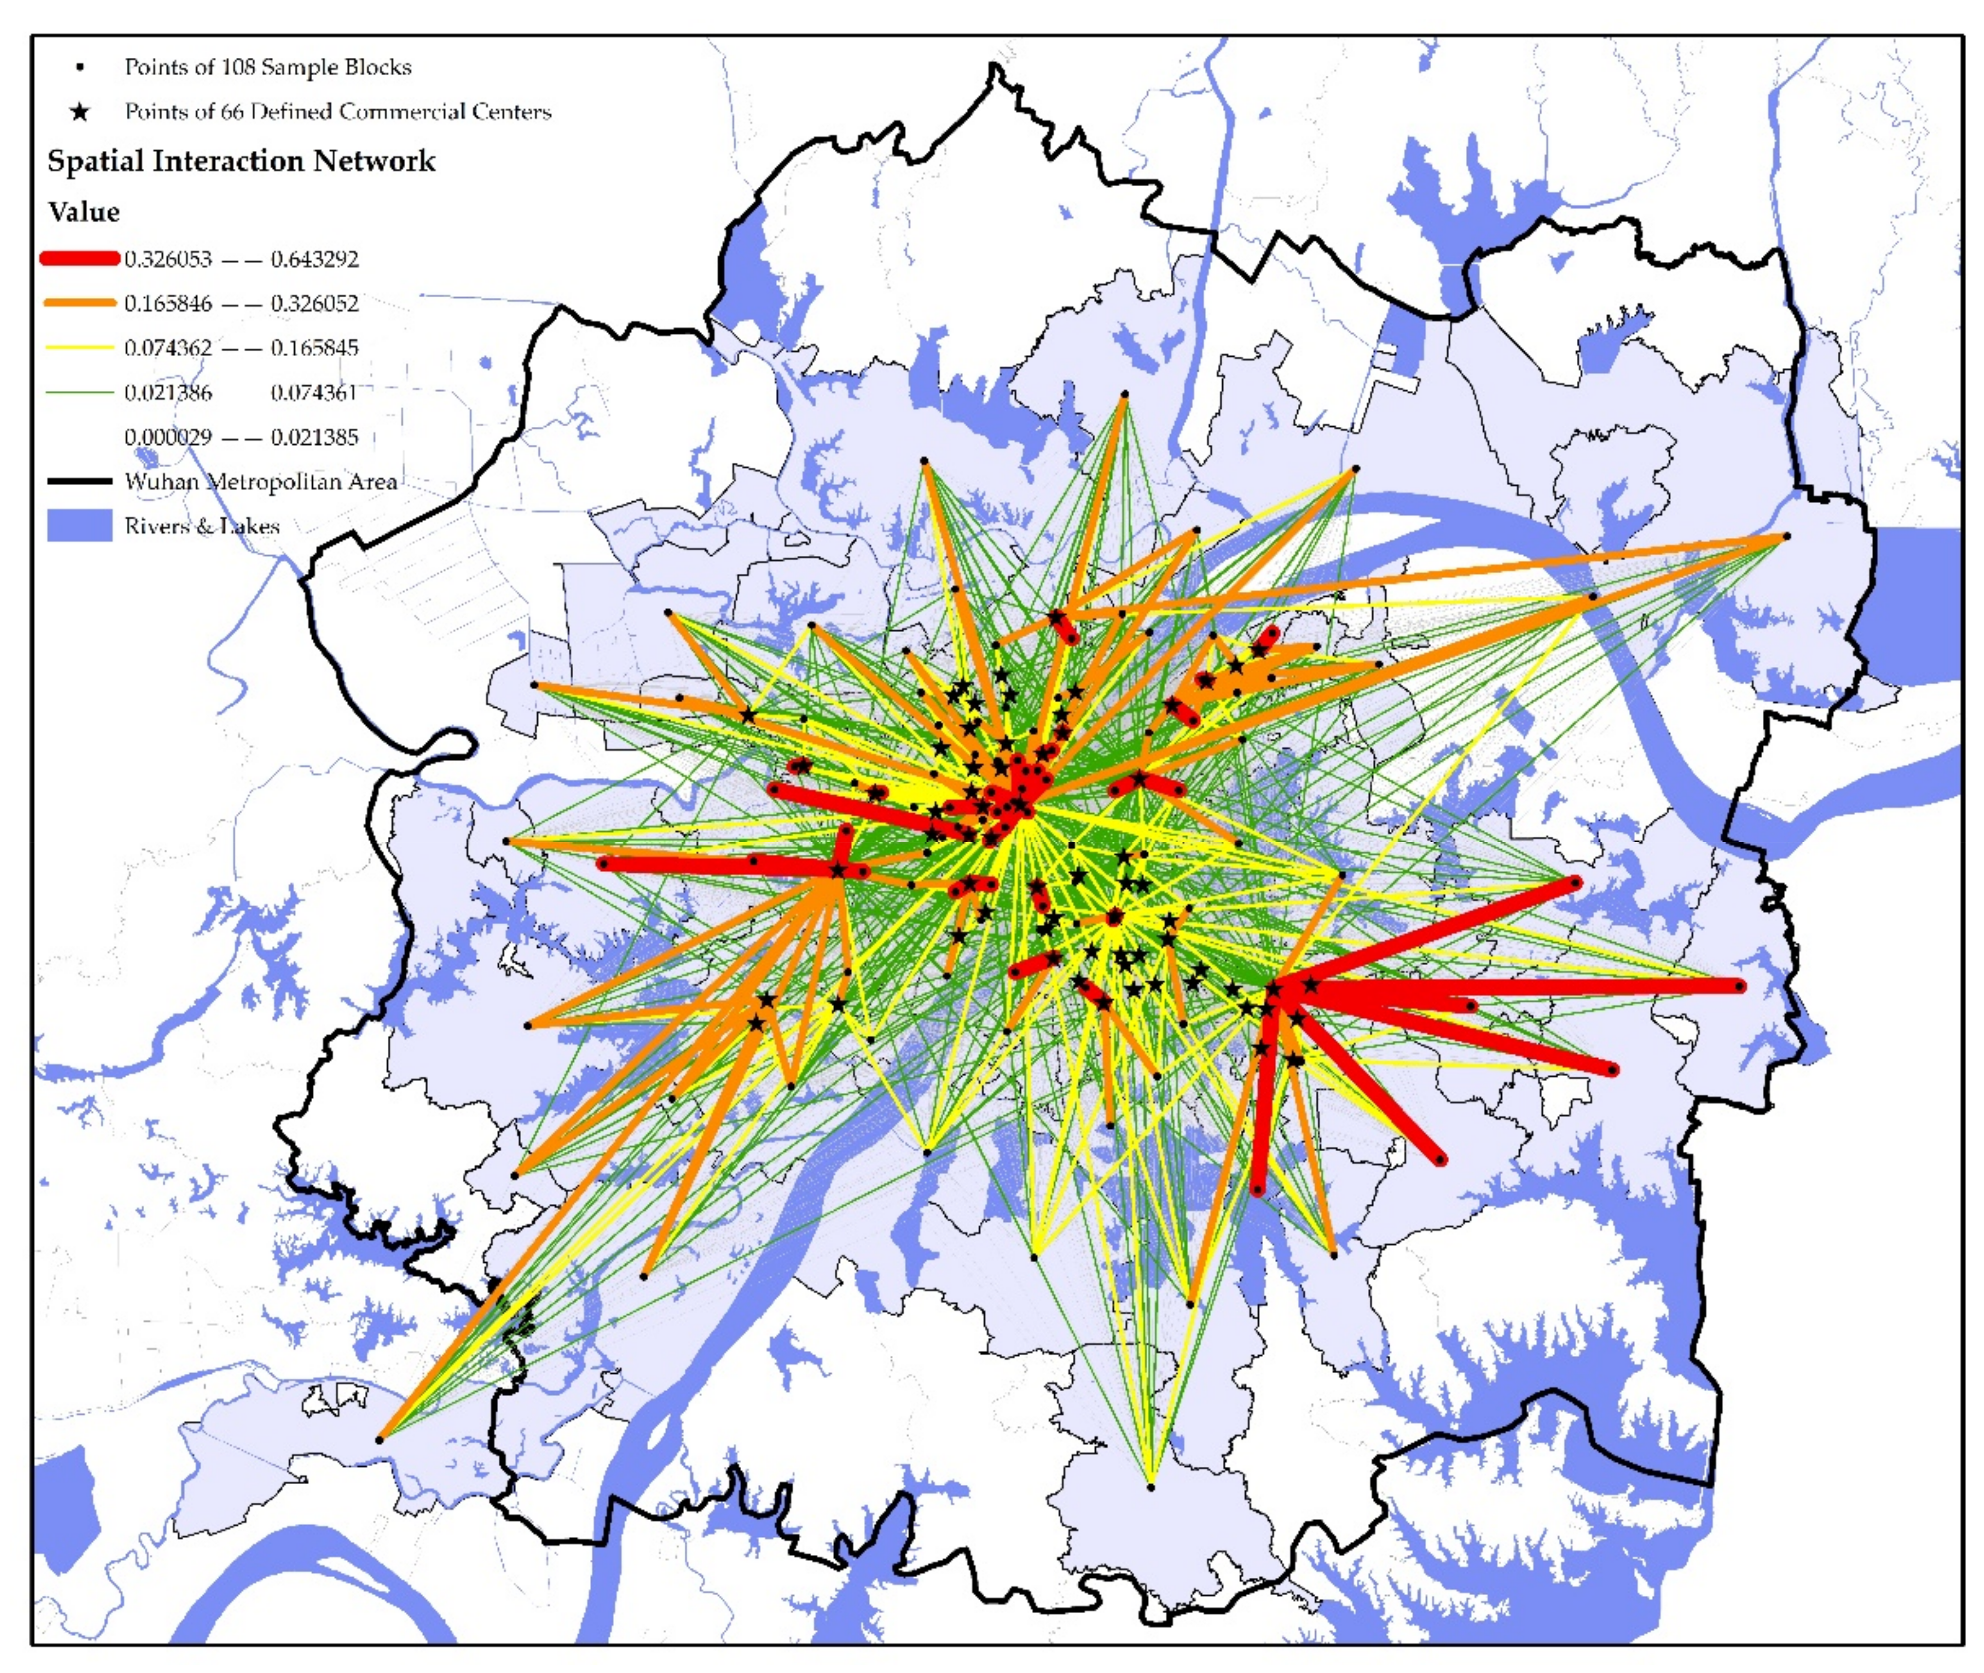
Based on the characteristics of attractiveness value, three kinds of variables and the spatial interaction network (Figure 5 and Figure 6, Table 3), we made a comprehensive comparison and analysis of the data in Table 1 and Table 3 corresponding to the planning level (Wuhan Commercial Network Layout Plan (2016–2020) (published by the Wuhan Municipal Bureau of Commerce in 2016) divides the commercial center of Wuhan into 3 levels: city-level, county-level and community-level) in Table 3. Analysis shows that the attractiveness of the No. 39 Longwang Temple (Hanzheng Street), No. 35 Chu River Han Street, and No. 49 Sanyang Road commercial centers has exceeded the planning assumptions. However, the attractiveness of No. 43 Hanxi Commercial Center, No. 52 Water Chestnut, No. 63 Jianer Road, and No. 9 Nanhu Commercial Center is lower than was expected. The attractiveness of the No. 61 Erqi Commercial Center and No. 8 Taizihu Commercial Center is far from expected.

4.1.3. Single Factor Is Not Capable to Explain Attractivess

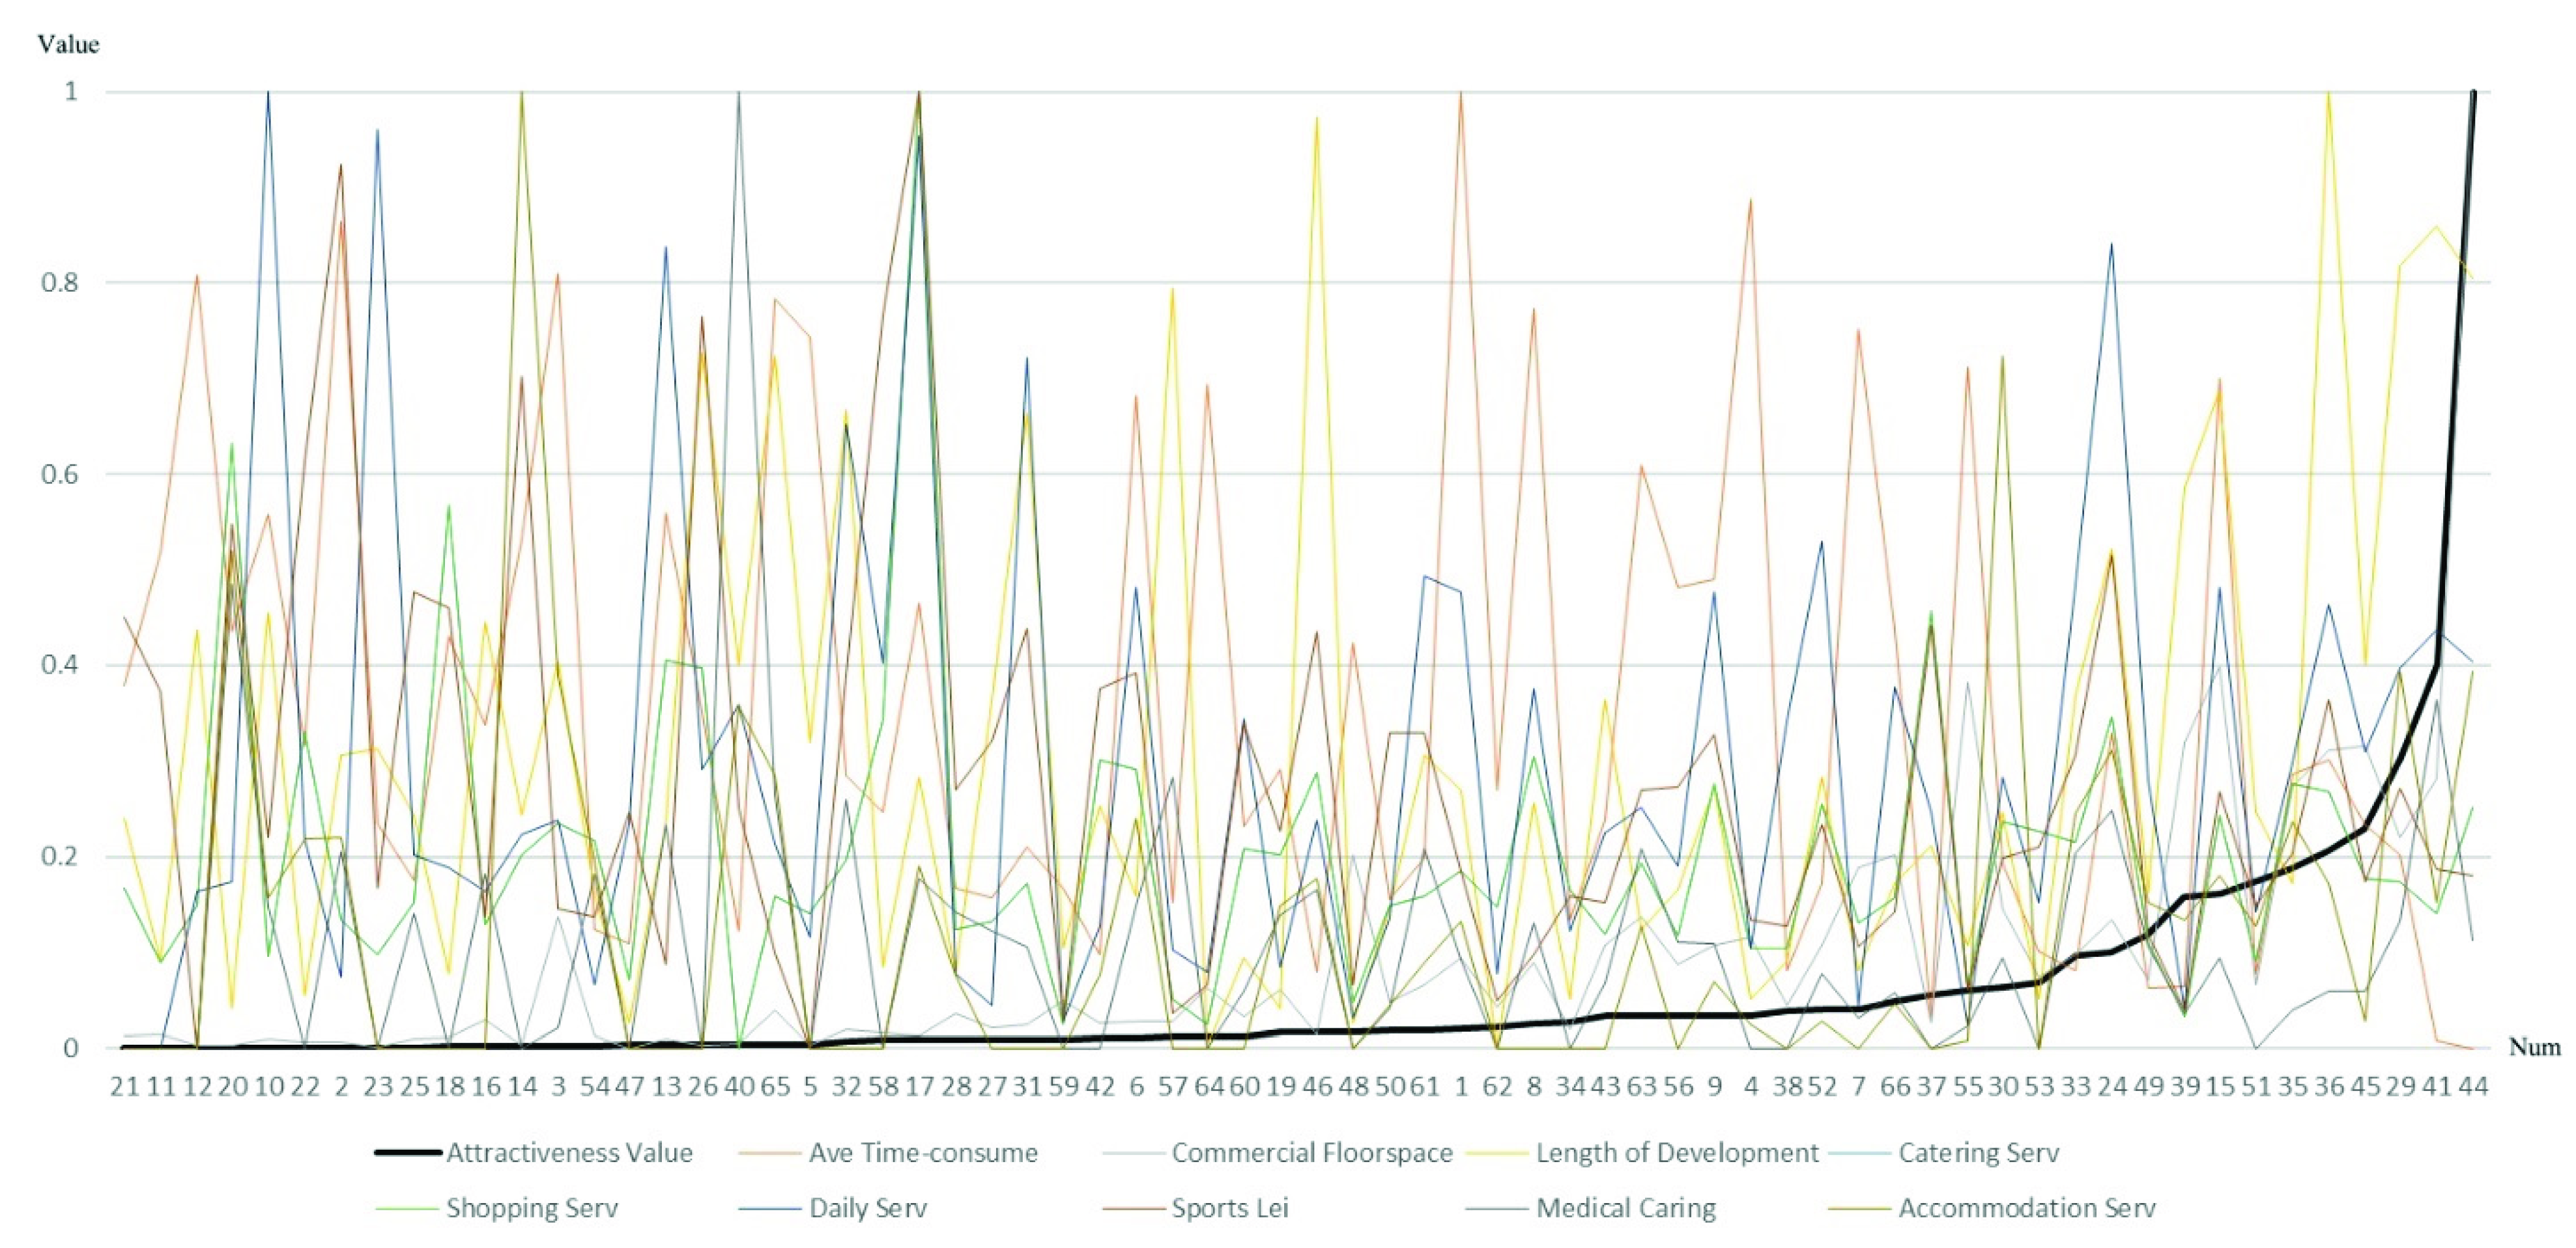
Are the trends of attractiveness and potential explanatory factors highly consistent? Taking the number of commercial centers as the horizontal axis and the standardized value as the vertical axis, we used the standardized values of each variable to draw a scatter plot and connect them into a broken line to observe the relationship between them and the attractiveness value (Figure 7). The analysis shows that the relationships between attractiveness and most factors do not conform to the general linear relationship. Although attractiveness’s relationship with commercial scale is relatively close, any single factor seems unlikely to explain the cause of attractiveness.

4.2. Influencing Factors and Mechanisms of the Attractiveness of Wuhan’s Commercial Centers

4.2.1. Modeling Results

The interaction probability between the commercial center and the township street is the dependent variable, and building area, traffic time consumption (coded as TAD_Time), industry density type (coded as Shop_POI_Den, DaiSer_POI_Den, Med_POI_Den, SpoLei_POI_Den, Acc_POI_Den), length of development (coded as CC_Age), and the competitive relationship between commercial centers are the objective environment that affects the development of the commercial center. We completed the modeling and solving based on (1) the consumption behavior data of all ages, (2) the consumption behavior of consumers over 40, and (3) the consumption behavior of consumers under 40. We used SPSS to test the factors and found collinearity between SpoLei_POI_Den and Cater_POI_Den. The model goodness-of-fit R2, reliability, and T-test values were compared after the two variables were substituted, and the optimal model was selected (Table 4, Table 5 and Table 6). The goodness-of-fit shows that improving the classic retail gravity model is effective, and the model is more powerful in explaining the consumers under 40.

4.2.2. Industry Density

The impact that different industry types have on the attractiveness of commercial centers varies significantly. Evidence shows that sufficient shopping, medical care, and sports and leisure services have produced a strong attraction for consumers of all ages, and shopping services have the highest attractive effect. Among the three industry types, shopping services are far more attractive to young people than they are to middle-aged and elderly. In contrast, sports and leisure services are far more attractive to middle-aged and elderly people than to young people. Medical care services are equally attractive to young, middle-aged, and elderly people. Not all ages of customers favor the dense living service facilities in commercial centers. Young people pay more attention to the richness of domestic services in commercial centers, and accommodation services inhibit attraction in the three model types. Increasing the density of accommodation facilities in commercial centers is likely to have a counterproductive effect on attracting middle-aged and older consumers. On the one hand, this may be because middle-aged and elderly people living in the city do not need to stay in hotels and guesthouses in commercial centers. On the other hand, this may be because accommodation facilities with relatively large business areas reduce the space available for other industries.

4.2.3. Length of Development

For consumers of all ages, long-established commercial centers seem to be more attractive, but the impact is weak. Over time, the probability of a particular business center being patronized by young people will increase, but it will decrease for middle-aged and elderly people, which suggests that young people may value business accumulation more than middle-aged and elderly people.

4.2.4. Traffic Resistance

Traffic impedance shows a very stable inhibitory effect among customers of all ages: the higher the transportation cost between the commercial center and the residential area, the less likely it is to be visited by consumers. Taking the traffic time indicator as an example, the evidence shows that middle-aged and elderly people are more sensitive to travel time than young people, which may be related to physical functioning and health factors.

4.2.5. Differences of the Influence between Factors

Generally speaking, shopping services have the strongest effect on the attractiveness of commercial centers, followed by medical care and sports and leisure services; other factors have limited effects, and the length of development has the least influence. When the primary consumers targeted are young people, shopping services remain the most effective, as it has a far greater effect than all other factors. When the primary consumers targeted are middle-aged and elderly people, sports and leisure services gain increased importance, followed by medical care services, and the influence of shopping services drops to third place.

5. Conclusions

5.1. Summary

At present, the attractiveness of commercial centers in large cities conforms to the law of gravity: attractiveness is directly proportional to commercial scale, inversely proportional to traffic resistance, and affected by the business competition environment. This study investigates the mechanism of business type and the length of its development on the attractiveness of the business center and examines the similarities and differences between the effects of the mechanism on consumers of different ages. The results of this study are as follows: (1) there is an obvious attractiveness gap between Wuhan’s commercial centers, and six commercial centers are not yet as attractive as their planning expectations outlined; (2) intensive and abundant shopping, domestic, sports and leisure, and medical care services produced promotional effects on attractiveness, but their impact on customers of different ages varied greatly. When consumers are young people, shopping services are the most attractive. However, sports and leisure services are most important to middle-aged and elderly customers; (3) accumulation of development time increases the likelihood of young people’s patronage, but the effect is weak; (4) traffic resistance shows a steady inhibitory effect, and middle-aged and elderly people are more sensitive to travel time than young people.
This study has innovatively expanded the retail gravity modeling method, tested the validity of the model using data from large cities in China, enriched the theoretical research using the retail gravity model, and provided a new understanding of the influence mechanism for the attractiveness of commercial centers. Furthermore, we have identified the relationship between industry type and development length and the attractiveness of the business center, and we have pointed out the age differentiation of the influence mechanism.

5.2. Policy Recommendations

To enhance the attractiveness of commercial centers, the study puts forward four policy recommendations: first, optimize the distribution structure of business types and guide their intensive concentration in shopping, domestic, sports and leisure, and medical care services. In areas with a large number of young people, priority should be given to aggregate shopping services. In areas where there are many middle-aged and elderly people, enhancing sports and leisure services would be more effective. Second, guide the combined development of established and emerging commercial centers while expanding the audience. Areas with a large number of young people should retain and improve individual, “senior” high-quality commercial centers, and middle-aged and elderly areas should be renewed appropriately. Third, to improve traffic accessibility, it is especially important to strengthen convenient transportation links with the main sources of tourists. Priority should be given to improving the slow-travel network in areas close to the commercial center that provide the main sources of tourists, and expressways or rail transit stations should be added in the remaining main tourist-source areas. Fourth, the improved retail gravity model should be applied, and regular evaluations of the attractiveness of commercial centers should be conducted.
This study also puts forward three suggestions for the new round of commercial network layout planning in Wuhan and the commercial land organization at the level of territory and spatial planning: (1) In the network distribution plan, the county-level Longwangmiao (Hanzheng Street) and Hanjie commercial center should be improved. At the city-level, the China-Zhonghua commercial center should be added to the list; (2) The commercial centers of Jianghan Road, Longwang Temple (Hanzheng Street), and Wushang Plaza should be integrated to create a continuous business district in Hankou, and the commercial centers of Zhongnan Road Hongshan Plaza and Chuhe Han Street should be integrated to create a continuous business district in Wuchang. Based on the above, we can build a “2 + 4” city-level commercial center pattern within the main urban area; (3) The contiguous form of B1 land in the Hankou and Wuchang commercial area should be strengthened, and the range of B1 land at the intersection of Hong Kong Road and Jianshe Avenue should be expanded.
Research shows that Erqi and Taizihu are the two commercial centers whose attractiveness is obviously not as good as planned. Therefore, separately analyze the land structure, public service facilities and traffic condition in the areas where the two are located, and propose targeted planning recommendations based on the research conclusions. Erqi Commercial Center (No. 61): (1) First, combining the opportunities of the development and construction of Erqi Binjiang Business District, integrate the construction of commercial facilities on the east and west sides of the avenue to create a relatively continuous integrated commercial area and expand the commercial scale; (2) Secondly, the interactive probability analysis shows that the tourist of Erqi Commercial Center are mainly from Erqi Street, Xincun Street, Danhui Street, Shekou Street, Wuhu Street, and Yangluo Street in the northern marginal area. Among them, the traffic time from Yangluo Development Zone and Yangluo County to Erqi Commercial Center is much longer than others. Therefore, we should focus on improving the traffic connection between the Erqi Commercial Center and the Yangluo County as well as nearby districts, and reduce the time consumption by adding expressways and extending the subway network; (3) In order to ensure a positive competitive environment in the Erqi Commercial Center, reasonably control is needed for the development of Sanyang Road and Wuhan Tiandi.
Taizihu Commercial Center (No. 8): (1) Fully absorb the agglomeration effect of the Zhuankou Sports Center on the crowd, and combine Wanda office building, industrial park in south side, golf course in east side, university campus in north side and the surrounding commercial facilities to form an attractive growth pole integrating teaching and research, business office, sports and leisure, and scenic sightseeing, driving the development of Taizihu commercial center; (2) Traffic accessibility with the residential clusters on the east side of Xinmin River should be improved, and bridges across the river should be built to divert vistors on the east side. At the same time, the connection between the underground space of Wanda Plaza and the subway station of the sports center should be strengthened.Moreover, bus lines and subway lines should be added to enhance the traffic connection with the southern districts of Wuhan (such as Caidian County, Hannan County, Shamao County).
Based on the age differentiation rule of the mechanism, the shortcomings of the six commercial centers that did not meet the planning expectations were identified (Table 7), and construction environment guidelines are put forward: (1) The Hanxi Commercial Center should first encrypt domestic services and medical care facilities; (2) The Lingjiao Lake Commercial Center should first improve shopping service facilities and then improve medical and health care service levels; (3) The Jianer Road Commercial Center should prioritize strengthening traffic connections with Wuhan Iron and Steel; (4) The Nanhu Commercial Center should prioritize solving traffic jams leading to Hongshan and Lion Rock.

Author Contributions

Conceptualization, Zhuoran Shan and Zhe Wu; methodology, Zhuoran Shan.; software, Zhuoran Shan and Zhe Wu; validation, Zhuoran Shan, Zhe Wu and Man Yuan; formal analysis, Zhuoran Shan and Zhe Wu; investigation, Zhuoran Shan and Zhe Wu; resources, Zhuoran Shan; data curation, Zhuoran Shan; writing—original draft preparation, Zhuoran Shan and Zhe Wu; writing—review and editing, Zhuoran Shan and Zhe Wu; visualization, Zhe Wu; supervision, Zhuoran Shan; project administration, Zhuoran Shan; funding acquisition, Zhuoran Shan. All authors have read and agreed to the published version of the manuscript.

Funding

This research was funded by the Fundamental Research Funds for the Central Universities, grant number 2021WKZDJC015; National Natural Science Foundation of China, grant number 51708233; Hubei Provincial Social Science Foundation, grant number 2018207; Huazhong University of Science and Technology Special Funds for Development of Humanities and Social Sciences.

Institutional Review Board Statement

Not applicable.

Informed Consent Statement

Not applicable.

Data Availability Statement

All open source data in this article are from: https://lbs.amap.com/, accessed on 19 July 2021.

Conflicts of Interest

The authors declare no conflict of interest.

References

  1. Ren, X.H. Understanding Urban Spatial Structure of Shanghai Central City Based on Mobile Phone Data. China City Plan. Rev. 2016, 24, 26–28. [Google Scholar]
  2. Zhang, X.C.; Shan, Z.R.; Xu, S.C.; Hong, S.J. Connotation·Model·Value: The Review, Comparison and Expectation on Urban Governance Research in Western Counties and China. Urban Dev. Stud. 2016, 23, 2. [Google Scholar]
  3. Berry, B.J.L. Market Centers and Retail Location: Theory and Applications; Prentice Hall: Hoboken, NJ, USA, 1988. [Google Scholar]
  4. Liu, X.Y. Circulate Economy; Capital University of Economics and Business Press: Beijing, China, 2008. [Google Scholar]
  5. Feng, X.; Lu, R.Y.; Liu, D.W. The Analysis of Attraction of Retailing Bussiness Circle. Commer. Res. 2004, 24, 117–120. [Google Scholar]
  6. Dolega, L.; Pavlis, M.; Singletton, A. Estimating Attractiveness, Hierarchy, and Catchment Area Extents for a National Set of Retail Centre Agglomerations. J. Retail. Consum. Serv. 2016, 28, 78–90. [Google Scholar] [CrossRef] [Green Version]
  7. Shan, Z.R.; Lin, H.; Yuan, M.; Huang, Y.P. Empirical Study on the Effect of Offline Shopping and Entertainment Travel Restriction in Wuhan During the Epidemic Period. Econ. Geogr. 2020, 40, 96–102. [Google Scholar]
  8. Zhang, J. Research on Optimization of Commercial Service Facilities Space Layout from the Perspective of Spatialtemporal Behavior; Tongji University Press: Shanghai, China, 2018. [Google Scholar]
  9. Cheng, Z.C.; Hou, L. Exploring Effctive Mode of Planning Control and Guidance: New Paradigm of Urban Commercial Network Planning. Urban Plan. 2011, 35, 26–29. [Google Scholar]
  10. Converse, P.D. New Laws of Retail Gravitation. J. Mark. 1950, 14, 379–384. [Google Scholar] [CrossRef]
  11. Xue, L.; Yang, K.Z. Spatial Planning of Commercial Allocation in Haidian District in Beijing Based on Spatial Interactive Model. Geogr. Res. 2005, 24, 265–273. [Google Scholar]
  12. Birkin, M.; Clarke, R. Refining and Operationalizing Entropy-Maximizing Models for Business Applications. Geogr. Anal. 2010, 42, 422–445. [Google Scholar] [CrossRef]
  13. Phiri, P.A. Calculation of the Equilibrium Configuration of Shopping Facility Sizes. Environ. Plan. A 1980, 12, 983–1000. [Google Scholar] [CrossRef]
  14. Sevtsuk, A.; Kalvo, R. Patronage of Urban Commercial Clusters: A Network-based Extension of the Huff Model for Balancing Location and Size. Environ. Plan. B Urban Anal. City Sci. 2017, 45, 508–528. [Google Scholar] [CrossRef] [Green Version]
  15. Reilly, W.J. Method for the Study of Retail Relationships; University of Texas: Austin, TX, USA, 1929. [Google Scholar]
  16. Huff, D.L. A Probabilistic Analysis of Shopping Center Trade Centers. Land Econ. 1963, 39, 81–90. [Google Scholar] [CrossRef]
  17. Harris, B.; Wilson, A.G. Equilibrium Values and Dynamics of Attractiveness Terms in Production-Constrained Spatial-Interaction Models. Environ. Plan. A 1978, 10, 371–388. [Google Scholar] [CrossRef]
  18. Wilson, A.G. Boltzmann, Lotka and Volterra and Spatial Structural Evolution: An Integrated Methodology for Some Dynamical Systems. J. R. Soc. Interface 2008, 5, 865–871. [Google Scholar] [CrossRef] [PubMed]
  19. Dearden, J.; Wilson, A.G. A Framework for Exploring Urban Retail Discontinuities. Geogr. Anal. 2011, 43, 172–187. [Google Scholar] [CrossRef]
  20. Piovani, D.; Molinero, C.; Wilson, A.G. Urban Retail Location: Insights from Percolation Theory and Spatial Interaction Modeling. PLoS ONE 2017, 12, e0185787. [Google Scholar] [CrossRef] [PubMed] [Green Version]
  21. Wilson, A.G. A Statistical Theory of Spatial Distribution Models. Transp. Res. 1967, 1, 253–269. [Google Scholar] [CrossRef]
  22. Christaller, W. Central Places in Southern Germany; Prentice Hall: London, UK, 1966. [Google Scholar]
  23. Schlaich, T.; Horn, A.L.; Fuhrmann, M. A Gravity-Based Food Flow Model to Identify the Source of Foodborne Disease Outbreaks. Int. J. Environ. Res. Public Health 2020, 17, 444. [Google Scholar] [CrossRef] [Green Version]
  24. Zhou, S.H.; Lin, G.; Yan, X.P. The Relationship Among Consumer’s Travel Behavior, Urban Commercial and Residential Spatial Structure in Gunagzhou, China. Acta Geogr. Sin. 2008, 63, 395–404. [Google Scholar]
  25. Tan, Y.T. The Research on the Evolution of Spatial Structure for Urban Retail Business; Hunan University of Science and Technology: Xiangtan, China, 2019. [Google Scholar]
  26. Wakerfield, K.L.; Baker, J. Excitement at the Mall: Determinants and Effects on Shopping Response. J. Retail. 1998, 74, 515–539. [Google Scholar] [CrossRef]
  27. Bacon, R.W. Combined Trips and the Frequency of Shopping. J. Retail. Consum. Serv. 1995, 2, 175–183. [Google Scholar] [CrossRef]
  28. Lakshmanan, J.R.; Hansen, W.G. A Retail Market Potential Model. J. Am. Plan. Assoc. 1965, 31, 134–143. [Google Scholar] [CrossRef]
  29. Wilson, A.G. The Use of the Concept of Entropy in System Modelling. J. Oper. Res. Soc. 1970, 21, 247–265. [Google Scholar] [CrossRef]
  30. Clarke, M.; Wilson, A.G. The Dynamics of Urban Spatial Structure: The Progress of a Research Programme. Trans. Inst. Br. Geogr. 1985, 10, 427–451. [Google Scholar] [CrossRef]
  31. Ellam, L.; Girolami, M.; Pavliotis, G.A. Stochastic Modelling of Urban Structure. Proc. R. Soc. A Math. Phys. Eng. Sci. 2018, 474, 2213. [Google Scholar] [CrossRef] [Green Version]
  32. Zhao, P.J.; Yu, Z.; Jia, Y.T. Shopping Travel Range and Its Determinants in Rural Towns of China. Econ. Geogr. 2019, 39, 72–81. [Google Scholar]
  33. Shan, Z.R.; Huang, Y.P.; Zhang, X.C. A Research on Spatial Evolution of Metropolitan Area in Developed Countries since 1990. Urban Plan. Forum 2014, 5, 54–64. [Google Scholar]
  34. Wang, D.; Wang, C.; Xie, D.C.; Zhong, W.J. Comparison of Retail Trade Areas of Retail Centers with Different Hierarchical Levels: A Case Study of East Nanjing Road, Wujiaochang, Anshan Road in Shanghai. Urban Plan. Forum 2015, 3, 50–60. [Google Scholar]
  35. Zhang, X.C.; Lv, B.; Xv, S.C.; Long, D.; Chen, P. Polycentric Network Governance Mechanism Research on Chang-Zhu-Tan Urban Agglomeration. Urban Dev. Stud. 2015, 22, 28–37. [Google Scholar]
  36. Lin, M.H.; Zhen, F.; Zhu, S.J. Urban Residents’ Activity Diversity and Its Influential Factors in Nanjing City. Trop. Geogr. 2017, 37, 400–408. [Google Scholar]
  37. Douard, J.P.; Michele, H.; Gerard, C. Retail Attraction Revisited: From Gravitation to Purchase Flows, A Geomarketing Application. Rech. Appl. Mark. 2015, 30, 110–129. [Google Scholar]
  38. Zhang, W.J.; Chai, Y.W. A Household-based Model of Shopping Decision-making Behavior in Timing and Destination Choice: Formulation and Application to Spatial Policy Evaluation. Geogr. Res. 2010, 29, 338–350. [Google Scholar]
  39. Huang, J.Z.; Wu, M. An Investigation and Analysis of Travel Characteristics and Related Factors of the Elderly Population in Megacities—The Case of the Central Area in Shanghai. Urban Plan. Forum 2015, 2, 93–101. [Google Scholar]
  40. Fu, C.H.; Zhou, S.H.; Yan, X.P.; Liu, L.; Chen, W.S. Spatio-temporal Characteristics and Influencing Factors of Consumer Behavior in Retailing Centers: A Case Study of Guangzhou in Guangdong Province. Acta Geogr. Sin. 2017, 72, 603–617. [Google Scholar]
  41. Feng, J.X.; Yang, Z.S. Factors Influencing Travel Behavior of Urban Elderly People in Nanjing. Prog. Geogr. 2015, 34, 1598–1608. [Google Scholar]
  42. Zhang, M.J.; Zhang, E.J.; Shan, Z.R. Research on the Identification of Multiple Types of Commercial Center and Spatial Patterns in Wuhan Based on POI Data. South Archit. 2019, 2, 55–61. [Google Scholar]
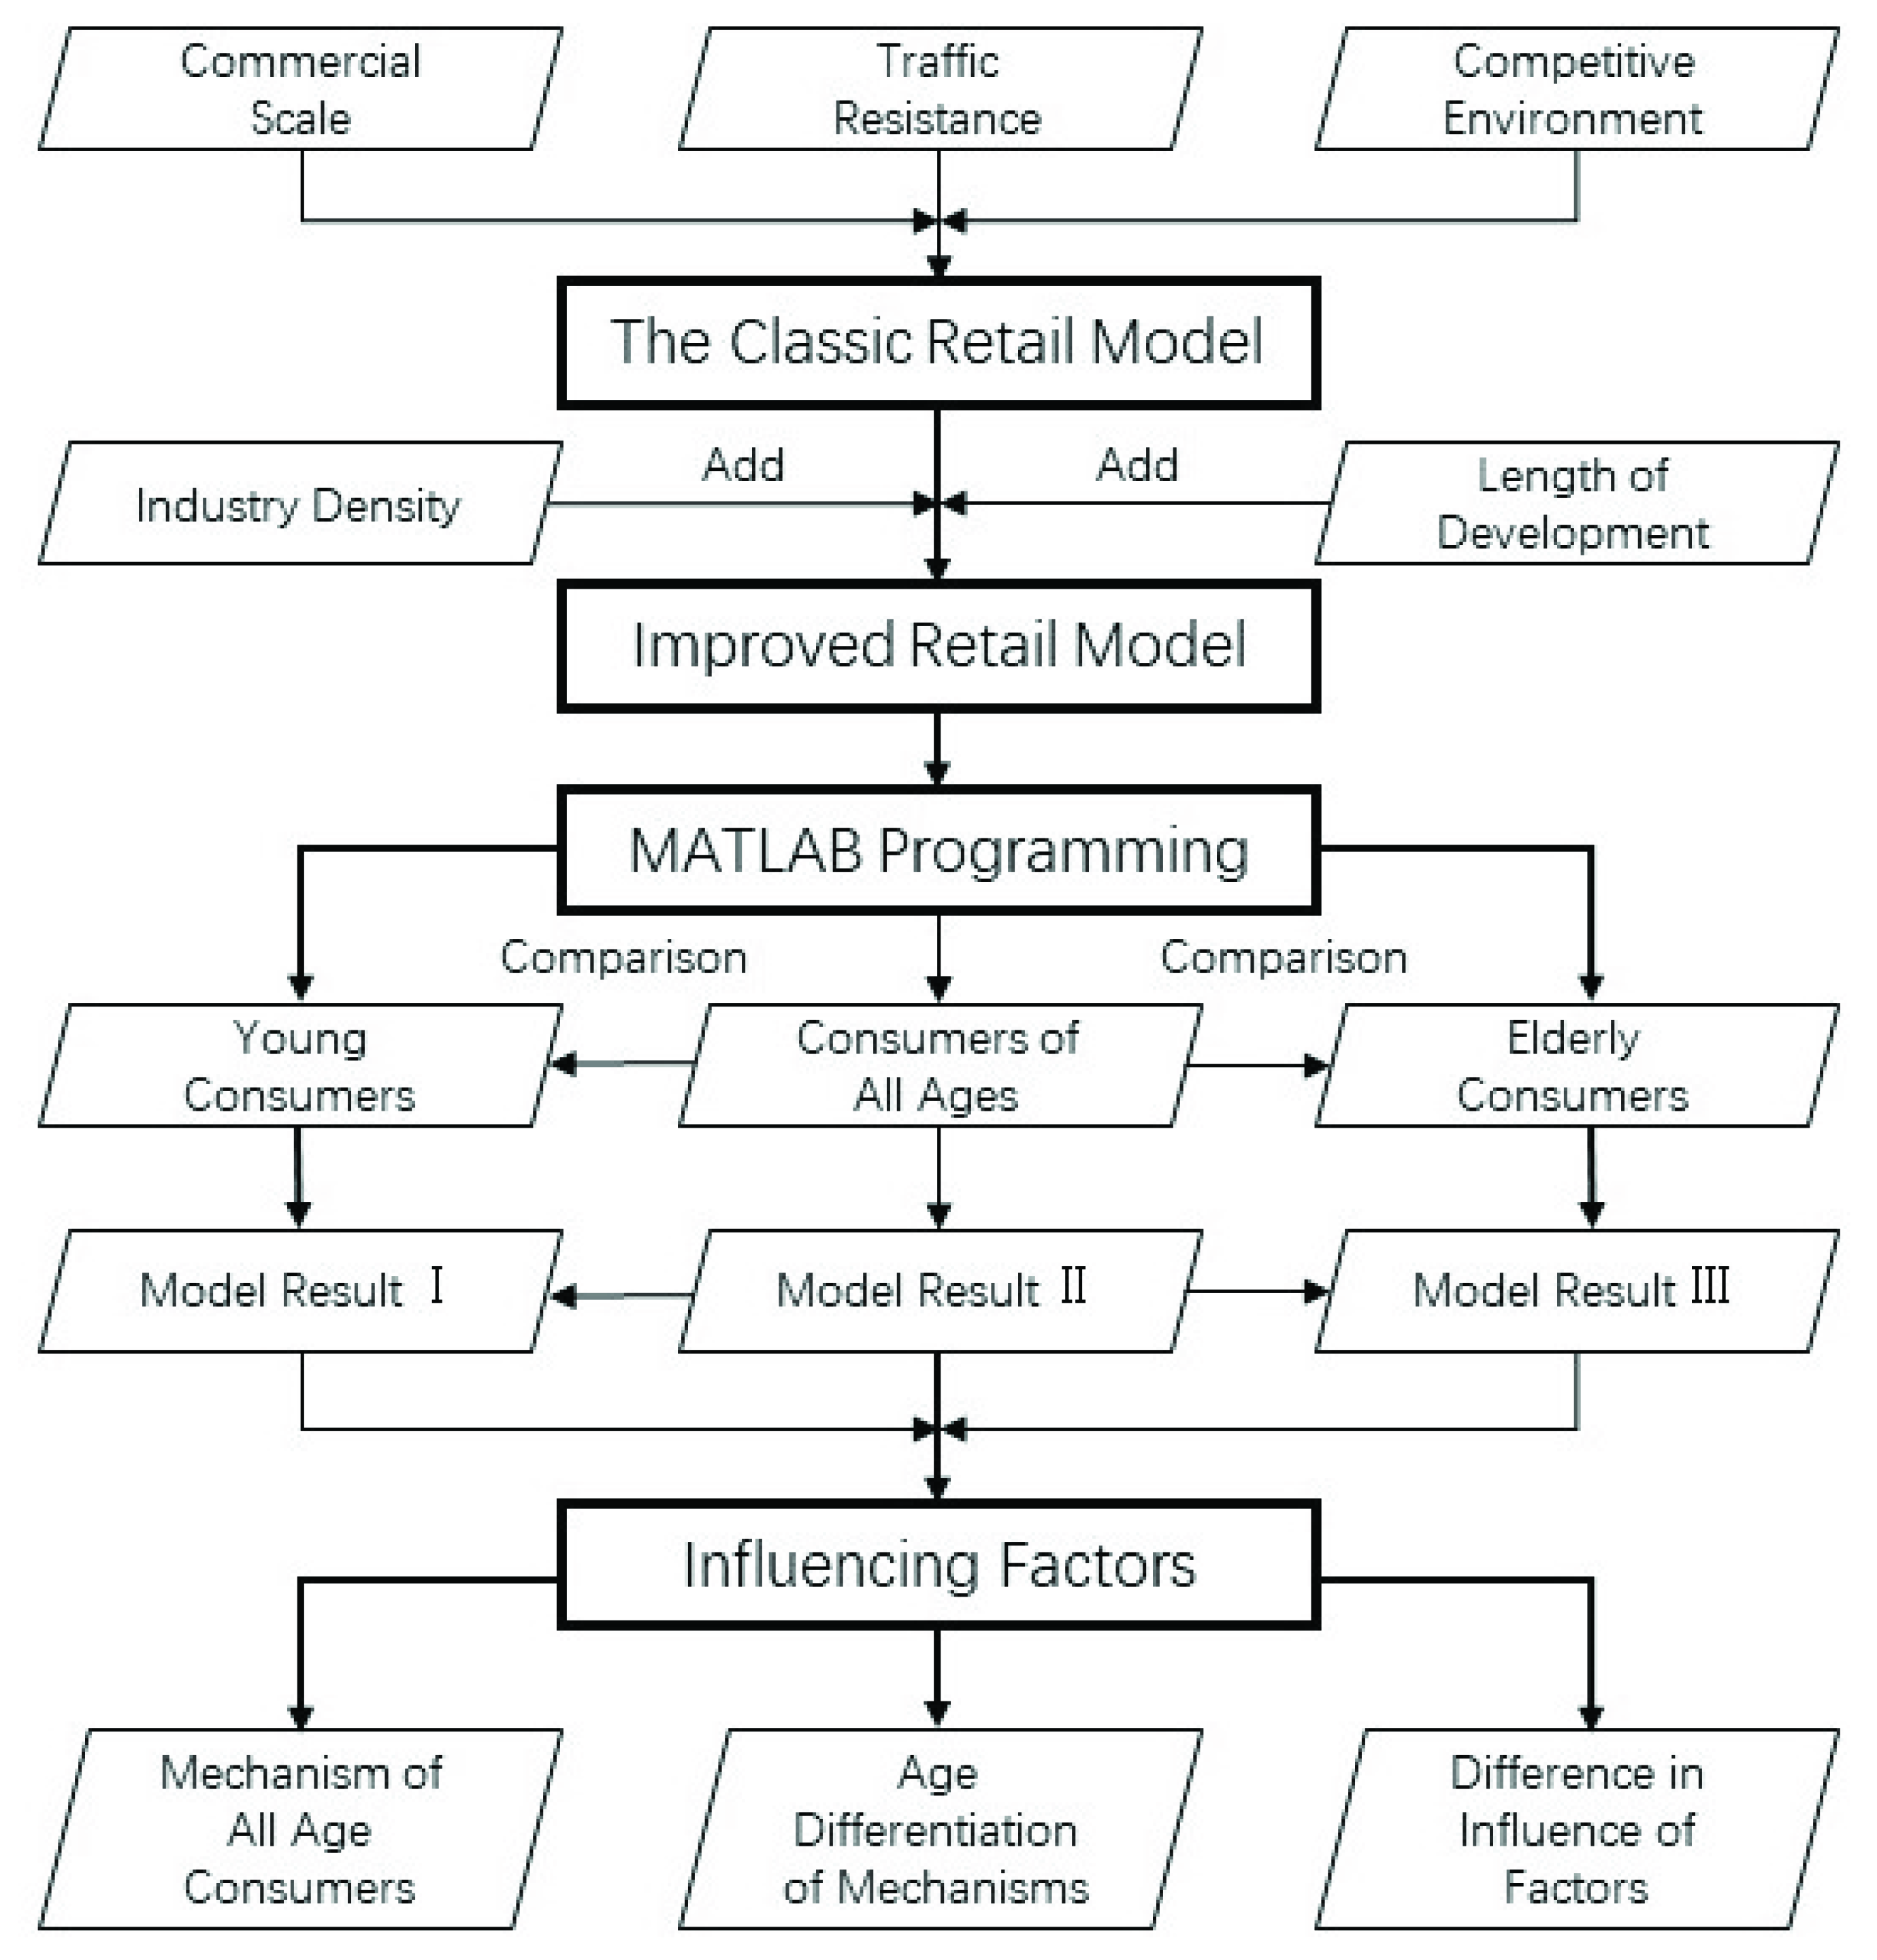
Figure 1. Analysis framework.
Ijgi 10 00652 g001
Figure 2. Spatial distribution of 66 commercial centers.
Ijgi 10 00652 g002
Figure 3. Spatial distribution of 108 sample blocks.
Ijgi 10 00652 g003
Figure 4. Commercial and Retail POI data of Wuhan.
Ijgi 10 00652 g004
Figure 5. Value of attractiveness of 66 commercial centers.
Ijgi 10 00652 g005
Figure 6. Spatial interaction network among commercial centers and blocks.
Ijgi 10 00652 g006
Figure 7. Line chart about the relationship between attractiveness and various variables.
Ijgi 10 00652 g007
Table 1. Data of 66 defined commercial centers.
NumLevelNameConditionsIndustry Density
Commercial FloorspaceLength of DevelopmentTotalCatering ServicesShopping ServicesDaily ServicesSports LeisureMedical CaringAccommodation Service
Density
1County-levelOptics Valley World92,604.38210113.3905.9390.3244.6431.7280.3240.432
2Community-levelShuguang Commercial Center (Minzu Avenue)10,107.23611218.5984.2923.5770.7158.5840.7150.715
3Xianglong Times Square133,832.96514112.8507.5460.2992.3161.3450.0751.270
4County-levelK11 Select113,310.850365.9183.3480.2341.0121.246--0.078
5Community-levelHung Fu Tim Mei Plaza5907.2421169.0284.5143.3861.129------
6Parkway Well Fashion Shopping (Xiongchu Avenue)30,427.8026819.7969.3770.7814.6893.6470.5210.781
7County-levelAeon Mall182,814.963456.1814.2120.4380.4380.9850.109--
8Taizihu Commercial Center87,684.6179715.1309.8080.3043.6490.9120.456--
9Nanhu Commercial Center104,976.59110218.0458.9080.6854.6443.0460.3810.228
10Community-levelPop Window Shopping Plaza (Zhuobao Store)13,011.72515617.4203.0741.5379.7352.0490.5120.512
11Happy Meeting Plaza, 18 Shucheng Road17,328.332486.9252.8850.577--3.463----
12Zhongbai Store (Optics Valley Shopping Plaza)6264.8021517.9814.7891.5961.596------
13Vientiane Plaza (luoshi road auxiliary road)12,206.9509123.65013.0480.8168.1550.8160.816--
14Zhuodaoquan Plaza7009.2659319.5736.5241.0872.1756.524--3.262
15City-levelOptics Valley382,600.63122516.3717.8460.3984.6842.4830.3280.586
16Community-levelNanhu Metropolis31,325.7561538.3004.1500.6381.5961.2770.638--
17Huquan Shopping Plaza16,144.41510554.50832.2092.4789.2919.2910.6190.619
18Leduhui (Shipailing Road)13,789.5004425.61718.2981.2201.8304.270----
19Bandung Plaza (Baishazhou Avenue)61,558.7483311.0466.4980.6500.8122.1120.4870.487
20Longling·818 Square5891.5843335.64420.3685.0921.6975.0921.6971.697
21Ruijing Plaza16,713.1879210.7705.3851.197--4.188----
22Baihui Life Plaza9380.3033721.32110.6612.1322.1325.686--0.711
23Golden Bridge·Moore Street4276.23411417.1493.1183.1189.3541.559----
24County-levelJiedaokou130,896.08117627.10111.1590.9428.1884.7830.8701.014
25Community-levelHaida Plaza13,562.8439312.7804.9150.9831.9664.4240.492--
26Zhongshang Shopping Plaza7035.27923725.58512.7932.8432.8437.107----
27Fanyuehui (Shouyi Store)23,403.8141298.0814.253--0.4252.9770.425--
28Shimao 5238,349.158448.7443.9970.7490.7492.4980.5000.250
29City-levelHongshan Square, Zhongnan Road213,151.91226414.3835.6060.6433.8602.5270.4601.287
30County-levelJiefang Road Simenkou142,276.7449415.2257.6120.3282.7561.8370.3282.362
31Community-levelChutian Fashion Plaza27,000.64221817.7665.5520.7407.0324.0710.370--
32County-levelShuiguo Lake Walking Street21,871.88421917.6696.3430.4536.3433.6240.906--
33Zhongjiacun96,259.74613016.8856.9320.8894.7102.8440.7110.800
34Community-levelFan Yue Hui22,988.723368.5935.3340.5931.1851.482----
35County-levelChu River Han Street263,236.6927215.2228.9230.4552.9041.8900.1400.770
36City-levelWangjiawan298,327.71331817.7598.6270.4744.5063.3800.2080.563
37Community-levelCapitaLand Plaza (Wusheng Store)29,206.6748422.25514.7231.0272.3974.109----
38Starway Victoria Harbour Shopping Centre46,323.166488.2553.3410.3933.3411.179----
39County-levelLongwang Temple (Hanzheng Street)307,449.6371952.9801.0550.5900.4040.3720.1240.435
40Community-levelTimes Tianjiao Commercial Center8582.63714011.651--1.1653.4952.3303.4951.165
41City-levelWushang Plaza270,669.65727612.9584.5320.6734.2481.7351.2750.496
42Community-levelWest Park28,090.6109615.1949.7140.4981.2453.487--0.249
43County-levelHanxi Commercial Center104,817.5221298.4473.8330.7822.1901.4080.235--
44City-levelJianghan Road952,847.23126015.8598.0970.4513.9381.6710.3941.287
45Xu Dong3,032,85.21614011.1155.7210.4773.0101.6090.2090.089
46County-levelNew World Department Store (Guomao Store)17,069.93931018.4999.2491.7342.3124.0470.5780.578
47Community-levelTaipei Yard3692.826296.8702.290--2.2902.290----
48CapitaLand Plaza, West City195,174.110292.6131.5370.1540.3070.615----
49Sanyang Road71,527.250698.5163.5790.2472.7151.1110.3700.494
50Oceanwide City Plaza49,019.2376410.2084.8120.5831.3123.0620.1460.146
51County-levelChina·China Town66,416.992946.3642.9050.2771.3831.383--0.415
52Community-levelWater Chestnut106,056.34110516.2828.2310.2715.1562.1710.2710.090
53County-levelTiandi Yifang Shopping Center74,399.7593610.8727.3240.1141.4881.945----
54Community-levelShangdonghui Commercial Plaza15,738.4846910.8026.9890.6350.6351.2710.6350.635
55County-levelZhuyehai365,917.726533.2252.0770.2190.2460.5740.0820.027
56Orsun Century Plaza86,725.649708.8403.7670.3071.8452.5370.384--
57Community-levelTangjiadun Shopping Plaza30,304.4992574.6201.6500.6600.9900.3300.990--
58Nuvoton Vanke Plaza18,749.3584622.75611.0230.7113.9117.111----
59Hankou Forwardcity50,766.242521.6180.8090.2700.2700.270----
60Happy Chaobei Wanjia Metropolis35,641.2084914.4796.7151.0493.3583.1480.210--
61County-levelErqi Commercial Center66,555.01411214.7135.0990.7284.8073.0590.7280.291
62Aeon Mall Wuhan Golden Bridge43,727.787216.2514.7260.3050.7620.457----
63Jianer Road133,677.3745812.6706.2570.3132.4512.5030.7300.417
64Community-levelImpression City Shopping Center63,848.891222.6180.7700.4620.7700.616----
65Castle Peak Department Store41,010.29723610.6535.0950.6952.0840.9260.9260.926
66County-levelHouhu194,629.8267210.6405.0400.2553.6651.3240.2040.153
Table 2. Matrix of spatial interaction probability among blocks and commercial centers.
BlocksJiedaokouChu River Han StreetOptics ValleyJianghan RoadZhongnan RoadWangjiawanTotal
Baishazhou Street0.0264080.0459330.0202280.0546430.1151850.022616 1
Guanshan Street0.0382820.0259850.3655690.0533840.0728670.011635 1
Hanjiadun Street0.0075210.0139860.014910.1265340.0286320.084972 1
Yongfeng Street0.0090910.0190570.016140.0622750.0315020.526787 1
Zhongnan Road0.047960.0822710.0313730.0606610.4196010.015165 1
Jianghan Second Bridge0.0088750.0150420.0144404330.0666370.0302350.552497 1
Shuiguo River0.0356380.2609840.0209070440.0539080.1359280.012351 1
1
Table 3. The characteristics of variables among different levels of commercial centers.
Planning LevelAttractiveness ValueCommercial FloorspaceLength of DevelopmentTotal Industry Density
AverageMaxMinStd.DAveMaxMinStd.DAveMaxMinStd.DAveMaxMinStd.D
City-level0.5970.9820.3210.231403,480952,847213,151250,732247318140551417112.216
County-level0.1200.3760.0160.104128,443365,91717,06988,0371053102168122725.866
Community-level0.0250.2370.0000.04233,878195,174369237,869952572261145419.734
Table 4. Modeling results for consumers of all ages.
Explanatory VariablesInfluence LevelModel EstimationObserved Value vs.
Calculated Value
Correlation CoefficientT-StatR2ReliabilityCorrelation CoefficientSET-Stat
TAD_Time −0.03124723−841.8364390.6380.02780.96460.008601112.16
CC_Age 0.00027634416.6397536
Shop_POI_Den 0.12439825232.79476398
DaiSer_POI_Den 0.01370740114.83760288
Med_POI_Den 0.10902947525.50235825
Acc_POI_Den −0.035435085−49.5415711
SpoLei_POI_Den 0.09848289471.69963251
Table 5. Optimal model results for consumers under 40.
Explanatory VariablesR2Observed Value vs.
Calculated Value
Correlation CoefficientT-StatSE
TAD_Time0.787y = 0.9477x + 0.00079−0.024763−536.650.0000461
CC_Age0.0005134620.0120.0000257
Shop_POI_Den0.2754863.3670.0043474
Med_POI_Den0.05248110.0370.0052288
DaiSer_POI_Den0.04351434.0270.0012788
SpoLei_POI_Den0.0312517.2110.0018157
Acc_POI_Den−0.0096947−2.60690.0037189
Table 6. Optimal model results for consumers over 40.
Explanatory VariablesR2Observed Value vs.
Calculated Value
Correlation CoefficientT-StatSE
TAD_Time0.662y = 0.91798x + 0.00124−0.039966−695.980.0000574
CC_Age−0.00013044−6.16710.0000212
Shop_POI_Den0.0450256.73630.0066839
Med_POI_Den0.06273912.2520.0051206
DaiSer_POI_Den0.01809414.1450.0012793
SpoLei_POI_Den0.1410474.2940.0018983
Acc_POI_Den−0.19844−51.5120.0038523
Table 7. Weak points of commercial centers that not up to the expectation.
NameMain Source of Customers and Their Average Age (Years)Construction Weakness
Commercial ScaleTraffic AccessibilityDomestic ServicesSports LeisureMedical CareShopping Service
Hanxi Commercial CenterZongguan Street (45) ●●●●●●●●
Hanjiadun Street (43)
Water chestnut commercial centerTangjiadun Street (44) ●●●●●
Changqing (40)
North Lake Street (46)
Jianer Road Commercial CenterHongwei Road (45) ●●●●●
Ganghua Street (46)
Wuhan Iron and Steel Plant (47)
Nanhu Commercial CenterNanhu Street (39) ●●
Hongshan Street (32)
Lion Rock Street (32)
Taizihu Road Commercial CenterZhuankou Street (37)●●●●● ●●●
Daji Street (42)
Junshan Street (36)
Caidian Changfu Street (44)
Erqi Commercial CenterErqi Street (43)●●●●●
Notes: We use ●/●●/●●● to indicate the degree of weakness.
Publisher’s Note: MDPI stays neutral with regard to jurisdictional claims in published maps and institutional affiliations.