
GIS Mapping Evaluation of Stroke Service Areas in Bangkok Using Emergency Medical Services

 ,
,
Abstract
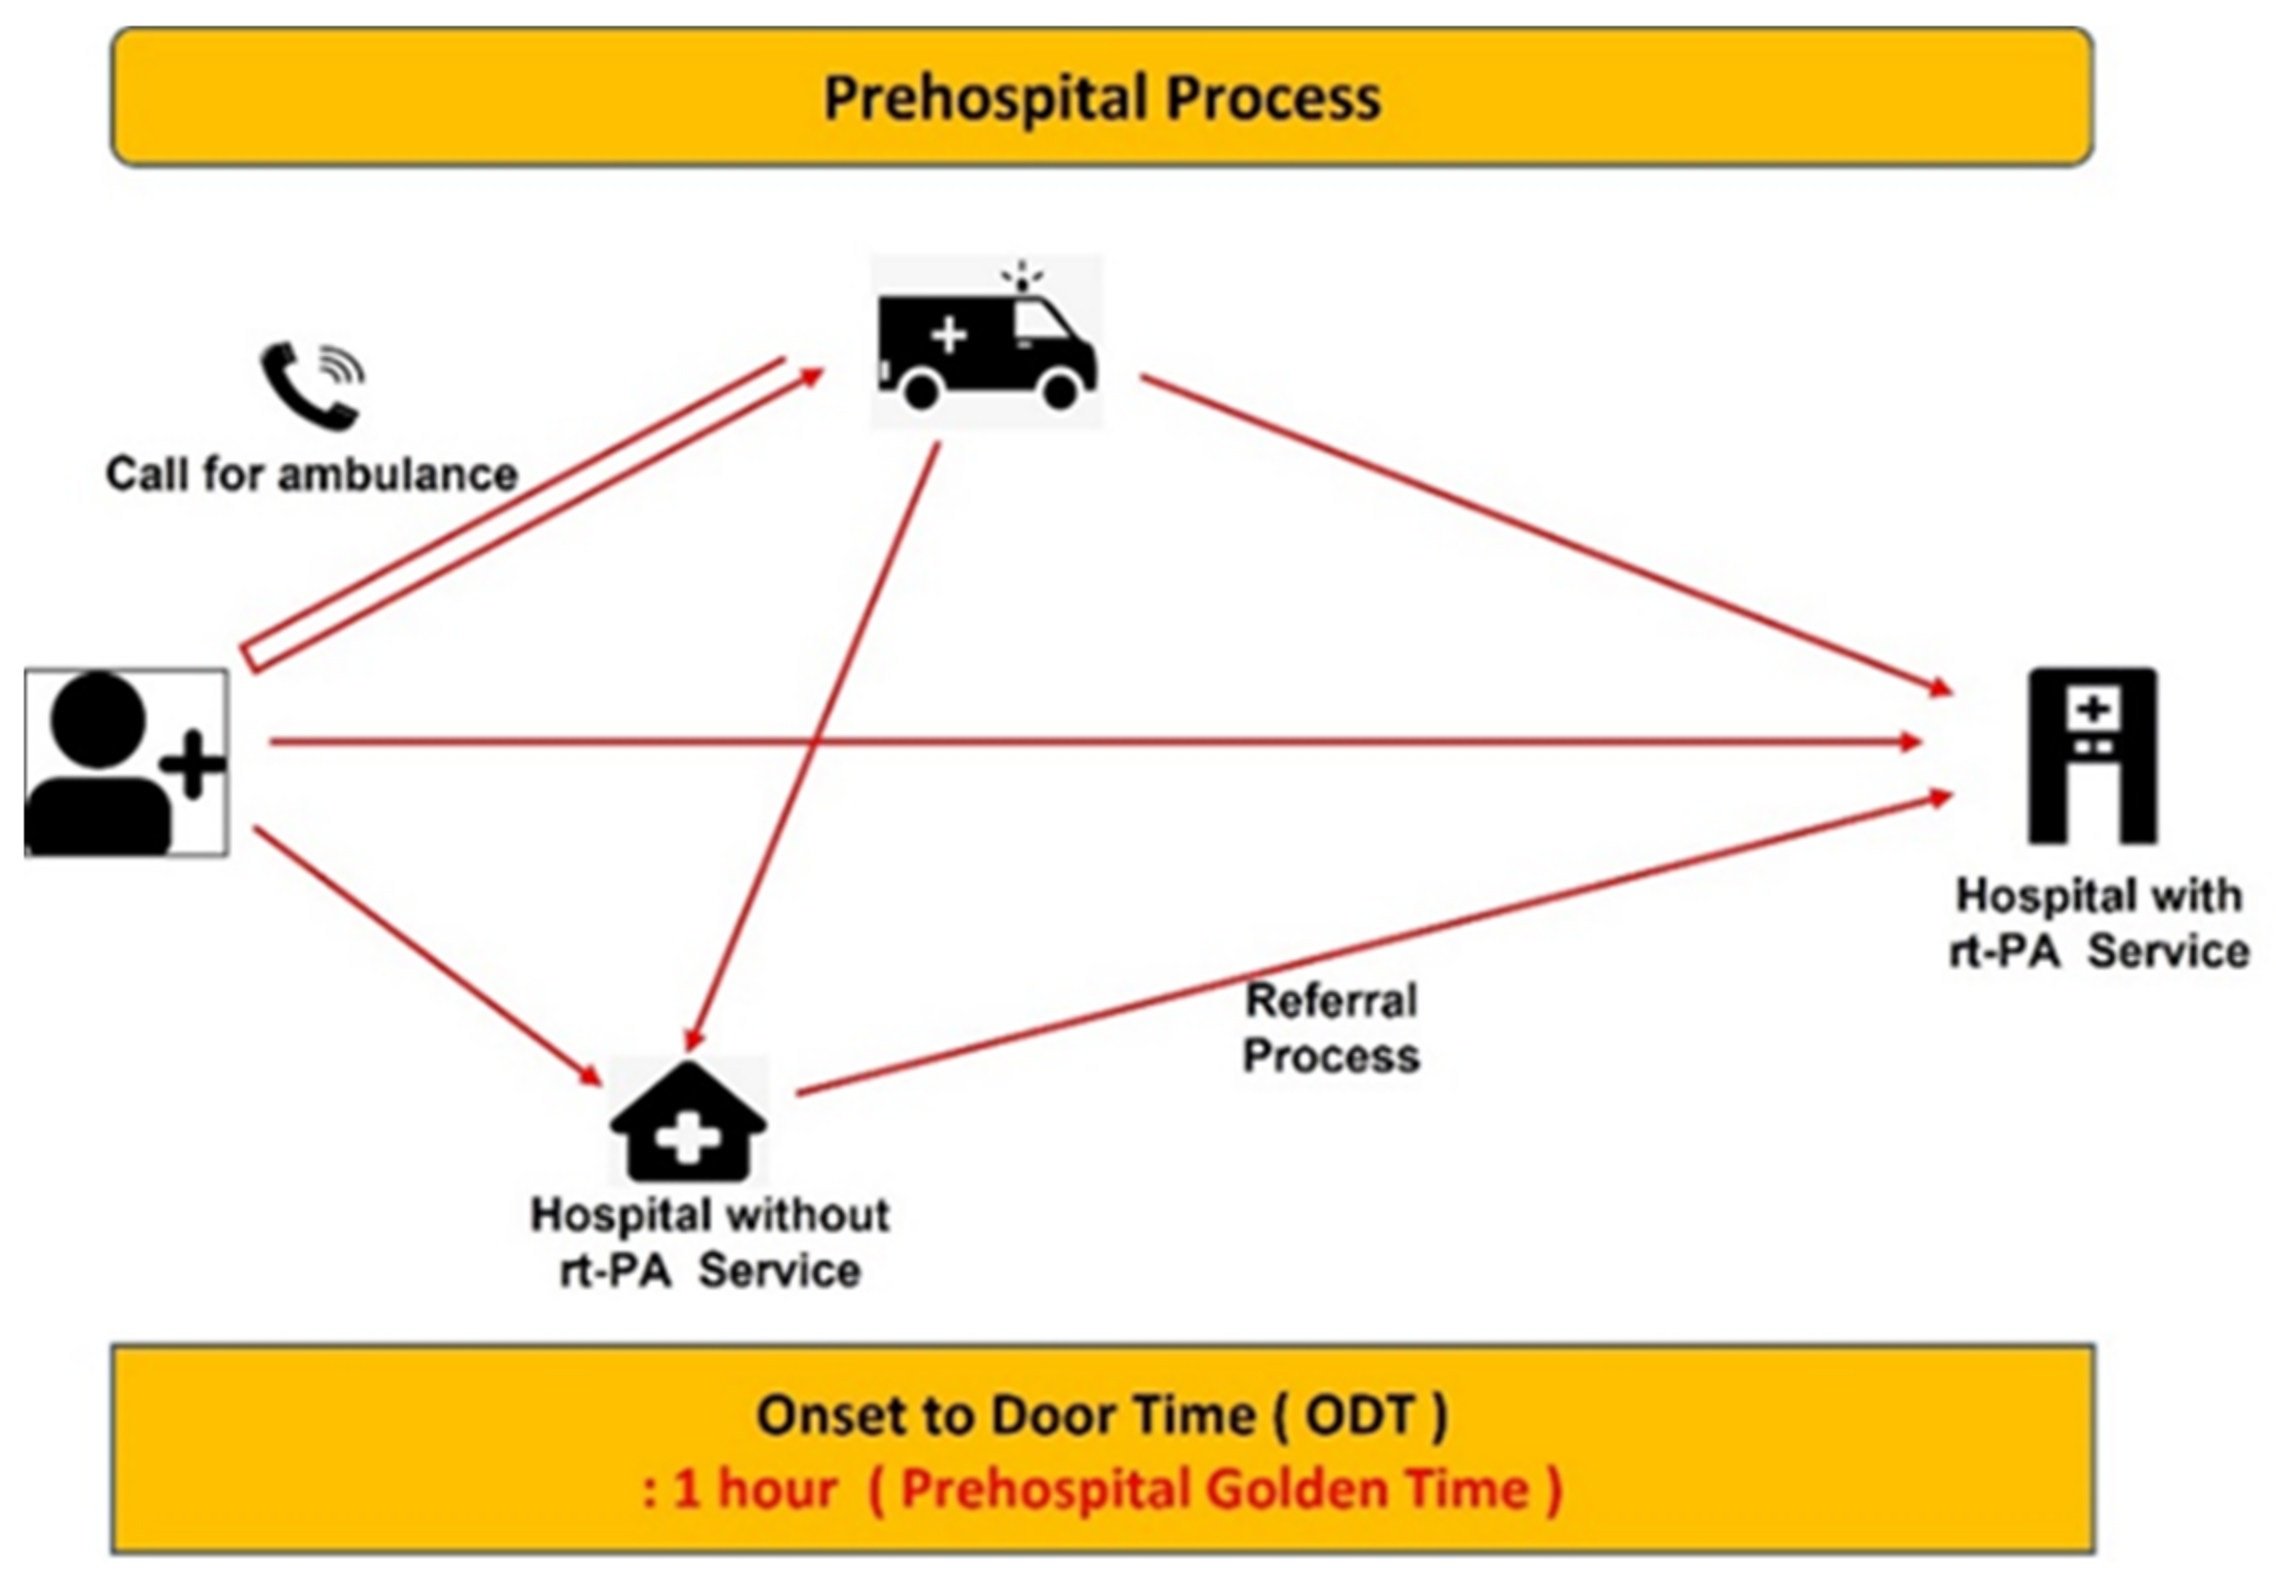
:1. Introduction
2. Data and Methodology
2.1. Study Area
2.2. Data Preparation
2.2.1. Data and Sources of Data
2.2.2. Data Preparation
2.3. Analysis Techniques
3. Results
3.1. GIS Mapping of Stroke Service Areas in Bangkok
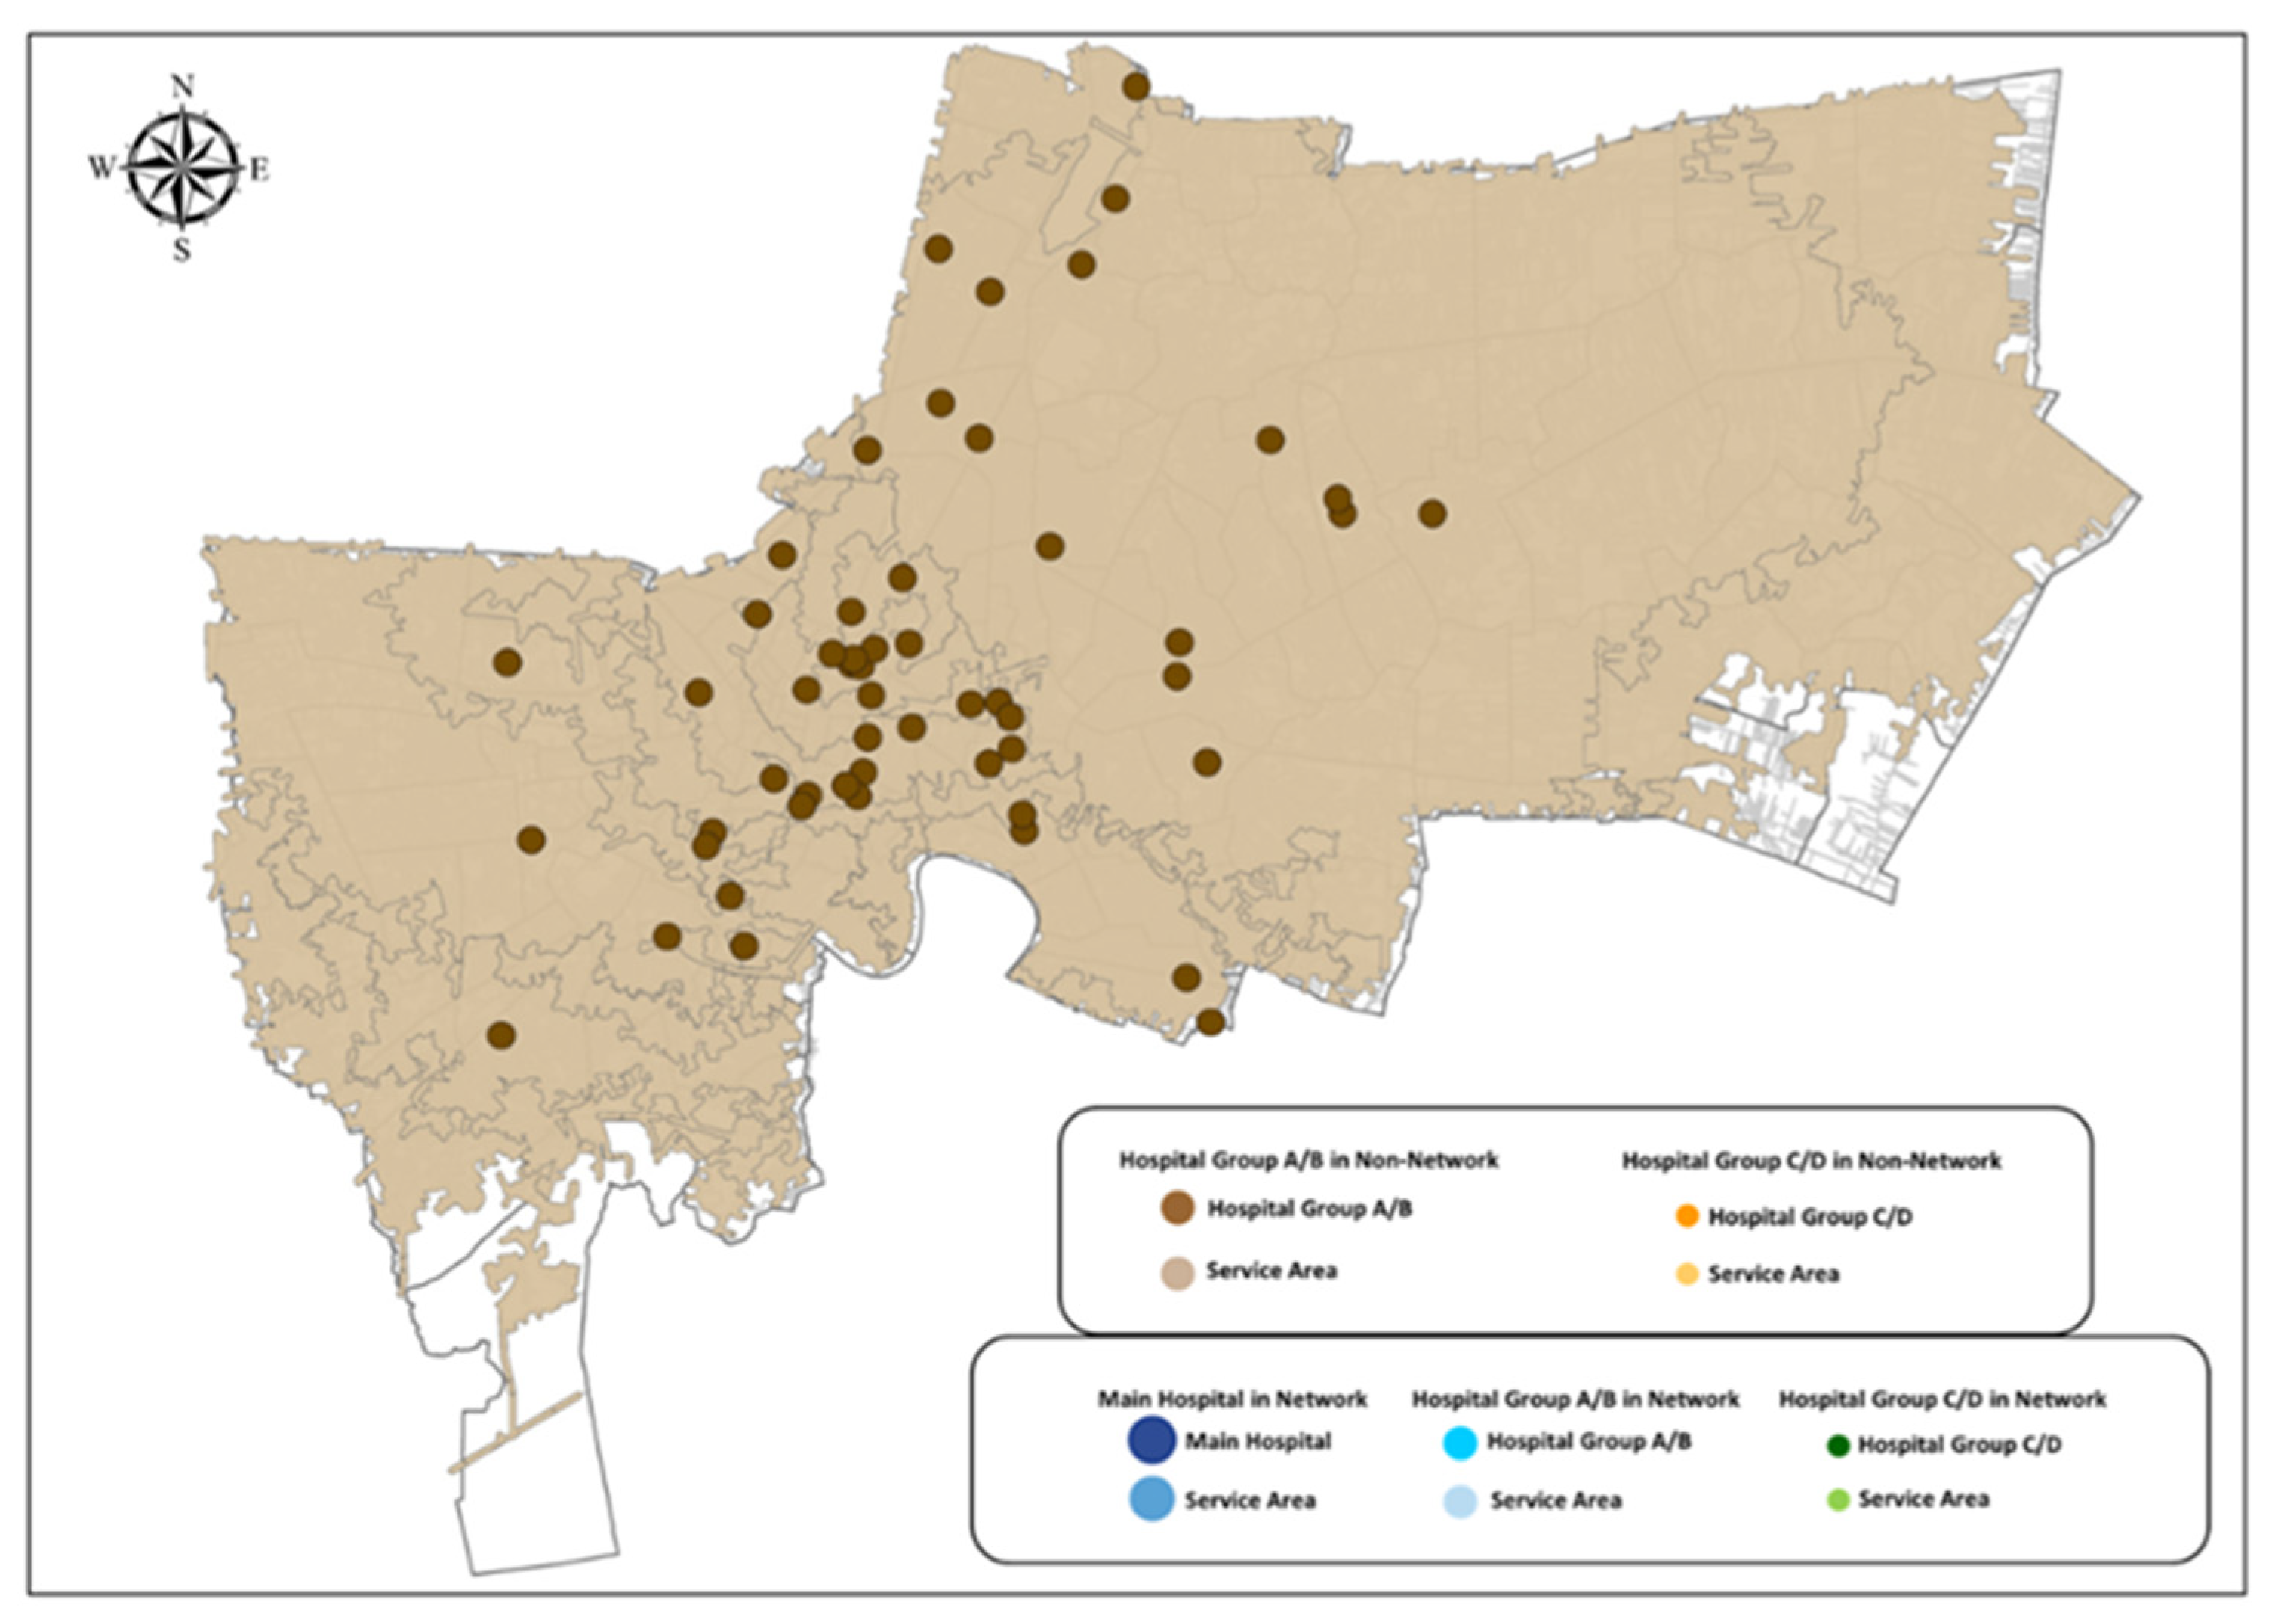
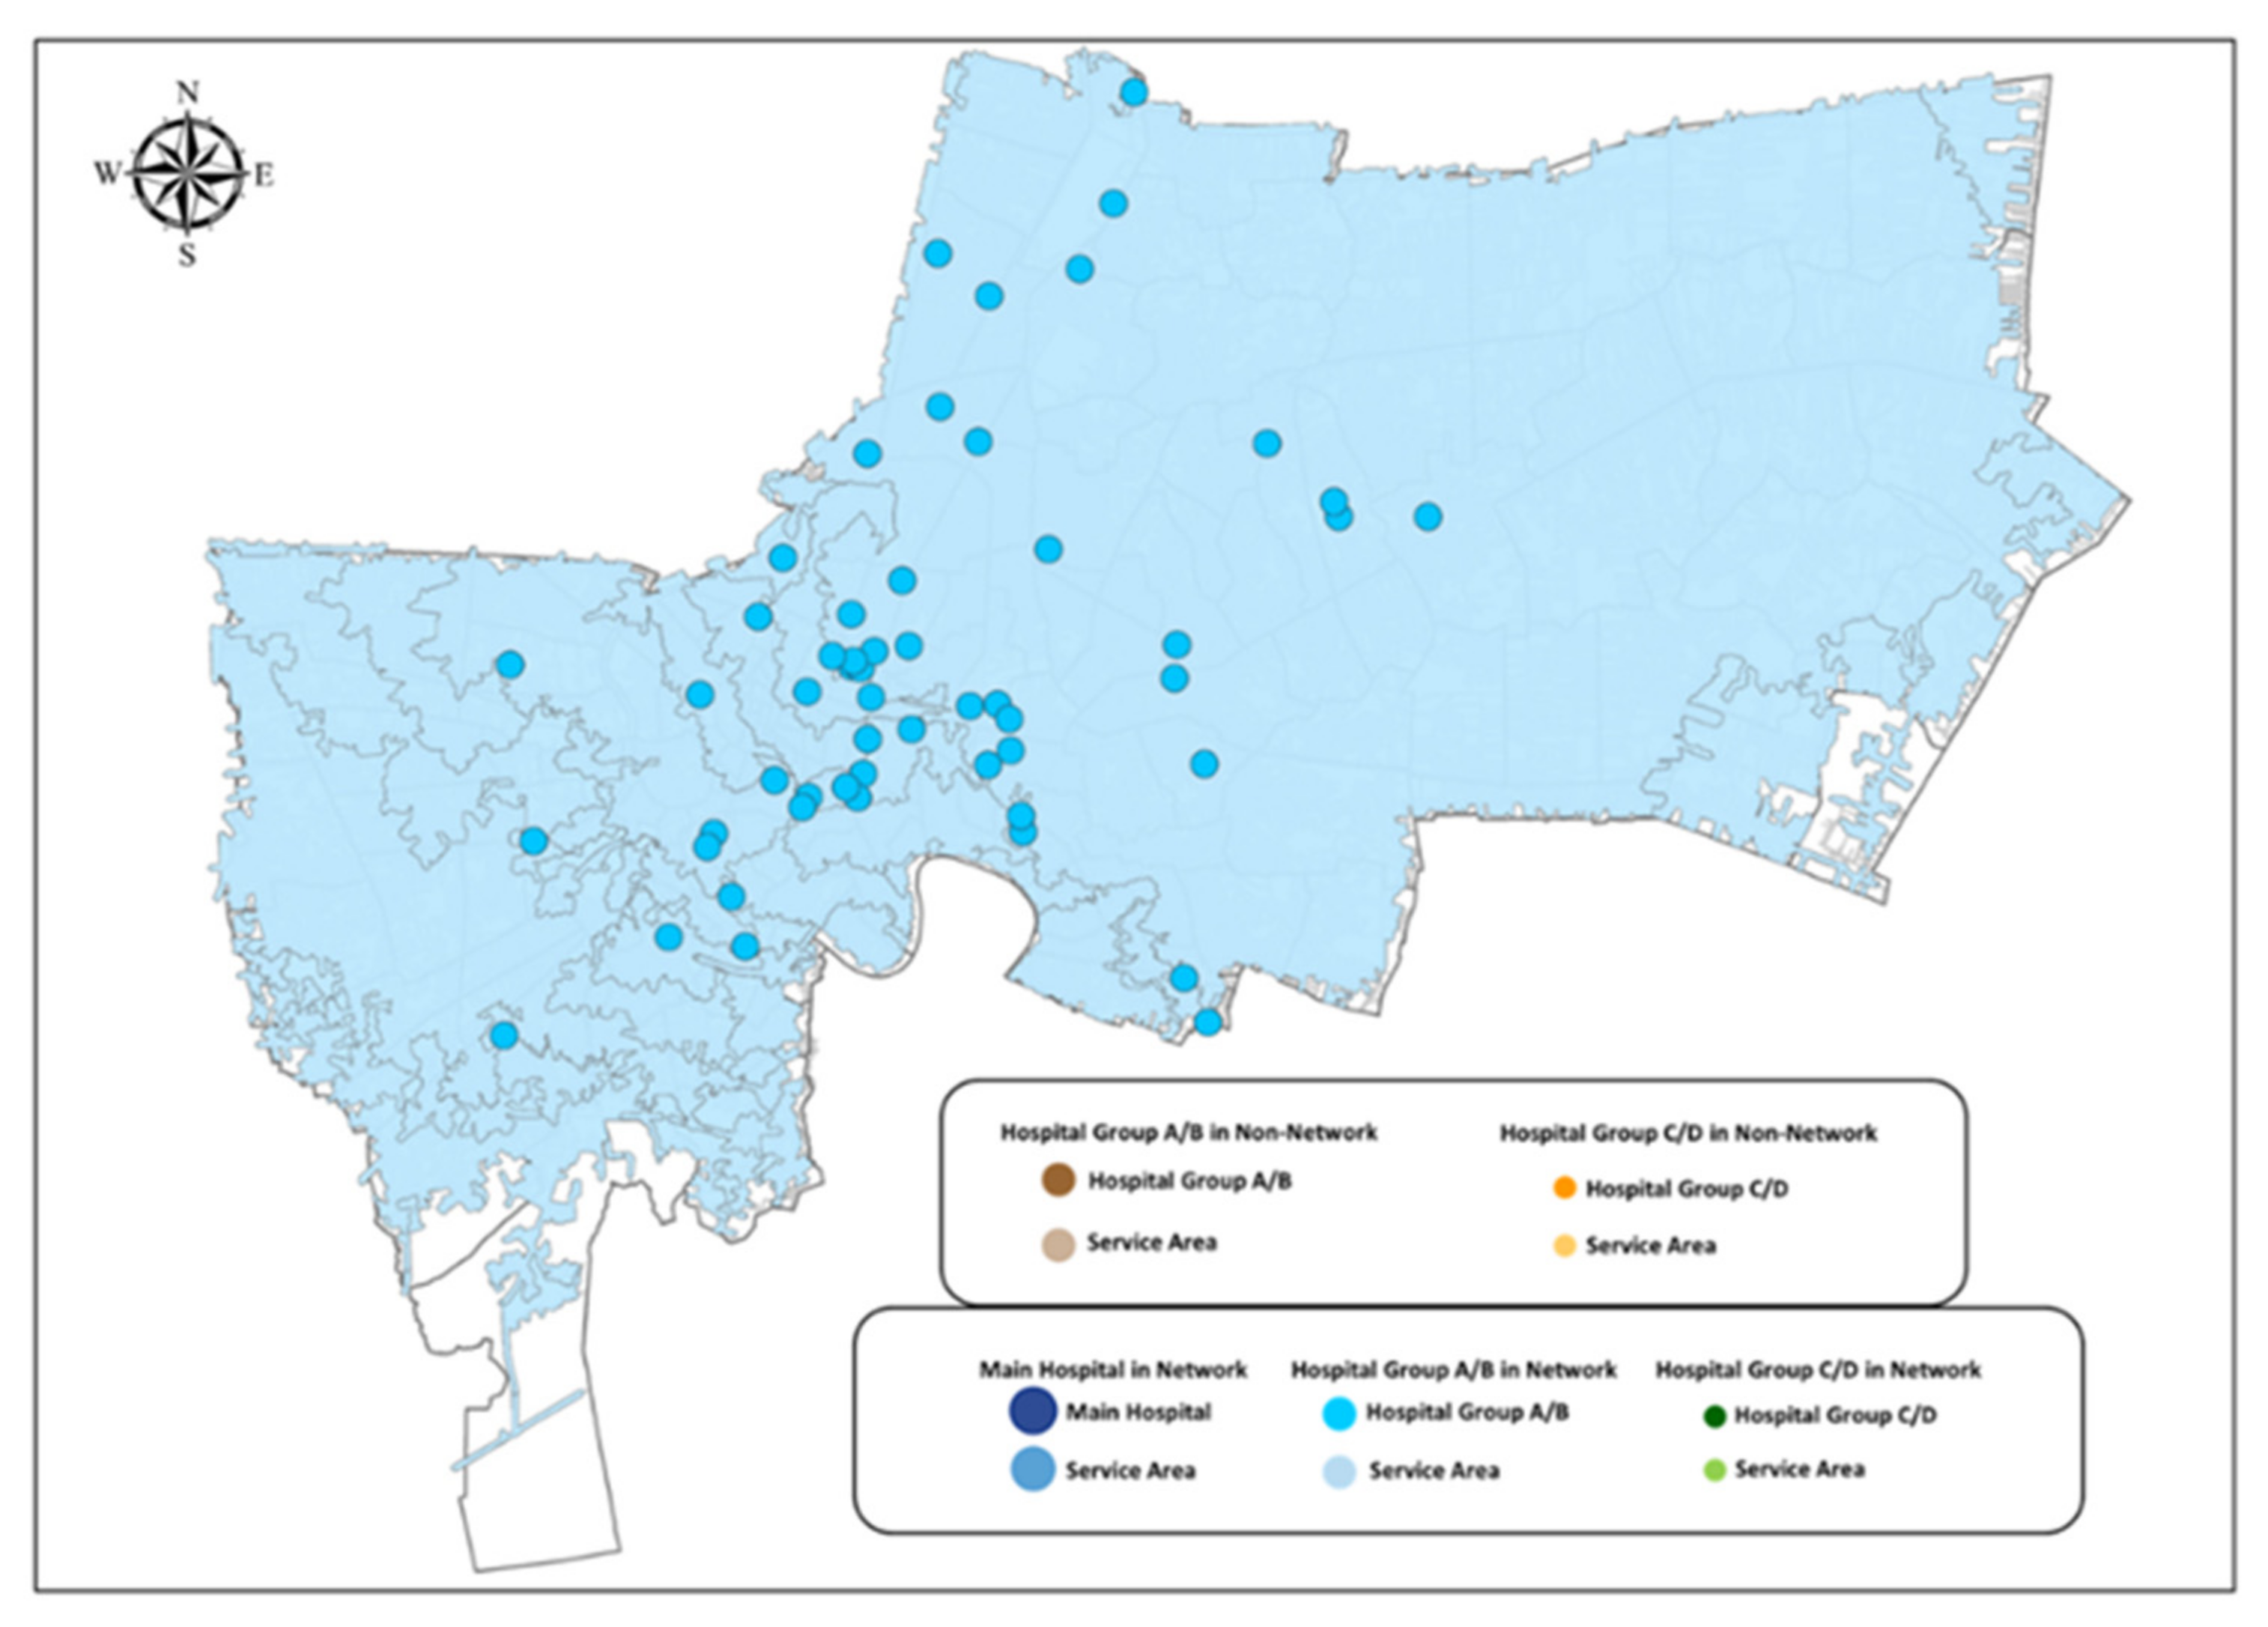
3.1.1. EMS Service to Hospitals without Stroke Networks
Stroke Service Area of Hospitals in Group A/B
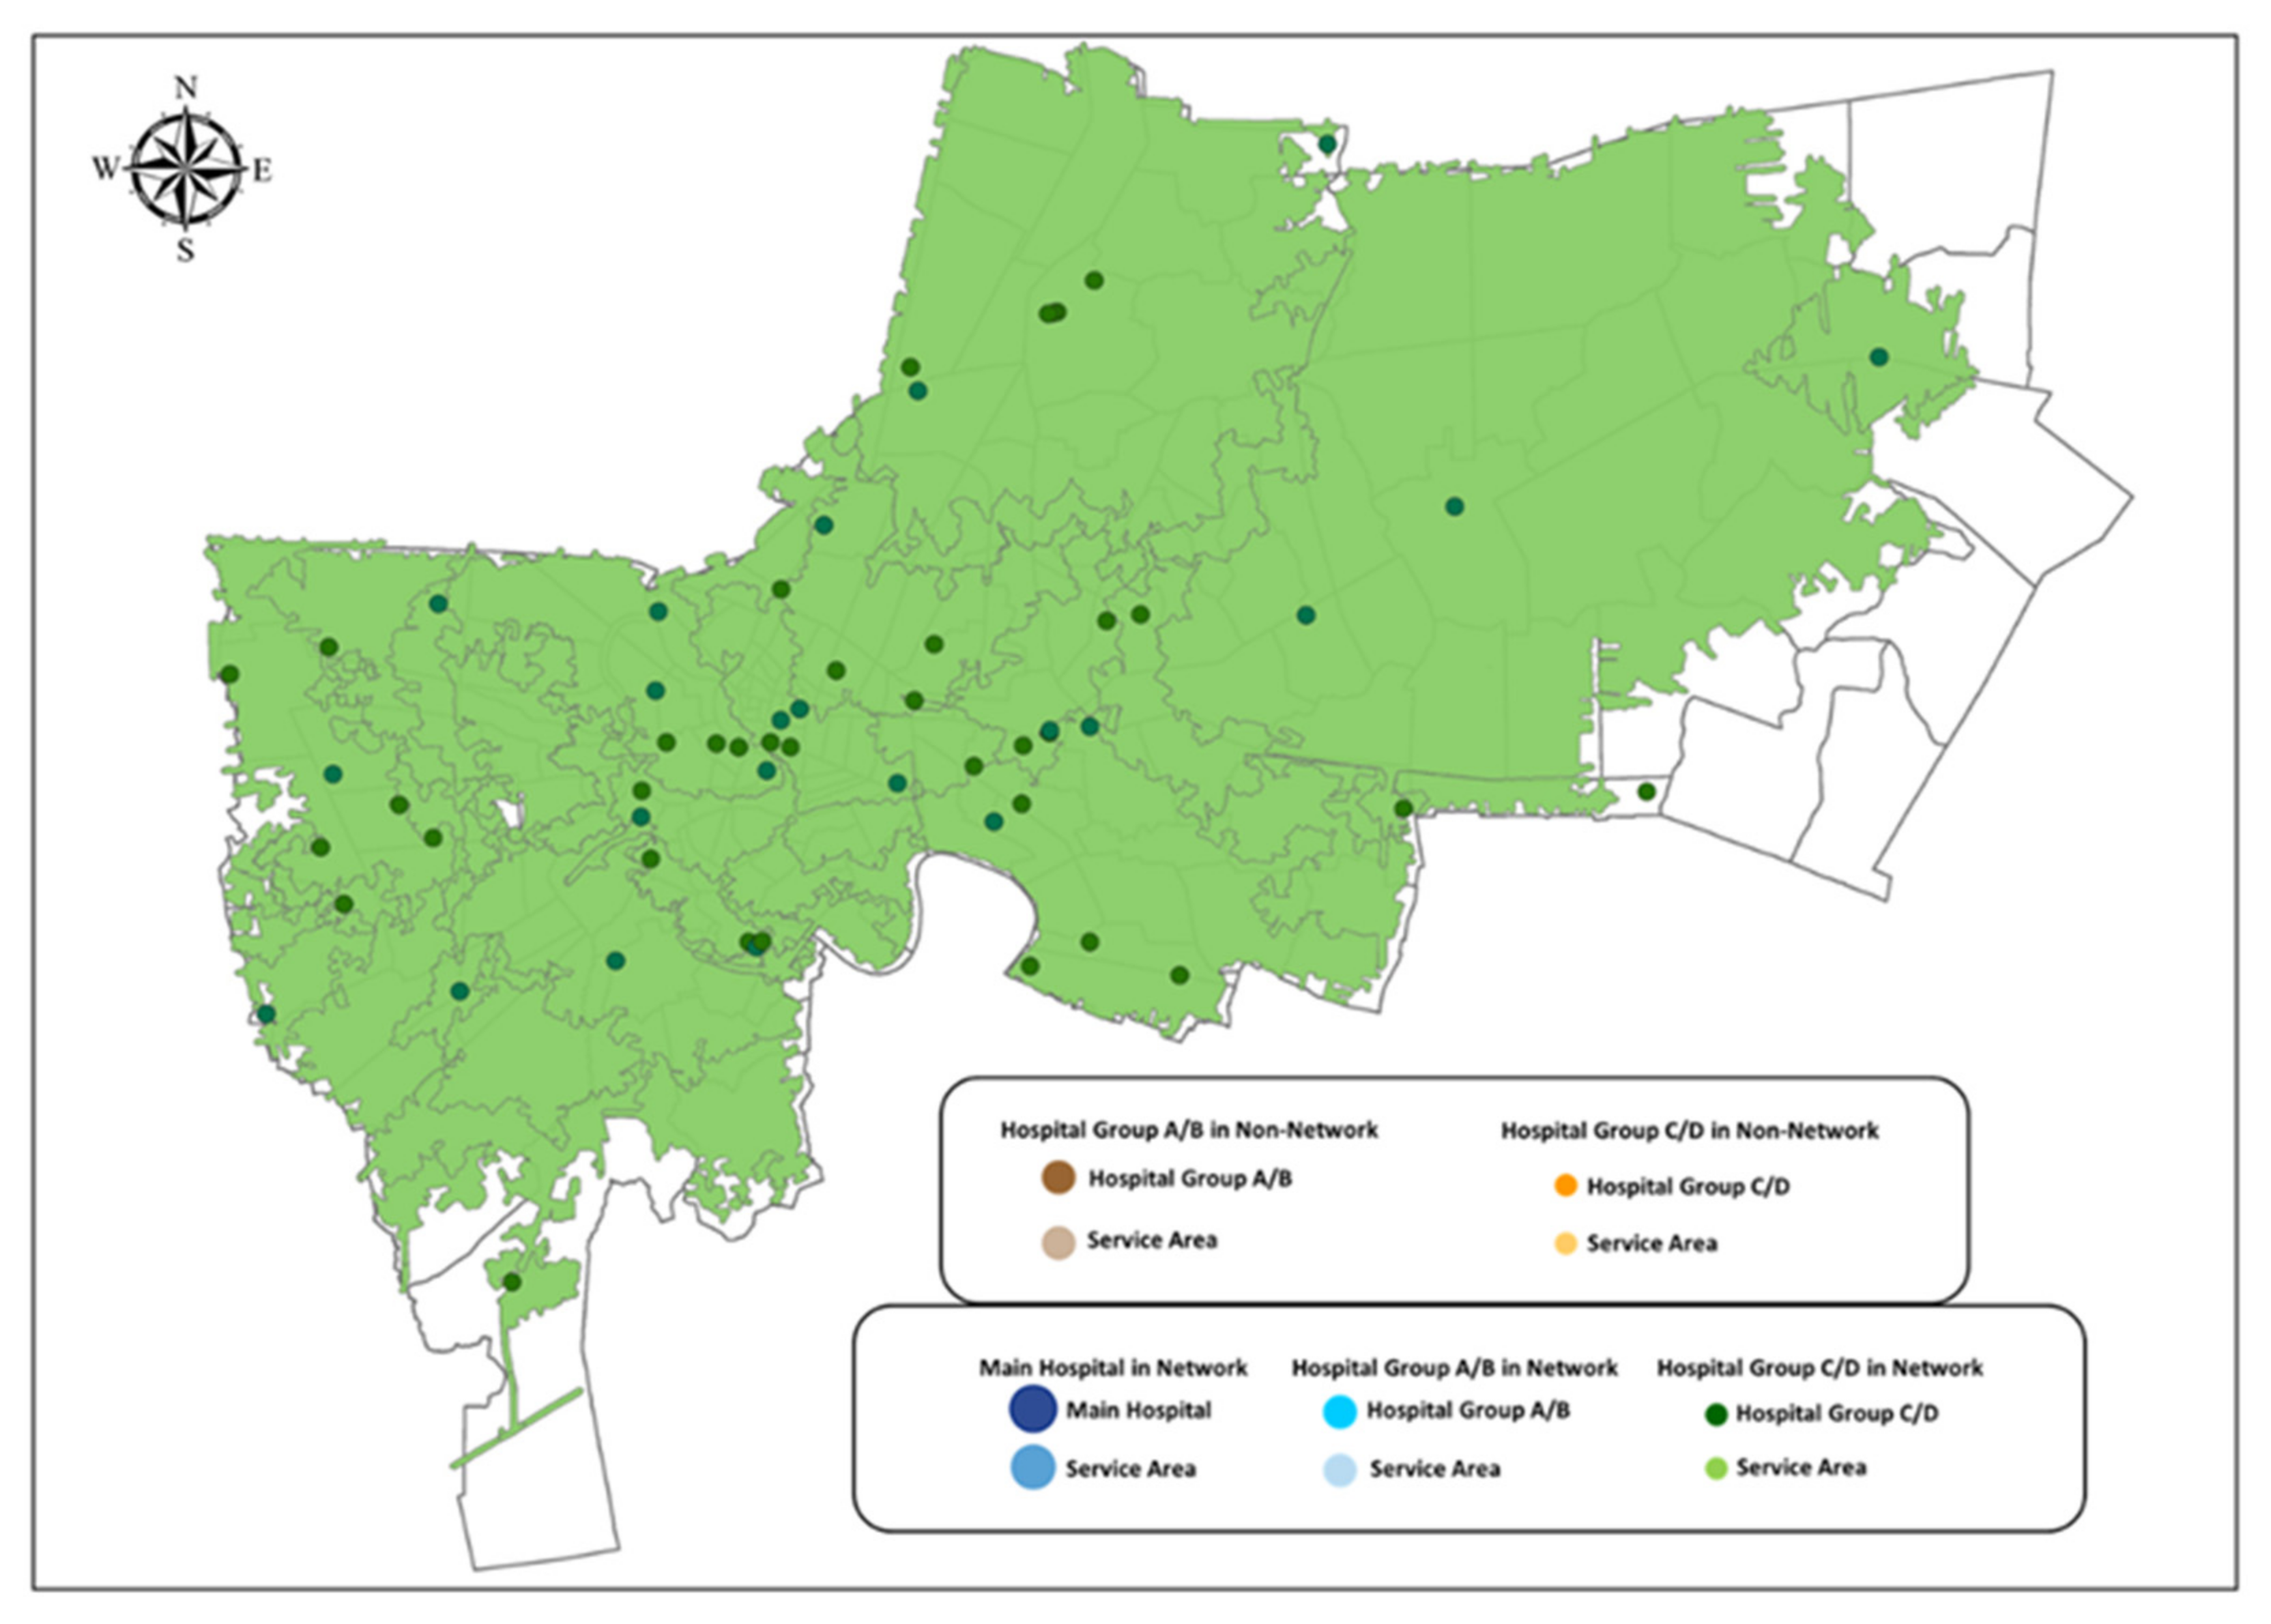
Stroke Service Area of Hospitals in Group C/D
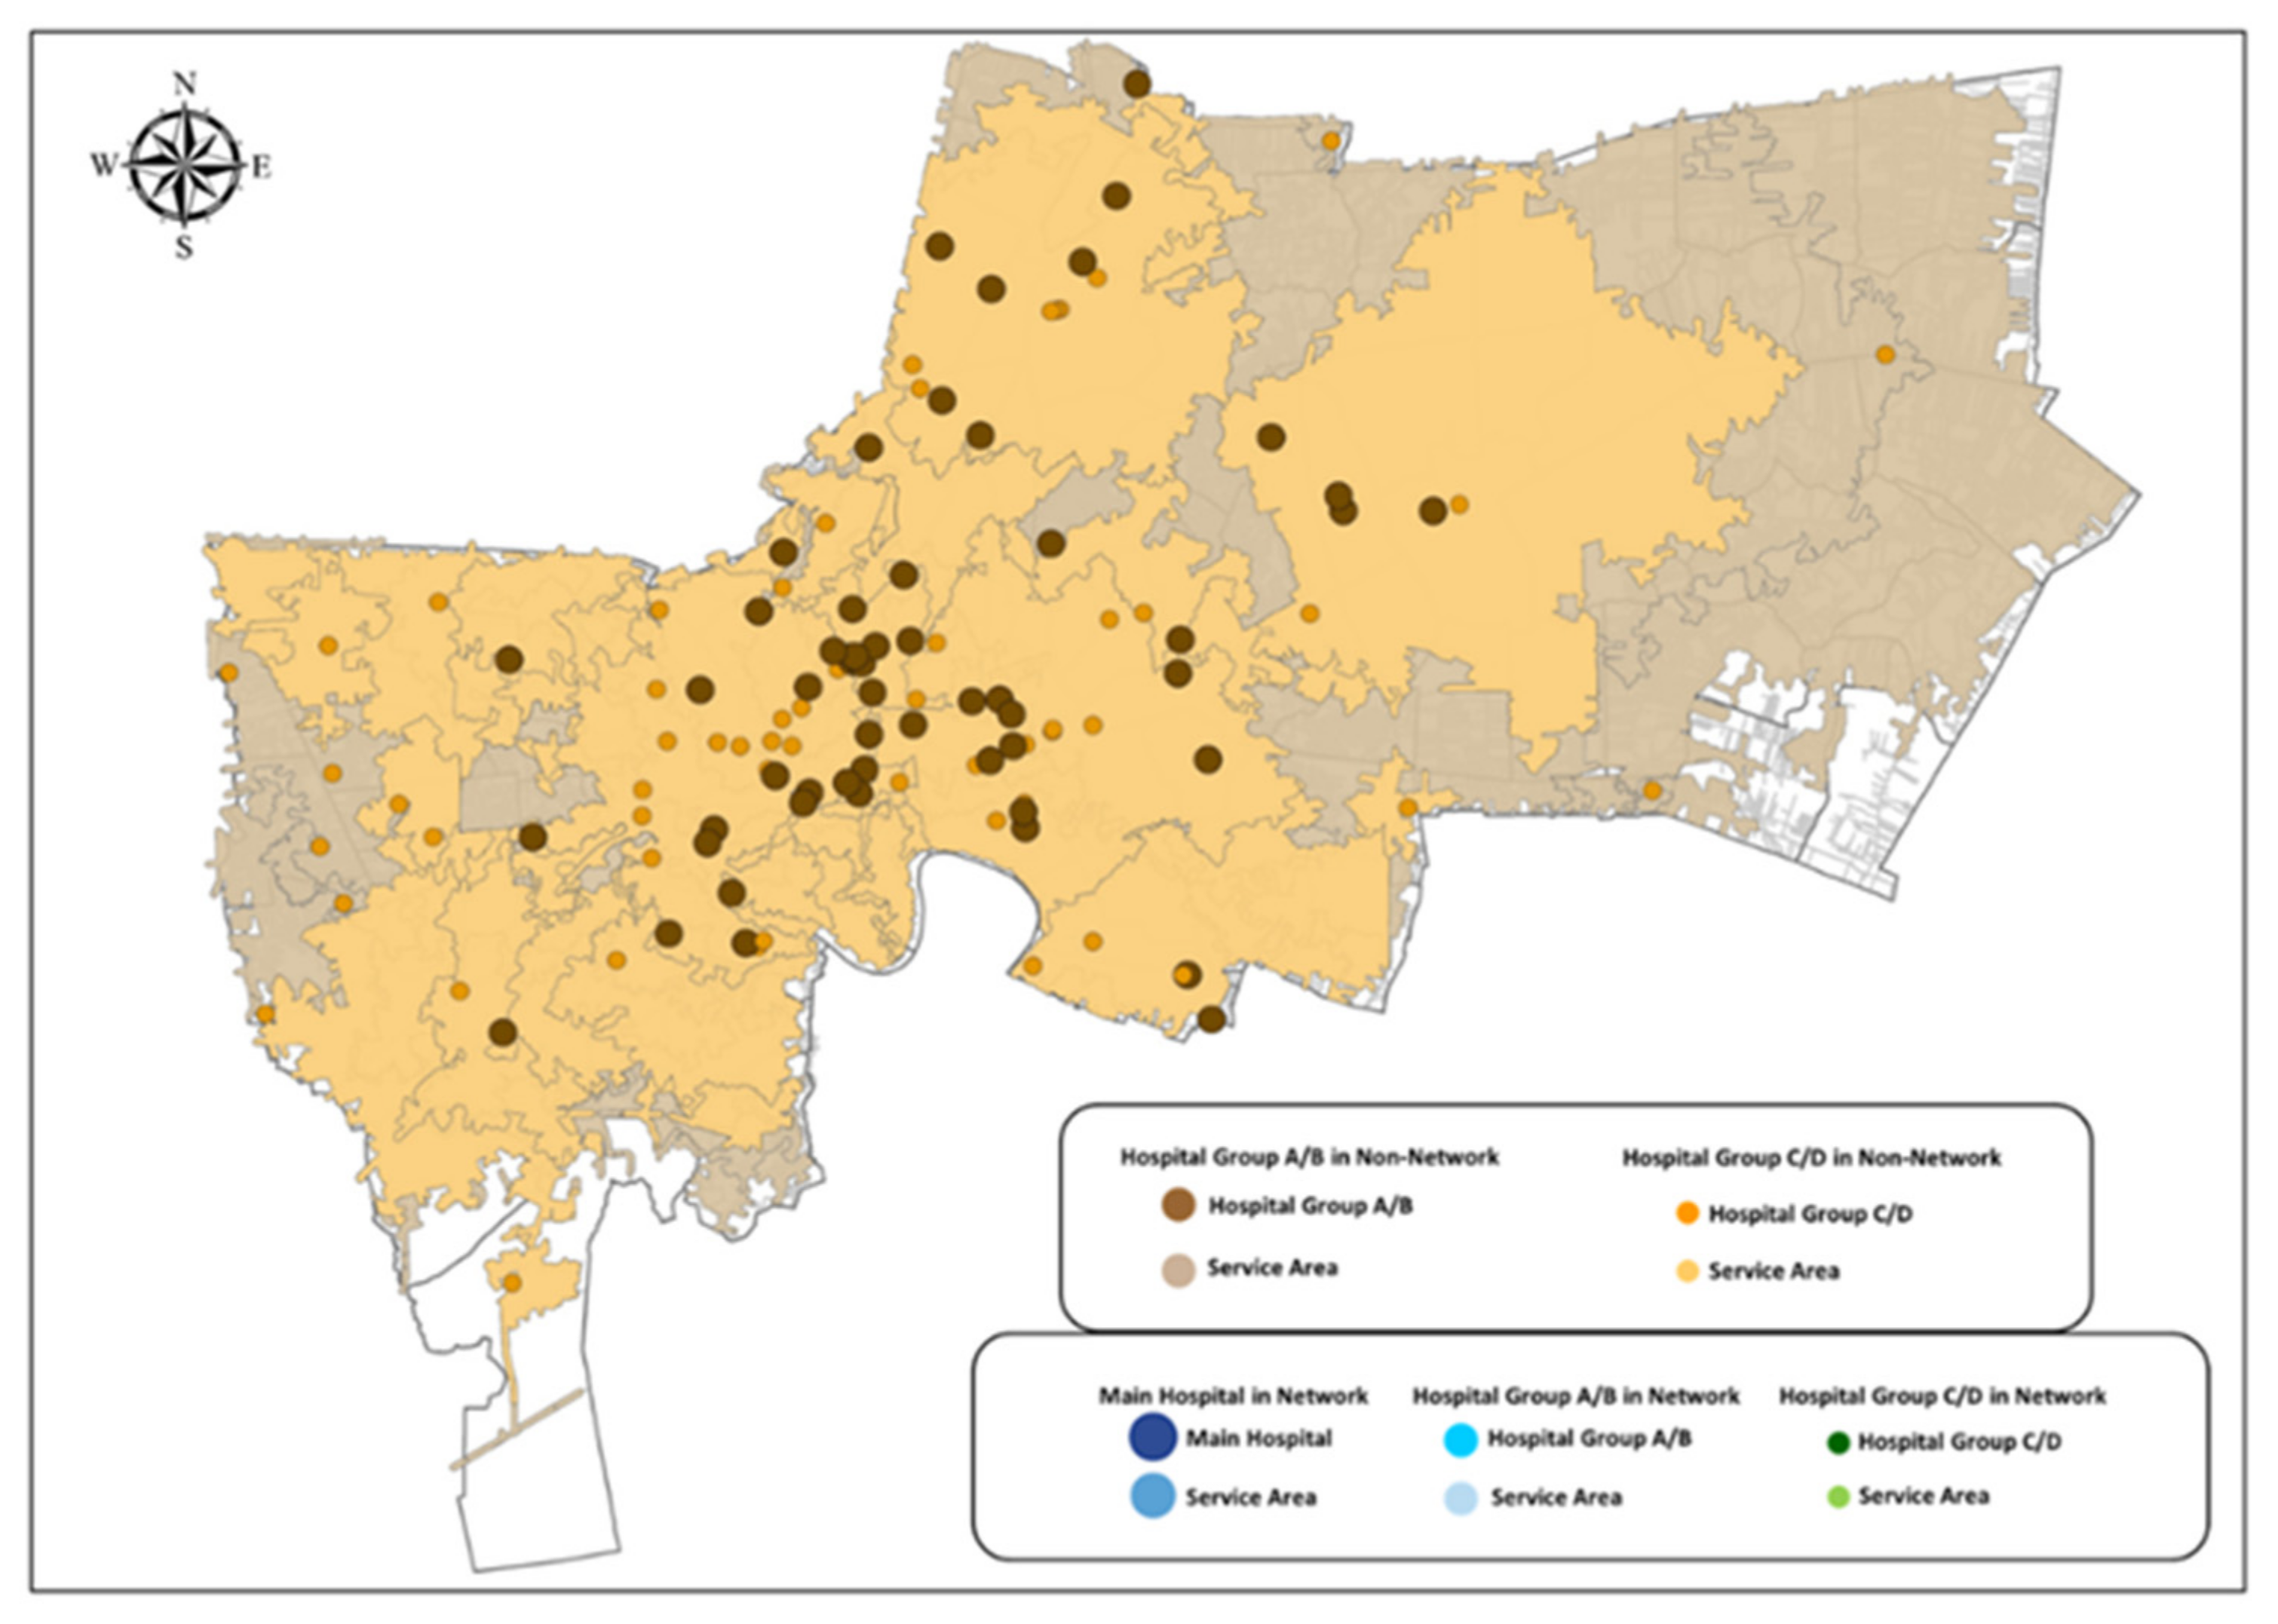
Overlayed Stroke Service Area of Hospitals in Bangkok
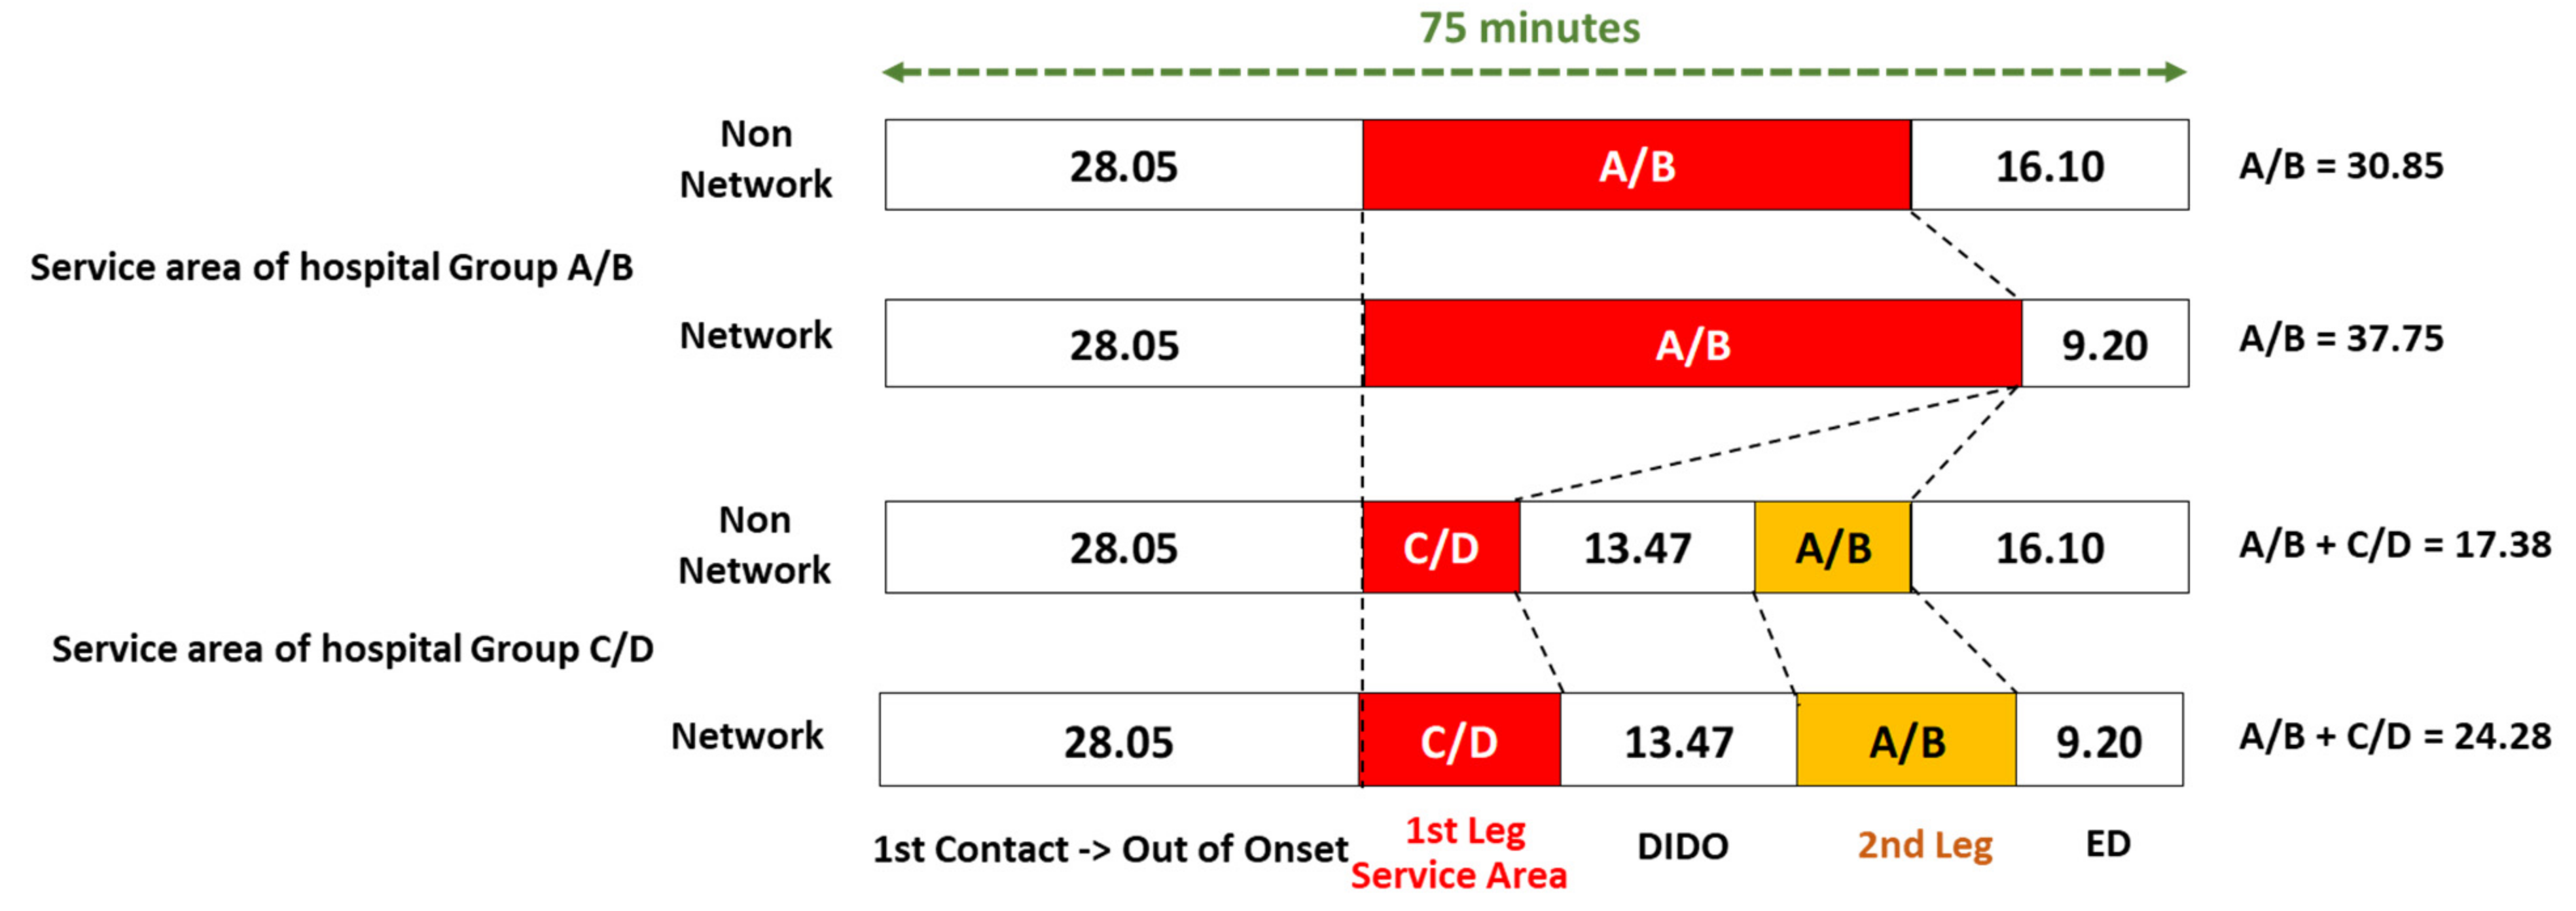
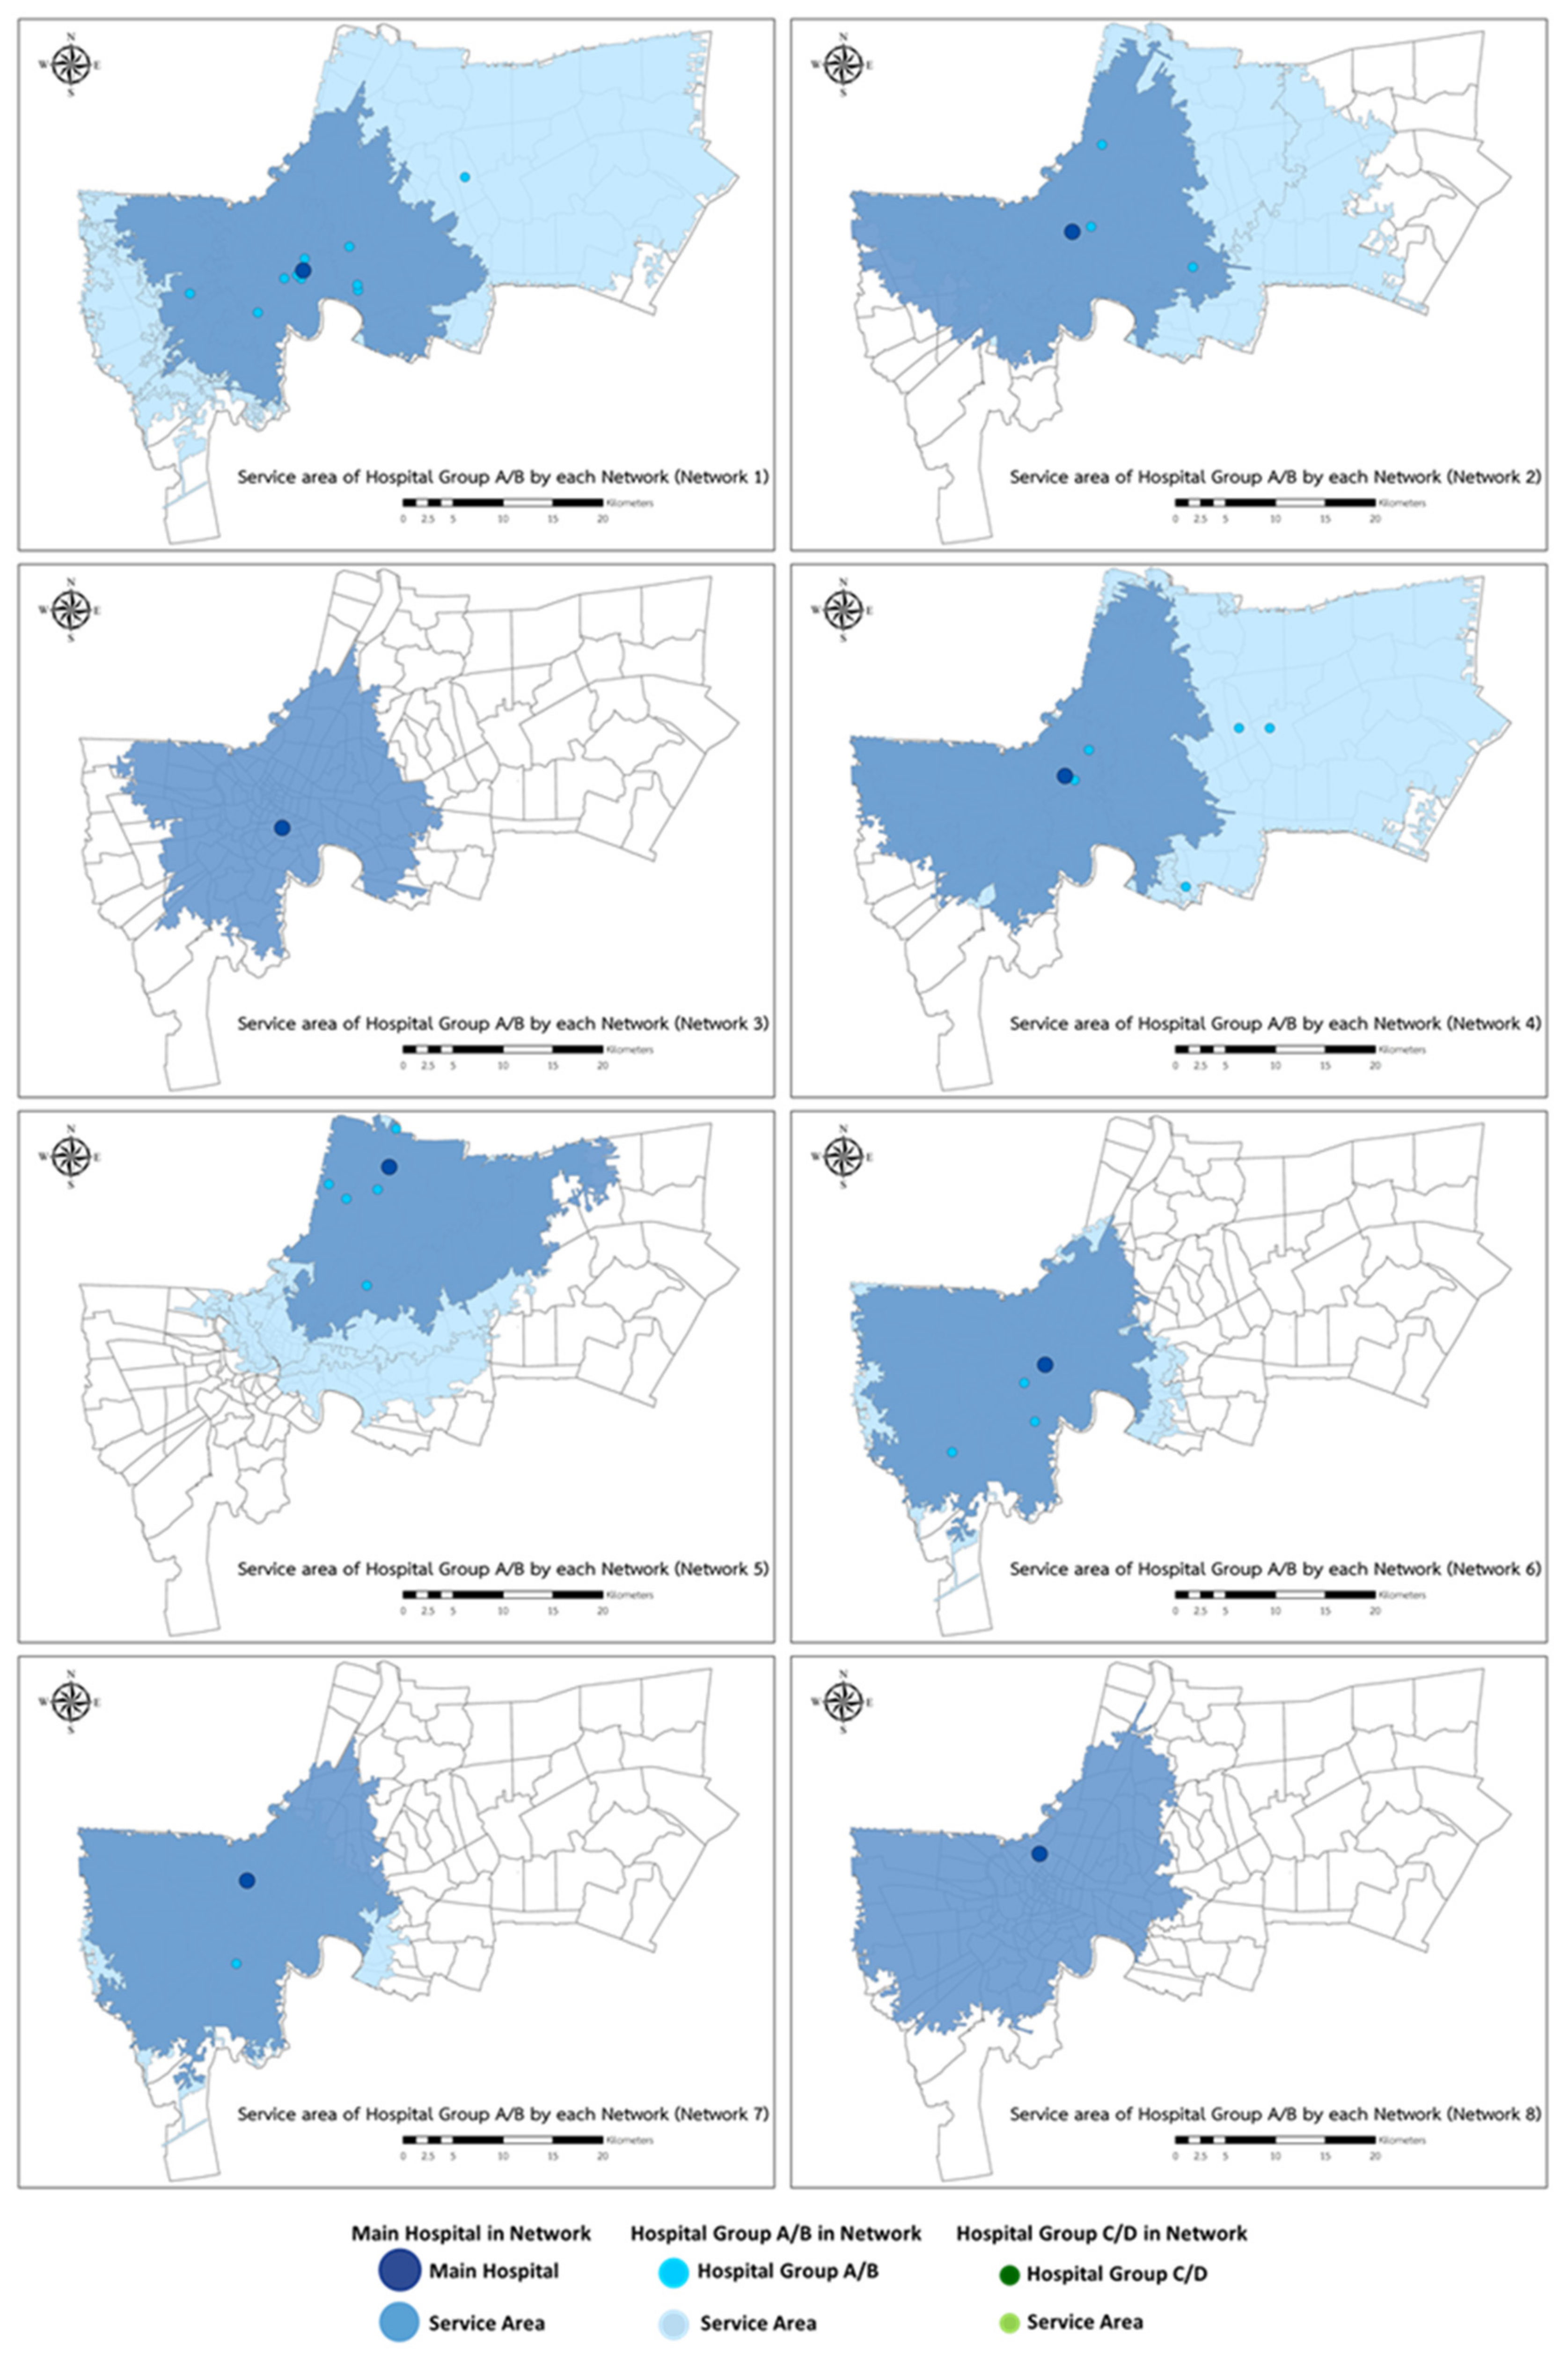
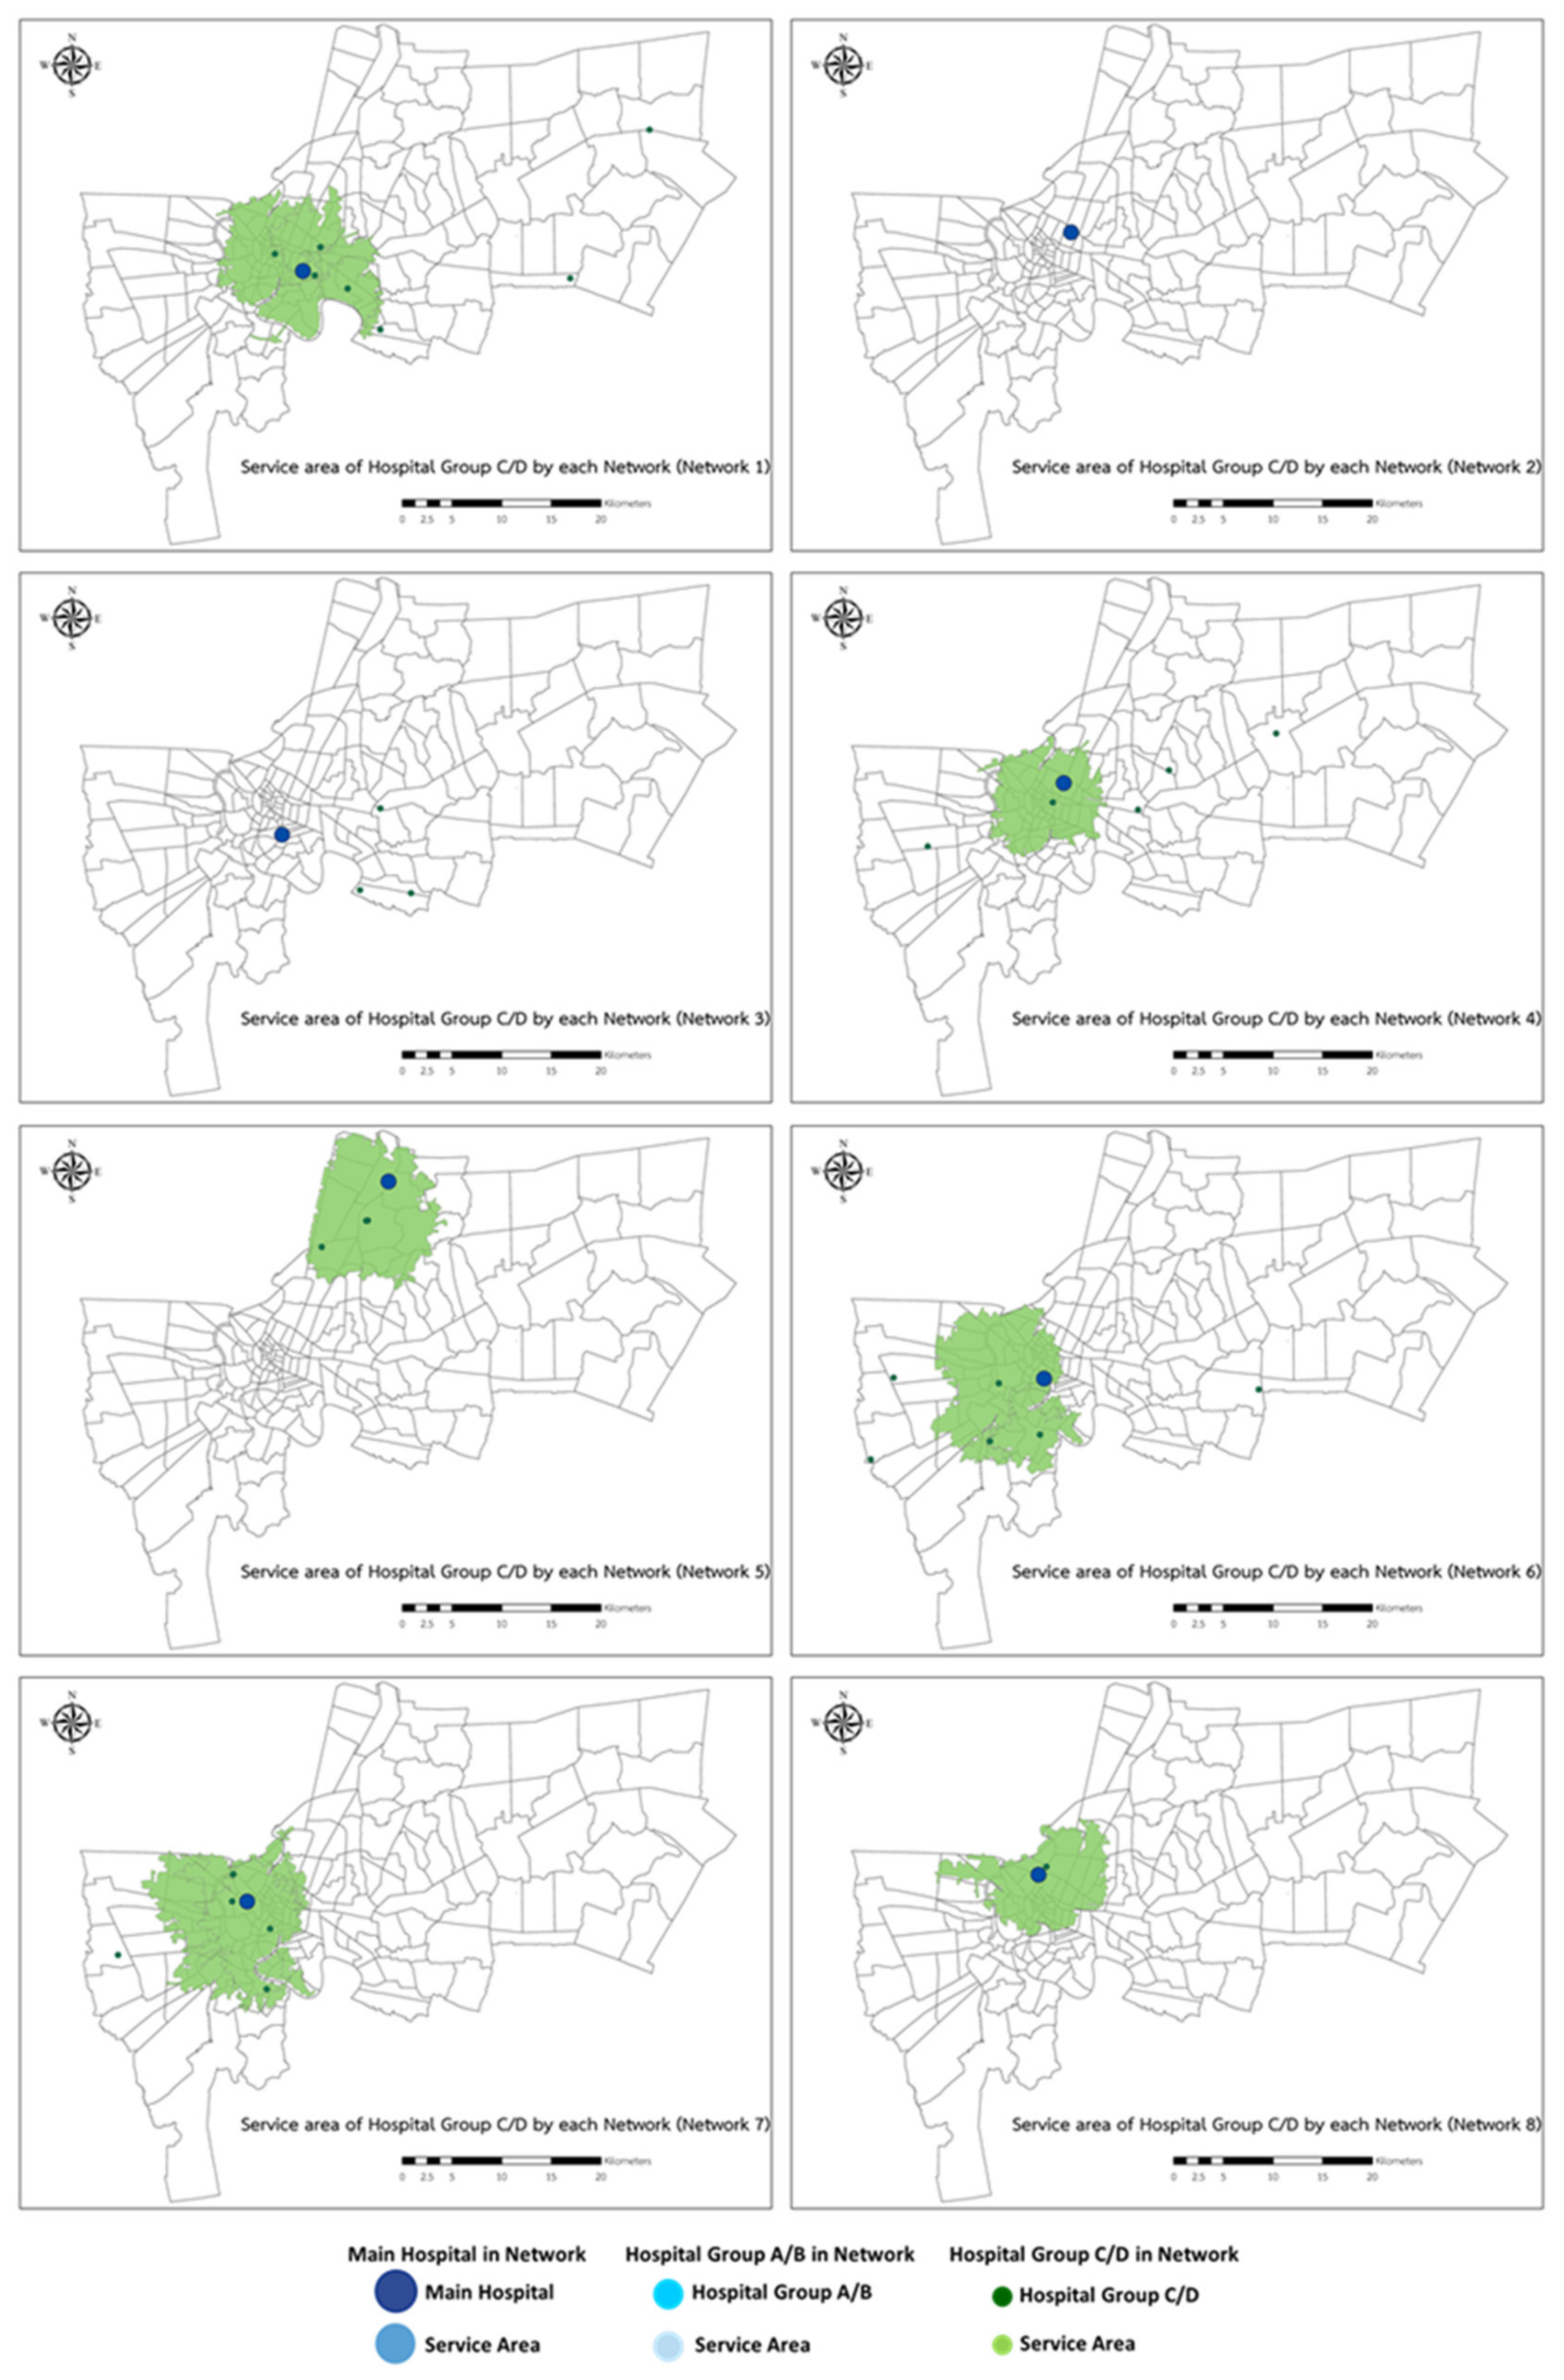
3.1.2. EMS Service to Hospitals with Stroke Networks
Stroke Service Areas of Hospitals in Group A/B in Each Network
Stroke Service Areas between Group C/D Hospitals and the Main Hospital in Each Network
Overlayed Stroke Service Area of 8 Stroke Networks
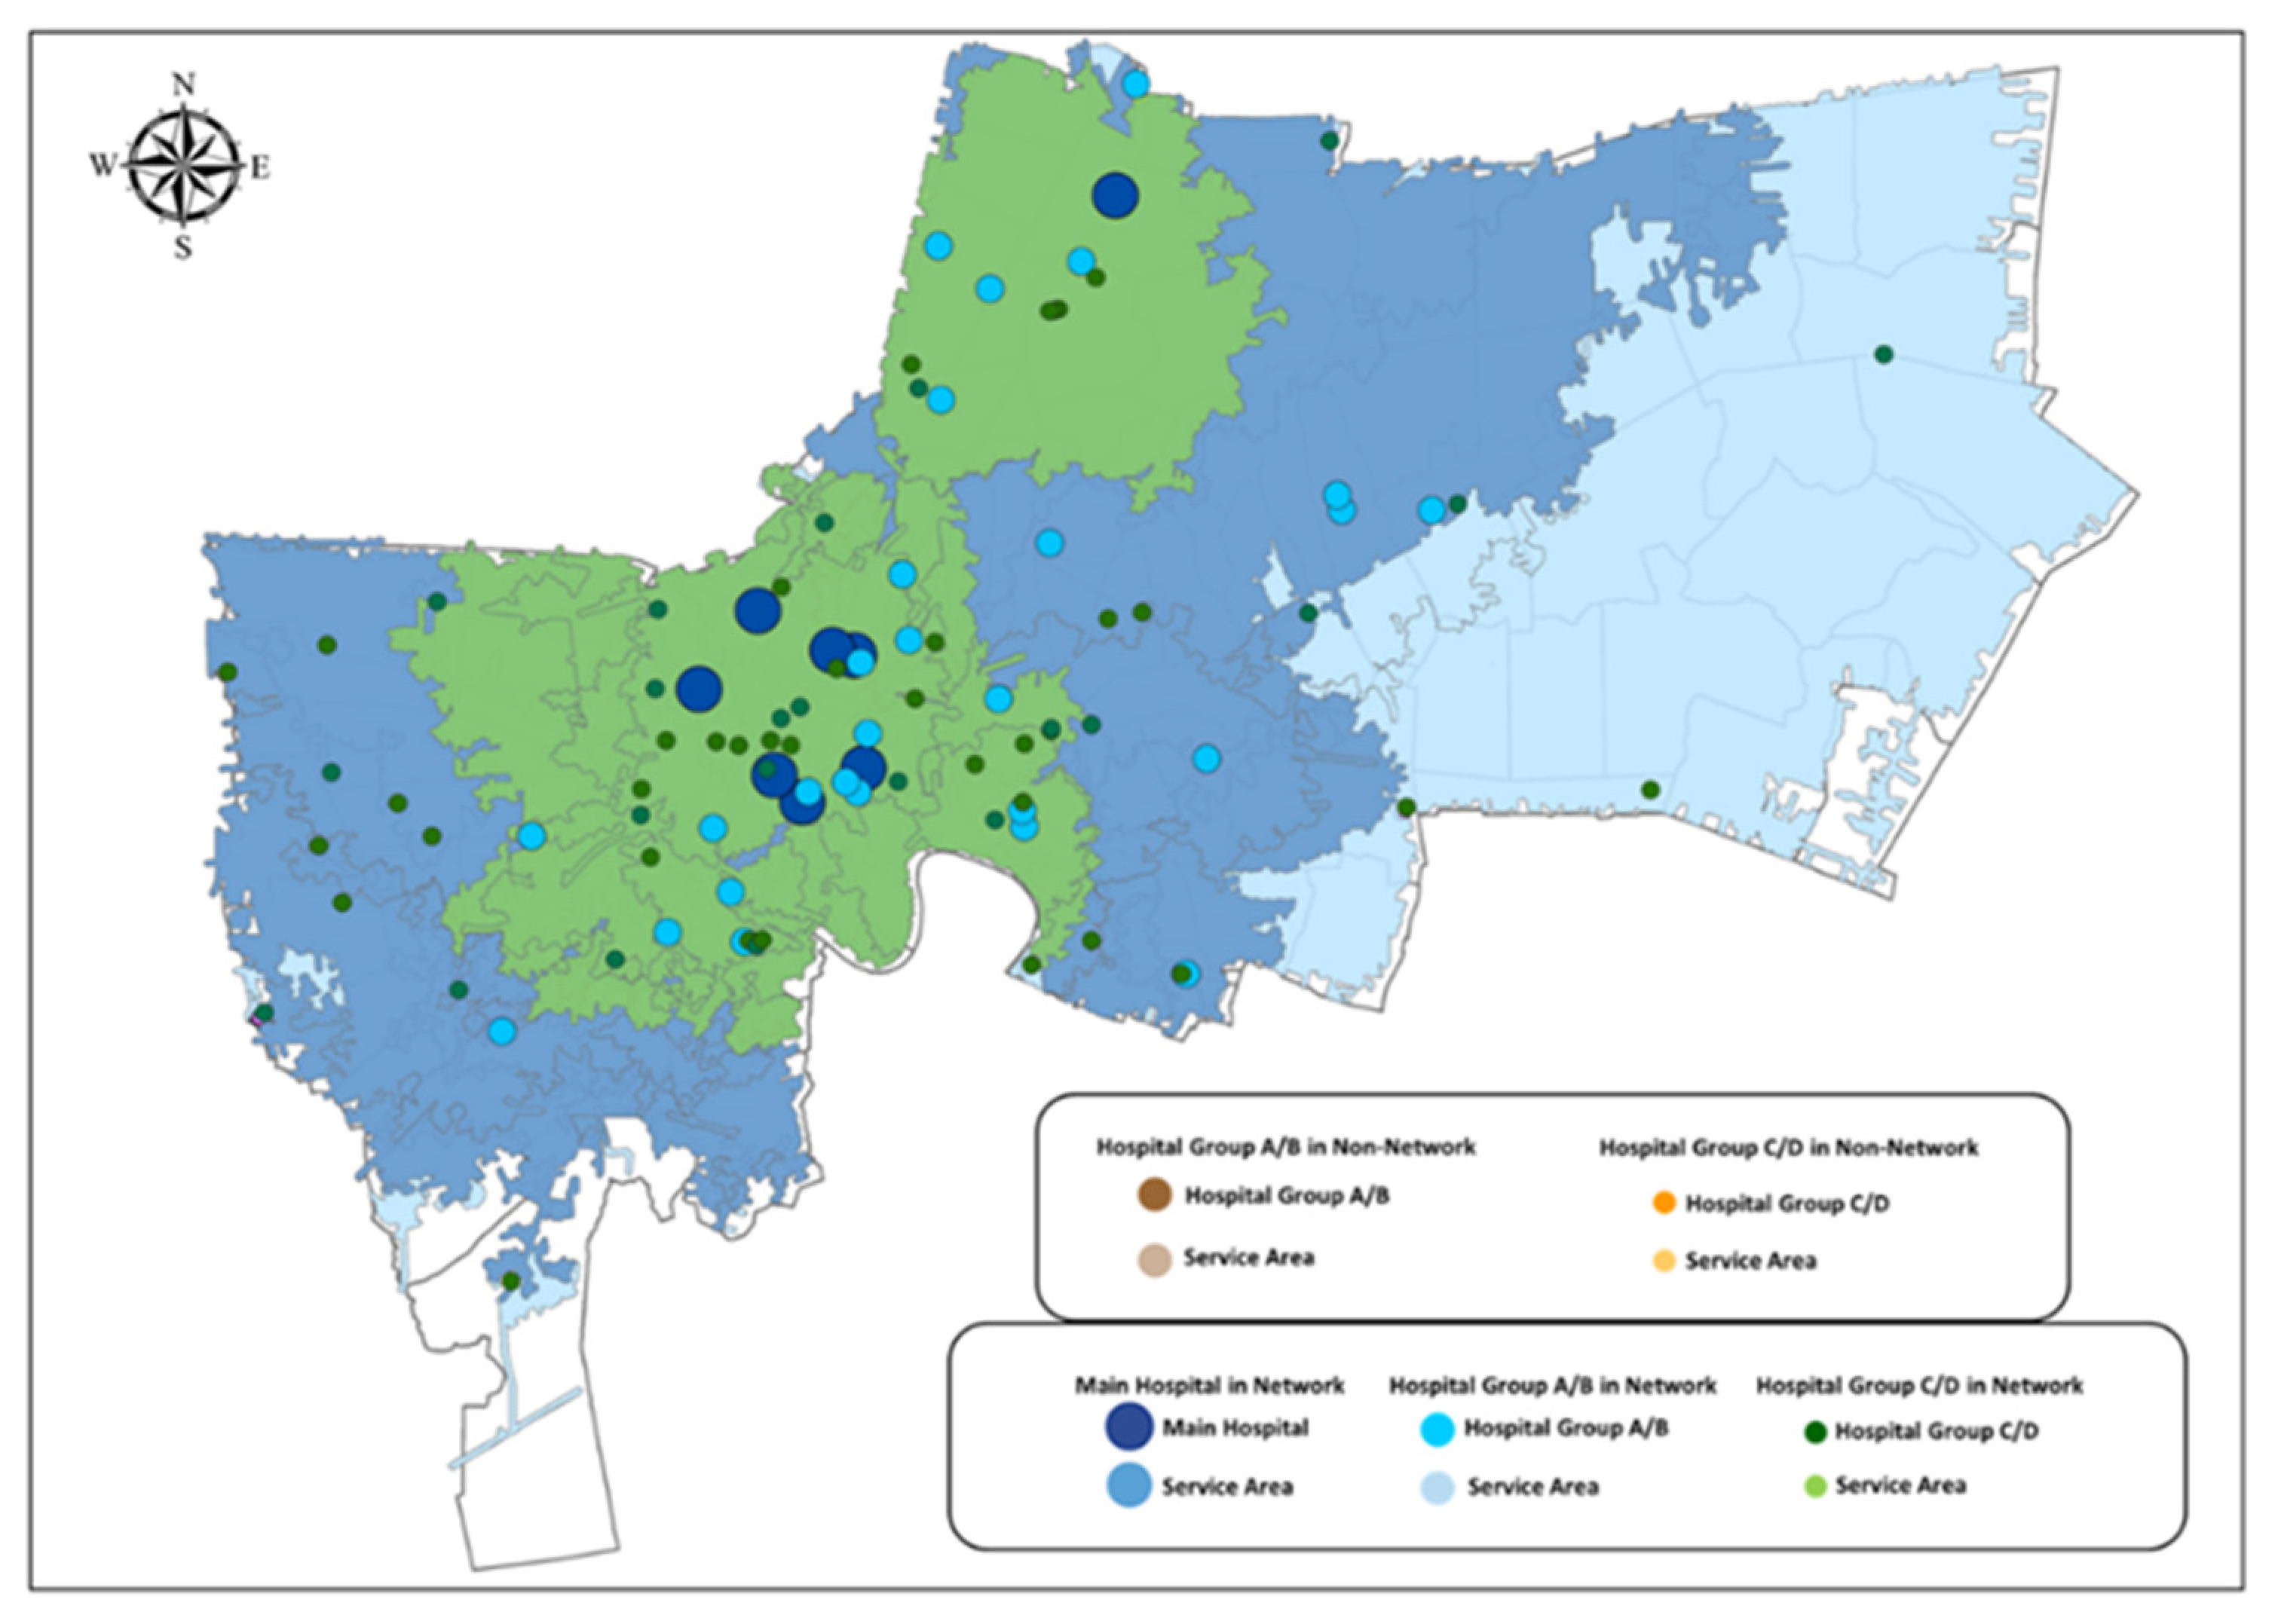
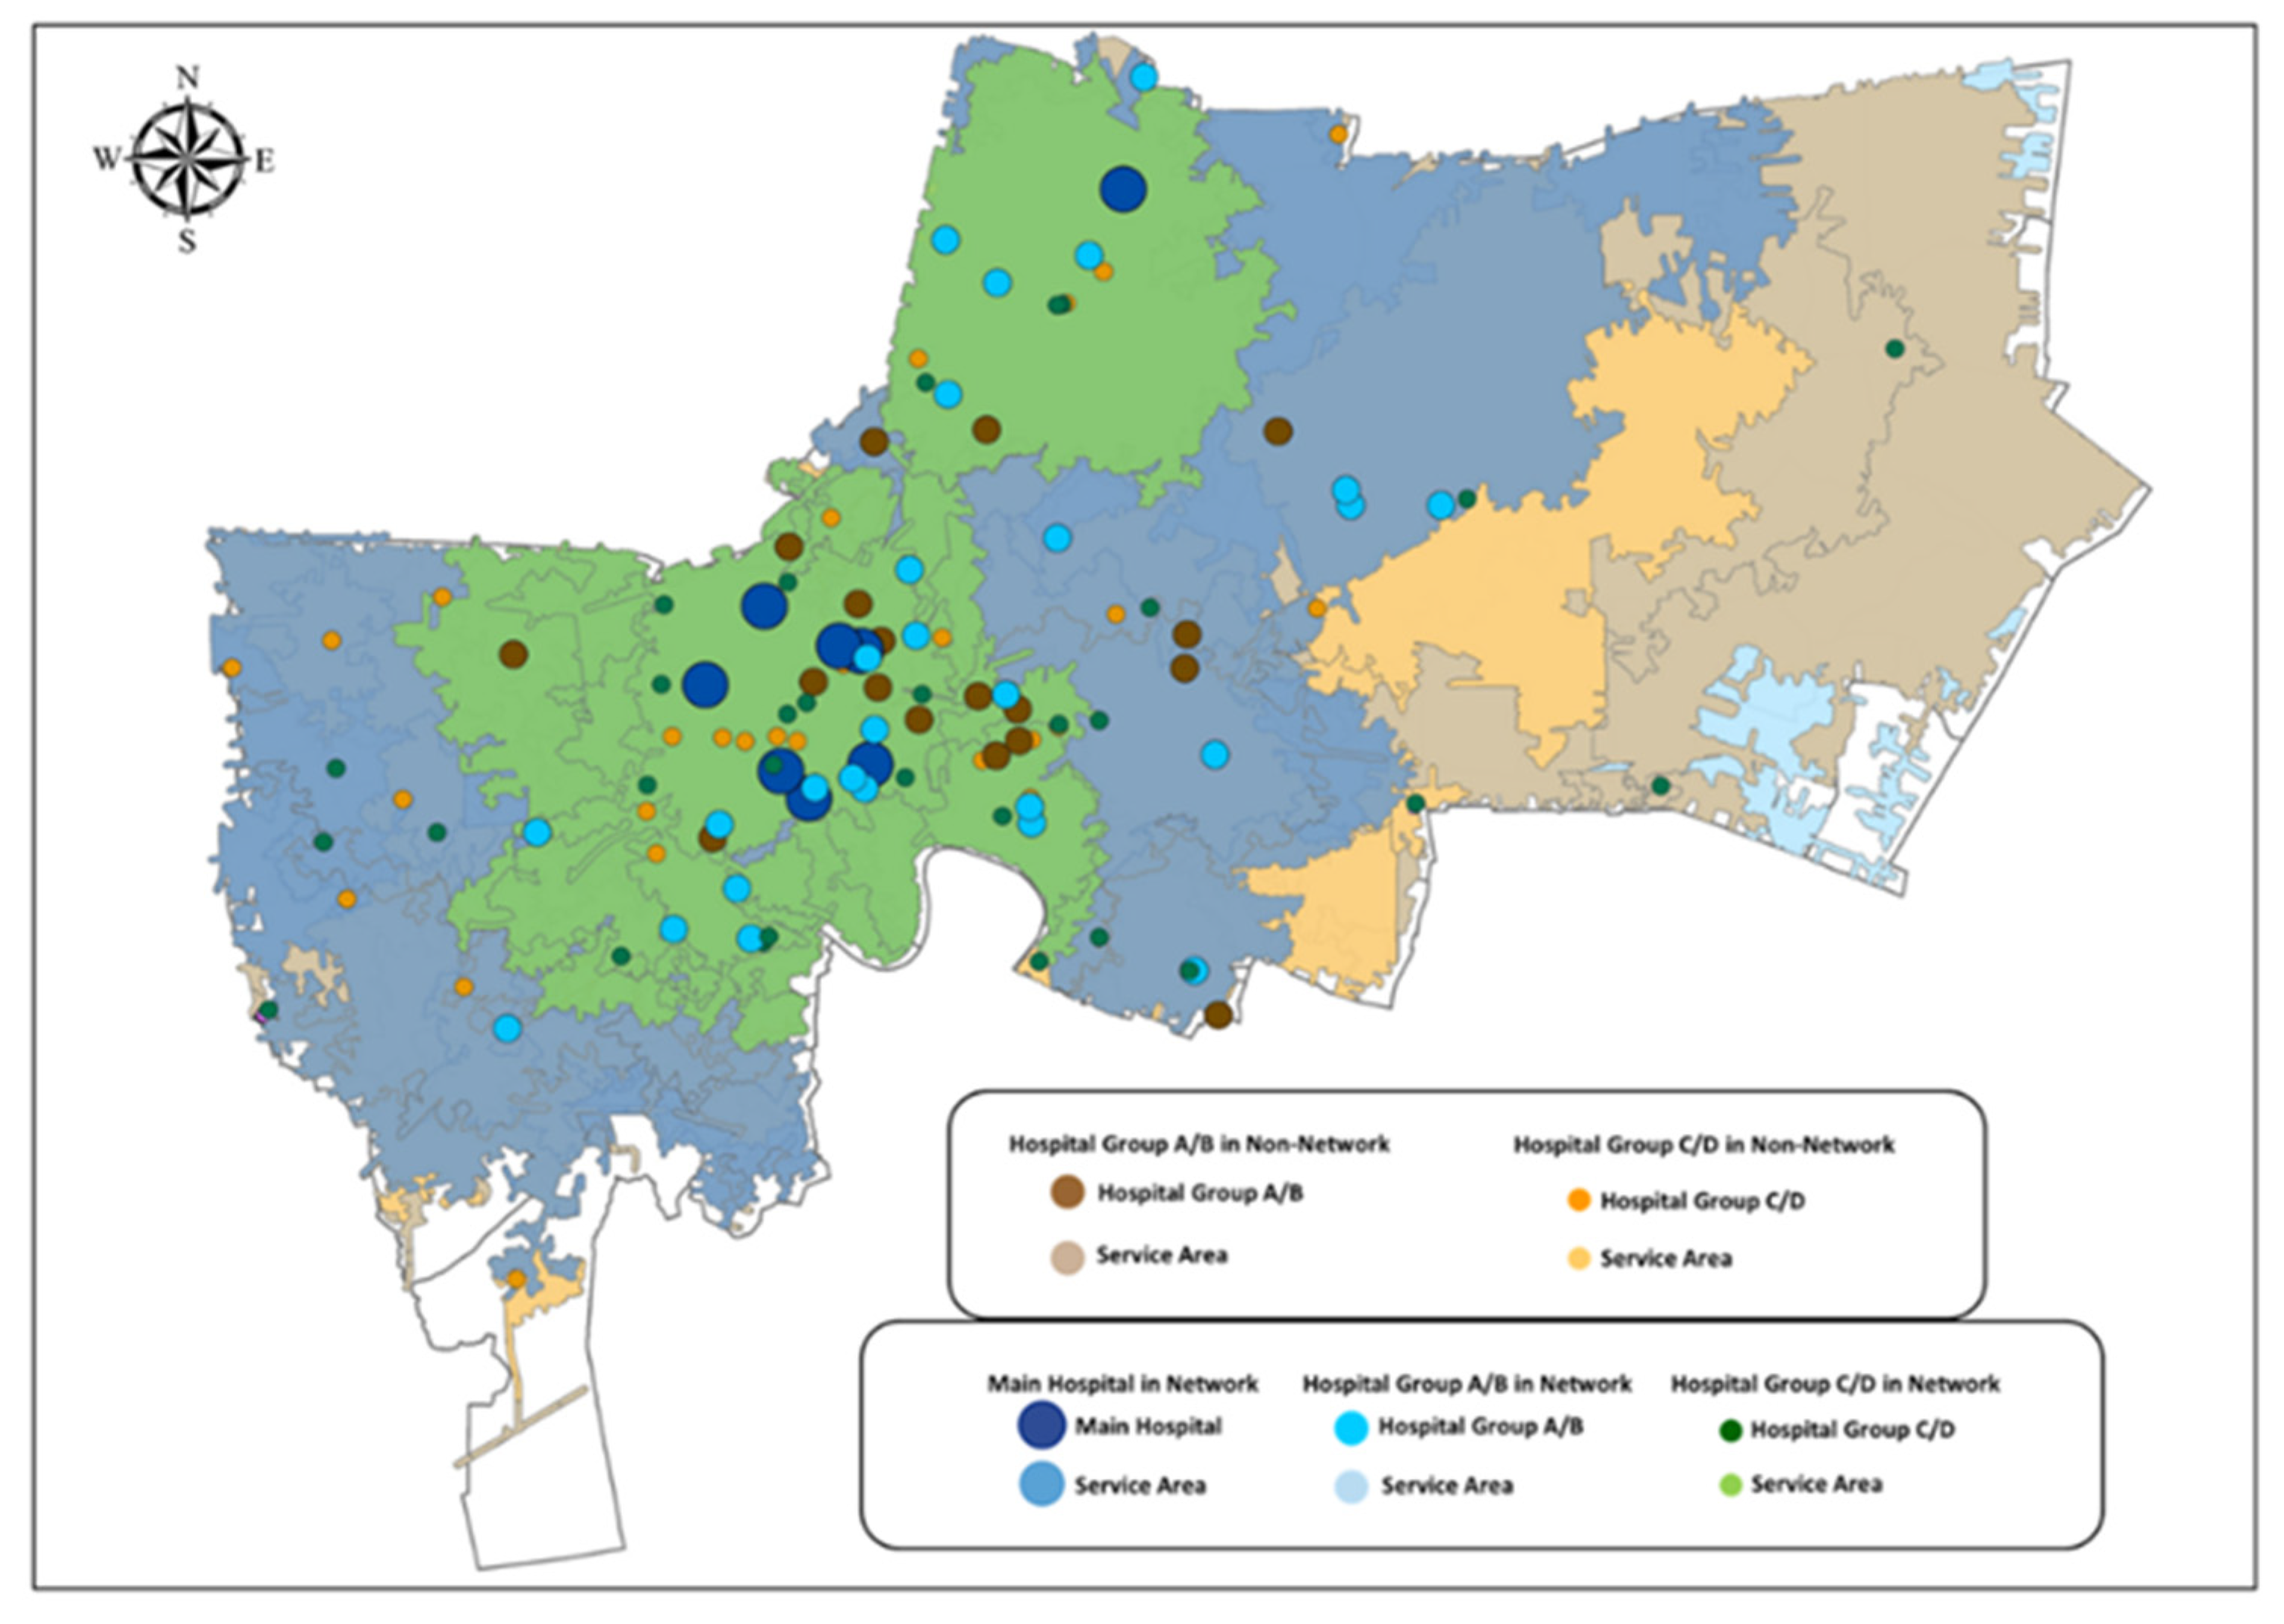
3.1.3. Overlayed Stroke Service Area for Network and Non-Network Hospitals in Bangkok
3.1.4. Suggestions to Utilize Current Hospitals in NHSO Region 13
Change All Non-Network Hospitals in Group A/B to Network Hospitals
Change All Non-Network Hospitals in Group C/D to Network Hospitals with Patient Transferal to the Nearest Hospital in Group A/B
3.2. GIS Data Analysis
4. Discussion
5. Conclusions
Author Contributions
Funding
Data Availability Statement
Conflicts of Interest
References
- World Health Organization. Available online: http://www.who.int/healthinfo/global_burden_disease/en/ (accessed on 13 January 2019).
- Burden of Disease. Available online: http://bodthai.net/en/home/ (accessed on 13 January 2019).
- Hacke, W.; Kaste, M.; Bluhmki, E.; Brozman, M.; Dávalos, A.; Guidetti, D. Thrombolysis with Alteplase 3 to 4.5 Hours after Acute Ischemic Stroke. N. Engl. J. Med. 2008, 359, 1317–1329. [Google Scholar] [CrossRef] [PubMed] [Green Version]
- Advani, R.; Naess, H.; Kurz, M.W. The golden hour of acute ischemic stroke. Scand. J. Trauma Resusc. Emerg. Med. 2017, 25, 54. [Google Scholar] [CrossRef] [PubMed] [Green Version]
- Saver, J.L.; Smith, E.E.; Fonarow, G.C.; Reeves, M.J.; Zhao, X.; Olson, D.M.; Schwamm, L.H.; GWTG-Stroke Steering Committee and Investigators. The “Golden Hour” and Acute Brain Ischemia: Presenting Features and Lytic Therapy in >30,000 Patients Arriving within 60 Minutes of Stroke Onset. Stroke 2010, 41, 1431–1439. [Google Scholar] [CrossRef] [PubMed] [Green Version]
- Oostema, J.A.; Nasiri, M.; Chassee, T.; Reeves, M.J. The Quality of Prehospital Ischemic Stroke Care: Compliance with Guidelines and Impact on In-hospital Stroke Response. J. Stroke Cerebrovasc. Dis. 2014, 23, 2773–2779. [Google Scholar] [CrossRef] [PubMed]
- Ministry of Public Health. Available online: https://www.nationalhealth.or.th/sites/default/files/upload_files/60_01_15_8475.pdf (accessed on 23 January 2019).
- National Health Security Office (NHSO). Available online: http://164.115.27.97/digital/files/original/541ed06a4783c4db8d2192e3580b7eb6.pdf (accessed on 12 November 2018).
- National Health Security Office (NHSO), Service Plan Summary. Available online: https://bkk13.moph.go.th/file/2018/12/20/20181220110940.pdf (accessed on 10 February 2019).
- Bangkok Population. Available online: https://worldpopulationreview.com/world-cities/bangkok-population (accessed on 20 July 2021).
- INRIX Global Traffic Scorecard. 2018. Available online: https://www.dmagazine.com/wp-content/uploads/2018/02/INRIX_2017_Traffic_Scorecard_Final_2.pdf (accessed on 10 February 2019).
- Gache, K.; Couralet, M.; Nitenberg, G.; Leleu, H.; Minvielle, E. The Role of Calling EMS versus Using Private Transportation in Improving the Management of Stroke in France. Prehospital. Emerg. Care 2013, 17, 217–222. [Google Scholar] [CrossRef] [PubMed]
- Yuwares, S.; Thidathit, P.; Prakit, S.; Kittisak, S. An Emergency Medical Service System in Thailand_Providers’ Perspectives. J. Med. Assoc. Thai. Oct. 2014, 97, 1016–1021. [Google Scholar]
- Riyapan, S.; Chantanakomes, J.; Ruangsomboon, O.; Chaisirin, W.; Limsuwat, C.; Prapruetkit, N.; Chakorn, T.; Monsomboon, A. Assessment of Prehospital Management of Patients Transported to a Thai University Hospital. Siriraj Med. J. 2020, 72, 287–295. [Google Scholar] [CrossRef]
- Murad, A. Using GIS for Determining Variations in Health Access in Jeddah City, Saudi Arabia. ISPRS Int. J. Geo-Inf. 2018, 7, 254. [Google Scholar] [CrossRef] [Green Version]
- The 2010 Population and Housing Census the National Statistical Office. Available online: http://web.nso.go.th/en/census/poph/data/090913_Introduction_10.pdf (accessed on 21 November 2020).
- Stroke Hospital Level. Thai Health Coding Center. Available online: http://www.thcc.or.th/download/GIS54.pdf (accessed on 9 December 2020).
- Traffic Data from iTIC. The Intelligent Traffic Information Center. Available online: https://itic.longdo.com/opendata/ (accessed on 4 April 2021).
- Riyapan, S. The 4th Siriraj Stroke Conference 2019; Department of Emergency Medicine, Faculty of Medicine, Siriraj Hospital: Bangkok, Thailand, 2019. [Google Scholar]
- GIS Data in Bangkok. Available online: http://www.bangkokgis.com/modules.php?m=download_shapefile (accessed on 15 May 2021).
- Non-Registered Population. NSO Annual Report 2019; The National Statistical Office: Bangkok, Thailand, 2019. [Google Scholar]
- Population Sensus Postponement. Available online: http://www.nso.go.th/sites/2014/Pages/pop/delay2563.aspx (accessed on 25 November 2020).
- Kerstin, P.; Jan, P.; Jörgen, J.; Gun, N. Time Saved with High Speed Driving of Ambulances. Accid. Anal. Prev. 2011, 43, 818–822. [Google Scholar]
- Zhang, S.; Zhang, J.; Zhang, M.; Zhong, G.; Chen, Z.; Lin, L.; Lou, M. Prehospital Notification Procedure Improves Stroke Outcome by Shortening Onset to Needle Time in Chinese Urban Area. Aging Dis. 2018, 9, 426–434. [Google Scholar] [CrossRef] [PubMed] [Green Version]
- Tennyson, J.C.; Michael, S.S.; Youngren, M.N.; Reznek, M.A. Delayed Recognition of Acute Stroke by Emergency Department Staff Following Failure to Activate Stroke by Emergency Medical Services. West. J. Emerg. Med. 2019, 20, 342–350. [Google Scholar] [CrossRef] [PubMed] [Green Version]
- Sangob, B.; Nisakorn, V.; Angun, B. Development of Fast Track Service System for Patients with Stroke. Wapipathum Hosp. Serv. Netw. Mahasarakham Hosp. J. 2017, 14, 100–113. [Google Scholar]
- Murad, A.A. Creating a GIS application for health services at Jeddah city. Comput. Biol. Med. 2007, 37, 879–889. [Google Scholar] [CrossRef] [PubMed]
- Leira, E.C.; Lamb, D.L.; Nugent, A.S.; Ahmed, A.; Grimsman, K.J.; Clarke, W.R.; Adams, H.P., Jr. Feasibility of Acute Clinical Trials During Aerial Interhospital Transfer. Stroke 2006, 37, 2504–2507. [Google Scholar] [CrossRef] [PubMed] [Green Version]


| Hospital’s Facility for Stroke | ||||||
|---|---|---|---|---|---|---|
| Hospital Level By NHSO | A | B | C | D | Total | |
| B1 | B2 | |||||
| CT Scan/MRI | CT Scan/MRI | CT Scan/MRI | CT Scan/MRI | |||
| rt-PA Service | rt-PA Service | rt-PA Service | ||||
| (24 h) | (24 h) | (Not 24 h) | ||||
| Thrombectomy | ||||||
| 1 | 8 | 23 | 35 | 66 | ||
| 2 | 18 | 18 | ||||
| 3 | 27 | 27 | ||||
| Total | 27 | 18 | 8 | 23 | 35 | 111 |
| Network | Hospital’s Facility for Stroke | ||||||
|---|---|---|---|---|---|---|---|
| Network No. | Main | A | B | C | D | Total | |
| B1 | B2 | ||||||
| CT Scan/MRI | CT Scan/MRI | CT Scan/MRI | CT Scan/MRI | ||||
| rt-PA Service | rt-PA Service | rt-PA Service | |||||
| (24 h) | (24 h) | (Not 24 h) | |||||
| Thrombectomy | |||||||
| 1 | King Chulalongkorn Memorial Hospital | 2 | 6 | 2 | 4 | 3 | 17 |
| 2 | Phramongkutklao Hospital | 2 | 1 | 0 | 0 | 0 | 3 |
| 3 | Lerdsin Hospital | 0 | 0 | 0 | 1 | 2 | 3 |
| 4 | Prasat Neurological Institute | 2 | 2 | 1 | 3 | 2 | 10 |
| 5 | Bhumibol Adulyadej Hospital | 2 | 2 | 1 | 1 | 2 | 8 |
| 6 | Taksin Hospital | 0 | 2 | 1 | 3 | 3 | 9 |
| 7 | Siriraj Hospital | 0 | 1 | 0 | 4 | 1 | 6 |
| 8 | Faculty of Medicine Vajira Hospital | 0 | 0 | 0 | 0 | 1 | 1 |
| Total | 8 | 14 | 5 | 16 | 14 | 57 | |
| Model | Type of Result | ||||
|---|---|---|---|---|---|
| By Area | By Population | ||||
| km2 | % | Million | % | ||
| Non-Network | A/B | 1391 | 88.69% | 9.90 | 93.96% |
| C/D | 936 | 59.67% | 8.47 | 80.40% | |
| All | 1392 | 88.72% | 9.91 | 93.99% | |
| Network | Main/A/B | 1418 | 90.38% | 9.92 | 94.13% |
| C/D | 427 | 27.20% | 5.15 | 48.89% | |
| All | 1418 | 90.38% | 9.92 | 94.14% | |
| Combine | All | 1418 | 90.42% | 9.92 | 94.17% |
| % of Service Area Covered | Non-Network | Network | All | |||||||
|---|---|---|---|---|---|---|---|---|---|---|
| No. of Hospital | % | No. of Hospital | % | No. of Hospital | % | |||||
| A/B | C/D | All | All | A/B | C/D | All | All | |||
| 0 | 0 | 8 | 0 | 0% | 0 | 37 | 0 | 0% | 0 | 0% |
| 1–20% | 1 | 4 | 1 | 1% | 0 | 20 | 0 | 0% | 0 | 0% |
| 21–40% | 1 | 10 | 1 | 1% | 2 | 5 | 2 | 1% | 2 | 1% |
| 41–60% | 1 | 8 | 1 | 1% | 0 | 4 | 0 | 0% | 0 | 0% |
| 61–80% | 4 | 15 | 4 | 2% | 3 | 8 | 3 | 2% | 3 | 2% |
| 81–100% | 173 | 135 | 173 | 96% | 175 | 106 | 175 | 97% | 175 | 97% |
| Total | 180 | 180 | 180 | 100% | 180 | 180 | 180 | 100% | 180 | 100% |
| No. of Hospital | Non-Network | Network | All | |||||||
|---|---|---|---|---|---|---|---|---|---|---|
| No. of Sub-District | % | No. of Sub-District | % | No. of Sub-District | % | |||||
| A/B | C/D | All | All | A/B | C/D | All | All | |||
| 0 | 0 | 8 | 0 | 0% | 0 | 37 | 0 | 0% | 0 | 0% |
| 1–20 | 33 | 172 | 29 | 16% | 37 | 143 | 33 | 18% | 23 | 13% |
| 21–40 | 101 | 0 | 39 | 22% | 143 | 0 | 146 | 81% | 32 | 18% |
| 41–60 | 46 | 0 | 110 | 61% | 0 | 0 | 1 | 1% | 97 | 54% |
| 61–80 | 0 | 0 | 2 | 1% | 0 | 0 | 0 | 0% | 28 | 16% |
| 81–100 | 0 | 0 | 0 | 0% | 0 | 0 | 0 | 0% | 0 | 0% |
| >100 | 0 | 0 | 0 | 0% | 0 | 0 | 0 | 0% | 0 | 0% |
| Total | 180 | 180 | 180 | 100% | 180 | 180 | 180 | 100% | 180 | 100% |
| No. of Hospital | Service Area (km2) | |||||||
|---|---|---|---|---|---|---|---|---|
| Hospital Group A/B | Hospital Group C/D | |||||||
| No. of Hospital | Non Network | Network | % Change | No. of Hospital | Non Network | Network | % Change | |
| 1 | 11 | 4573 | 6685 | 46% | 7 | 257 | 254 | −1% |
| 2 | 4 | 1731 | 2511 | 45% | 0 | 0 | 0 | |
| 3 | 1 | 338 | 482 | 43% | 3 | 142 | 0 | −100% |
| 4 | 6 | 3007 | 4117 | 37% | 5 | 429 | 93 | −78% |
| 5 | 6 | 1798 | 2674 | 49% | 3 | 316 | 296 | −6% |
| 6 | 4 | 1675 | 2104 | 26% | 6 | 284 | 212 | −25% |
| 7 | 2 | 873 | 1099 | 26% | 5 | 364 | 347 | −5% |
| 8 | 1 | 440 | 570 | 30% | 1 | 47 | 100 | 110% |
| Total | 35 | 14,435 | 20,242 | 40% | 30 | 1841 | 1303 | −29% |
Publisher’s Note: MDPI stays neutral with regard to jurisdictional claims in published maps and institutional affiliations. |
© 2021 by the authors. Licensee MDPI, Basel, Switzerland. This article is an open access article distributed under the terms and conditions of the Creative Commons Attribution (CC BY) license (https://creativecommons.org/licenses/by/4.0/).
Share and Cite
Sreemongkol, K.; Lohatepanont, M.; Cheewinsiriwat, P.; Bunlikitkul, T.O.; Supasaovapak, J. GIS Mapping Evaluation of Stroke Service Areas in Bangkok Using Emergency Medical Services. ISPRS Int. J. Geo-Inf. 2021, 10, 651. https://doi.org/10.3390/ijgi10100651
Sreemongkol K, Lohatepanont M, Cheewinsiriwat P, Bunlikitkul TO, Supasaovapak J. GIS Mapping Evaluation of Stroke Service Areas in Bangkok Using Emergency Medical Services. ISPRS International Journal of Geo-Information. 2021; 10(10):651. https://doi.org/10.3390/ijgi10100651
Chicago/Turabian StyleSreemongkol, Kiatirat, Manoj Lohatepanont, Pannee Cheewinsiriwat, Tanyaluk O. Bunlikitkul, and Jirapong Supasaovapak. 2021. "GIS Mapping Evaluation of Stroke Service Areas in Bangkok Using Emergency Medical Services" ISPRS International Journal of Geo-Information 10, no. 10: 651. https://doi.org/10.3390/ijgi10100651
APA StyleSreemongkol, K., Lohatepanont, M., Cheewinsiriwat, P., Bunlikitkul, T. O., & Supasaovapak, J. (2021). GIS Mapping Evaluation of Stroke Service Areas in Bangkok Using Emergency Medical Services. ISPRS International Journal of Geo-Information, 10(10), 651. https://doi.org/10.3390/ijgi10100651