Article

Multiclassification Method of Landslide Risk Assessment in Consideration of Disaster Levels: A Case Study of Xianyang City, Shaanxi Province

1
Chinese Academy of Surveying and Mapping, Beijing 100830, China
2
Beijing City Interface Technology Co., Ltd., Beijing 100830, China
3
School of Geomatics, Liaoning Technical University, Fuxin 123000, China
*
Author to whom correspondence should be addressed.
ISPRS Int. J. Geo-Inf. 2021, 10(10), 646; https://doi.org/10.3390/ijgi10100646
Submission received: 30 August 2021 / Revised: 18 September 2021 / Accepted: 22 September 2021 / Published: 26 September 2021
(This article belongs to the Special Issue GIScience for Risk Management in Big Data Era)

Abstract

:
Geological disaster risk assessment can quantitatively assess the risk of disasters to hazard-bearing bodies. Visualizing the risk of geological disasters can provide scientific references for regional engineering construction, urban planning, and disaster prevention and mitigation. There are some problems in the current binary classification landslide risk assessment model, such as a single sample type, slow multiclass classification speed, large differences in the number of positive and negative samples, and large errors in classification results. This paper introduces multilevel landslide hazard scale samples, selects multiple types of samples according to the divided multilevel landslide hazard scale grade, and proposes a landslide hazard assessment model based on a multiclass support vector machine (SVM). Due to the objective limitations of the single weighting method, the combined weights are used to determine the vulnerability of the landslide hazard-bearing body, and the analytic hierarchy process (AHP) and entropy method are combined to construct a landslide vulnerability assessment model that considers subjective and objective weights. This paper takes landslide disasters in Xianyang City, Shaanxi Province, as the research object. Based on the landslide hazard assessment model and the landslide vulnerability assessment model, a landslide risk assessment experiment is carried out. It generates the landslide risk assessment zoning map and summarizes the risk characteristics of landslides in various towns. The experimental results verify the feasibility and effectiveness of the proposed model and provide important decision support for decision makers in Xianyang City.

1. Introduction

In recent years, disasters have occurred frequently worldwide, destroying human property and socioeconomic activities [1,2,3]. The potential risks faced by human beings and society are increasing, and disasters have gradually attracted much attention. As one of the largest countries in the world, China has a complex and diverse topography. With the expansion of the scope of human engineering activities, many natural disasters frequently occur [4]. In 2020, according to statistics from the Geological Environment Monitoring Institute of the Geological Survey of China, the number of perennial disaster-affected people in China reached 200 million, and socioeconomic losses exceeded 1 trillion. There were 7840 geological disasters nationwide with a direct economic loss of CNY 5.02 billion, 139 deaths or missing persons, and 58 injuries. Among the Chinese geological disasters, there were 4810 landslides, 1797 collapses, 183 ground collapses, 899 mudslides, 8 instances of ground subsidence, and 143 ground fissures events. The situation of geological disaster prevention and control remains severe in China.
Despite the increasingly severe disaster situation and the shortage of land resources [5,6], disaster prevention and mitigation work are gradually progressing [7]. It is critical to establish a correct and effective geological disaster risk assessment system and analyze the magnitude of disaster risk for effective disaster prevention and mitigation. In 1991, the United Nations Humanitarian Department defined the natural disaster risk calculation and proposed the expression “risk = function (hazard, vulnerability)”. This calculation method has been recognized by most researchers, marking the transformation of disaster risk assessment from qualitative to quantitative research [8]. With the in-depth study of geological disasters, machine learning has been widely used in landslide risk assessment. In the selection of evaluation factors and calculation of weights [9,10,11,12,13,14,15,16,17,18,19,20,21], Lee et al. analyzed the relationship between landslides and various influencing factors, and achieved the risk zoning [22]. Zhao et al. used the Shannon entropy theory, a fuzzy comprehensive method, and an analytic hierarchy process (AHP) to assess landslide sensitivity [23]. In the process of landslide hazard assessment [24,25,26,27,28,29,30,31,32], Yu et al. combined the geographically weighted regression, particle swarm optimization (PSO), and support vector machine (SVM) to map the landslide sensitivity in the Three Gorges Reservoir of Wanzhou District [33]. Xu et al. integrated the entropy index into an SVM to realize landslide susceptibility assessment in Shaanxi Province [34]. In the process of landslide risk assessment [35,36,37,38,39,40,41,42,43], Xiao et al. combined the random forest model and the deterministic coefficient model to evaluate the risk of landslides in Wanzhou District [43]. Pradhan et al. discussed the application of the BP neural network model in landslide risk assessment [44]. The research results of geological disaster risk assessment are fruitful. The evaluation methods are being increasingly perfected, and the accuracy of the evaluation is gradually improving.
However, the existing classification models used in landslide risk assessments are mostly binary classification models. The impact of different landslide disaster scales on disaster risk assessment is not considered, and there is a lack of multiclassification studies on landslide disaster scales. When using the binary classification model for multiclassification tasks, there is a problem of slow classification speed. The sample classification error is large due to the large difference between the numbers of positive and negative samples. Therefore, it is necessary to establish a geological disaster risk assessment system based on the scale of landslide disasters, identify multicategory geological disaster risk assessment models, and carry out quantitative research on the scale of various disasters [45].
This paper combines landslide hazard assessment based on multiclass SVM and landslide vulnerability assessment with subjective and objective weights, and proposes a landslide risk assessment that combines multiclass SVM and combined weights. The main contributions are summarized as follows:
(1)
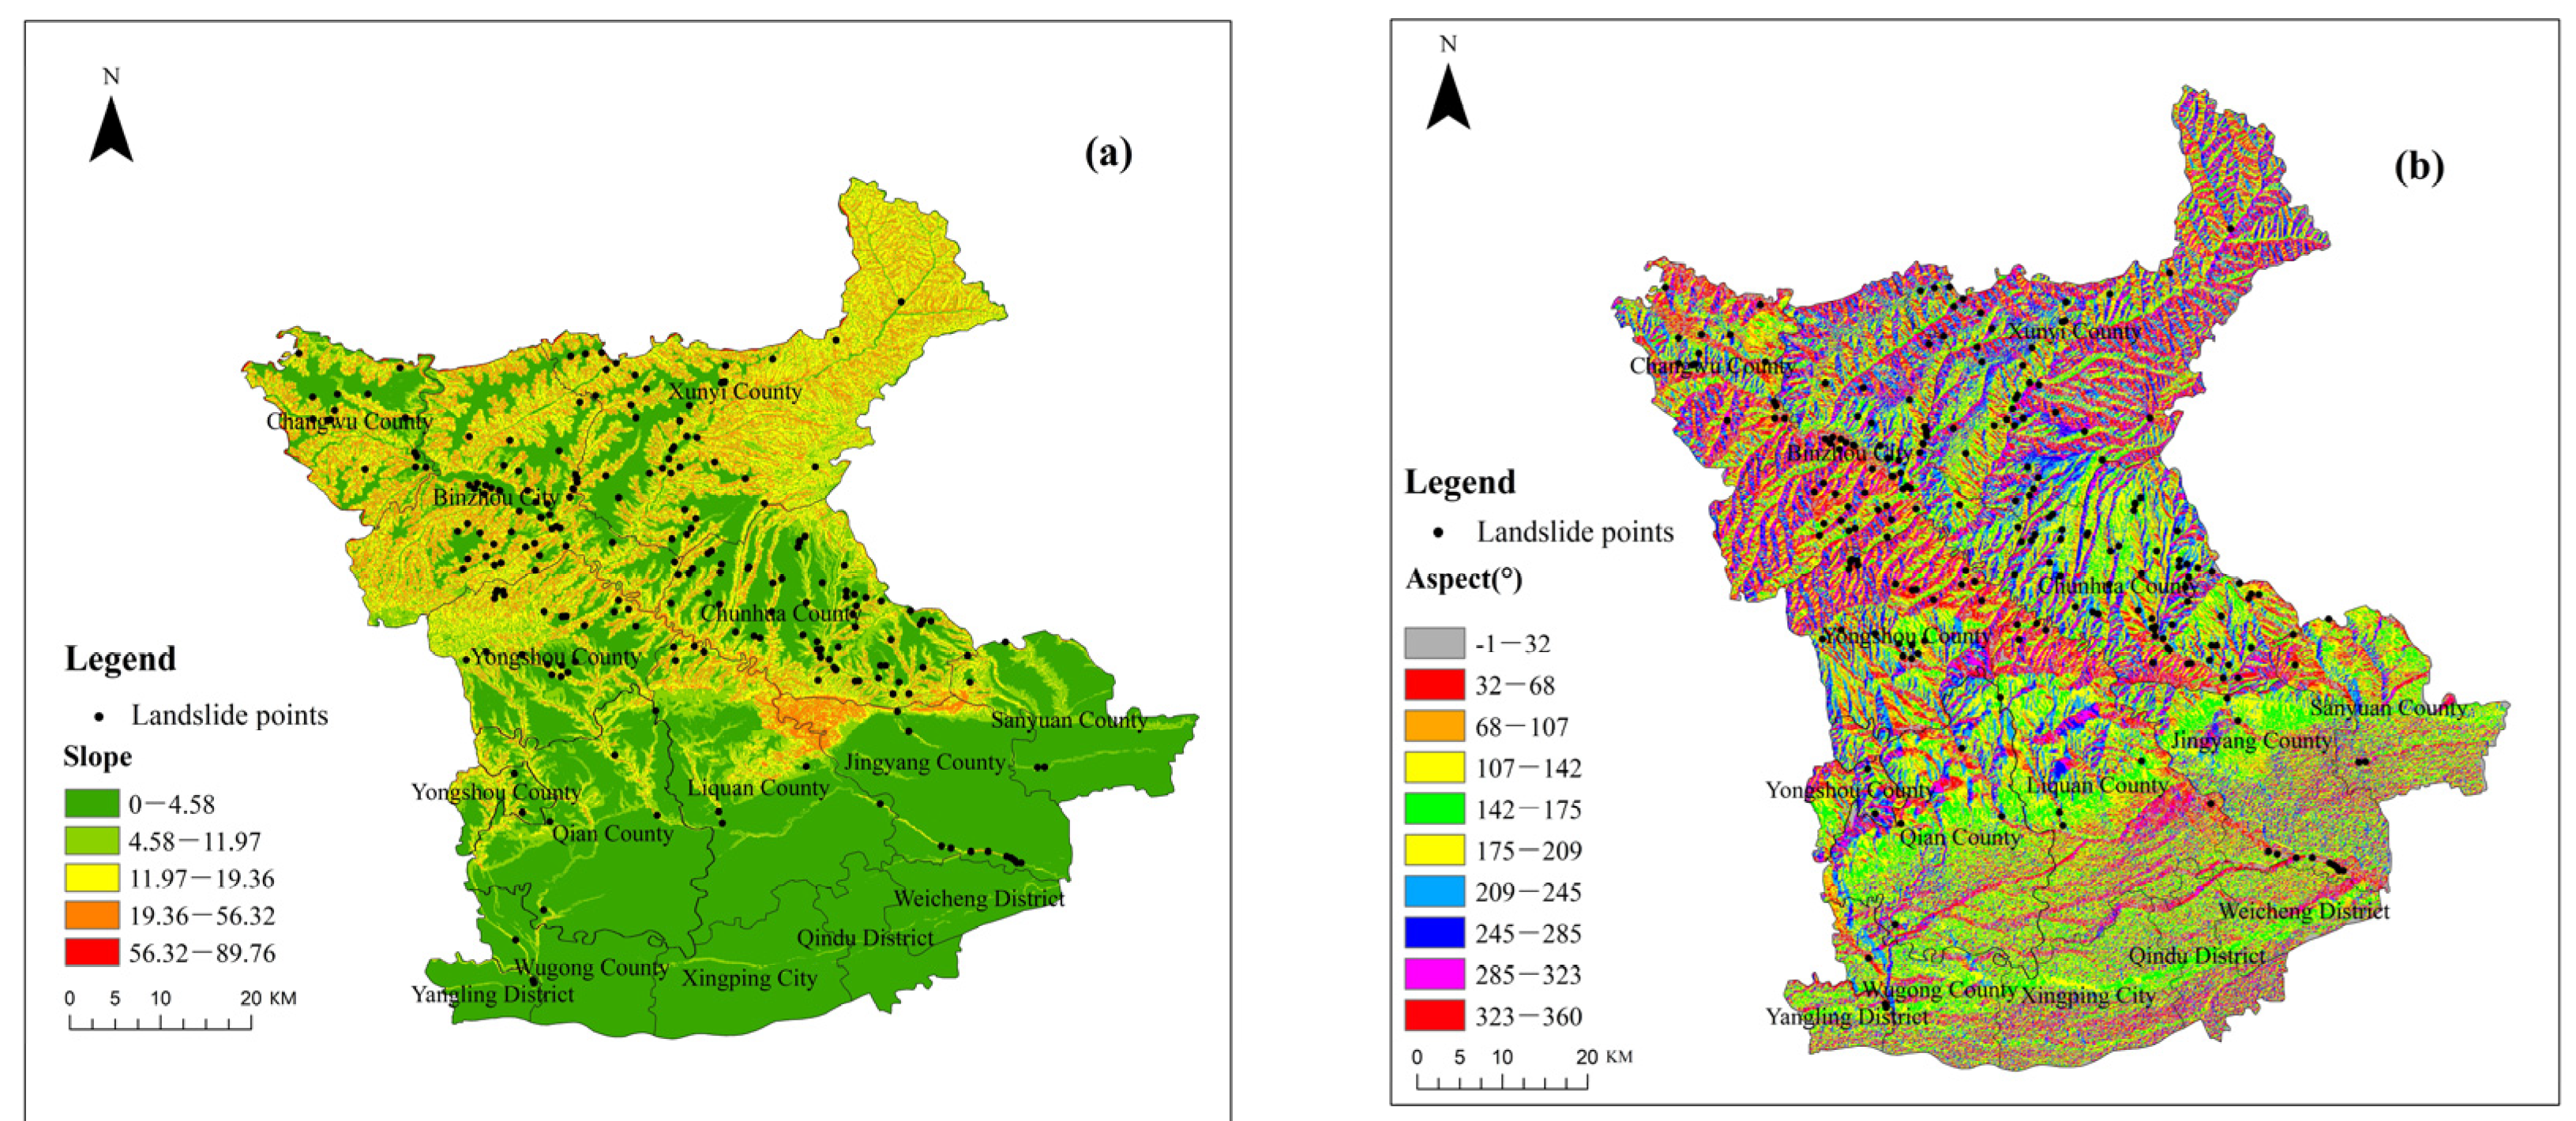
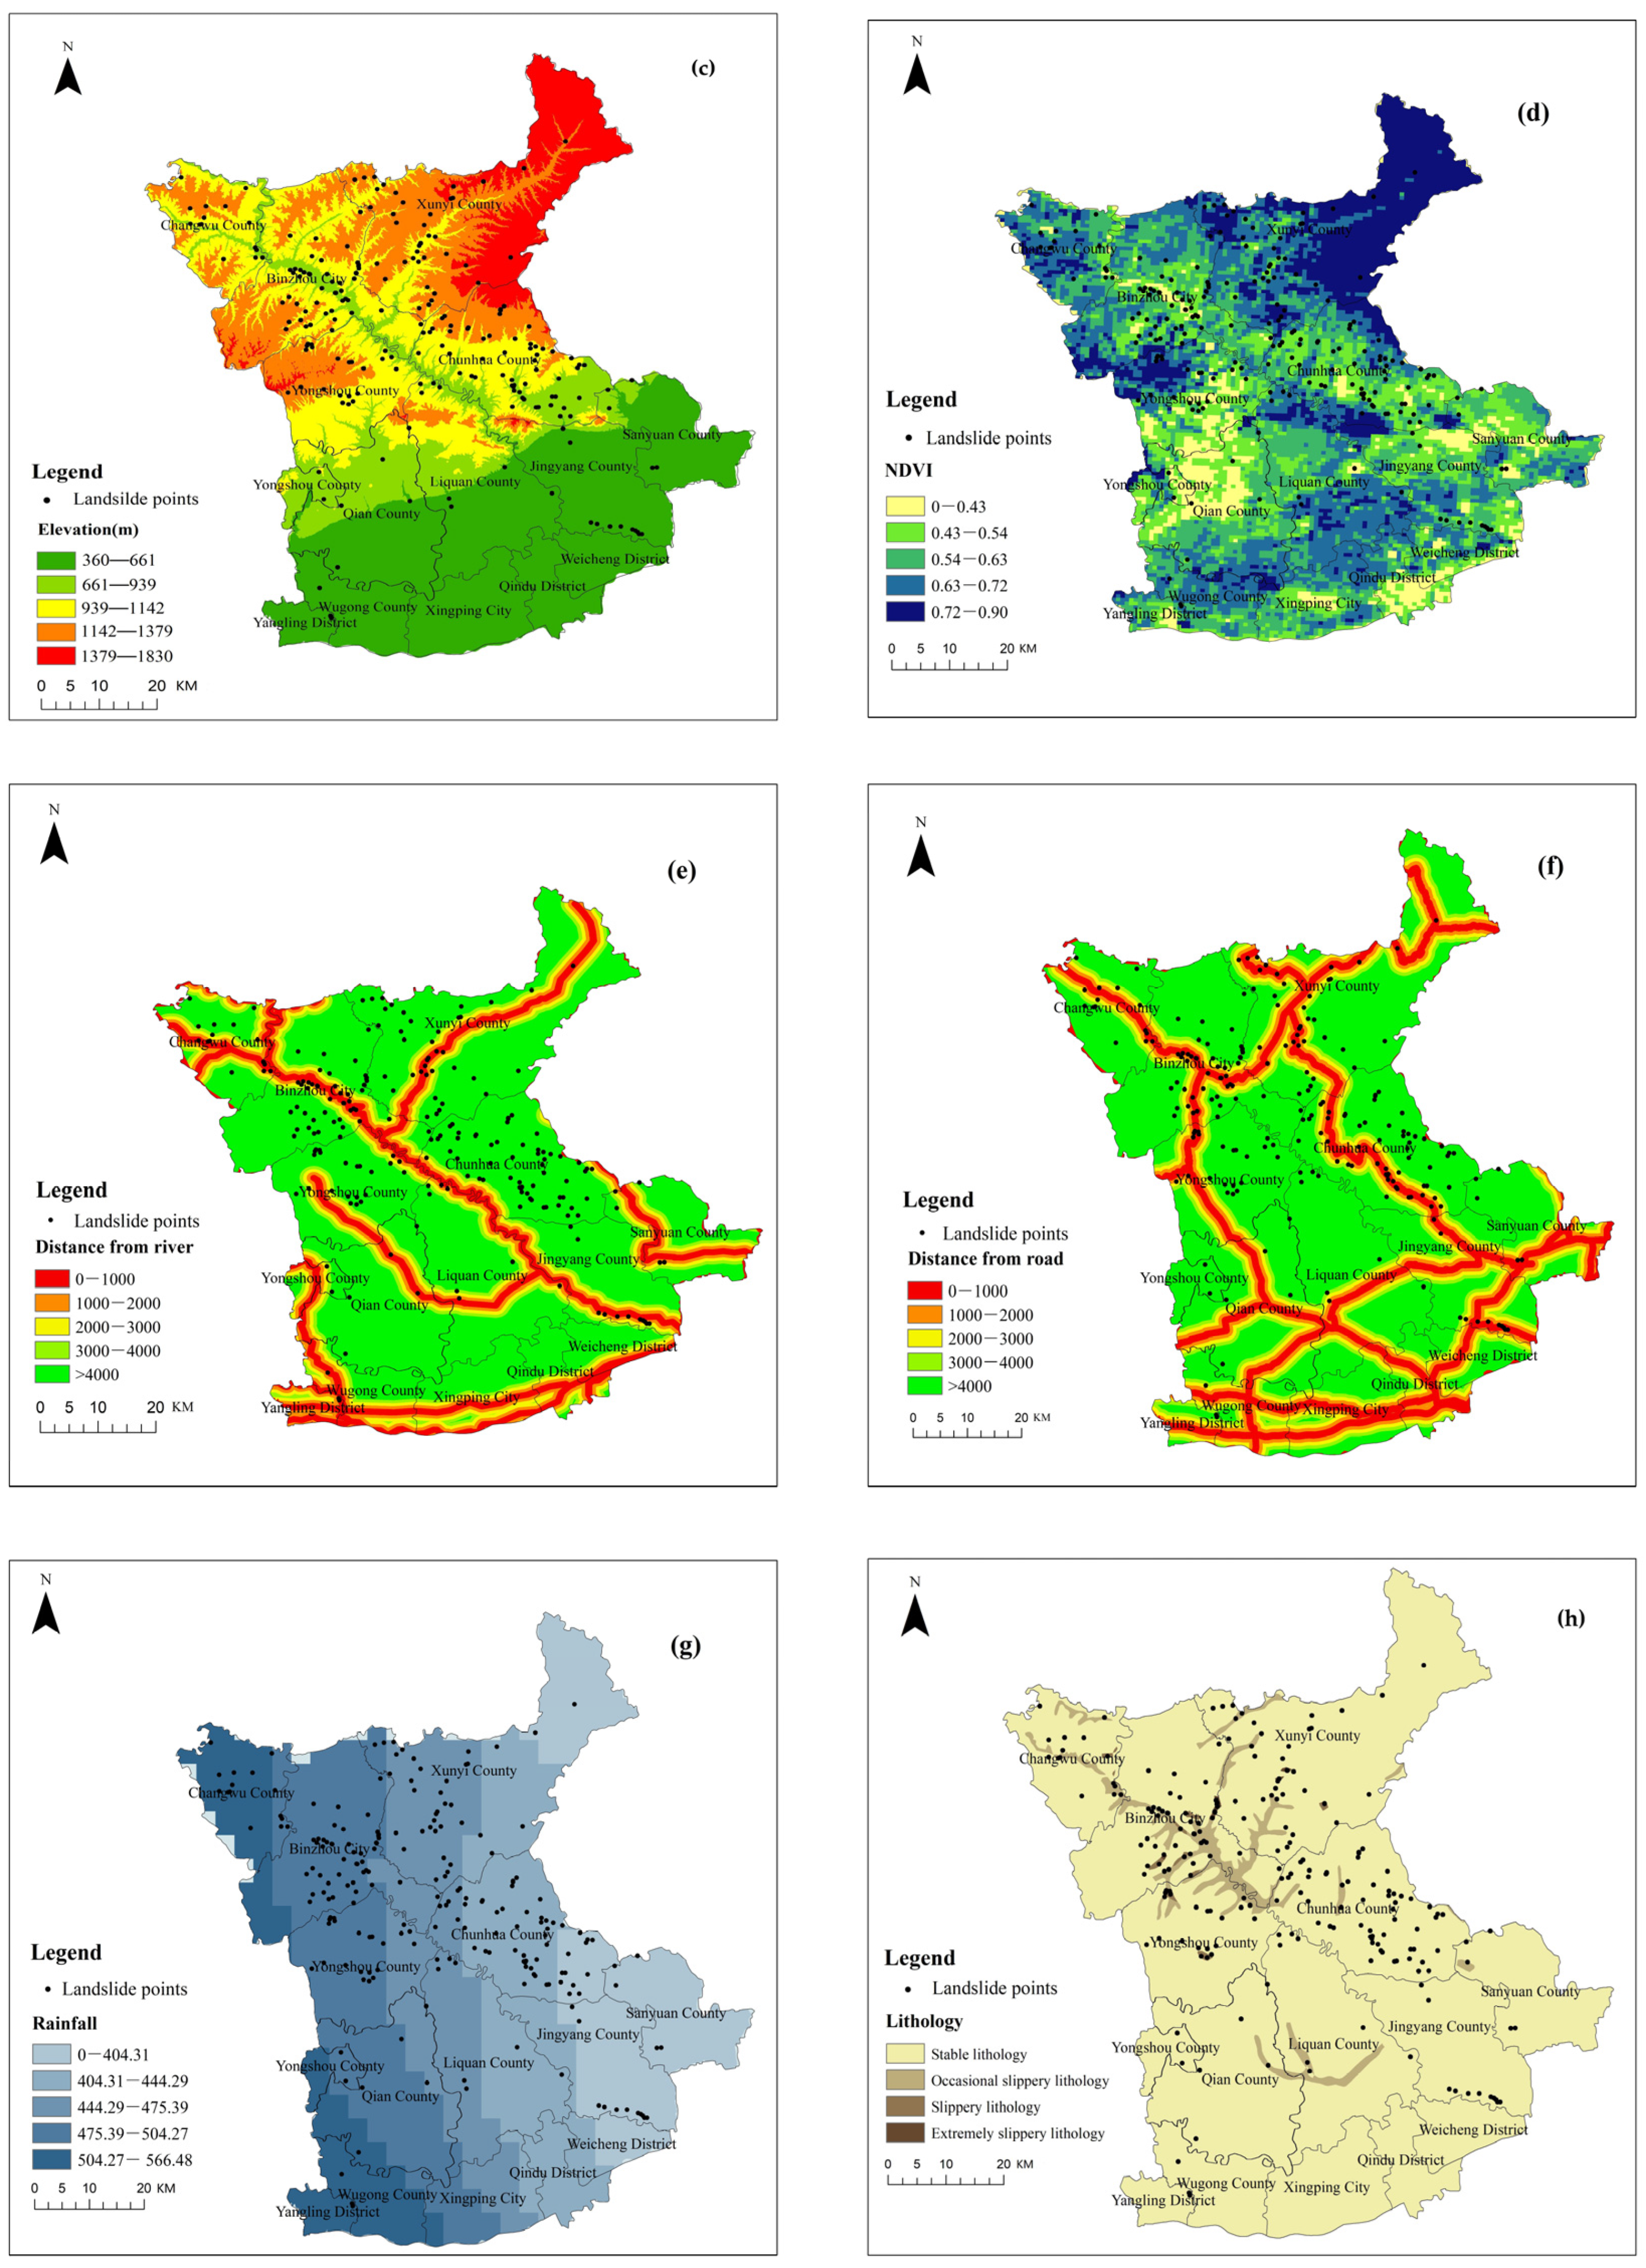
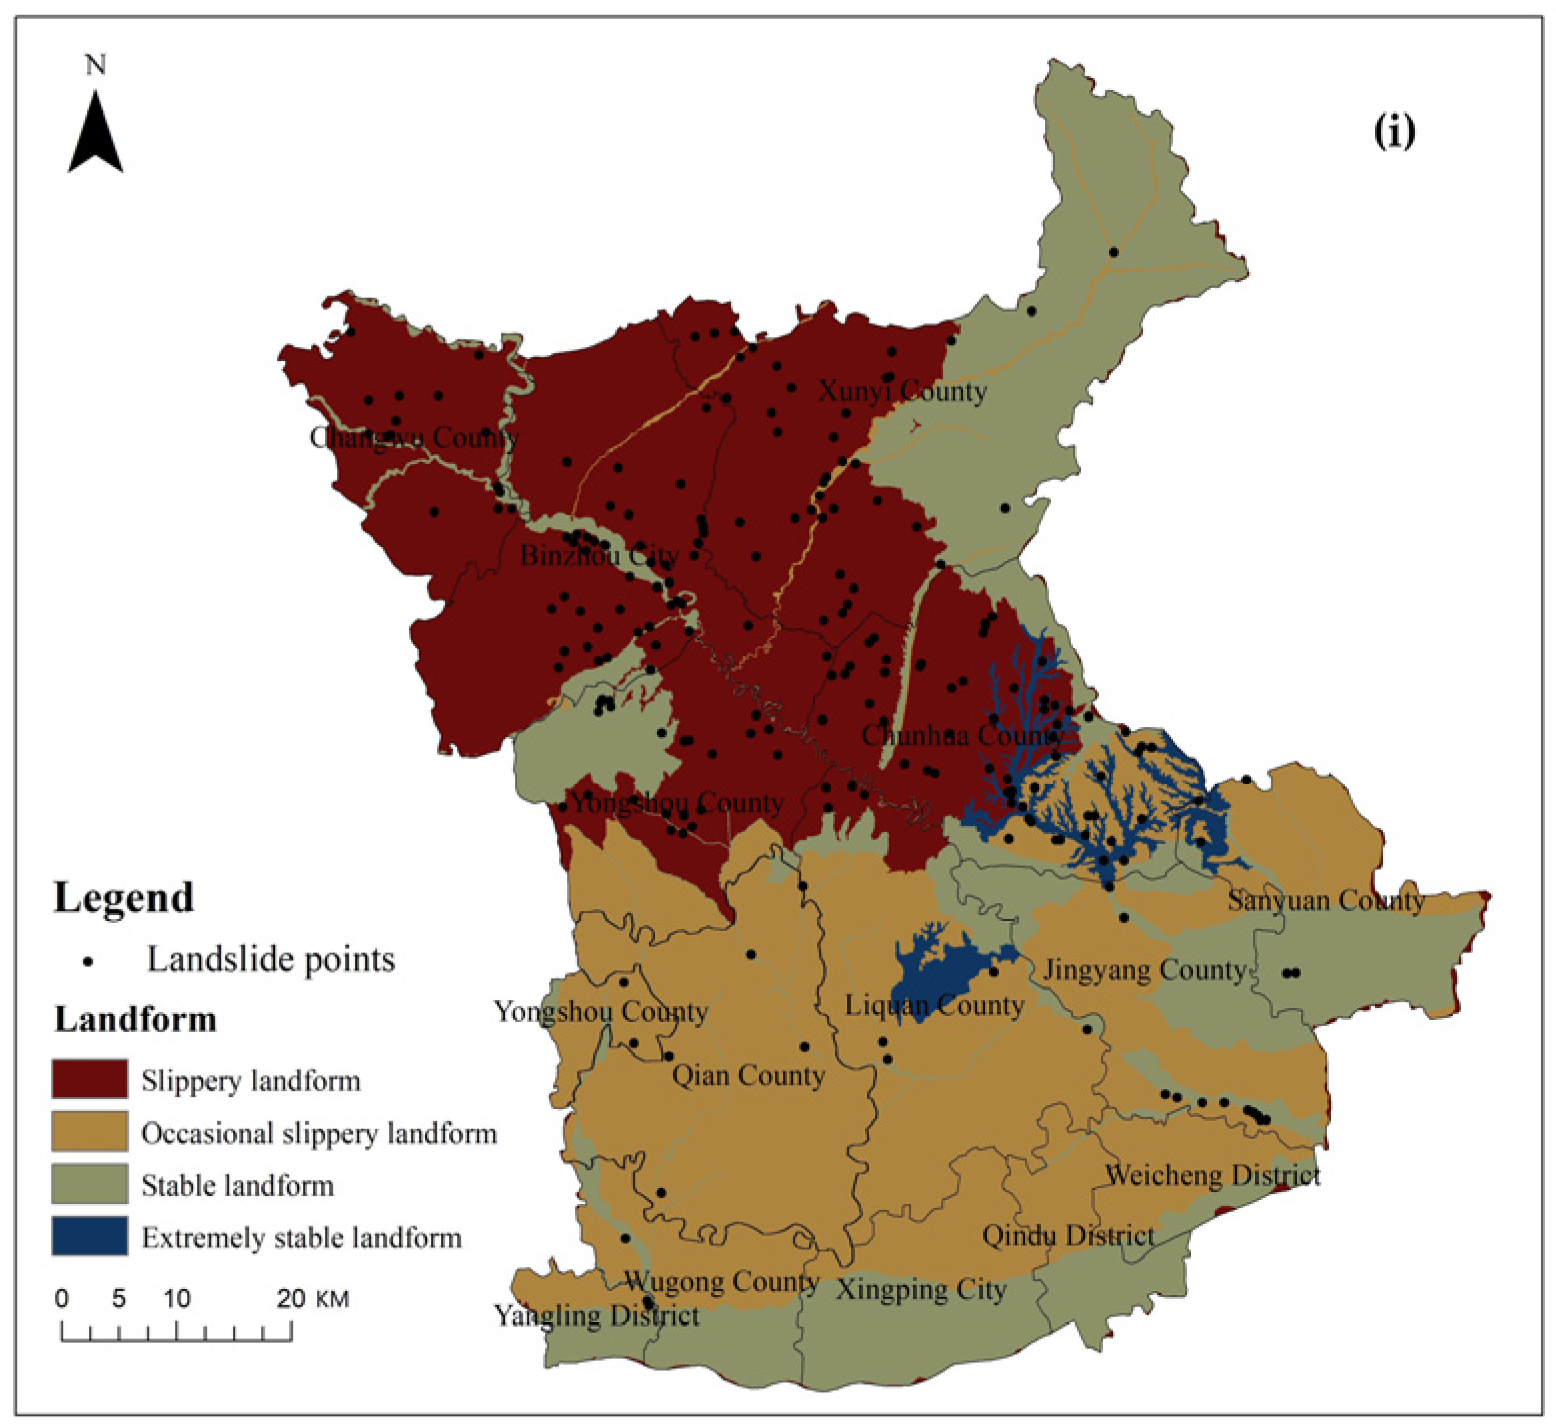
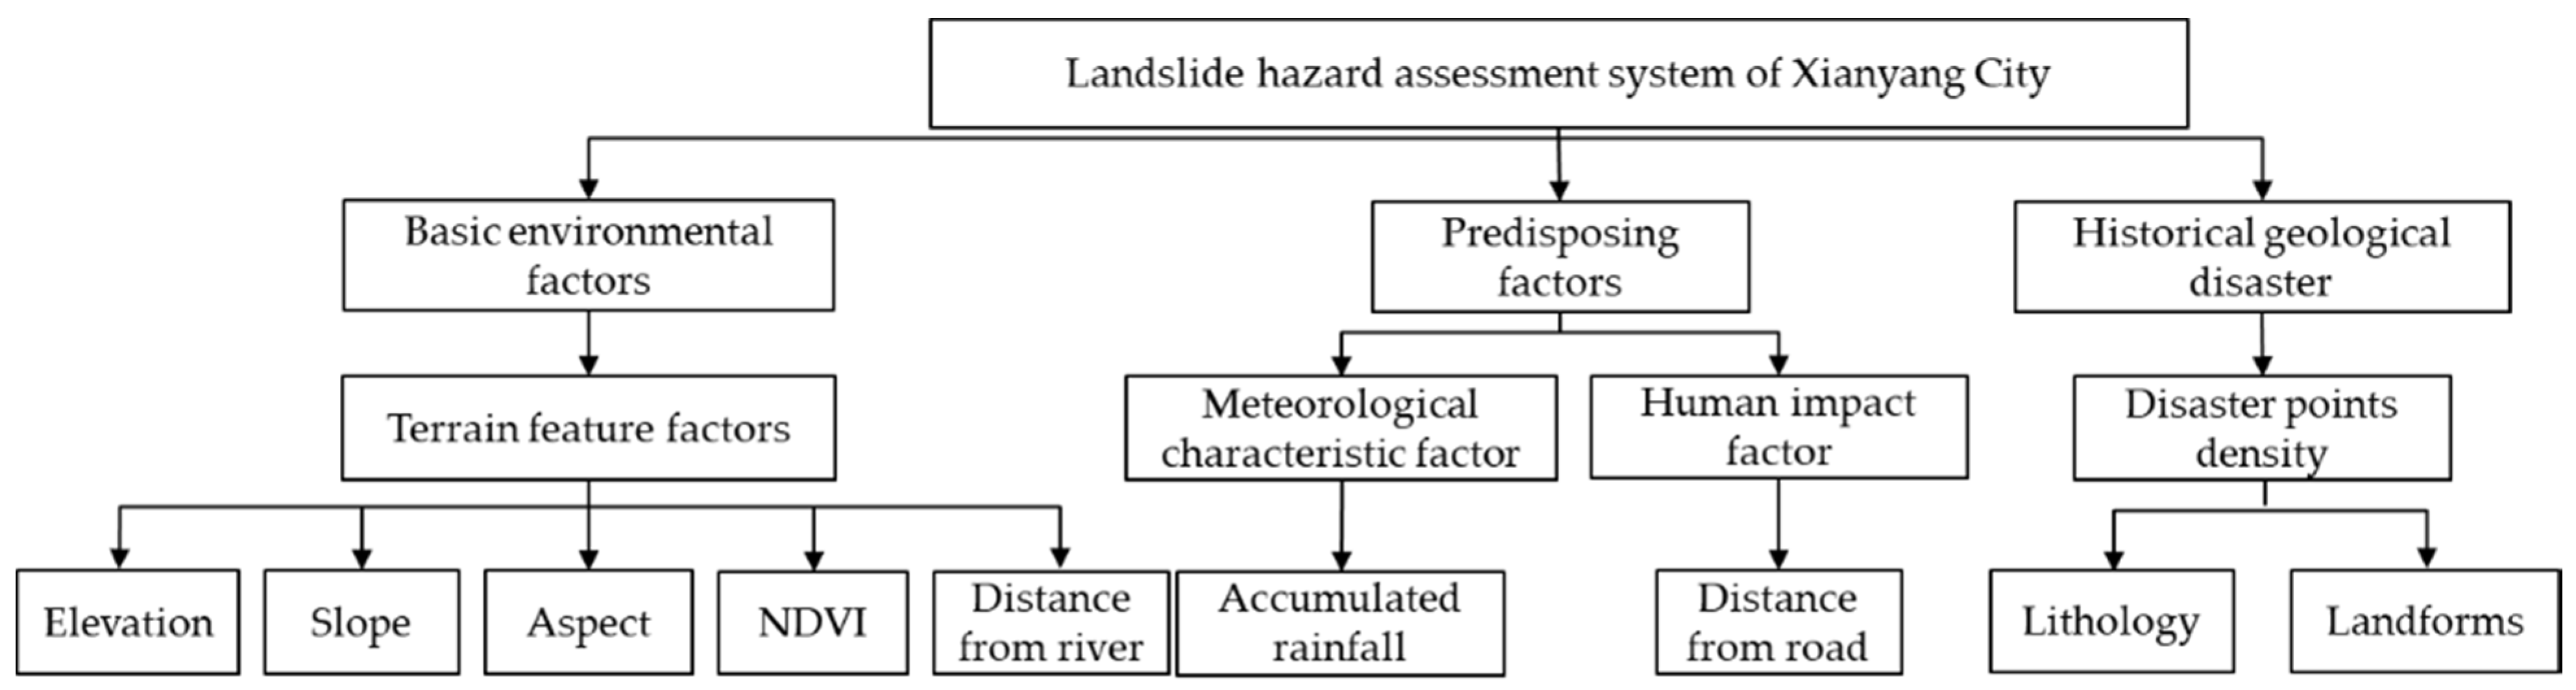
Nine evaluation factors are selected from the four aspects of terrain features, meteorological features, human influence, and historical geological disasters to construct the landslide hazard evaluation index system: elevation, slope, aspect, normalized difference vegetation index (NDVI), distance from rivers, accumulated rainfall, distance from roads, lithology, and landforms. Using the idea of multiclassification, a landslide hazard assessment model based on a multiclass SVM is proposed. This method selects multitype samples according to the scale of divided multilevel landslide hazards, improves the sample types of landslide classification and is beneficial to the hazard assessment of multilevel landslide disasters.
(2)
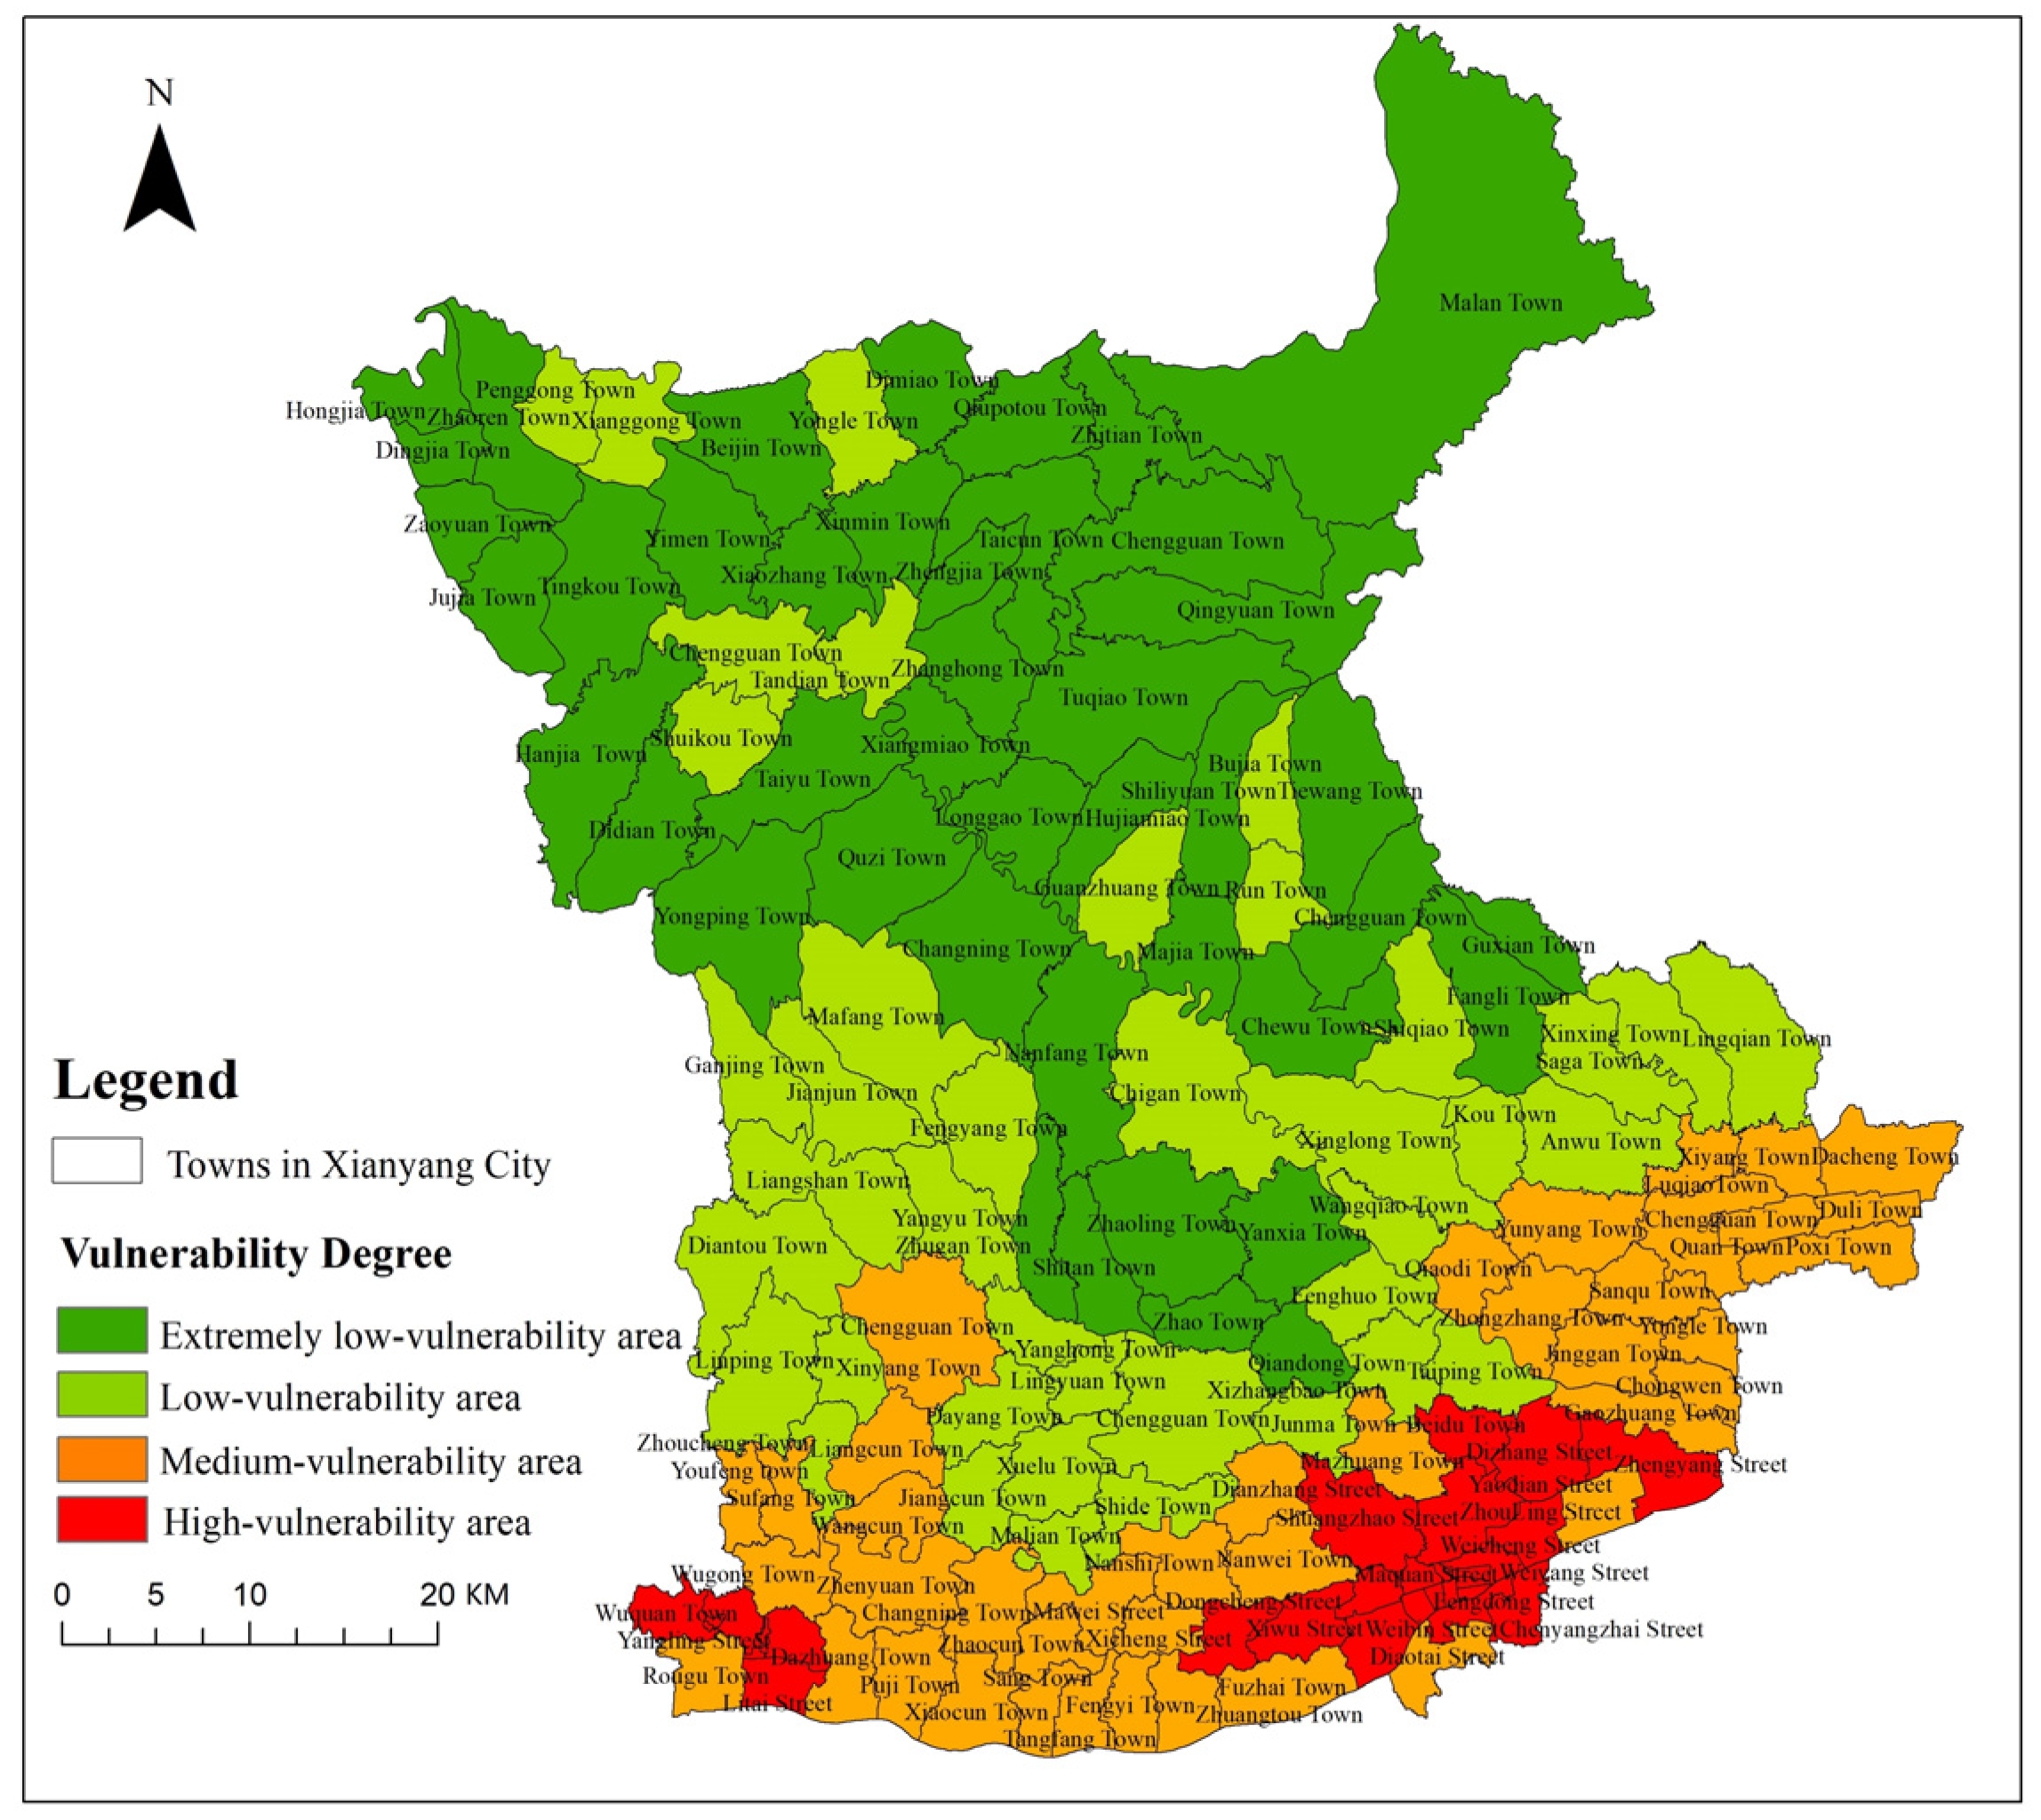
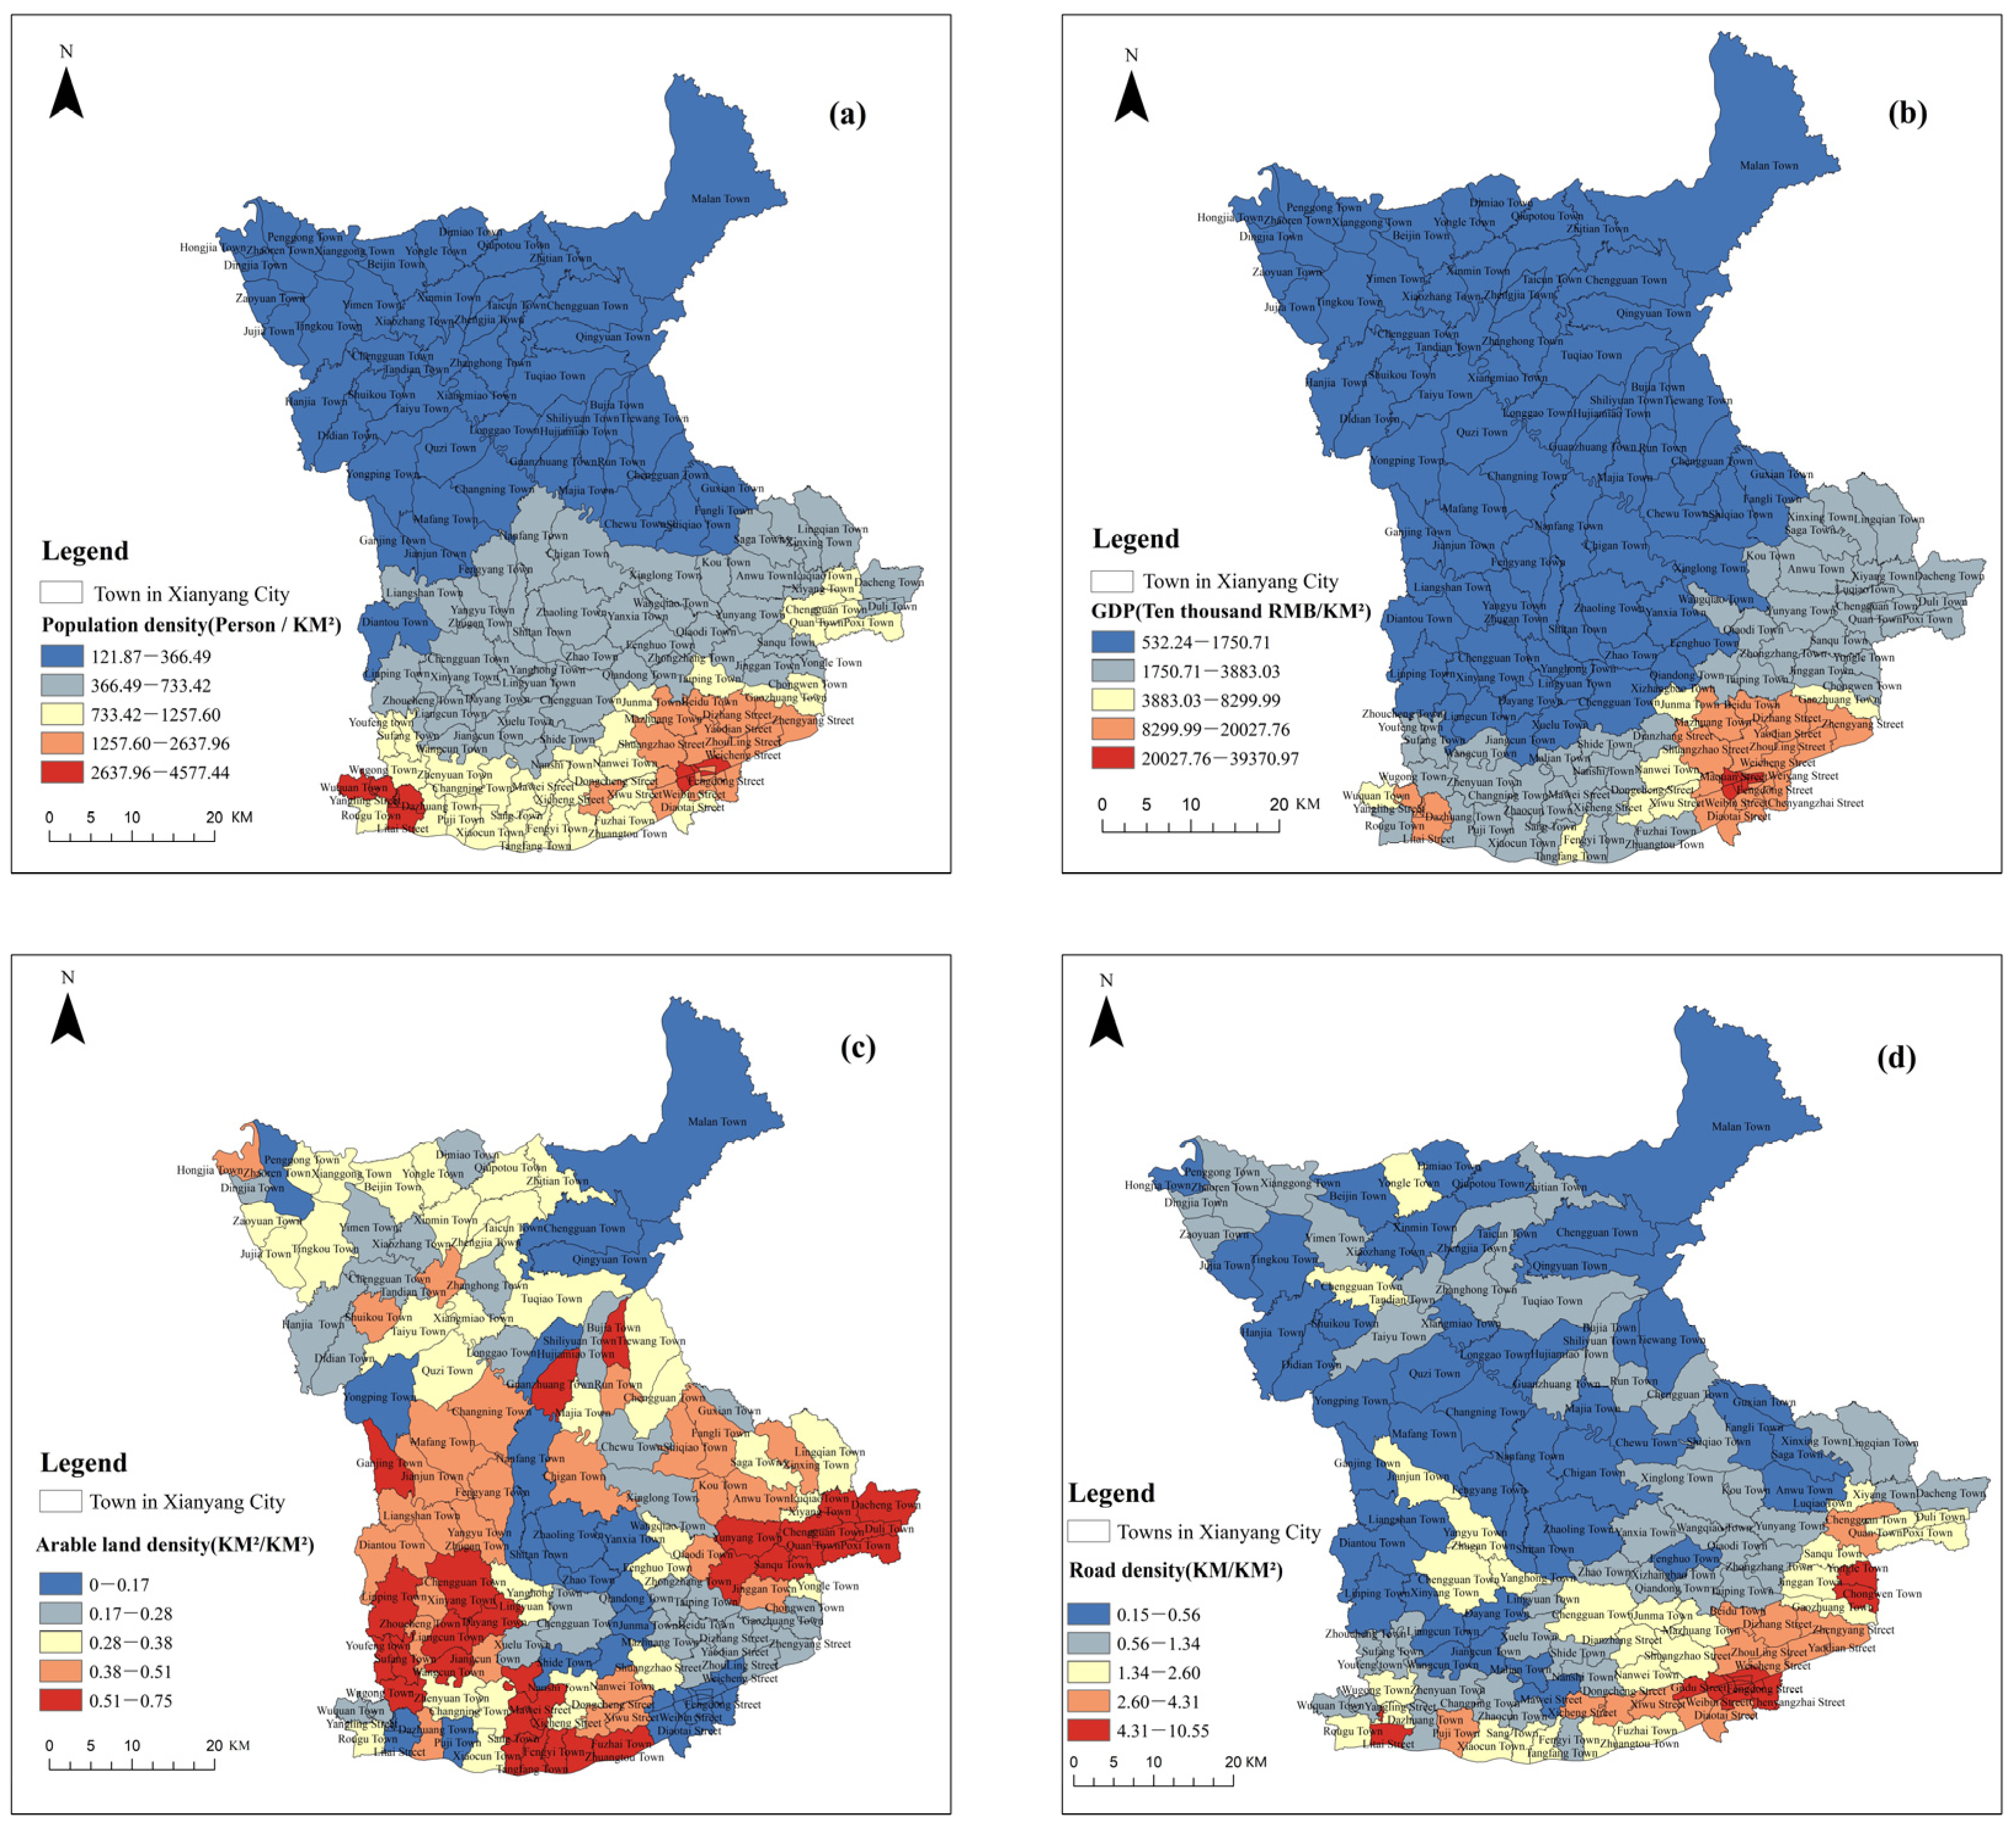
Four evaluation factors for landslide vulnerability are selected from the three aspects of population vulnerability, economic vulnerability, and material vulnerability to construct a landslide vulnerability evaluation index system: population density, arable land density, GDP density, and road density. Combining the AHP and the entropy method, a landslide vulnerability assessment model that considers the subjective and objective weights is proposed. This paper evaluates the vulnerability of landslides by combining subjective and objective weighting calculation methods, combines the advantages of subjective and objective methods, and avoids the objective limitations caused by a single weighting method.
(3)
Taking the landslide in Xianyang city of Shaanxi Province as the research object and taking the towns as the evaluation unit, the landslide risk assessment is carried out based on the landslide hazard assessment model and the landslide vulnerability assessment model. This paper generates the landslide risk assessment zoning map of the study area, analyzes the results by using the existing risk levels of landslide points, summarizes the risk characteristics of landslides in various towns, and provides a scientific basis for the implementation of regional disaster prevention and mitigation.

2. Research Area and Data
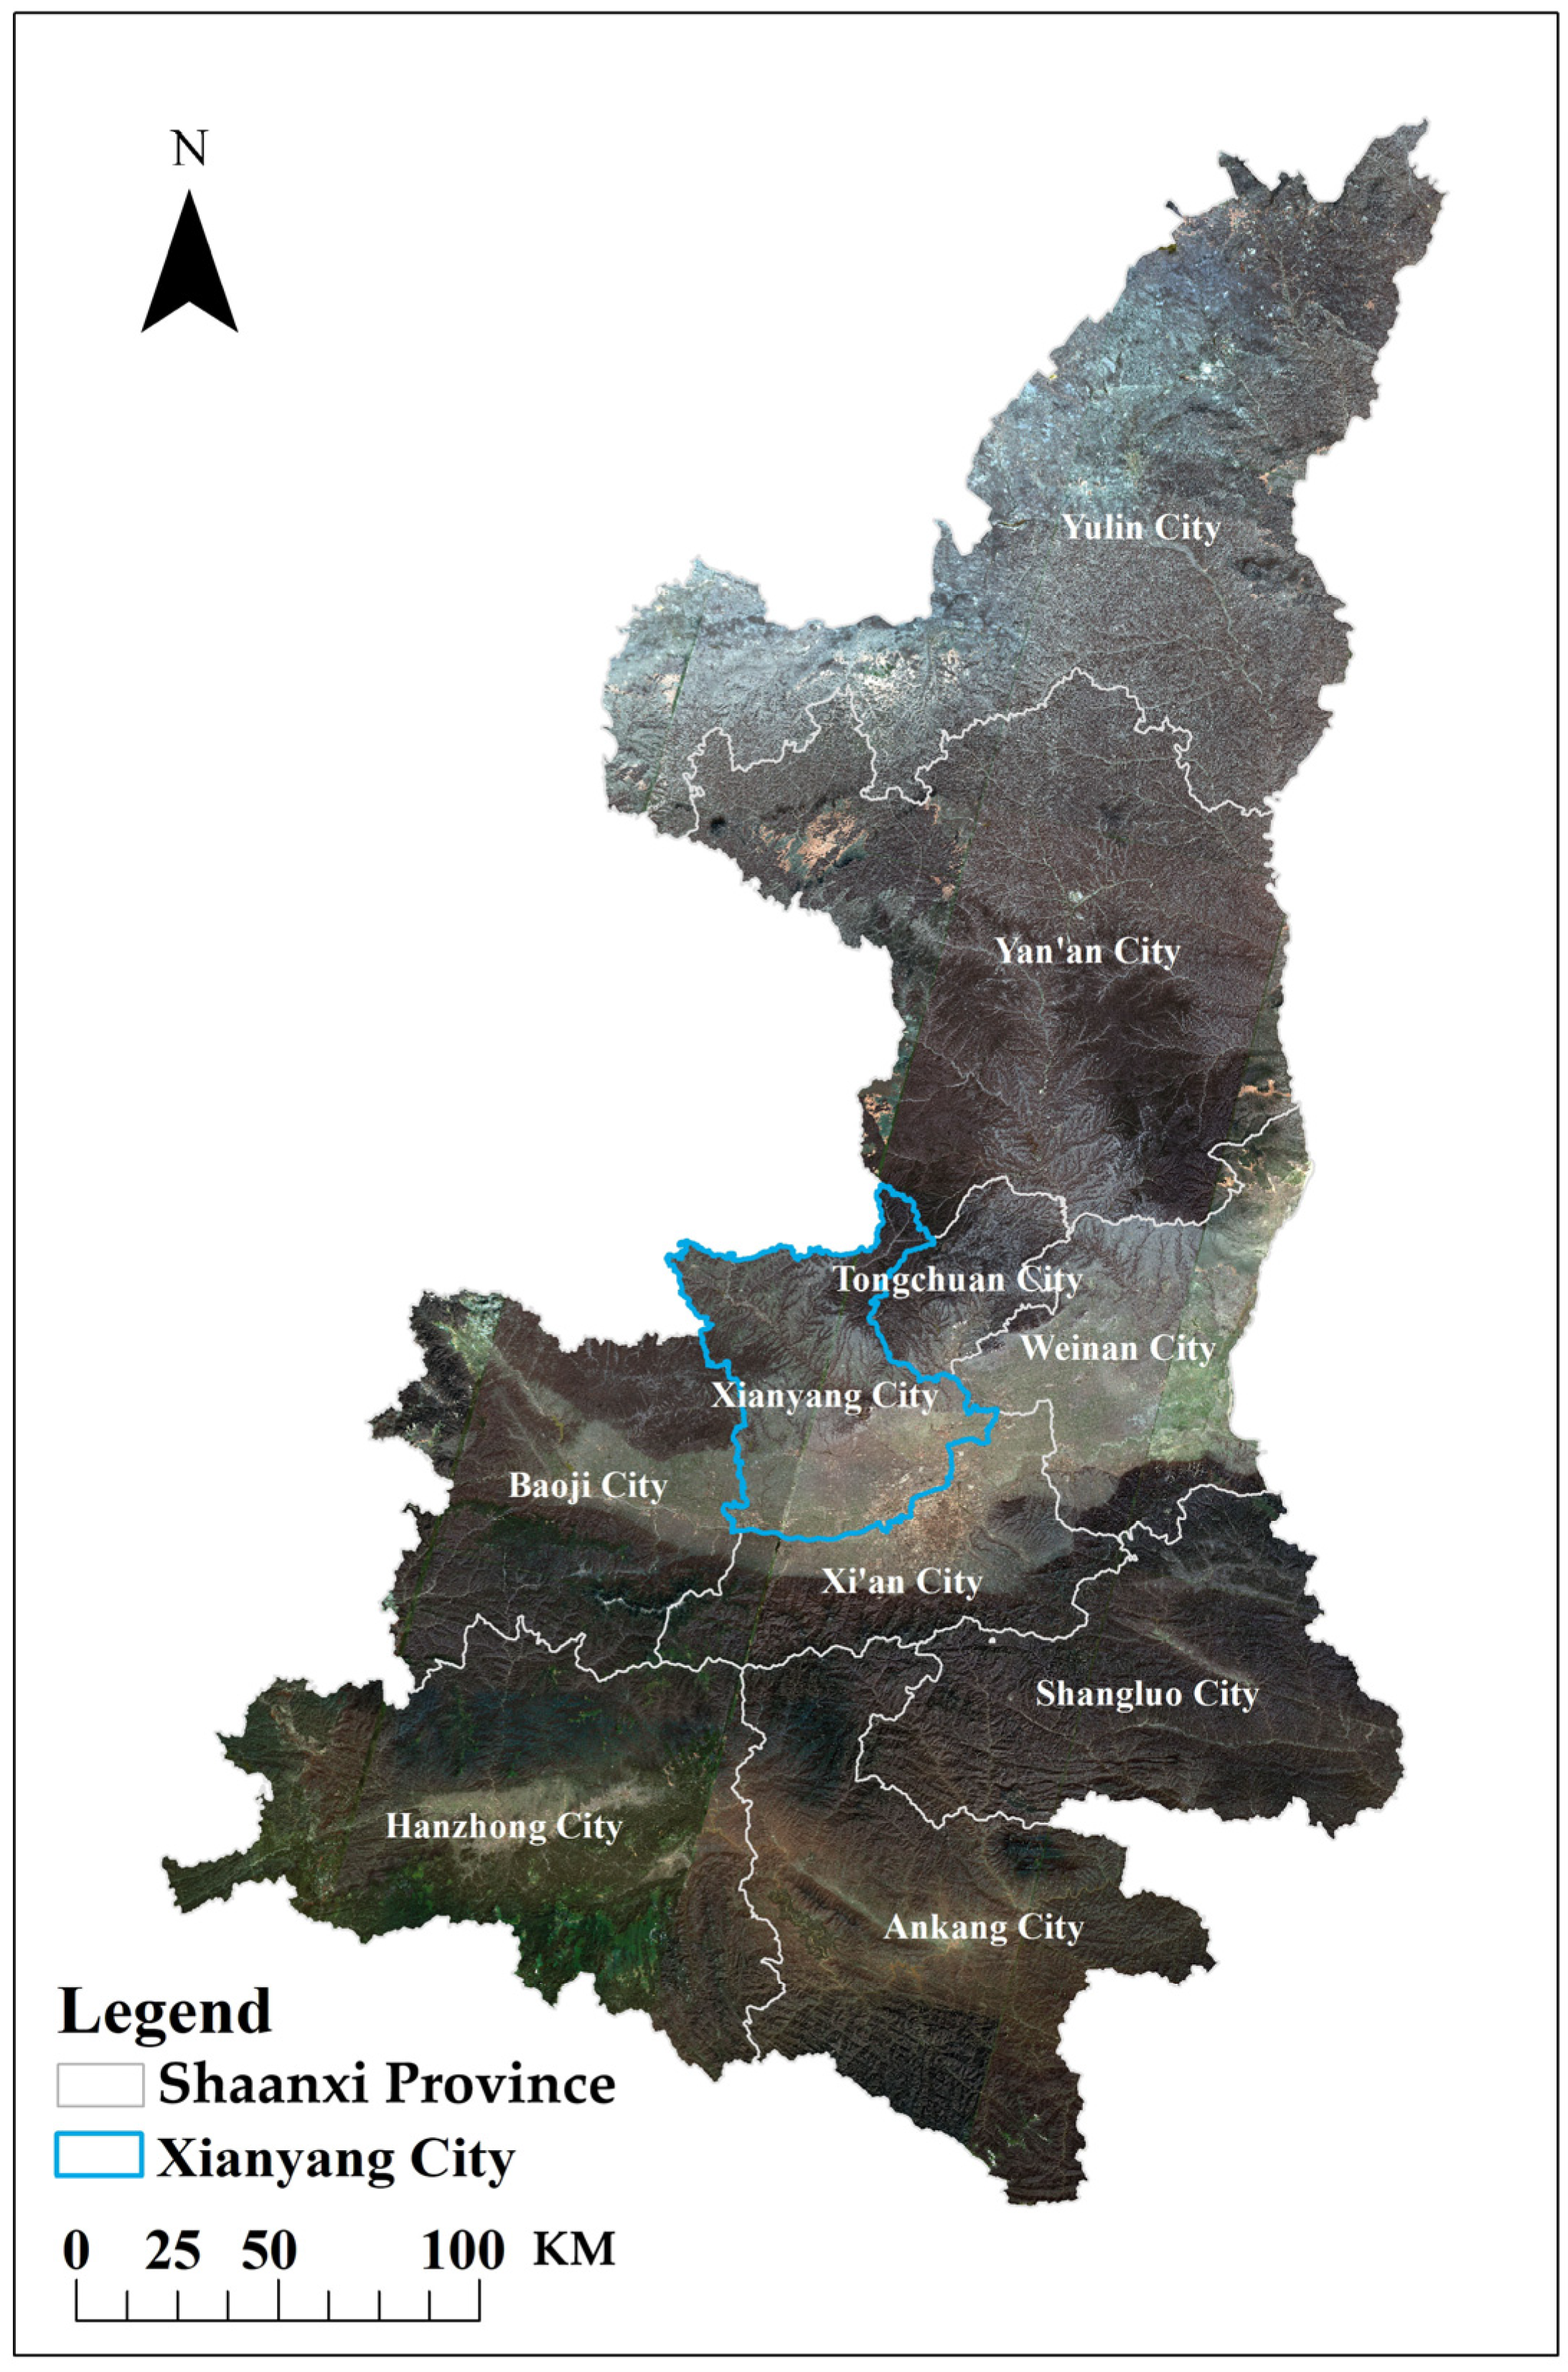
2.1. Research Area

Xianyang City, Shaanxi Province is located between 107°38′ E–109°10′ E and 34°9′ N–35°34′ N. It is in the central part of the Guanzhong Basin, with a total area of approximately 9543.6 km2. The terrain is higher in the north and lower in the south, leaning from north to south in a stepped shape. The northwest is the Weibei Loess Plateau, with an altitude of 1000–1800 m, and the terrain is mostly a semiarid gully area. The southeast is the Weihe Basin, and the terrain is flat and open, with an altitude of 400–800 m. The annual rainfall is mainly concentrated between July and October. The average annual precipitation is 537–650 mm. The river level is greatly affected by precipitation. There are more than 5400 large and small rivers and channels, and the river network density reaches 0.86 km/km2. The rainfall in the territory is more in the south and less in the north, with obvious monsoon characteristics, and the annual average rainfall changes greatly. As a result, the seasonal changes in river runoff are great, and the changes in flood and dry flow are obvious. The remote sensing image of Xianyang City, Shaanxi Province is shown in Figure 1.
Xianyang City has complex geological and geomorphic conditions and strong new geological tectonic activities. It belongs to an area prone to geological disasters. With the development of the social economy, the scale of human engineering activities has gradually expanded, and the hidden dangers of geological disasters have increased significantly. There are six major types of geological disasters in the city: landslides, mudslides, collapses, ground fissures, unstable slopes, and ground subsidence [46,47].

2.2. Data

Landslide risk assessment is jointly determined by natural and social attributes. Natural attributes can reflect disaster intensity, activity scale, incubation conditions, and predisposing factors, which are mainly reflected in the hazard of geological disasters. Social attributes refer to the degree of loss related to social characteristics such as life, engineering activities, and economic level, which are closely related to geological disasters [9]; that is, the vulnerability of disaster-bearing bodies. Therefore, in this paper, based on the “Spatial Distribution Data of Geological Disaster Points”, “Spatial Distribution Data of Geological Lithology in China”, and “Spatial Interpolation Dataset of Annual Precipitation in China since 1980” from the Chinese Academy of Sciences’ Data Center for Resource and Environmental Sciences, DEM data from China’s first national geoinformation survey, public road data and water system data provided by OSM, considering three aspects of basic environmental factors, predisposing factors and historical geological disasters, a total of nine evaluation factors in four categories were selected as natural attribute data for landslide hazard assessment. They were terrain characteristic factors (elevation slope, aspect, NDVI, distance from rivers), meteorological characteristic factors (accumulated rainfall), human influence factors (distance from roads), and historical geological disasters (lithology, landforms). The details are shown in Figure 2 and Figure 3. According to “China’s geographical situation monitoring data”, from the three aspects of population vulnerability, economic vulnerability, and material vulnerability, four types of spatial distribution maps were extracted from Xianyang City in 2018 as social attribute data. They were population density, arable land density, GDP density, and road density, as shown in Figure 4. To facilitate statistics and analysis, regular grid units were selected as the risk assessment units of the study area, and the study area was divided into 30 m × 30 m grid units, including 5639 columns, 6098 rows, and 17,059,135 grid units.
The disaster data in this paper were derived from the “Spatial Distribution Data of Geological Hazard Points” from the Data Center for Resources and Environmental Science of the Chinese Academy of Sciences. The data format was Microsoft Excel and vector shape files, including landslides, mudslides, collapses, ground fissures, unstable slopes, and ground subsidence, with a total of 637 disaster points.

3. Landslide Risk Assessment Method

This section shows the classification standard of the geological disaster scale and classification standard of geological disasters, and introduces the multiclass SVM landslide hazard assessment model and landslide vulnerability assessment model, which consider the subjective and objective weights to carry out landslide risk assessment.

3.1. Classification of Geological Disaster Scale

According to the “Basic Requirements for Geological Disaster Investigation and Zoning of Counties (Cities)” compiled by the Ministry of Land and Resources of China, the disaster scale and risk level of Xianyang City are divided. The geological disaster scale grade is a classification of geological disasters according to indicators such as geological disaster intensity or influence range [48,49]. Generally, the larger the disaster intensity, the greater the hazard of geological disasters and the more disaster-affected objects. According to China’s geological disaster prevention and management measures, the scale of geological disasters is generally divided into four levels: low, medium, high, and extremely high hazard. The classification standards of different geological disasters are shown in Table 1. According to the loss or potential threat caused by geological disasters, the risk degree of geological disasters was divided into four levels: low risk, medium risk, high risk, and extremely high risk, as shown in Table 2.

3.2. Landslide Hazard Assessment Model Based on Multiclass SVM

3.2.1. Multiclass SVM

SVM is based on the principle of structured risk minimization, and was proposed by a Bell Labs research group led by Vapnik in 1963. It has two types: linear and nonlinear [24]. Its basic idea is to find the optimal hyperplane in the sample or feature space to maximize the space between different categories, especially in solving the more common nonlinear high-dimensional multiclassification problems in practical applications. Multiclassification is a given dataset containing N samples, X = { ( x 1 , y 1 ) , ( x 2 , y 2 ) , ( x N , y N ) } , and class labels y n = ( 1 , 2 , , M ) , n = 1 , 2 , N , and the dataset has a total of M classes. According to the decision function y = f ( x ) , we predicted the categories of N sample data. The multiclass SVM could convert the nonlinear problem in the multiclass samples into the linear separable problem in the high-dimensional feature space, find an optimal hyperplane between every two classes, and divide the N samples into M classes for output.
In the sample space, hyperplane h can be expressed as:
w T x + b = 0
where w is the normal vector, which determines the direction of hyperplane h; x is the training sample; and b is the displacement term, which is the distance between the hyperplane and the origin. When w and b are optimal, it means that the optimal hyperplane is found so that the distance between positive and negative samples is the largest.
For the nonlinear classification problem, it is necessary to transform the nonlinear problem in the multiclass samples into the high-dimensional feature space [25] and to find the linear hyperplane in the high-dimensional space to classify the samples. ϕ ( x ) represents the feature vector after sample x is transformed into a high-dimensional space; then, the model corresponding to hyperplane h in the feature space is:
f ( x ) = w T ϕ ( x ) + b
The corresponding objective function is:
min ( w 2 2 )
s . t . y i ( w T ϕ ( x ) + b ) 1 , i = 1 , 2 , 3 , n
By using the Lagrangian multiplier α i , under the constraints of i a i y i = 0 and 0 ≤   α i   ≤ C, the following relationship is obtained:
max : i α i 1 2 i j α i α j y i y j x i T x j
s . t . i = 1 n α i y i = 0 , i = 1 , 2 , 3 , n
where j = 1 , 2 , 3 , m , and i j ; to calculate the above formula, a kernel function K ( x i , y j ) is introduced to reduce the error rate of sample classification. Sample x is converted from low-dimensional space to ϕ ( x ) in high-dimensional space.
K ( x i , y j ) = ϕ ( x i ) T ϕ ( y j )
By inserting K ( x i , y j ) into Equation (5), and after solving, the decision function of the SVM model is obtained:
f ( x ) = w T ϕ ( x ) + b = s i g n ( i = 1 n y i α i K ( x i , y j ) + b )
The classification accuracy of SVM depends on the selection of the kernel function and the setting of related parameters. The kernel function can be selected according to application conditions and sample characteristics. At present, the commonly used kernel functions are the linear kernel function (LN), polynomial kernel function (PL), radial basis function (RBF), and sigmoid kernel function (SIG).

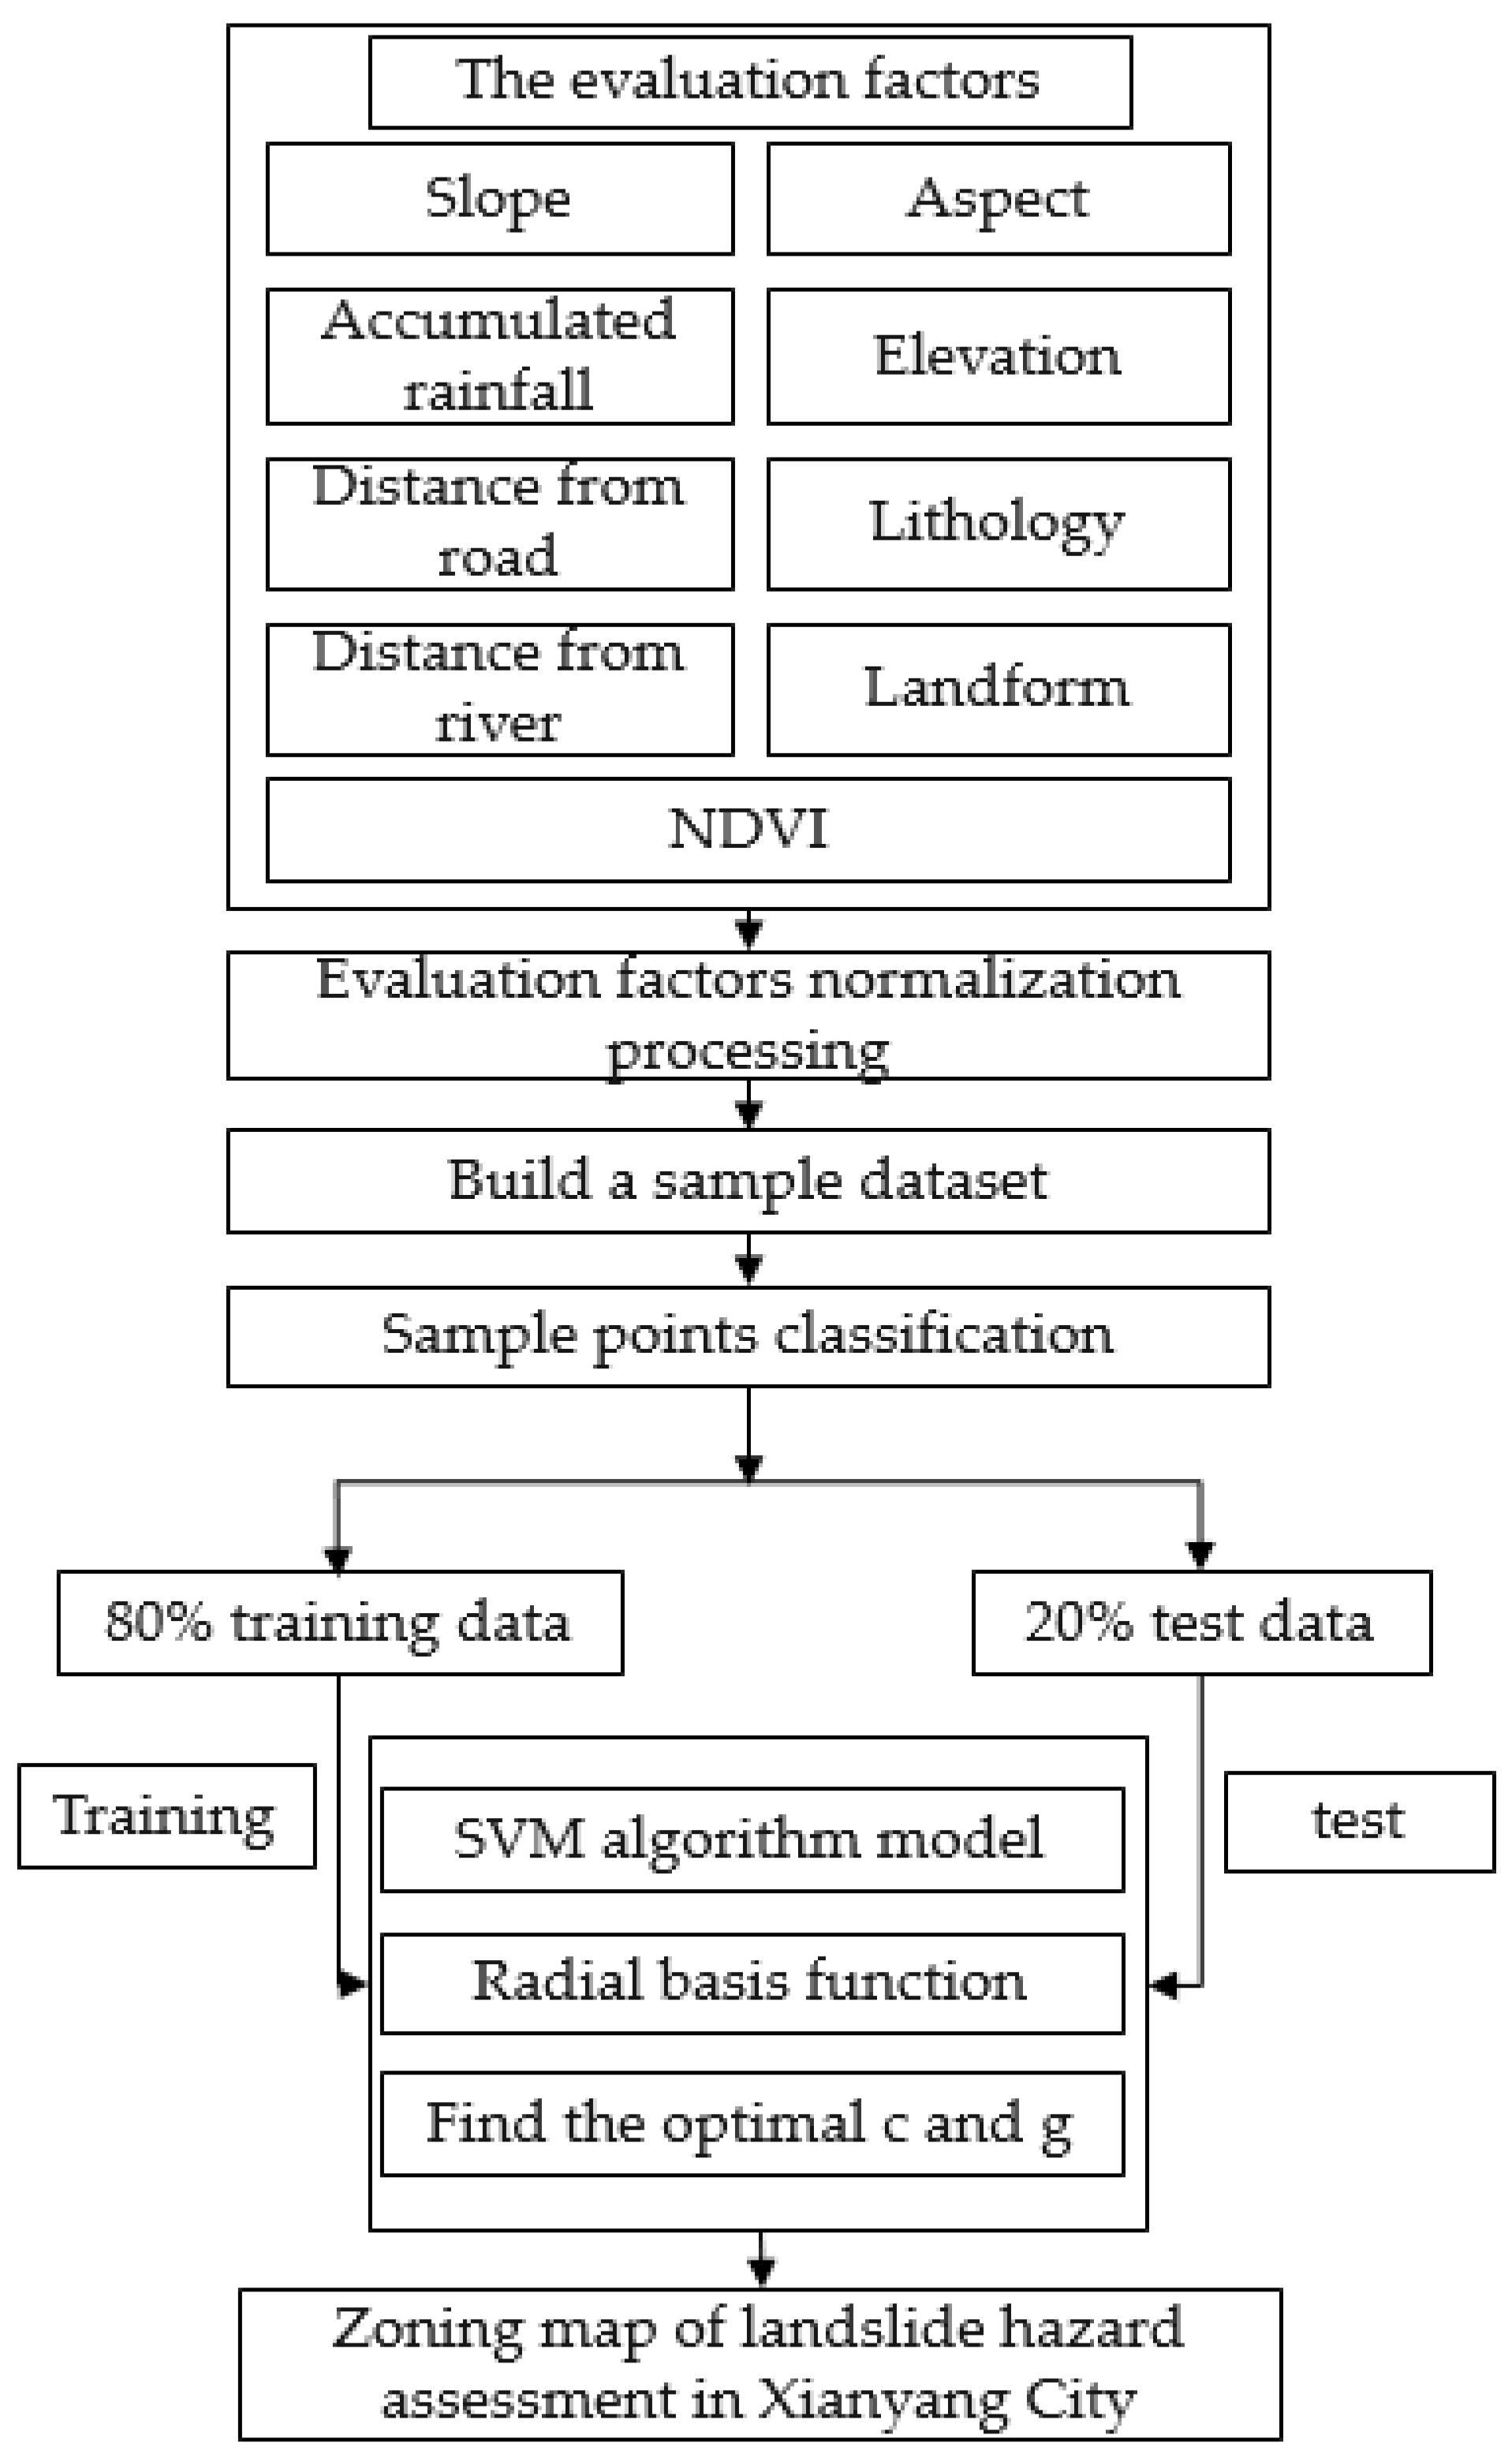
3.2.2. Algorithm Flow

Multitype sample selection based on divided multilevel landslide hazard scale grade can increase the number of disaster classification samples, solve the problem of a single sample type, and improve the classification accuracy of multilevel landslide disasters. Therefore, a multiclass SVM landslide risk assessment model was proposed by combining with the multilevel landslide hazard scale grade. Therefore, the accuracy and reliability of landslide hazard assessment results could be improved. The specific algorithm flow is shown in Figure 5.
The algorithm process was as follows:
(1)
Construction of the landslide hazard assessment index: nine index factors were selected from three aspects to construct the landslide hazard assessment index system in the study area.
(2)
Construction of the sample dataset: units with the same number of landslide hazard points were randomly selected as nongeological hazard units, and the two were combined as the sample dataset.
(3)
Sample point classification: according to the classification standard of the landslide disaster scale, the landslide hazard sample points in the study area were classified by hazard level, and 80% of all samples were selected as the training sample and 20% as the test sample.
(4)
Parameter optimization: the radial basis function was selected for multiclassification of nonlinear samples, and the optimal parameters c and g were selected by the cross-validation method.
(5)
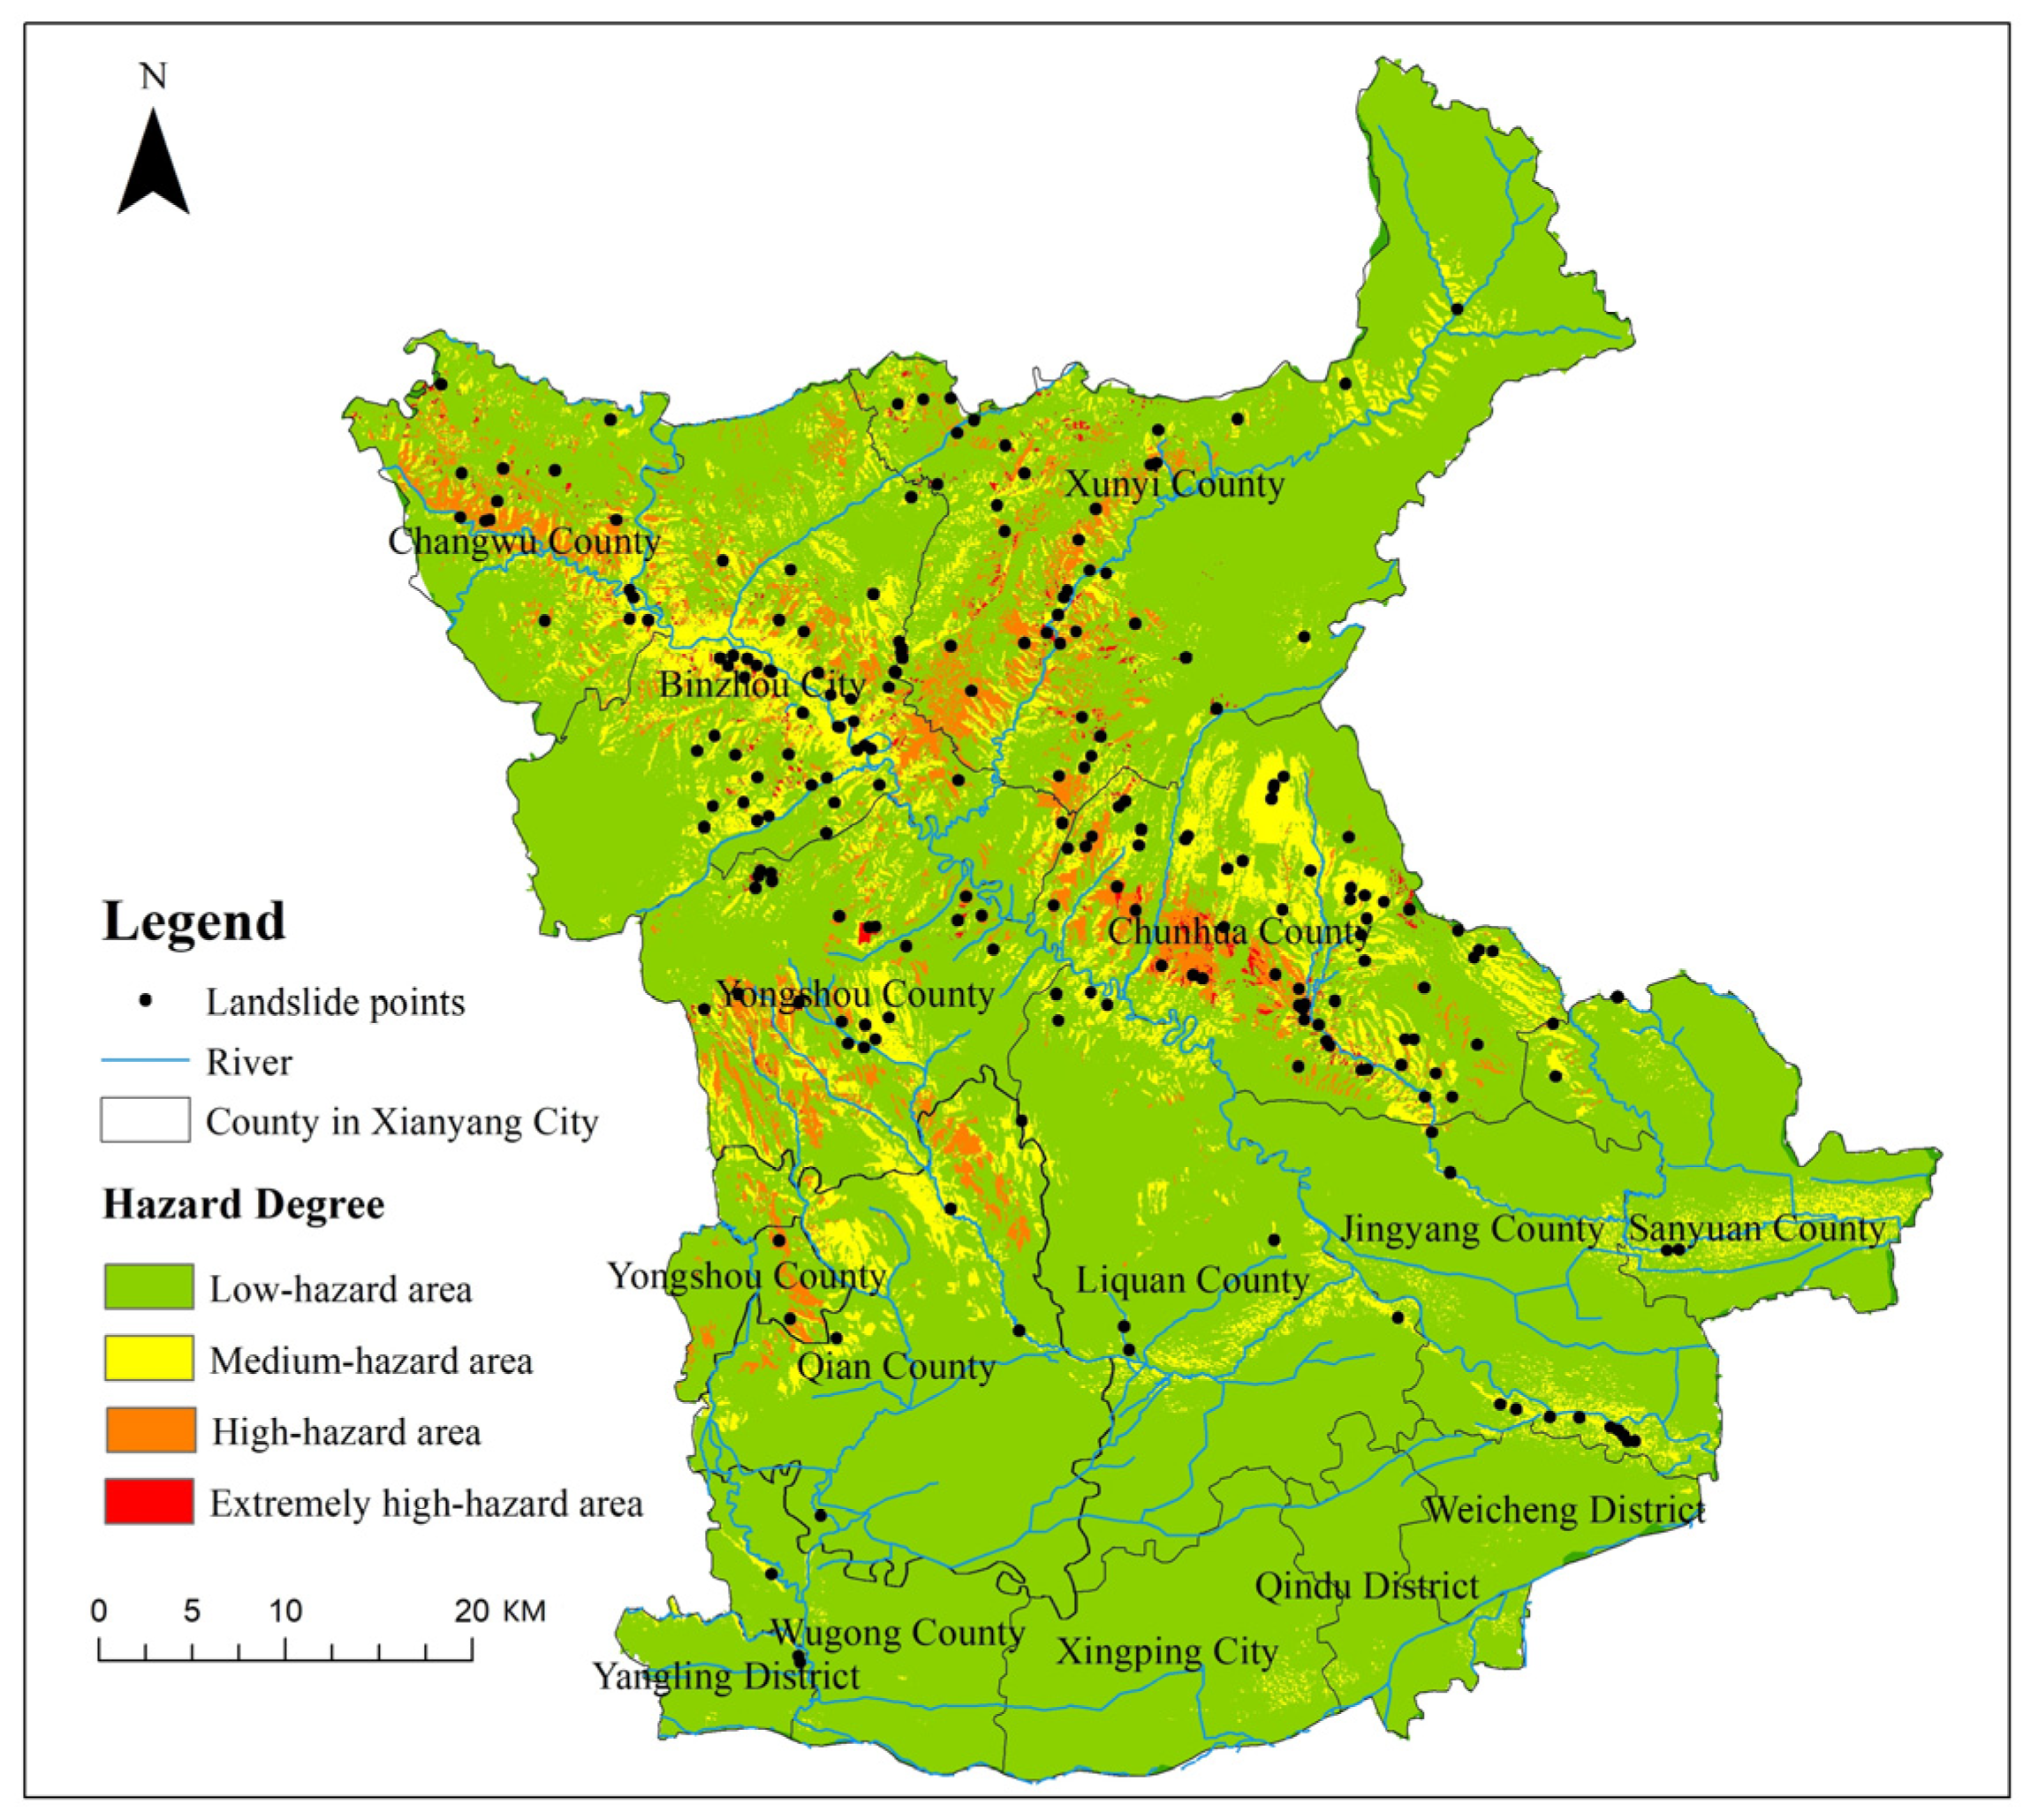
Landslide hazard zoning map: the natural discontinuity method was used to divide landslide hazard grades into four categories.

3.3. Landslide Vulnerability Assessment Model Considering Subjective and Objective Weights

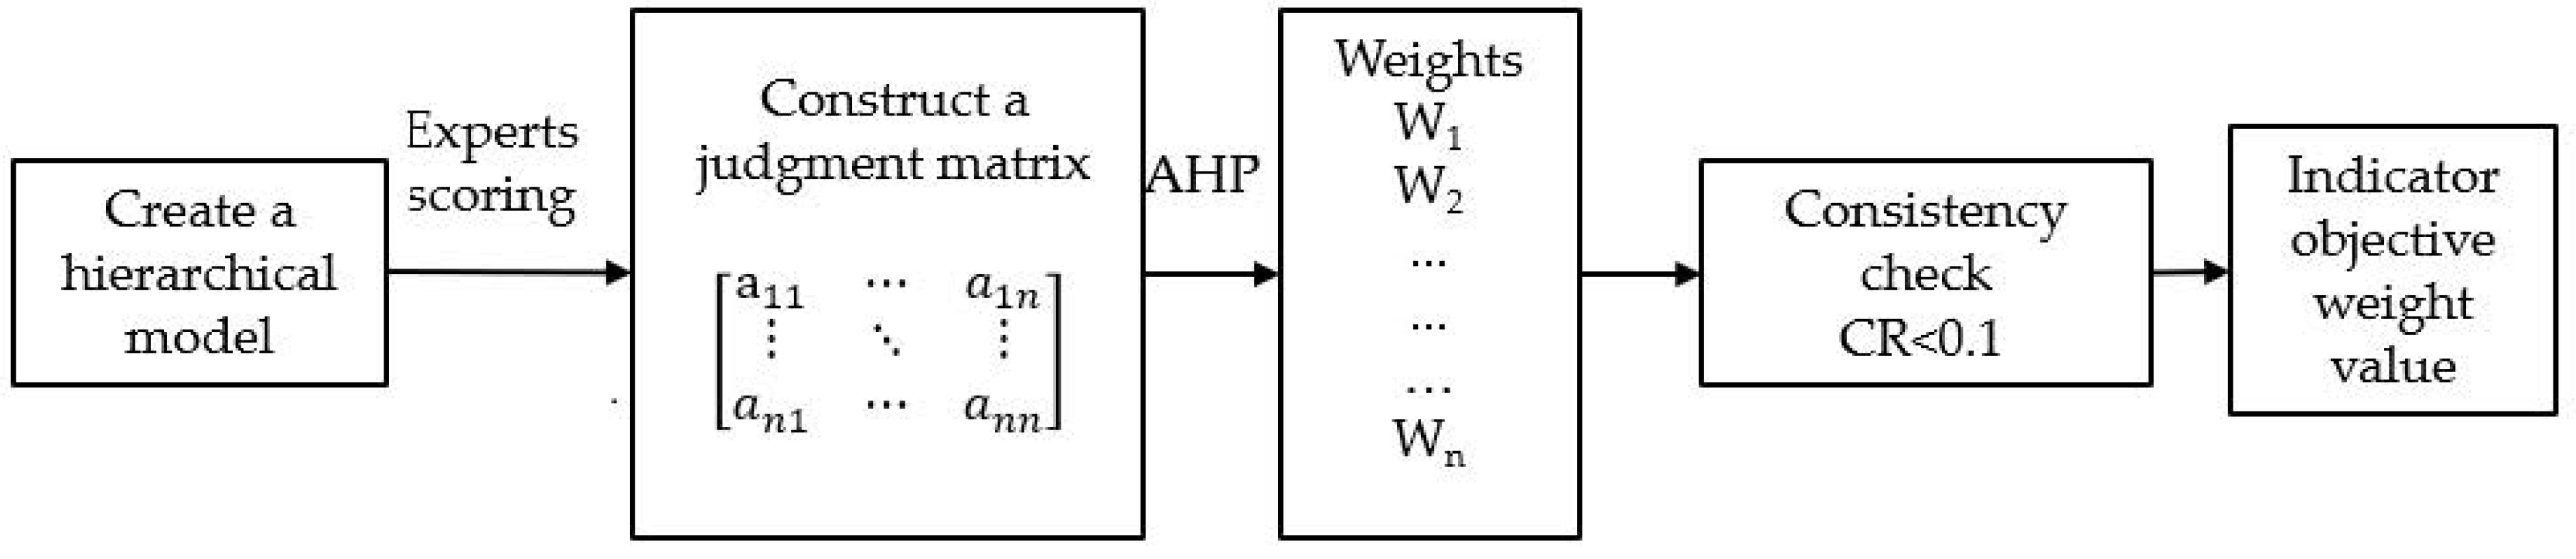
3.3.1. Combined Weights

There are three main methods for calculating the weights of evaluation factors: the subjective weighting method, objective weighting method, and combined weights [10]. The subjective weighting method is mainly obtained by experts based on subjective judgments and experience, with strong subjectivity. The objective weighting method is obtained through a mathematical model by quantitatively calculate the relationship between the research index value and the geological hazard. The accuracy of the calculation results is mostly determined by the measured data and is too dependent on the data. The combined weights integrate the advantages of subjective and objective methods and avoid the objective limitations of a single weighting method, so they are widely used in many fields.
(1)
Subjective weighting method
AHP is a combination of quantitative and qualitative analysis. Experts subjectively analyze the relative importance of each evaluation index based on experience and give the relative index value. The operation is simple and convenient; however, the subjectivity is strong. The specific process is shown in Figure 6. Among them, the method of constructing the judgment matrix is the 1–9 scale method proposed by Saaty [13]. As shown in Table 3, this method could avoid the difficulty of comparing different qualitative evaluation factors, and it had strong operability. The consistency test is usually measured by the consistency ratio (CR). It is generally believed that when the CR < 0.1, the inconsistency degree of the matrix is within the allowable range, and the consistency of the judgment matrix meets the requirements.
(2)
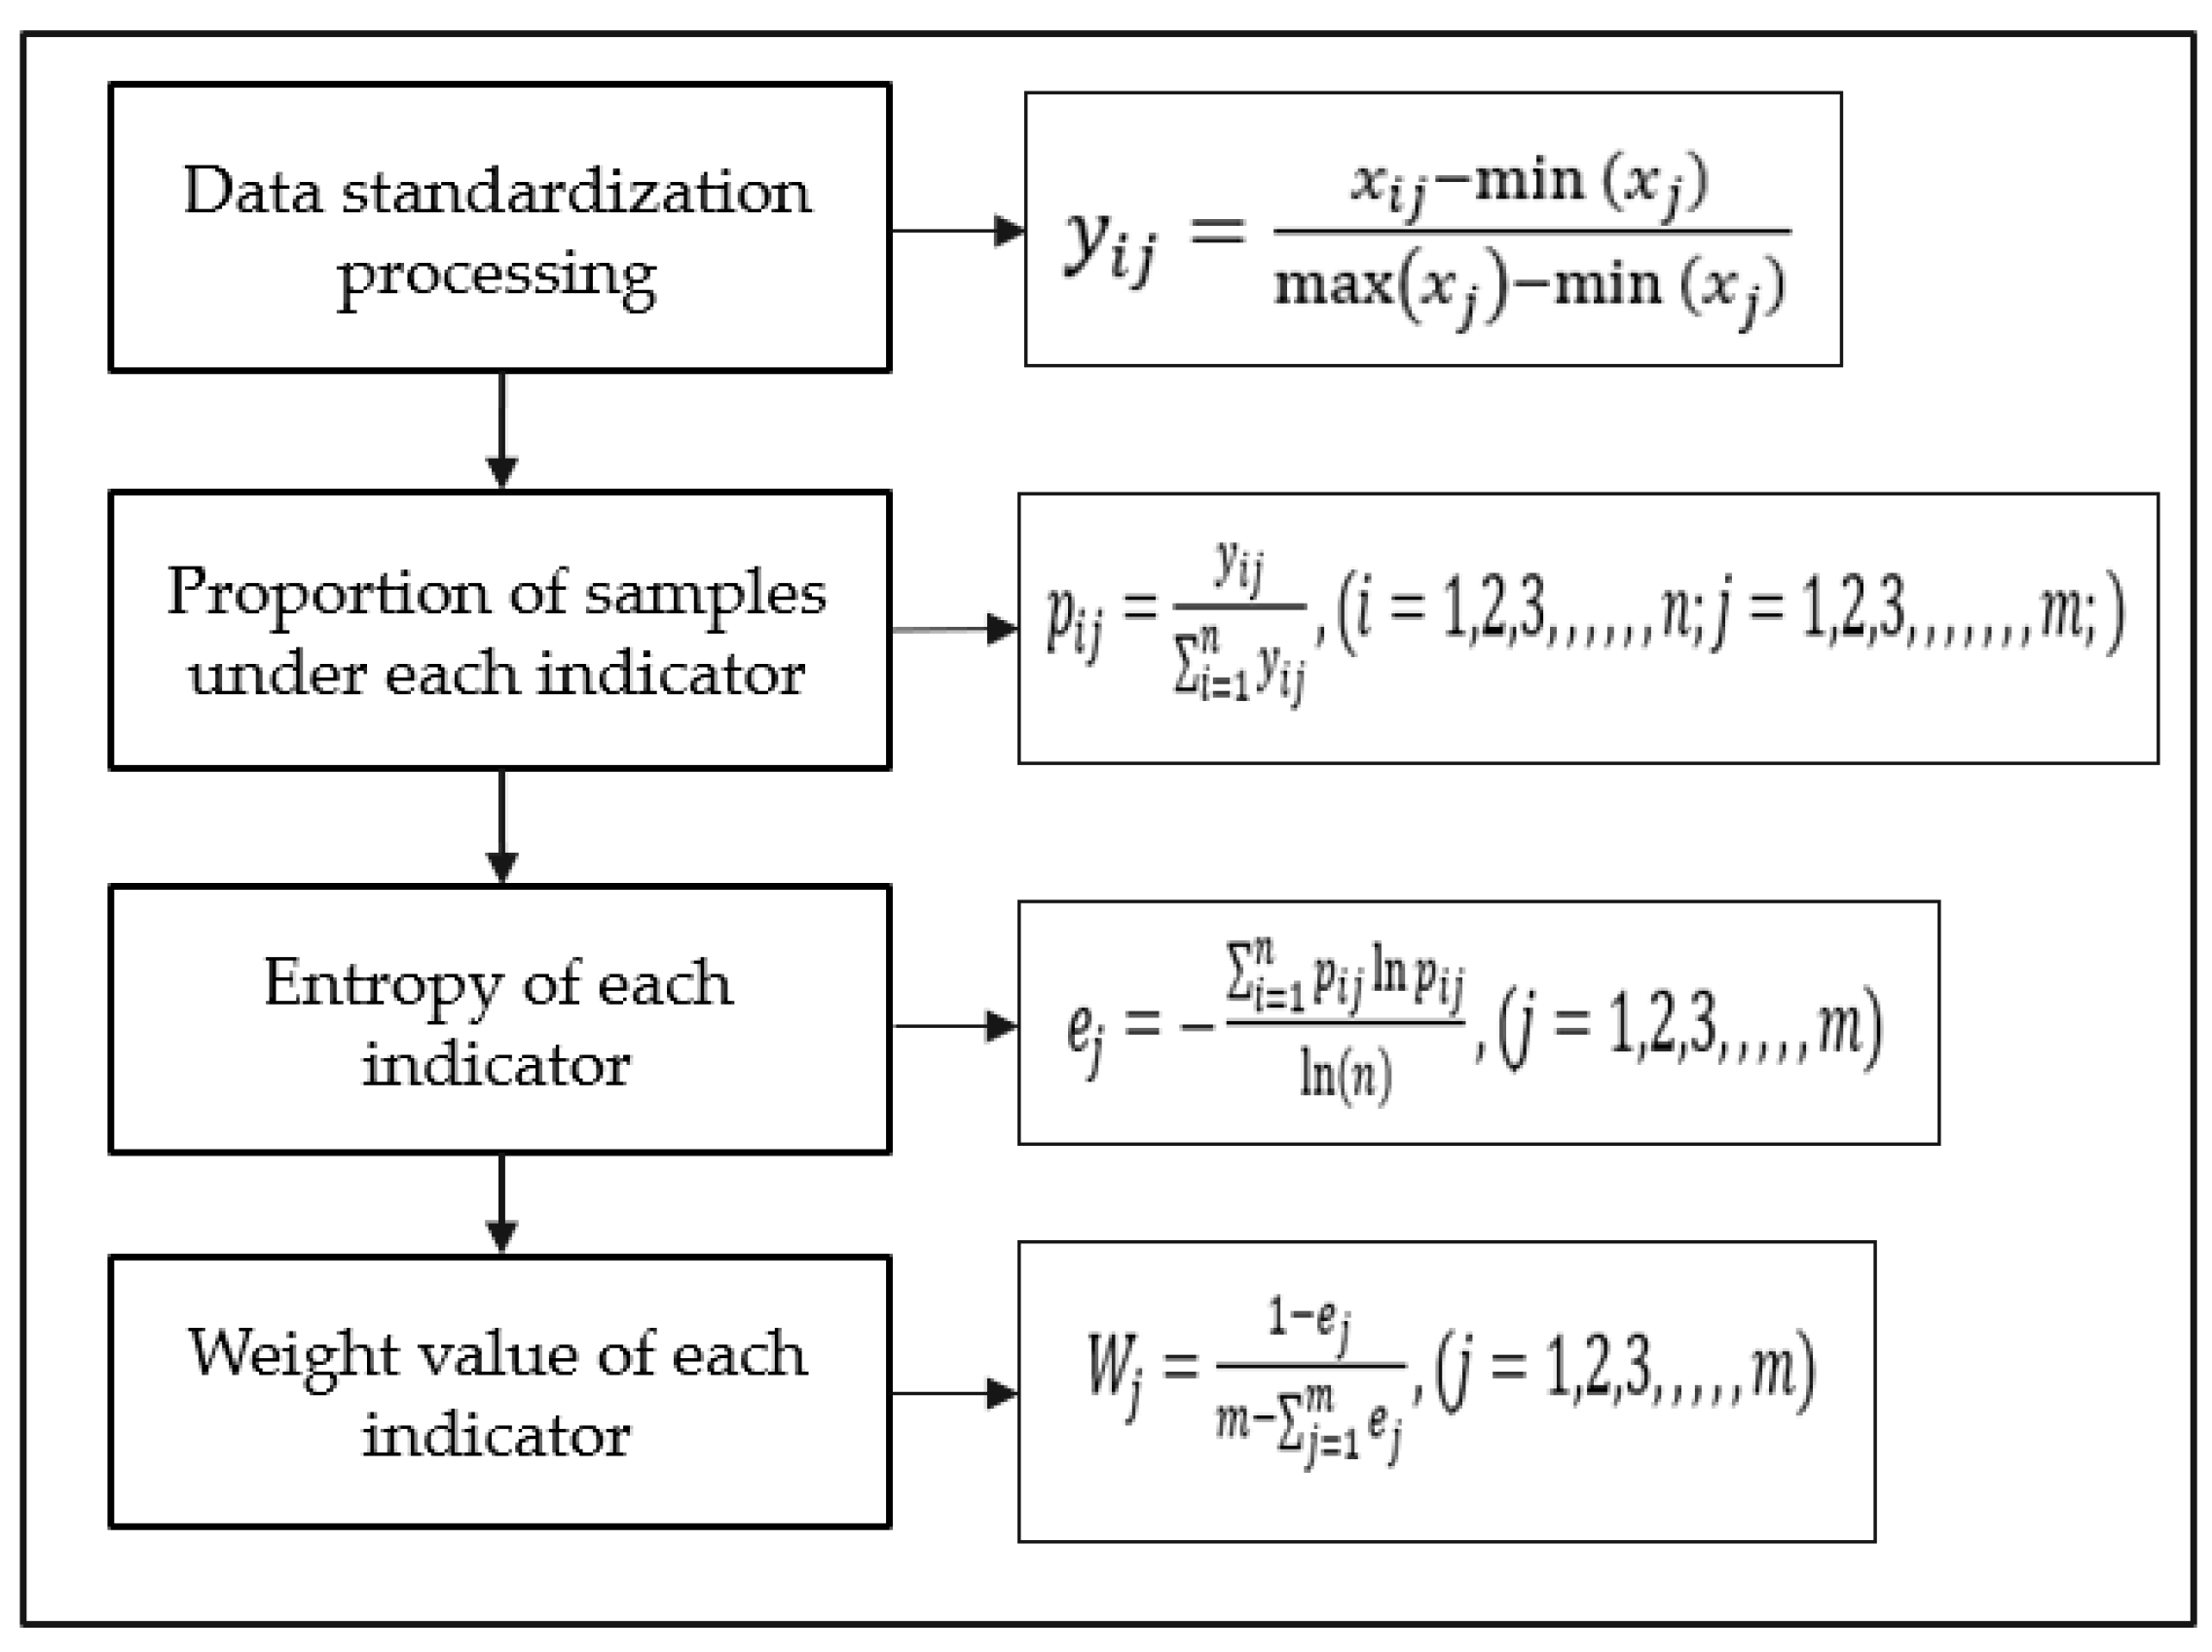
Objective weighting method
The entropy method is one of the methods for calculating objective weights. Its principle is to calculate the indicator weights according to the information provided by the indicator data. The calculation result entirely depends on the objective data, and the objectivity is strong. In the entropy method, the size of entropy is negatively related to the amount of information provided by objective data. There is no specific requirement for the number of evaluation indicators, and it is widely used and easy to understand. Compared with the AHP, although it cannot reflect the evaluator’s understanding of the importance of each index, it can guarantee the objectivity of the evaluation and reduce the shortcomings of the excessive subjectivity of the AHP. The entropy method process is shown in Figure 7.
(3)
Combined weights
This study applied combined weights in the landslide vulnerability assessment. This could combine the advantages of subjective and objective evaluations to make the evaluation results more accurate. In this paper, the distance function [11,12] was used to combine subjective and objective weights to achieve ideal and reasonable weights. The formula is:
W = μ W 1 + γ W 2
where μ is the subjective weighting coefficient, and γ is the objective weighting coefficient.
From Formula (9), determining the subjective and objective weighting coefficients is the key to calculating the comprehensive weight. This study completed the distribution of subjective and objective weighting coefficients according to the calculation principle of the distance function [14,35]. The specific method is as follows.
Suppose the subjective and objective weights are W 1 and W 2 , respectively. The distance function of W 1 , W 2 is d ( W 1 , W 2 ) :
d ( W 1 , W 2 ) = i = 1 n ( W 1 W 2 ) 2 2 , i = 1 , 2 , 3 , 4 ;
d ( W 1 , W 2 ) 2 = ( μ γ ) 2
μ + γ = 1
According to the above formula, the subjective and objective weighting coefficients μ and γ were calculated. Finally, the comprehensive weight was calculated according to the distance function formula.

3.3.2. Algorithm Flow

The subjective and objective combined weights were used to determine the weight of the vulnerability evaluation factor of the hazard-bearing body. This method had the advantage of considering decision makers’ subjective understanding of the degree of loss caused by geological disasters. At the same time, the amount of information provided by objective indicators on the vulnerability of geological disasters is considered, which increases the reliability of the vulnerability of disaster-bearing bodies. Therefore, this study combined the AHP and entropy method and adopted the comprehensive vulnerability evaluation index model based on combined weights to evaluate the landslide vulnerability in the study area. The specific process is shown in Figure 8. The principle of the comprehensive vulnerability index evaluation model is shown in Formula (13):
F i = j = 1 m P j × W j
where F i is the comprehensive vulnerability index of each evaluation unit, i represents the evaluation unit, P j represents the normalized weight of the j -th evaluation index of the i -th evaluation unit, and W j represents the weight of the j -th evaluation index of the i -th evaluation unit.

4. Experiment and Analysis

This section presents the classification of geological disaster types and levels, combined with the methods introduced in Section 3, and tests and analyzes the hazard, vulnerability, and risk of landslides.

4.1. Classification of Geological Disaster Types and Levels in the Study Area

According to the scale-grade standard of geological disasters, the scale of geological disasters in Xianyang City was divided into four levels: low, medium, high and extremely high hazards. Among them, there were two extremely high-hazard geological disaster points, accounting for 0.314% of the total number of geological disaster points. There were 45 high-hazard geological disaster points, accounting for 7.064% of the total. There were 106 medium-hazard geological disaster points, accounting for 16.641% of the total, and there were 484 low-hazard geological disaster points, accounting for 75.981% of the total. The specific distribution is shown in Table 4. The distribution of disaster intensity levels in each geological disaster type is shown in Table 5.

4.2. Landslide Hazard Assessment Based on Multiclass SVM

In this paper, the same number of units as the landslide disaster points in Xianyang City was randomly selected as nongeological disaster units, and the two samples were combined into one sample dataset, for a total of 415 sample points. In the selection of nongeological disaster points, to improve the accuracy of nondisaster point extraction, the distance from the disaster point was used as the constraint condition. The greater the distance from the disaster point, the less affected the disaster, and the accuracy of nondisaster point selection in the area was relatively high. Therefore, based on comprehensive factors such as the size of the area and the density of disaster points in Xianyang City, this paper selected a distance of 2 km from the disaster points and a distance greater than 1 km between nondisaster points as the constraint conditions, so the nondisaster units were randomly selected. Subsequently, based on the divided multilevel landslide disaster points in Xianyang City, the sample points were selected in the ratio of nondisaster points:low-risk points:medium-risk points:high-risk points = 6:4:2:1.
The landslide hazard assessment model outputted four discrete values, representing the four levels of extremely-low-hazard, low-hazard, medium-hazard and high-hazard areas, and each output grid cell had a hazard degree value. Based on the predicted landslide hazard values of Xianyang City, the zoning of each hazard level was carried out to obtain the zoning map of landslide hazards in Xianyang City, as shown in Figure 9. The area and proportion of each hazard area were statistically analyzed, as shown in Table 6.

4.3. Landslide Vulnerability Assessment Considering Subjective and Objective Weights

The combined weights of the vulnerability evaluation factors of Xianyang’s population density, arable land density, GDP density, and road density were calculated, and the results are shown in Table 7, Table 8 and Table 9:
Based on the combined weights, the four vulnerability evaluation factors were normalized, and the comprehensive vulnerability index of Xianyang City was using by Formula (13). The calculation result is shown in Figure 10. According to the Jenks method, this paper carried out the vulnerability zoning of Xianyang City, divides the vulnerability degree of Xianyang City into four levels of extremely low vulnerability, low vulnerability, medium vulnerability, and high vulnerability. The vulnerability assessment zoning map of Xianyang City is shown in Figure 11. Since there are 149 towns in Xianyang City in the study area, this paper used the administrative town as a unit to carry out quantitative statistics of the carrier. It was convenient to provide a scientific basis for the implementation of disaster prevention and mitigation decision-making and engineering activities by township governments.
The results showed that the vulnerability of the northern part of Xianyang City was generally low, while the vulnerability of the southern part was relatively high, especially the area around the Xianyang urban area. This was because the area is close to the Xianyang urban area, with rapid economic development and densely distribution of population and roads. If geological disasters occur, there will be many affected objects, and the vulnerability of the bearing body will be large.

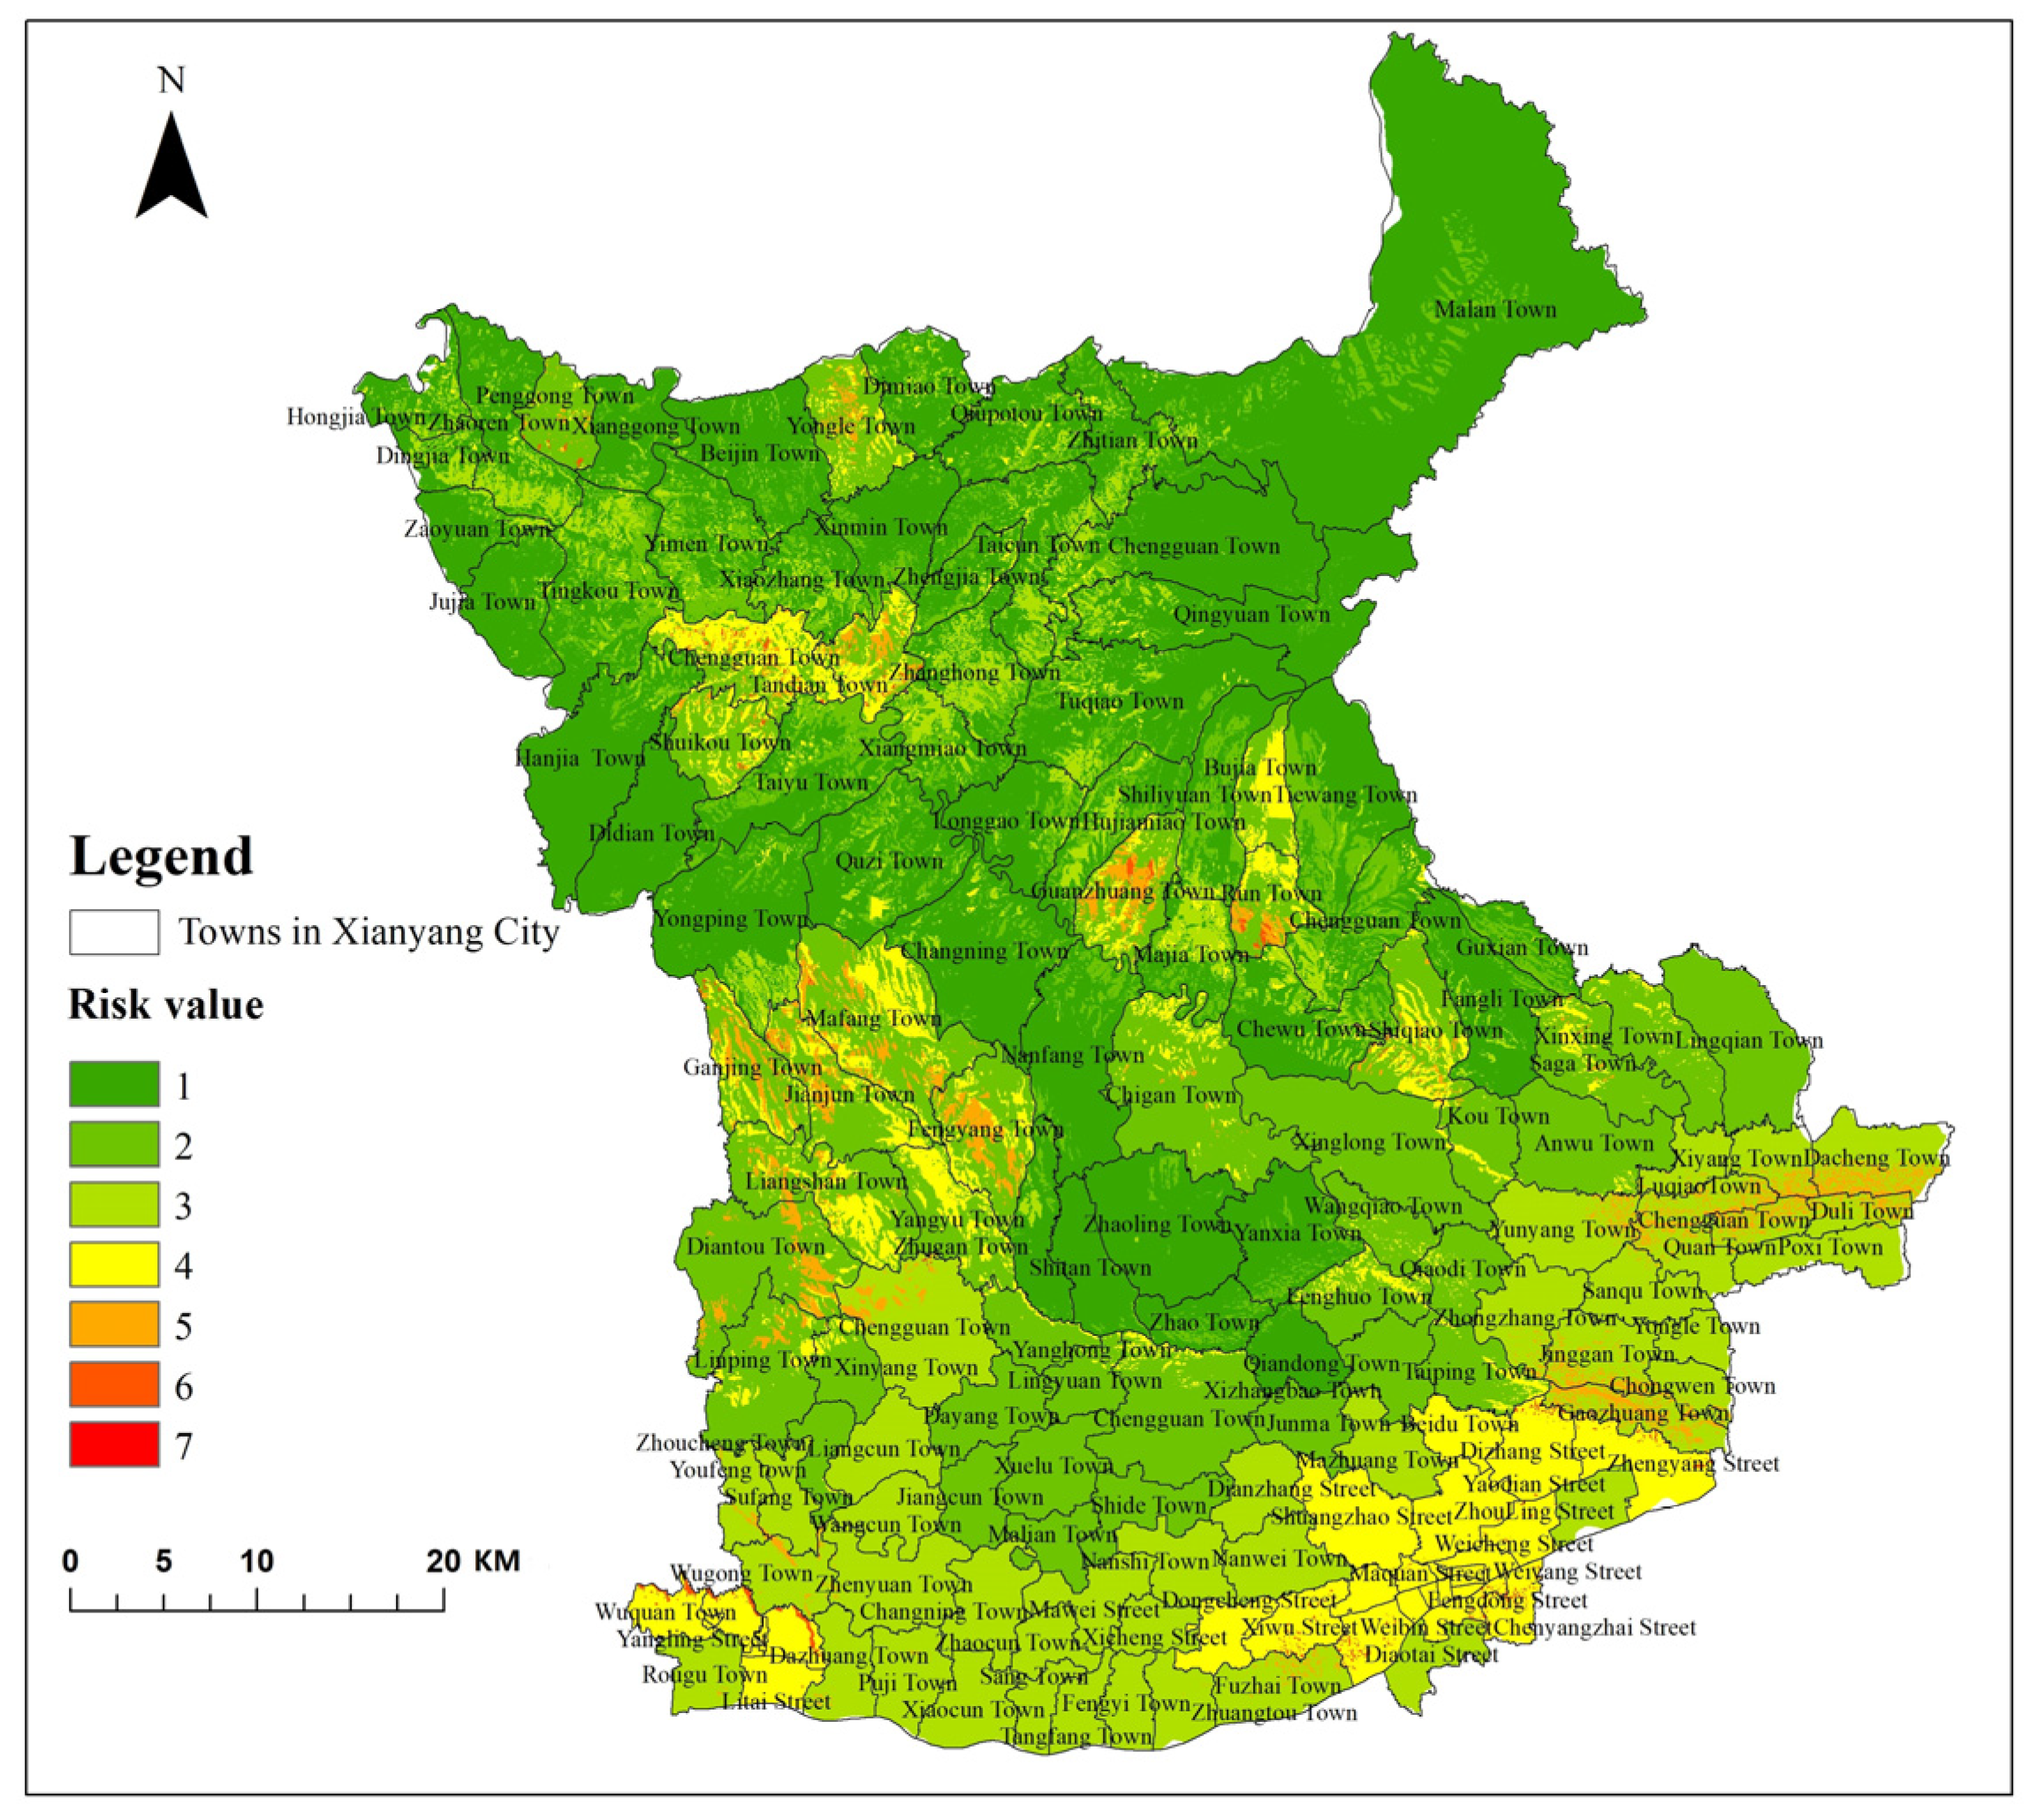
4.4. Landslide Risk Assessment
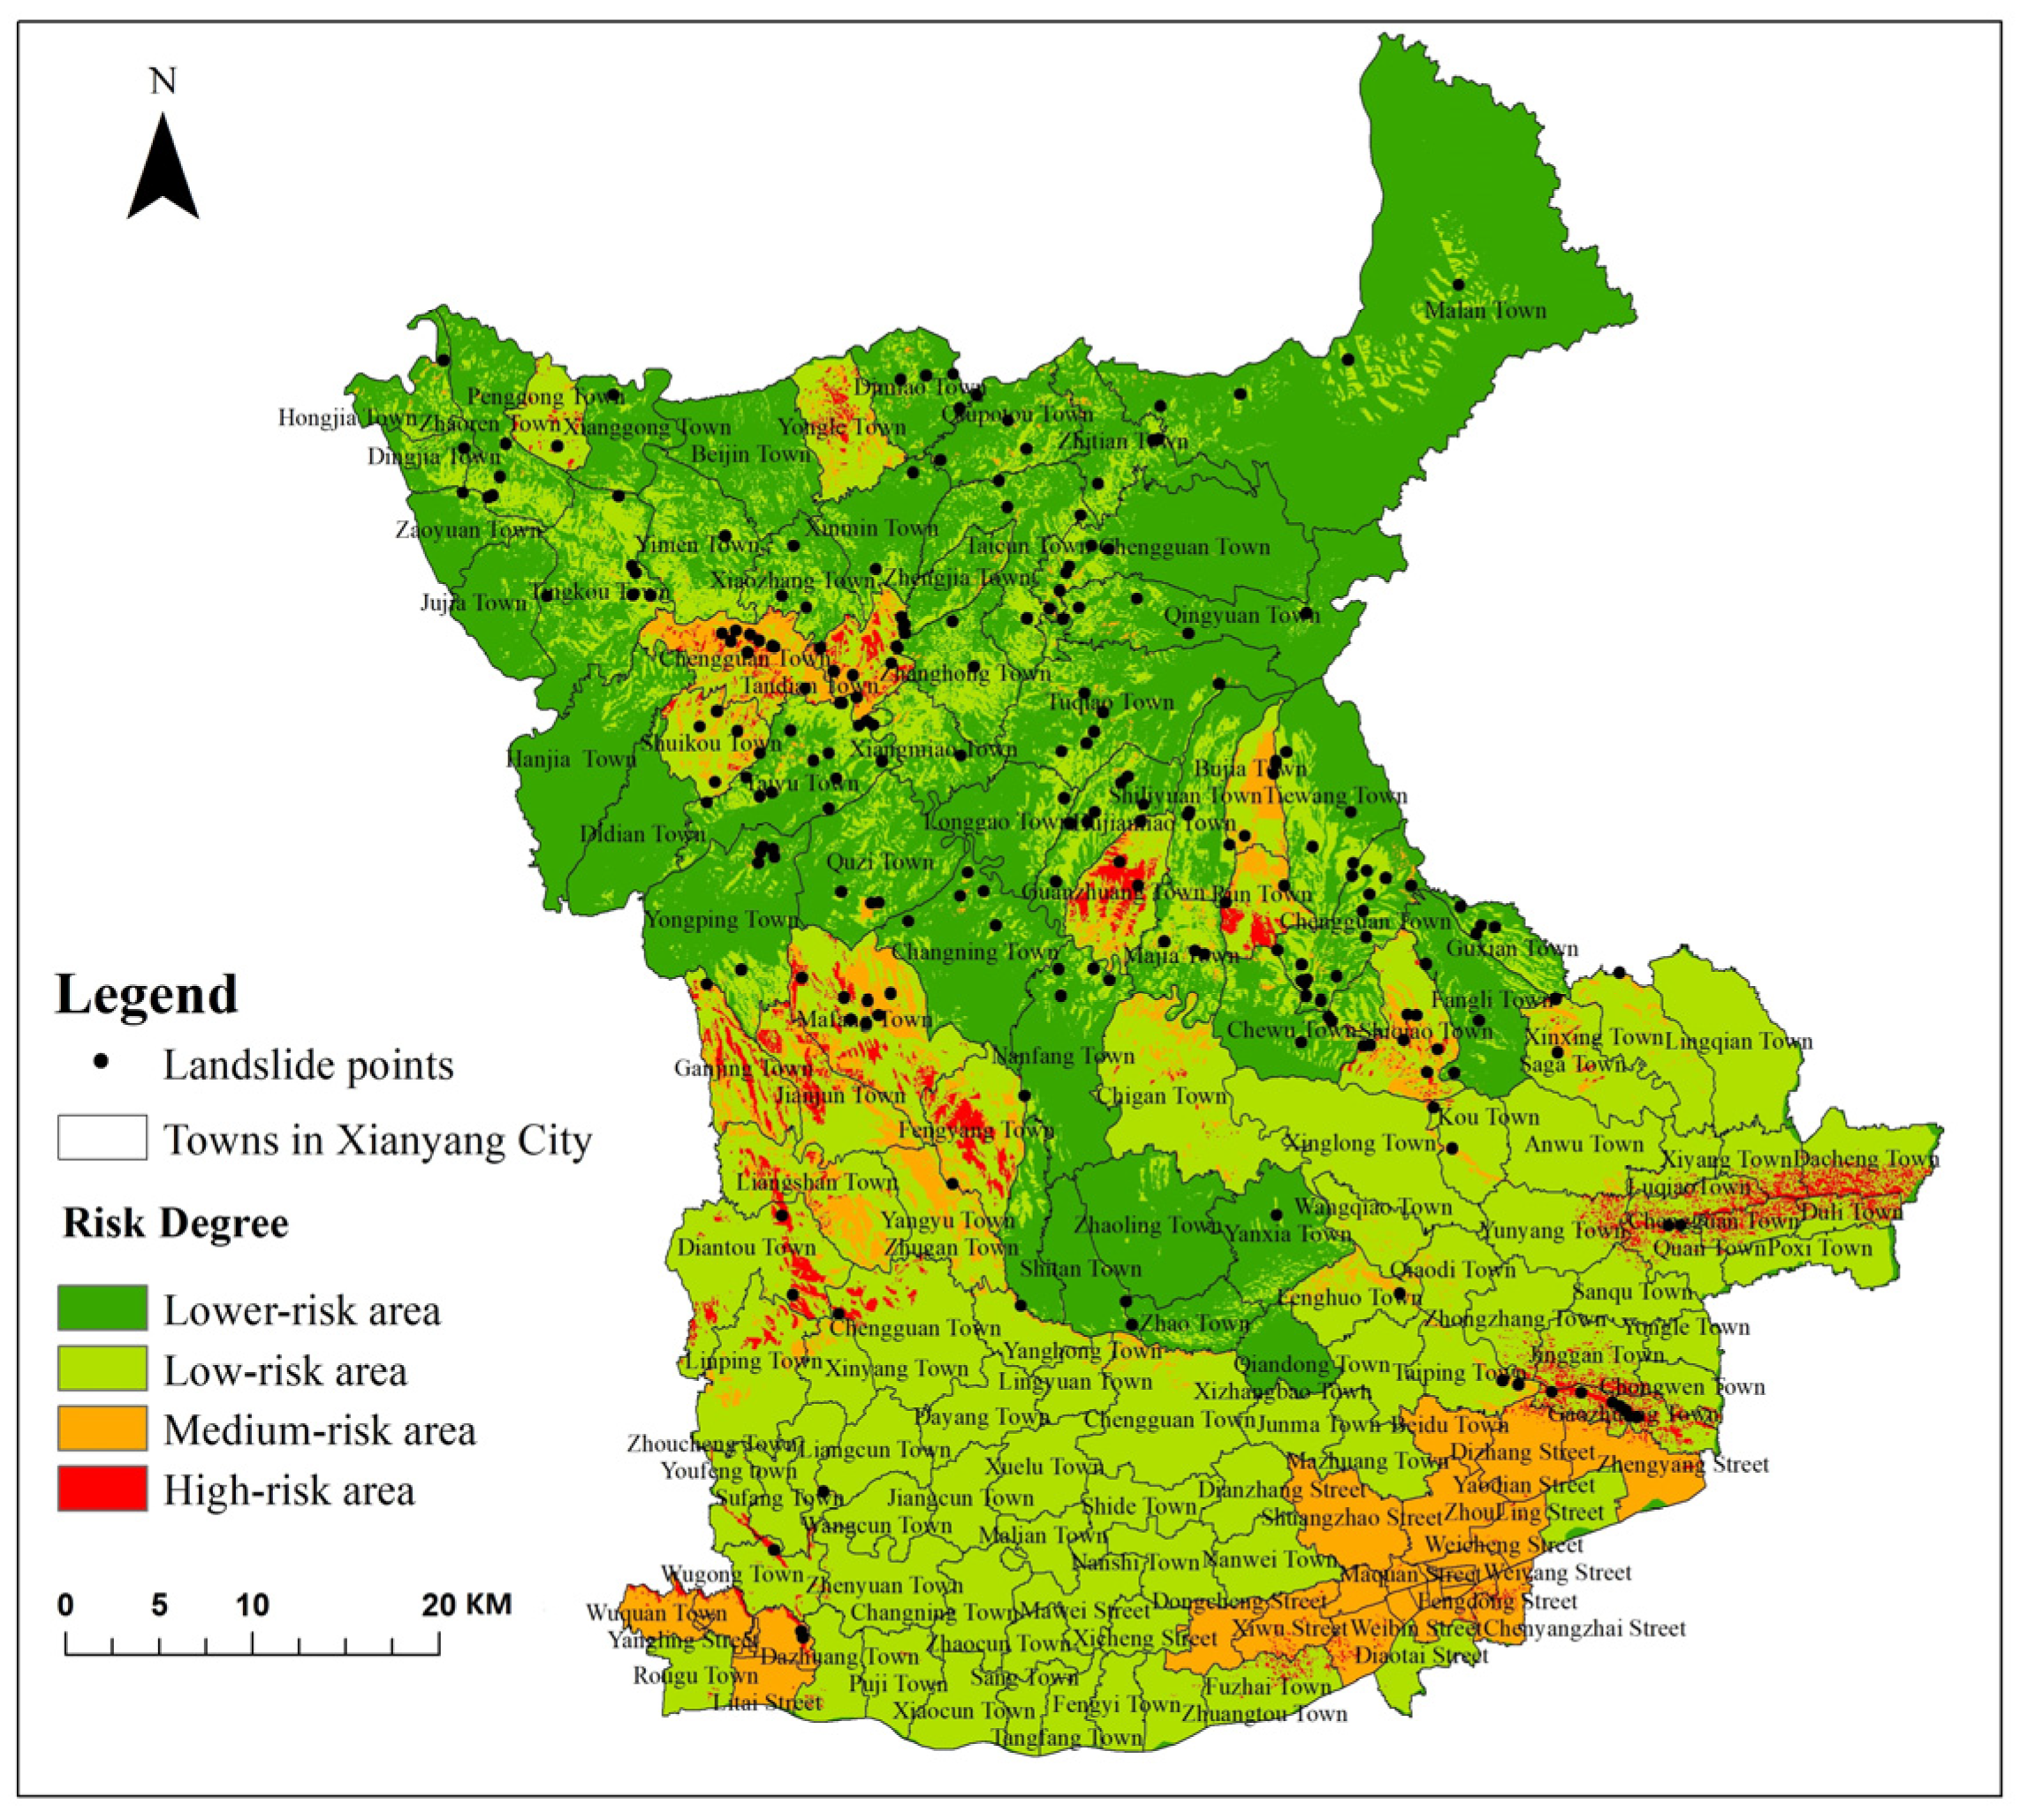
Risk emphasizes the threat of a certain hazard to an object, and has the characteristics of uncertainty, objectivity, and sociality. Geological disaster risk assessment is a quantitative assessment of the losses caused by geological disasters. Combining the topographic and geological characteristics of Xianyang City and the development characteristics of landslide disasters, this paper adopted the evaluation model method of “risk = function (hazard, vulnerability)” proposed by the United Nations Humanitarian Business Department (UNDHA) in 1991. The standardization treatment was carried out based on the results of landslide hazard and vulnerability assessments in Xianyang City. It quantitatively represented four extremely low-risk (extremely low vulnerability), low-risk (low vulnerability), medium-risk (medium vulnerability), and high-risk (high vulnerability) risk levels or vulnerability levels in numerical form, and calculated the risk value of landslides in Xianyang City. The results are shown in Figure 12. According to the calculation results, the Jenks method was used to partition the landslide risk in Xianyang City. The partition standards are shown in Table 10:
Xianyang City is divided into four research areas: lower-risk areas, low-risk areas, medium-risk areas, and high-risk areas, according to the landslide risk using the Jenks method. The area of each study area and the distribution characteristics of landslide disaster points are summarized in Figure 13 and Table 11. The risk was researched and analyzed by combining the various characteristics of each area.
(1)
Lower-risk areas were mainly distributed in Changwu County, Binzhou City, Xunyi County, Yongshou County, Chunhua County, Liquan County, etc. There were three landslide disaster points in this area, accounting for 1.40% of the total landslide disaster points. There were few geological disasters in this area, a low density of disaster points, and low landslide risk. In addition, the area had low urbanization, sparse population, low economic development, and low landslide risk.
(2)
Low-risk areas were mainly distributed in Wugong County, Jingyang County, Sanyuan County, Qianxian County, Xingping City, and other parts of southern Xianyang City. However, there were a small number of distributions in Changwu County, Binzhou City, Xunyi County, Yongshou County, Liquan County, and Chunhua County. There were 122 landslide disaster points in this area, accounting for 46.744% of the total. There were many geological disasters in this area, but the disaster level was relatively low. The economic development and population density of the area increased compared with lower-risk areas, human activities were moderate, and the risk of landslides was relatively low.
(3)
Medium-risk areas were mainly distributed in Yongshou County, Yangling District, Weicheng District, Qindu District, etc. There were 64 landslide disaster points, accounting for 29.767% of the total. The density of disaster points in this area was not high. However, most landslide hazard levels were medium-hazard points, the urbanization in the area was relatively high, the population density was relatively high, and the transportation network was relatively developed, so the landslide risk was medium.
(4)
High-risk areas were mainly distributed in Yongle Town, Tandian Town, Run Town, Guanzhuang Town, Mafang Town, Jianjun Town, Ganjing Town, Dantou Town, Fengyang Town, etc. There were 26 landslide disaster points, accounting for 12.093% of the total number of landslide disaster points. The geological hazards of landslides in this area were mostly high-risk points, and the risk was greatly affected by the hazard level. In addition, the terrain in this area had a high slope, poor geological stability, fully developed landslide hazards, a relatively high population density, and strong human activities. The occurrence of landslide disasters caused greater vulnerability and greater risk.

5. Conclusions

Landslide disasters have the characteristics of a large scope of influence, high threat number, and serious disaster results. It is critical to perform landslide risk assessment and analyze the magnitude of landslide risk to reduce disaster loss and effectively prevent landslide disasters [50]. In August 2019, landslides occurred in Yiping Township, Ebian County, Leshan City; and Fengyan Village, Shangzhou Town, Xuzhou District, Yibin City. Due to real time monitoring of high-risk areas, a landslide was found at hidden points of unstable slopes. The disaster-prevention plan was activated in time, and personnel in the danger zone were transferred in advance, successfully avoiding casualties.
This paper took Xianyang City landslide geological disasters as the research object. According to the arrangement and analysis of the collected multicategory landslide disaster point scale and risk data, the disaster scale and risk level of Xianyang city were divided. Based on the nine selected landslide hazard evaluation factors and four hazard-bearing-body vulnerability evaluation factors, the landslide hazard assessment model of multiclass SVM and the landslide vulnerability assessment model based on combined weights were constructed to perform the landslide risk assessment of Xianyang City. Experimental results provided a scientific reference for the disaster prevention and mitigation of various landslide risk levels and improved the efficiency of landslide disaster monitoring in Xianyang City. In this paper, exploratory landslide hazard, vulnerability and risk assessments were carried out. In follow-up studies, to further improve the accuracy and reliability of landslide risk assessments, landslide hazard assessments should consider factors such as strata, soil moisture content, and river runoff. Landslide vulnerability assessments should be combined with accurate spatial data of disaster prevention and mitigation projects, population, and economy in the study area.

Author Contributions

Shenghua Xu and Meng Zhang designed the algorithm, wrote the paper, and performed the experiments on landslide hazard vulnerability and risk assessment. Jiping Liu and Yong Wang supervised the research and revised the manuscript. Yu Ma participated in the experimental analysis and revised the manuscript. Xinrui Ma and Jie Chen revised the manuscript. All authors have read and agreed to the published version of the manuscript.

Funding

This work was supported by the National Key Research and Development Program of China (Grant No. 2020YFC1511704) and the Basic Research Fund of CASM (Grant No. AR2011).

Institutional Review Board Statement

Not applicable.

Informed Consent Statement

Not applicable.

Data Availability Statement

Not applicable.

Conflicts of Interest

The authors declare that the research was conducted in the absence of any commercial or financial relationships that could be construed as a potential conflict of interest.

References

  1. Liu, Y. GIS-Based Urban Geological Disaster Assessment Risk Method. Master’s Thesis, Guangzhou University, Guangzhou, China, 2018. [Google Scholar]
  2. Li, W.; Zhu, J.; Fu, L.; Zhu, Q.; Guo, Y.; Gong, Y. A rapid 3D reproduction system of dam-break floods constrained by post-disaster information. Environ. Model. Softw. 2021, 139, 104994. [Google Scholar] [CrossRef]
  3. Zhang, X. Study on Landslide Hazard Assessment and Zoning in Shaanxi Province Based on GIS. Master’s Thesis, Chang’an University, Xi’an, China, 2019. [Google Scholar]
  4. Ye, R.; Li, S.; Guo, F.; Fu, X.; Niu, R. Research on the relationship between landslide susceptibility and land use change in the Three Gorges Reservoir area based on RS and GIS. J. Eng. Geol. 2021, 29, 724–733. [Google Scholar]
  5. Han, J.; Liu, H.; He, W.; Li, Y.; Ji, Y.; Zhao, Z. The evolution process of geological disasters in the ecologically fragile mining area of Yushenfu, Shaanxi. Catastrophe 2017, 32, 177–182. [Google Scholar]
  6. Xu, X. Geological Hazard Risk Assessment of Longnan City Based on GIS. Master’s Thesis, Shaanxi Normal University, Xi’an, China, 2015. [Google Scholar]
  7. Xu, Q. Recognition and thinking on related problems in early identification of hidden dangers of geological hazards. J. Wuhan Univ. Inf. Sci. Ed. 2020, 45, 1651–1659. [Google Scholar]
  8. Xue, Q. Discussion on the susceptibility, hazard, vulnerability, and risk of geological disasters. J. Eng. Geol. 2007, 15, 124–128. [Google Scholar]
  9. Watts, M.J.; Bohle, H.G. The space of vulnerability: The causal structure of hunger and famine. Prog. Hum. Geogr. 1993, 17, 43–67. [Google Scholar] [CrossRef]
  10. Li, X. Discussion on the scaling method of using analytic hierarchy process to obtain index weight. J. Beijing Univ. Posts Telecommun. Soc. Sci. Ed. 2001, 3, 25–27. [Google Scholar]
  11. Chen, C. Evaluation of Geological Hazard Susceptibility in Kuandian County Based on Combined Weights. Master’s Thesis, China University of Geosciences, Beijing, China, 2020. [Google Scholar]
  12. Deng, B. Research and application of index weight determination method based on combined weights. Electron. Inf. Warf. Technol. 2016, 31, 12–16. [Google Scholar]
  13. Saaty, T.L. A scaling method for priorities in hierarchical structures. J. Math. Psychol. 1977, 15, 234–281. [Google Scholar] [CrossRef]
  14. Wang, Z.; Mou, Q.; Li, Q. Combined weights for multi-attribute decision-making. J. Appl. Math. Comput. Math. 2003, 17, 55–62. [Google Scholar]
  15. Delavar, M.R.; Sadrykia, M. Assessment of Enhanced Dempster-Shafer Theory for Uncertainty Modeling in a GIS-Based Seismic Vulnerability Assessment Model, Case Study—Tabriz City. ISPRS Int. J. Geo-Inf. 2020, 9, 195. [Google Scholar] [CrossRef] [Green Version]
  16. Chhetri, S.; Kayastha, P. Manifestation of an Analytic Hierarchy Process (AHP) Model on Fire Potential Zonation Mapping in Kathmandu Metropolitan City, Nepal. ISPRS Int. J. Geo-Inf. 2015, 4, 400–417. [Google Scholar] [CrossRef] [Green Version]
  17. Kumar, B.A.; Teiji, W. Landslide Susceptibility Mapping and Assessment Using Geospatial Platforms and Weights of Evidence (WoE) Method in the Indian Himalayan Region: Recent Developments, Gaps, and Future Directions. ISPRS Int. J. Geo-Inf. 2021, 10, 114. [Google Scholar] [CrossRef]
  18. Dou, Q.; Qin, S.; Zhang, Y.; Ma, Z.; Chen, J.; Qiao, S.; Hu, X.; Liu, F. A method for improving controlling factors based on information fusion for debris flow susceptibility mapping: A case study in Jilin province, China. Entropy 2019, 21, 695. [Google Scholar] [CrossRef] [Green Version]
  19. Han, X.; Yin, Y.; Wu, Y.; Wu, S. Risk Assessment of Population Loss Posed by Earthquake-Landslide-Debris Flow Disaster Chain: A Case Study in Wenchuan, China. ISPRS Int. J. Geo-Inf. 2021, 10, 363. [Google Scholar] [CrossRef]
  20. Yang, S. Research and Application of the Index System of Urban Road Traffic Safety Risk Evaluation. Master’s Thesis, Xi’an University of Science and Technology, Xi’an, China, 2020. [Google Scholar]
  21. Psomiadis, E.; Charizopoulos, N.; Efthimiou, N.; Soulis, K.X.; Charalampopoulos, I. Earth Observation and GIS-Based Analysis for Landslide Susceptibility and Risk Assessment. ISPRS Int. J. Geo-Inf. 2020, 9, 552. [Google Scholar] [CrossRef]
  22. Lee, S.; Pradhan, B. Landslide hazard mapping at Selangor, Malaysia using frequency ratio and logistic regression models. Landslides 2007, 4, 33–41. [Google Scholar] [CrossRef]
  23. Zhao, H.; Yao, L.; Mei, G.; Liu, T.; Ning, Y. A Fuzzy Comprehensive Evaluation Method Based on AHP and Entropy for a Landslide Susceptibility Map. Entropy 2017, 19, 396. [Google Scholar] [CrossRef]
  24. Wang, S. Research on Automatic Text Classification Method Based on Machine Learning. Master’s Thesis, University of Electronic Science and Technology, Chengdu, China, 2020. [Google Scholar]
  25. Liu, C. Research and Application of Relevance Vector Machine Multi-Classification Algorithm. Ph.D. Thesis, Harbin Engineering University, Harbin, China, 2013. [Google Scholar]
  26. Zhihao, W.; Alexander, B. Active-Learning Approaches for Landslide Mapping Using Support Vector Machines. Remote Sens. 2021, 13, 2588. [Google Scholar] [CrossRef]
  27. Tien Bui, D.; Shahabi, H.; Shirzadi, A.; Chapi, K.; Alizadeh, M.; Chen, W.; Mohammadi, A.; Ahmad, B.B.; Panahi, M.; Hong, H. Landslide detection and susceptibility mapping by airsar data using support vector machine and index of entropy models in cameron highlands, malaysia. Remote Sens. 2018, 10, 1527. [Google Scholar] [CrossRef] [Green Version]
  28. Nhu, V.-H.; Shirzadi, A.; Shahabi, H.; Singh, S.K.; Al-Ansari, N.; Clague, J.J.; Jaafari, A.; Chen, W.; Miraki, S.; Dou, J. Shallow landslide susceptibility mapping: A comparison between logistic model tree, logistic regression, naïve bayes tree, artificial neural network, and support vector machine algorithms. Int. J. Environ. Res. Public Health 2020, 17, 2749. [Google Scholar] [CrossRef]
  29. Du, J.; Liu, Y.; Yu, Y.; Yan, W.; Lorente, J.D.S. A Prediction of Precipitation Data Based on Support Vector Machine and Particle Swarm Optimization (PSO-SVM) Algorithms. Algorithms 2017, 10, 57. [Google Scholar] [CrossRef]
  30. Bian, Y.; Yang, M.; Fan, X.; Liu, Y. A Fire Detection Algorithm Based on Tchebichef Moment Invariants and PSO-SVM. Algorithms 2018, 11, 79. [Google Scholar] [CrossRef] [Green Version]
  31. Zheng, J.; Sun, J.; Yang, L.; Li, N. Risk Assessment of Landslide Disaster Impact Factors Based on GIS—Taking Maoxian County as an Example. Sci. Technol. Innov. 2021, 1, 49–51. [Google Scholar]
  32. Chen, W.; Pourghasemi, H.R.; Zhao, Z. A GIS-based comparative study of Dempster-Shafer, logistic regression and artificial neural network models for landslide susceptibility mapping. Geocarto Int. 2017, 32, 367–385. [Google Scholar] [CrossRef]
  33. Yu, X.; Wang, Y.; Niu, R.; Hu, Y. A Combination of Geographically Weighted Regression, Particle Swarm Optimization and Support Vector Machine for Landslide Susceptibility Mapping: A Case Study at Wanzhou in the Three Gorges Area, China. Int. J. Environ. Res. Public Health 2016, 13, 487. [Google Scholar] [CrossRef] [Green Version]
  34. Xu, S.; Liu, J.; Wang, X.; Zhang, Y.; Lin, R.; Zhang, M.; Liu, M.; Jiang, T. Landslide hazard susceptibility evaluation method based on entropy index integrated into support vector machine—Taking Shaanxi Province as an example. Wuhan Univ. J. Inf. Sci. Ed. 2020, 45, 1214–1222. [Google Scholar]
  35. Xiong, H. Research on the Risk and Hazard Evaluation of Landslides in the Benzilan Water Source Reservoir Area of the Jinsha River. Master’s Thesis, Jilin University, Changchun, China, 2014. [Google Scholar]
  36. Hao, H.; Eulie, D.; Weide, A. An Integrative Approach to Assessing Property Owner Perceptions and Modeled Risk to Coastal Hazards. ISPRS Int. J. Geo-Inf. 2020, 9, 275. [Google Scholar] [CrossRef] [Green Version]
  37. Gao, R.; Wang, C.; Liang, Z.; Han, S.; Li, B. A Research on Susceptibility Mapping of Multiple Geological Hazards in Yanzi River Basin, China. ISPRS Int. J. Geo-Inf. 2021, 10, 218. [Google Scholar] [CrossRef]
  38. Sun, X.; Chen, J.; Bao, Y.; Han, X.; Zhan, J.; Peng, W. Landslide Susceptibility Mapping Using Logistic Regression Analysis along the Jinsha River and Its Tributaries Close to Derong and Deqin County, Southwestern China. ISPRS Int. J. Geo-Inf. 2018, 7, 438. [Google Scholar] [CrossRef] [Green Version]
  39. Bachri, S.; Shrestha, R.P.; Yulianto, F.; Sumarmi, S.; Utomo, K.S.B.; Aldianto, Y.E. Mapping Landform and Landslide Susceptibility Using Remote Sensing, GIS and Field Observation in the Southern Cross Road, Malang Regency, East Java, Indonesia. Geosciences 2021, 11, 4. [Google Scholar] [CrossRef]
  40. Zhou, X.; Wu, W.; Lin, Z.; Zhang, G.; Chen, R.; Song, Y.; Wang, Z.; Lang, T.; Qin, Y.; Ou, P.; et al. Zonation of Landslide Susceptibility in Ruijin, Jiangxi, China. Int. J. Environ. Res. Public Health 2021, 18, 5906. [Google Scholar] [CrossRef]
  41. Zhang, Y.; Wu, W.; Qin, Y.; Lin, Z.; Zhang, G.; Chen, R.; Song, Y.; Lang, T.; Zhou, X.; Huangfu, W.; et al. Mapping Landslide Hazard Risk Using Random Forest Algorithm in Guixi, Jiangxi, China. ISPRS Int. J. Geo-Inf. 2020, 9, 695. [Google Scholar] [CrossRef]
  42. Azam, K.; Fatemeh, R.; MoungJin, L.; Saro, L. Landslide Susceptibility Assessment Using an Optimized Group Method of Data Handling Model. ISPRS Int. J. Geo-Inf. 2020, 9, 566. [Google Scholar] [CrossRef]
  43. Xiao, T. Risk Assessment of Landslide Disasters in Wanzhou District and Key Reservoir Banks of Three Gorges Reservoir Area. Ph.D. Thesis, China University of Geosciences, Wuhan, China, 2020. [Google Scholar]
  44. Pradhan, B.; Lee, S. Delineation of landslide hazard areas on Penang Island, Malaysia, by using frequency ratio, logistic regression, and artificial neural network models. Environ. Earth Sci. 2010, 60, 1037–1054. [Google Scholar] [CrossRef]
  45. Li, W.; Zhu, J.; Fu, L.; Zhu, Q.; Xie, Y.; Hu, Y. An augmented representation method of debris flow scenes to improve public perception. Int. J. Geogr. Inf. Sci. 2021, 35, 1521–1544. [Google Scholar] [CrossRef]
  46. Zhang, Q.; Liu, X.; Zhang, H.; Zhang, Z. The Development Characteristics and Forming Conditions of Geological Hazards in Jingyang County, Shaanxi. Miner. Explor. 2018, 9, 1785–1793. [Google Scholar]
  47. Gao, L. Research on the Vulnerability of Natural Disasters in Shaanxi Province. Shandong Sci. 2018, 31, 88–93. [Google Scholar]
  48. Meng, Q.; Sun, W.; Wang, T. Evaluation of geological disaster susceptibility in Fengxian County, Shaanxi Province. J. Eng. Geol. 2011, 19, 388–396. [Google Scholar]
  49. Wang, Y.; Tang, X. Risk Assessment of Geological Disasters in Southeastern Liaoning Province. J. Eng. Geol. 2008, 16 (Suppl. 1), 164–168. [Google Scholar]
  50. Gao, H. Research on Risk Analysis and Prevention of Landslide Disaster. Master’s Thesis, Hubei University of Technology, Wuhan, China, 2020. [Google Scholar]
Figure 1. Xianyang City, Shaanxi Province.
Ijgi 10 00646 g001
Figure 2. The landslide hazard evaluation index system.
Ijgi 10 00646 g002
Figure 3. Landslide hazard assessment factors: (a) slope; (b) aspect; (c) elevation; (d) NDVI; (e) distance from rivers; (f) distance from roads; (g) rainfall; (h) lithology; (i) landforms.
Ijgi 10 00646 g003aIjgi 10 00646 g003bIjgi 10 00646 g003c
Figure 4. Landslide vulnerability assessment factors: (a) population density; (b) GDP density; (c) arable land density; (d) road density.
Ijgi 10 00646 g004
Figure 5. Flowchart of landslide hazard assessment in Xianyang City.
Ijgi 10 00646 g005
Figure 6. Flowchart of AHP.
Ijgi 10 00646 g006
Figure 7. Flowchart of the entropy method.
Ijgi 10 00646 g007
Figure 8. Flowchart of the disaster vulnerability assessment.
Ijgi 10 00646 g008
Figure 9. Landslide hazard assessment zoning map of Xianyang City.
Ijgi 10 00646 g009
Figure 10. Landslide vulnerability evaluation index of Xianyang City.
Ijgi 10 00646 g010
Figure 11. Landslide vulnerability assessment zoning map of Xianyang City.
Ijgi 10 00646 g011
Figure 12. Landslide risk values in Xianyang City.
Ijgi 10 00646 g012
Figure 13. Landslide risk assessment zoning map in Xianyang City.
Ijgi 10 00646 g013
Table 1. Classification standards of geological disaster scale.
LevelLandslide (104 m3)Collapse (104 m3)Mudslide (104 m3)Ground Collapse (km2)
Extremely high hazard≥1000≥100≥50≥10
High hazard100~100010~10020~501~10
Medium hazard10~1001~102~200.1~1
Low hazard<10<1<2<0.1
Table 2. Classification standards of geological disasters.
LevelDeath Toll (People)Number of Threats (People)Direct Economic Loss (Ten Thousand)Potential Economic Loss (Ten Thousand)
Extremely high risk≥30≥1000≥1000≥10,000
High risk10~30100~1000500~10005000~10,000
Medium risk3~1010~100100~500500~5000
Low risk<3<10<100<500
Table 3. Standards and meanings of judgment matrix.
StandardsMeanings
1When two factors are compared, they have the same importance
3When two factors are compared, the former is slightly more important than the latter
5When two factors are compared, the former is obviously more important than the latter
7When two factors are compared, the former is more important than the latter
9When two factors are compared, the former is extremely more important than the latter
2,4,6,8The adjacent middle value of the above
1/i (i = 1, 2…9)The above situation is reversed
Table 4. Statistical table of geological disaster intensity level.
Disaster Intensity LevelCount (Piece)Proportion (%)
Extremely high hazard20.314
High hazard457.064
Medium hazard10616.641
Low hazard48475.981
Table 5. Statistical table of disaster intensity level in different types of disasters.
Types of DisasterExtremely High HazardHigh HazardMedium HazardLow Hazard
Landslide22767119
Collapse01835242
Surface collapse00436
Mudslide0003
Ground fissure00083
Unstable slope0001
Table 6. Area and proportion of each dangerous zone.
DangerousnessArea (km2)Proportion
Extremely low-hazard area8036.95284.21%
Low-hazard area1008.18610.56%
Medium-hazard area456.4714.78%
High-hazard area41.9910.44%
Table 7. Subjective weights and maximum eigenvalues of vulnerability assessment factors.
Evaluation FactorPopulation DensityRoad DensityArable Land DensityGDP DensityCRλmax
Weights0.58600.24180.11490.05730.08044.217
Table 8. Calculation results of objective weights of vulnerability assessment factors.
Evaluation FactorPopulation DensityRoad DensityArable Land DensityGDP Density
Weights0.24670.26490.08500.4033
Table 9. Calculation results of objective weights of vulnerability assessment factors.
Evaluation FactorPopulation DensityRoad DensityArable land DensityGDP Density
Comprehensive weights0.4747030.249360.1050940.170843
Table 10. Risk zoning standards of the study area.
Risk ZoningLower-Risk AreaLow-Risk AreaMedium-Risk AreaHigh-Risk Area
Value at risk(0,1)(1,3)(3,4)(4,9)
Table 11. Area and proportion of each risk area.
Degree of RiskArea (km2)Percentage
Lower-risk area3693.95438.706%
Low-risk area4711.72949.370%
Medium-risk area896.8709.398%
High-risk area241.0472.526%
Publisher’s Note: MDPI stays neutral with regard to jurisdictional claims in published maps and institutional affiliations.

