Article

Spatiotemporal Evolution and Trend Prediction of Tourism Economic Vulnerability in China’s Major Tourist Cities

1
College of Tourism, Fujian Normal University, Fuzhou 350108, China
2
School of International Education, Tianjin University, Tianjin 300350, China
3
The Higher Educational Key Laboratory for Smart Tourism of Fujian Province, Fuzhou 350108, China
4
West Center for Economic Research, Southwestern University of Finance and Economics, Chengdu 610074, China
*
Author to whom correspondence should be addressed.
These authors contributed equally to this work.
ISPRS Int. J. Geo-Inf. 2021, 10(10), 644; https://doi.org/10.3390/ijgi10100644
Submission received: 22 July 2021 / Revised: 16 September 2021 / Accepted: 21 September 2021 / Published: 25 September 2021
(This article belongs to the Special Issue Geo Data Science for Tourism)

Abstract

:
The evaluation and trend prediction of tourism economic vulnerability (TEV) in major tourist cities are necessary for formulating tourism economic strategies scientifically and promoting the sustainable development of regional tourism. In this study, 58 major tourist cities in China were taken as the research object, and an evaluation index system of TEV was constructed from two aspects of sensitivity and adaptive capacity. On the basis of the entropy weight method, TOPSIS model, obstacle diagnosis model, and BP neural network model, this study analyzed the spatiotemporal patterns, obstacle factors, and future trends of TEV in major tourist cities in China from 2004 to 2019. The results show three key findings: (1) In terms of spatiotemporal patterns, the TEV index of most of China’s tourist cities has been on the rise from 2004 to 2019. Cities throughout the coast of China’s Yangtze River Delta and the Pearl River Delta urban agglomeration show high vulnerability, whereas low vulnerability has a scattered distribution in China’s northeast, central, and western regions. (2) The proportion of international tourists out of total tourists, tourism output density, urban industrial sulfur dioxide emissions per unit area, urban industrial smoke and dust emission per unit area, and discharge of urban industrial wastewater per unit area are the five major obstacles affecting the vulnerability degree of the tourism economy. (3) According to the prediction results of TEV from 2021 to 2030, although the TEV of many tourist cities in China is increasing year by year, cities with low TEV levels occupy the dominant position. Research results can provide reference for tourist cities to prevent tourism crises from occurring and to reasonably improve the resilience of the tourism economic system.

1. Introduction

The concept of “vulnerability” originated from natural science research; it is used to characterize the ability of a system or system combination to withstand and recover from risk events [1]. In the early stages, the vulnerability concept was mainly applied to the assessment of natural disasters such as floods and droughts or ecosystems such as forests and coasts [2,3,4,5]. With the gradual integration and penetration of the natural and social systems, the interaction between the natural environment and human social activities has become increasingly obvious [6], and the relevant research on vulnerability has gradually extended to the social and economic fields [7,8]. As one of the important components of the concept and connotation of vulnerability, economic vulnerability refers to the bearing capacity of the regional economy due to the impact of unexpected events in the process of development [9,10]. Economic vulnerability was first proposed by Briguglio in the 1990s and has been gradually deepened in subsequent studies [11]. At present, it has become an important indicator to measure whether the development of a regional or urban economic system is healthy and stable [12].
With the rapid development of China’s social economy and the improvement of people’s living standards, tourism has been gradually positioned as a “strategic pillar industry and modern service industry,” playing an increasingly important role in regional economic development. However, as a typical sensitive industry, tourism will be greatly impacted by financial crises [13], political conflicts [14], social disturbances [15], public health events [16], and natural disasters [17] in the context of the integration of global trade of services. This is especially true in areas where economic development is highly dependent on tourism; although these areas have gained huge profits through the vigorous development of tourism, the instability of tourism will inevitably bring about regional economic shocks, and regional economic development is generally vulnerable to hidden worries [18]. Nowadays, with the increasing role of tourism in national political communication, economic development, and residents’ well-being, as well as the pursuit of regional sustainable development goals, the research on TEV is receiving growing attention [19,20].
TEV refers to the inherent property wherein the structure and function of the tourism economy system are easily damaged due to the restriction of its own property and the inability to adapt to various disturbances inside and outside the system [21]. TEV is usually divided into two types: “endogenous” and “exogenous”. Endogenous vulnerability is formed under the constraints of certain economic systems and tourism resources and cannot be eliminated by conscious actions, such as policy combining [22,23]. Exogenous vulnerability is a result of “non-systemic causes” from the external environment, such as earthquakes, public health events, financial crises, and social disturbances, which have contingent and sudden characteristics [22,23]. In general, the literature on TEV mainly focused on the following two aspects: (1) The analysis of TEV under the impact of crisis events; such studies focus on the impact of some emergencies on the tourism economy from the perspective of crisis management and take the impact degree of the crisis as the basis for assessing vulnerability. For example, Huang et al. analyzed the long-term impact of the Wenchuan Earthquake on inbound tourists in Sichuan and found a significant increase in inbound tourists after the earthquake, with a “blessing in disguise” effect [24]. Pham et al. used the tourism satellite account approach and tourism CGE model to effectively measure the changes and impacts of COVID-19 on the core and related industries of Australia’s inbound tourism [25]. In addition, the recovery and development of the tourism economy in the context of crisis events is also an important research topic [26]. Gurtner used the case of Bali to illustrate that after a tourism crisis, the government, industry, community, and other tourism stakeholders need to strengthen cooperation and adopt a wide range of new strategies to deal with the changing destination environment and potential challenges in the future [27]. Raki et al. discussed the role of active and proactive tourism recovery strategies in improving the well-being of tourists, improving the profitability of companies, and reducing employee turnover under the impact of COVID-19 [28]. (2) Assessment of the TEV of typical tourist destinations; this kind of research focuses on the evaluation of tourism economic system shock resistance of various types of tourism destinations. Research on islands, countries, typical tourism cities, national regions, and other traditional tourist destinations is prioritized using the entropy weight method, TOPSIS model, obstacle degree model, and geographical detectors and comprehensive quantitative analysis of vulnerability degree; research contents include TEV measurement, spatiotemporal pattern evolution, and influence factors [29,30,31,32,33].
It can be seen from the above analysis that the existing literature is still mostly limited to discussing the TEV of individual typical tourist destinations. However, with the rapid development of China’s tourism industry, a global analysis of TEV in major tourist cities on a national scale is urgently required to optimize the regional pattern of tourism development. In addition, the existing literature usually measures regional TEV in previous years but lacks predictive research on the regional TEV in the future. Such discussion is more conducive to grasping the evolutionary trend of TEVs in order to rationally plan relevant strategies to reduce the regional TEV. In view of this, 58 major tourist cities in China were selected as study areas for this paper. Our objectives were as follows: (1) Clarify the spatiotemporal evolution of TEV in major tourist cities in China. (2) Explore the main obstacles affecting TEV in major tourist cities in China. (3) Forecast the evolution trend of TEV of major tourist cities in China in the next 10 years.
In this study, we first assessed the level of TEV of each city from 2004 to 2019 based on the case studies of 58 major tourist cities in China, using the entropy weight method and TOPSIS model. Then, the obstacle diagnosis model was used to analyze the obstacle factors affecting TEV in major tourist cities in China. Finally, the BP neural network model was used to predict the evolutionary trend of TEV in major tourist cities in China in the future. The research conclusions are of great significance for the detailed understanding of TEV and the future evolutionary trend of major tourist cities in China in the context of high-quality development. These results can provide a reference for regional tourism crisis prevention and effectively enhance the resilience of the urban tourism economy.
The structure of this study can be divided into five parts. The first part is the Introduction, which introduces the research background, research objectives, existing research results, and the value of this research. The second part is the Materials and Methods, which establishes the evaluation index system of TEV, explains the data sources, and introduces the application logic of research methods. The third part is the Results, which expounds on the spatiotemporal evolution of the TEV of major tourist cities in China, the obstacle factors affecting the TEV, and the future evolutionary trend of the TEV. The fourth part is the Discussion, which summarizes the spatiotemporal characteristics and future evolutionary trends of TEV in major tourist cities in China, and puts forward countermeasures to improve the resilience of the urban tourism economy. The fifth part is the Conclusion, which shows the highlights of the results and limitations of the study.

2. Materials and Methods
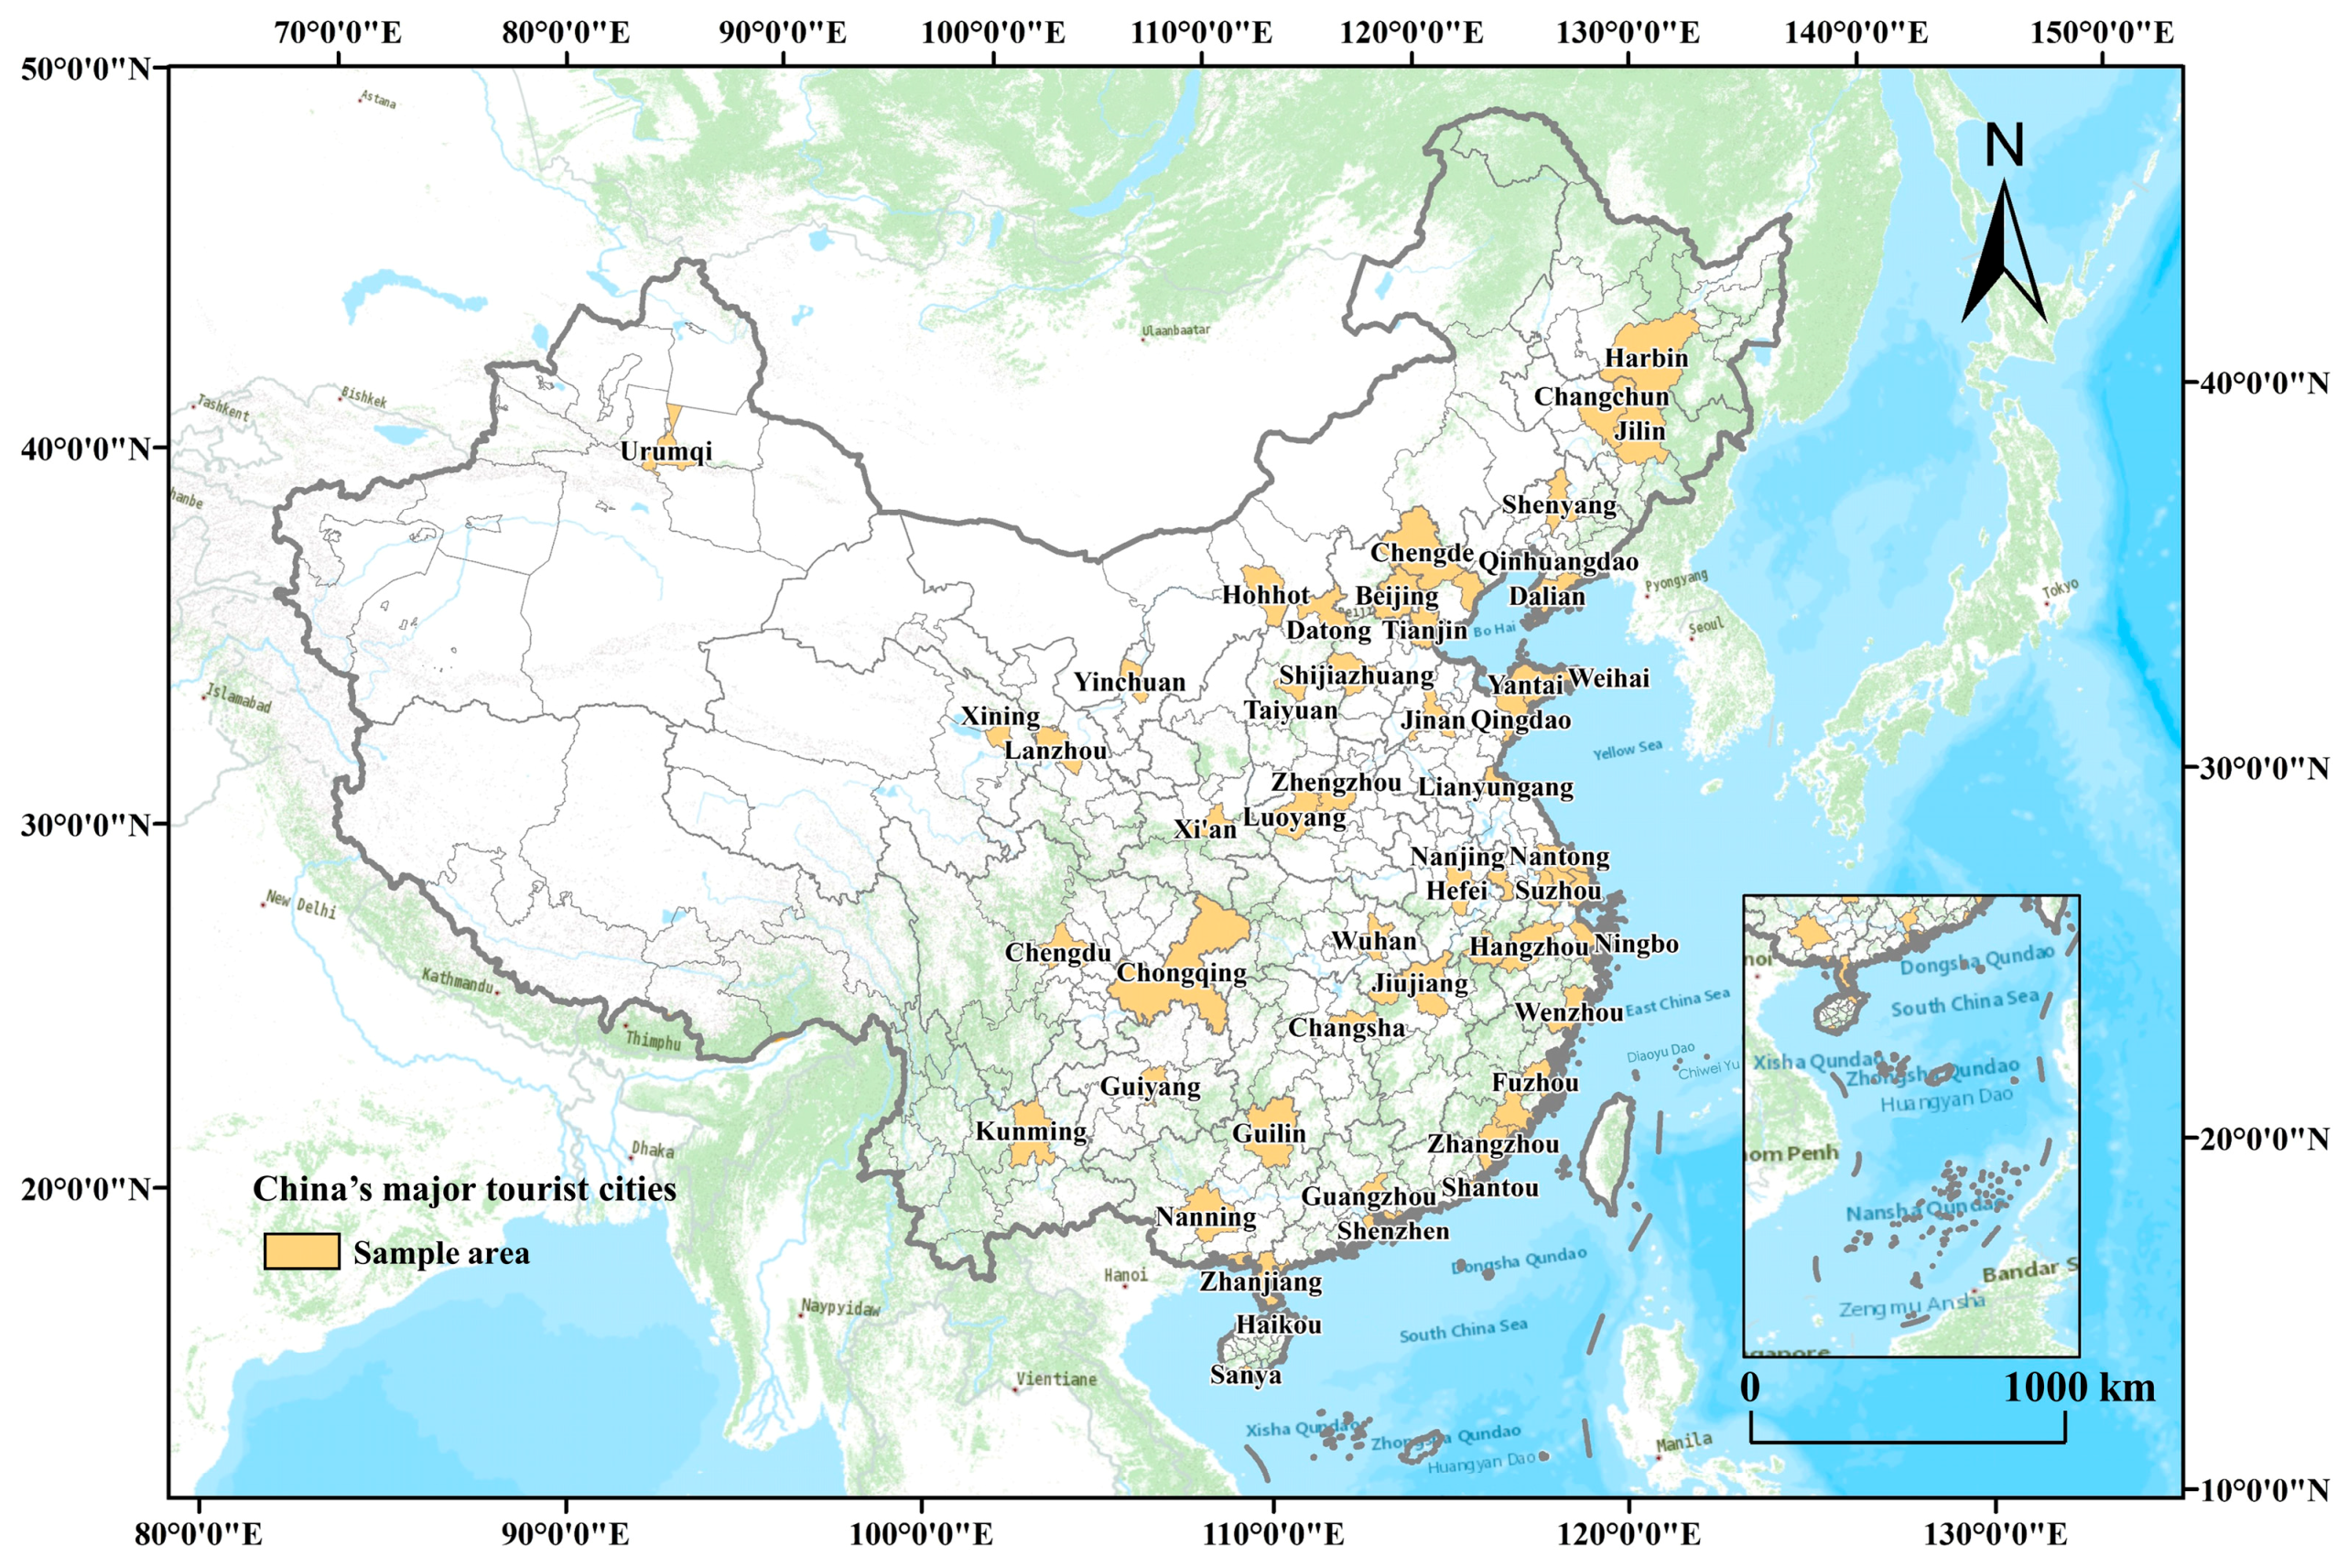
2.1. Study Area

A tourist city considers tourism development to be an important goal that has a prominent function after a certain period of accumulation [34]. The Yearbook of China Tourism Statistics has recorded long-term tracking statistics on the tourism development of 60 major tourist cities in China. However, due to the lack of statistical data of Yanbian and Lhasa, among the 60 major tourist cities, this study selected only 58 cities as research objects in this study, as shown in Figure 1. These major tourist cities not only have prominent tourism functions, evident progress in the city’s tourism construction, and enjoy high popularity at home and abroad; they also have large differences in their urban population on an economic scale, wide regional coverage, and diverse urban types. These characteristics make them suitable for exploring the urban TEV.

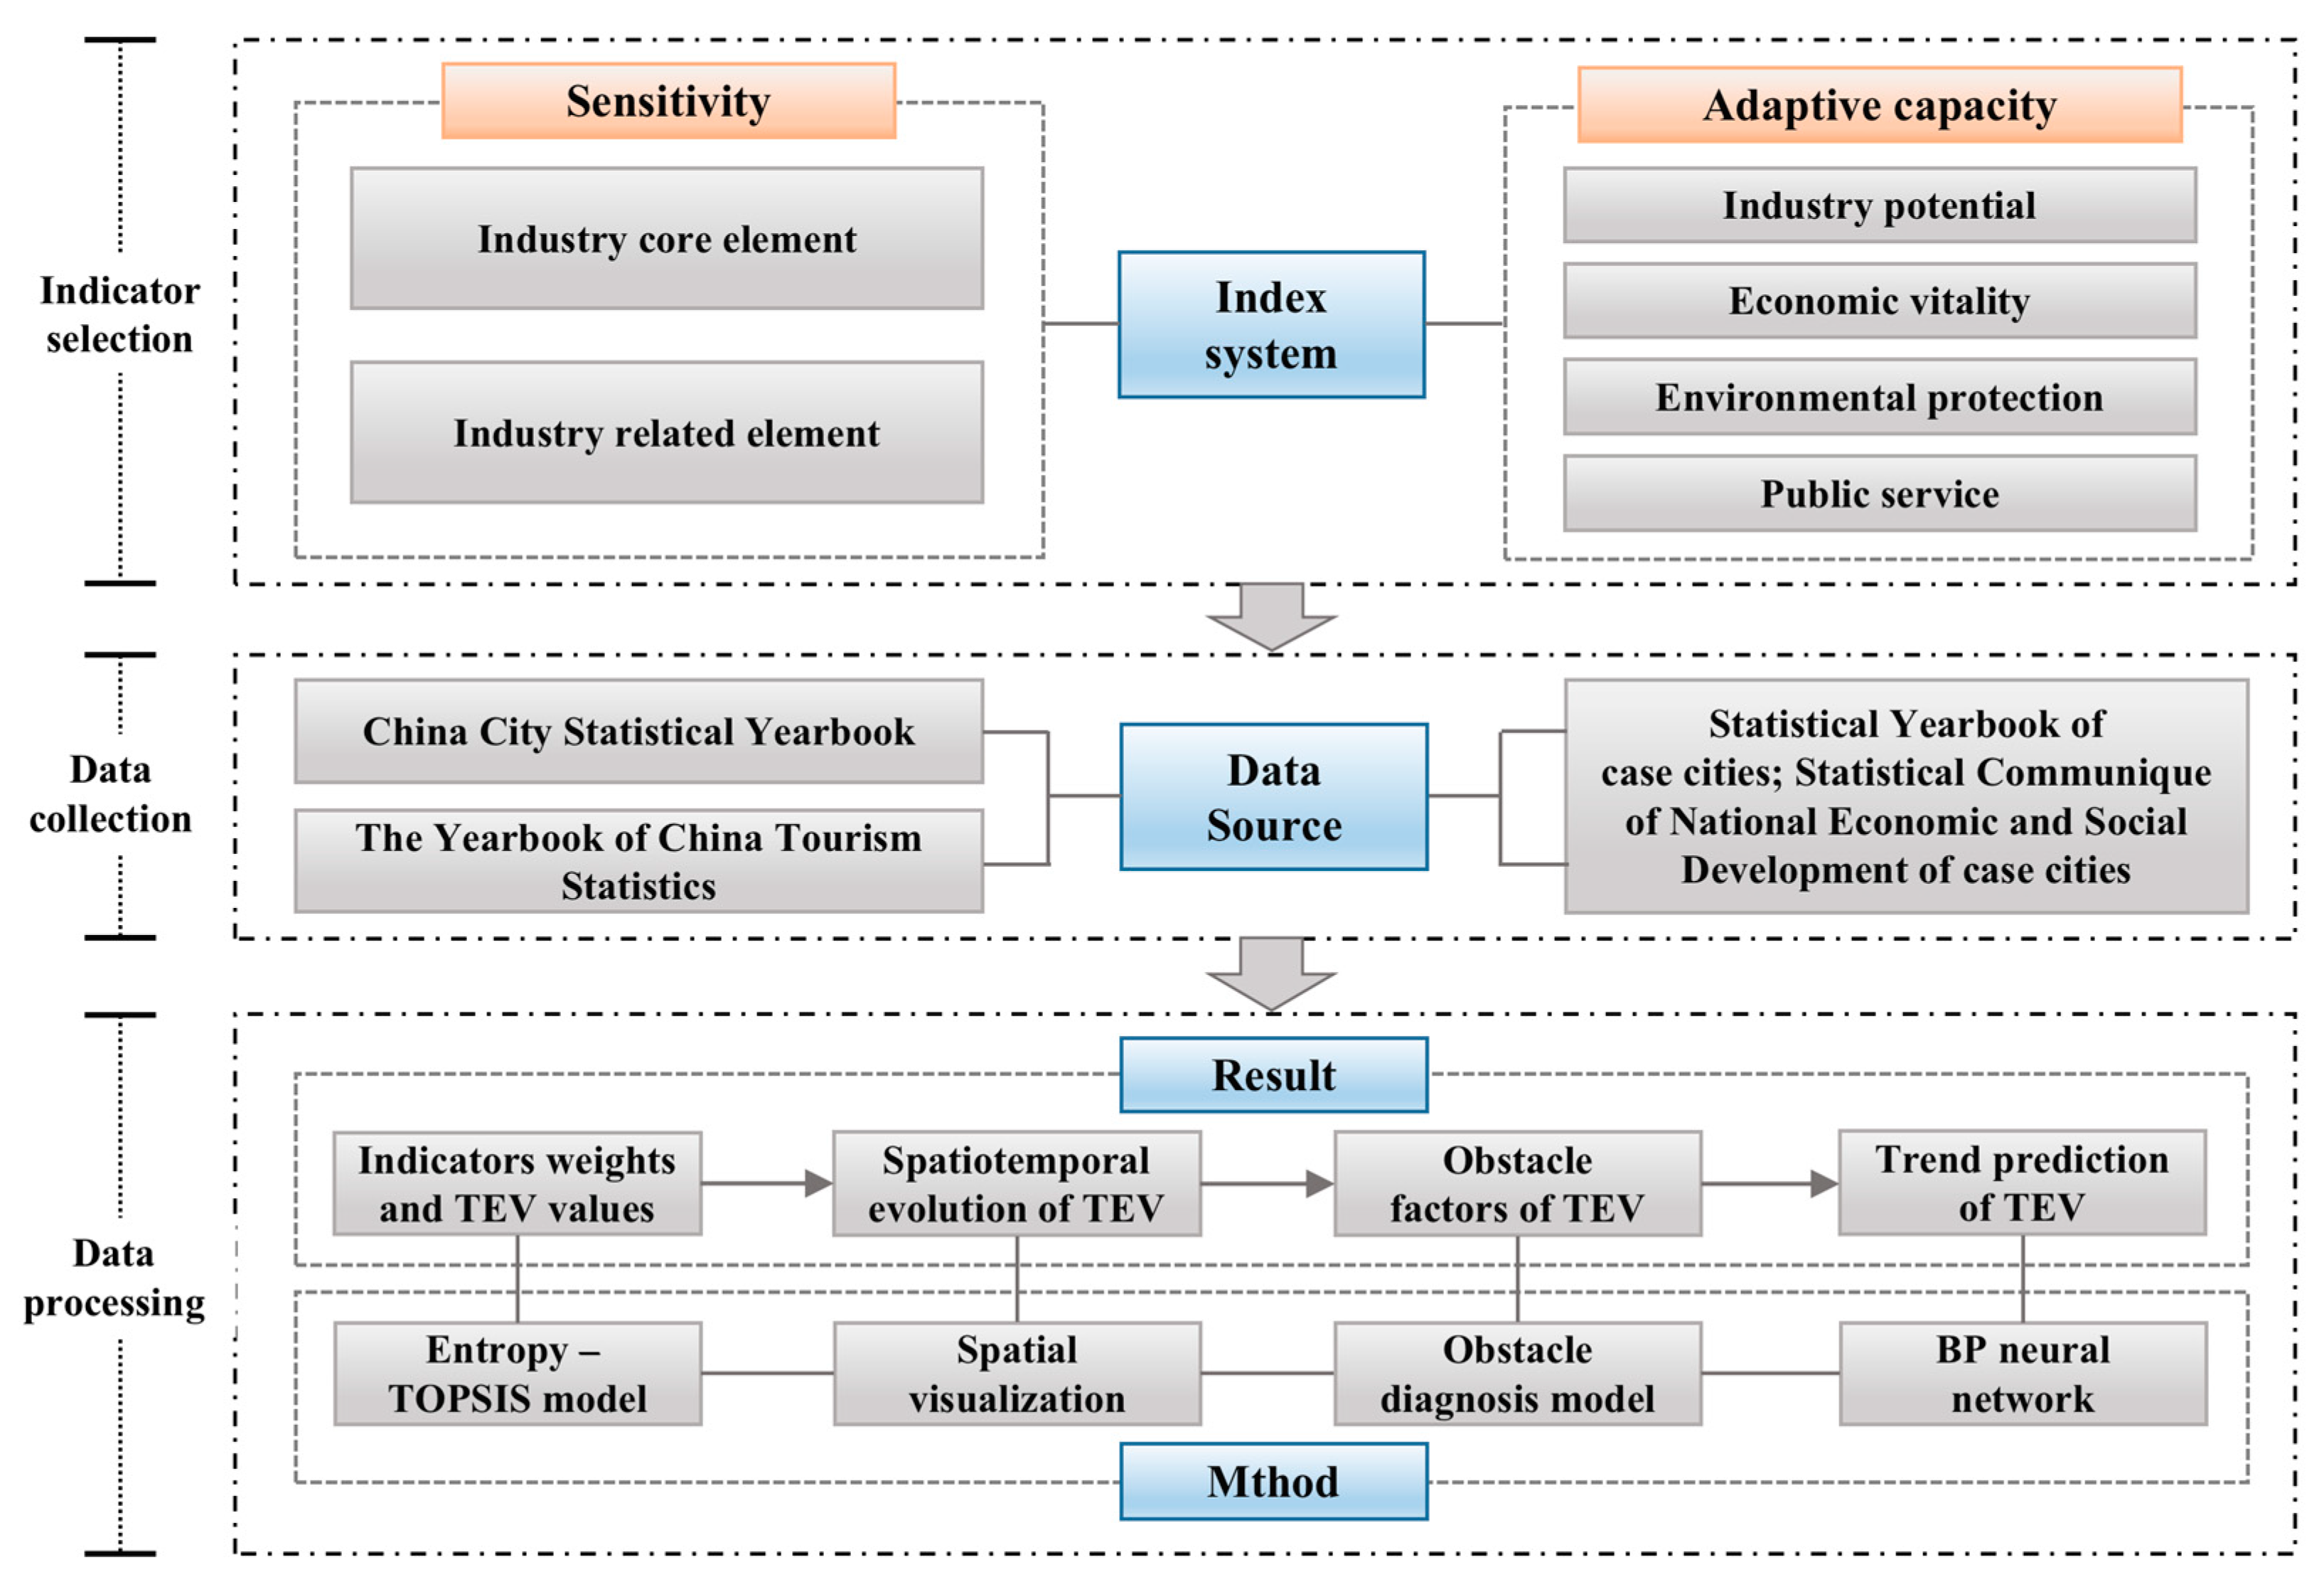
2.2. Research Framework

Figure 2 shows the implementation framework of this study, which mainly includes three steps. First, on the basis of relevant research, the evaluation index system of TEV was constructed from the two dimensions of sensitivity and adaptive capacity. Second, the data needed for this study were collected from various statistical yearbooks of China. Finally, the econometric correlation model and spatial visualization methods were used to present the research results.

2.3. Index System Construction

Polsky et al. constructed the vulnerability assessment system of “exposure, sensitivity, and adaptive capacity” in 2007, which provided a solid theoretical basis for vulnerability research [35]. After that, scholars in different fields continued to apply and expand the vulnerability theory model based on it, among which the two dimensions of “sensitivity and adaptive capacity” have been gradually taken as the core dimension of the vulnerability assessment of tourism [23,36]. Sensitivity refers to the ability of a system to withstand damage in the case of internal disorder and external impact [35]. The weaker the sensitivity is, the less vulnerable a system is to damage. Adaptive capacity refers to the ability of a system to quickly adjust from a crisis situation to a safe and stable situation [35]. The stronger the adaptive capacity is, the stronger the self-maintenance ability of a system and its ability to quickly recover from adverse effects. Sensitivity and adaptive capacity determine the vulnerability of a system in the interaction. The interaction between sensitivity and adaptive capacity determines the vulnerability of the tourism economic system. When the tourism economy has a high vulnerability, it indicates that the tourism economy has a poor anti-crisis ability, which reduces the speed at which the tourism economy can recover to a stable state; otherwise, the economic system is more secure.
As the sensitivity and adaptive capacity of the tourism economy are multiple structural variables, they involve complex economic environmental factors. To reflect the degree of TEV of major tourist cities in China in a comprehensive way, the evaluation index system proposed in this study was constructed as follows. First, the construction methods and contents involved in the existing research on the index system of TEV were fully utilized for reference [21,23,32,36]. Second, the accessibility of the data of each indicator was ensured. Finally, the index system can be applied to different types of tourist cities in China. On the basis of the above considerations, this study combined the basic elements of the tourism industry, social economy, finance, infrastructure construction, and ecological environment, and a total of 27 indicators from the two aspects of sensitivity and adaptive capacity were selected to construct an evaluation index system for the TEV of major tourist cities in China. Table 1 shows the specific indicators.
In terms of sensitivity, TEV is not only affected by the core elements within the tourism industry; it is also closely related to the external elements of the tourism industry. According to the viewpoints of scholars, the sensitivity is positively correlated with TEV; that is, the higher the sensitivity, the higher the TEV, and vice versa [23,37]. Therefore, all indicators attribute of sensitivity should be positive. In this study, the sensitivity index of TEV was mainly constructed from two levels of industry core elements (S1–S6) and industry-related elements (S7–S10), including 10 specific indicators. Among them, S1, S2, S5, and S6 were mainly used to reflect the dependence of urban economic development on the tourism industry; due to the instability of the tourism industry, the higher the dependence proportion, the higher the vulnerability of the urban tourism economy. S3 and S4 mainly reflect the dependence of the urban tourism industry on inbound tourism development. Inbound tourism has many potential uncertainties and is more susceptible to various unexpected factors than domestic tourism. Therefore, the higher the dependency ratio, the higher the vulnerability of the urban tourism economy. S7, S8, and S9 mainly reflect the level of environmental quality of the tourist destination; The higher the pollution level, the higher the vulnerability of the urban tourism economy. S10 mainly reflects the employment situation of tourist cities; if the unemployment rate is higher, it indicates that urban economic development is at a low stage, and the vulnerability of the urban tourism economy is higher.
In terms of adaptive capacity, when the urban tourism economic system is impacted, the development potential of the urban tourism industry and the construction level of the city in terms of economy, ecology, and public services are particularly important for coping with the crisis. According to the viewpoints of scholars, the adaptive capacity is negatively correlated with TEV; that is, the higher the adaptive capacity, the lower the TEV, and vice versa [23,37]. Therefore, the indicators attribute of adaptive capacity should all be negative. In this study, the indicators of the adaptive capacity of the tourism economic system were mainly constructed from four aspects of the industrial potential, economic vitality, environmental protection, and public service of urban tourism, including 17 specific indicators. A1 and A2 reflect the growth capacity of the regional tourism industry and the attraction of urban tourism, respectively; the higher the growth rate of the total tourism income and the total number of tourists received, the stronger the adaptive capacity of the tourism economy and the lower the TEV. A3, A4, A5, and A6 objectively reflect the city’s overall economic strength and economic development potential. The higher the GDP per capita, GDP growth rate, fixed asset investment per capita, and per capita year-end deposit balance of financial institutions, the higher the level of urban economic development, and the lower the TEV [36]. A7, A8, A9, and A10 reflect the environmental protection level of the city; the more green space and the higher the garbage and sewage treatment rate, the higher the anti-risk response-ability of the city’s tourism economy and the lower the TEV. A11, A12, A13, A14, A15, A16, and A17 reflect the city’s public service levels in terms of postal services, medical services, transportation, and communication; the better the public service level, the stronger the city’s ability to deal with tourism emergencies and the lower the corresponding TEV.

2.4. Data Sources

The data sources of this study mainly include the following two aspects. First, data on the economy, environment, and public services of 58 major tourist cities in China, from 2004 to 2019, mainly came from the China City Statistical Yearbook (CCSY). CCSY is an annual publication reflecting the social and economic development of Chinese cities. Each issue contains major statistics on the social and economic development of Chinese cities at all levels in the previous year. Detailed statistics of the development data of 58 major tourist cities in China can be found in CCSY. If some of the data could not be found in the CCSY, Statistical Yearbooks (SY) of each tourist city were searched to supplement the data in this study. Second, data on the tourism industry and other aspects of 58 major tourism cities in China, from 2004 to 2019, mainly came from the SY of each city, Statistical Communique of National Economic and Social Development (SCNESD), and the Yearbook of China Tourism Statistics (YCTS). In addition, in order to enhance comparability, some of the data were processed by secondary calculations. The data sources for each case city were detailed in Table A1 (Appendix A).

2.5. Research Methods

2.5.1. The Weights of Indicators Were Calculated by the Entropy Weight Method

As an objective weight assignment method, the entropy weight method determines the weight based on the variation degree of the data, which can effectively eliminate the interference of human factors and has strong objectivity and reliability. In view of this, the method in this study was used to calculate the weight of each of the 27 indicators in the TEV index system. The formula for each step of the model is as follows [38,39]:
(1)
Set the original evaluation matrix as:
X = ( x i t ) m × n
In the formula, x i t represents the original value of the t -th index in the i -th sample; i = 1 ,   2 ,   ,   m , where m is the sample number;     t = 1 ,   2 ,   ,   n ; n is the number of indicators. It should be noted that the sample number m in this study is 928, which is composed of 16 years of data (2004–2019) for 58 major tourist cities in China. In addition, the number of indicators n in this study is 27, and they are the indicators in Table 1.
(2)
Standardize the above original evaluation matrix to form a standardized matrix:
Y = ( y i t ) m × n
where y i t represents the standardized value of the t -th indicator in the i -th sample. Among them, the positive indicators are y it = ( x i t x m i n ) / ( x m a x x m i n ) , and the negative indicators are y i t = ( x m a x x i t ) / ( x m a x x m i n ) .
(3)
Use the entropy weight method to obtain the weights of indicators. The specific calculation formula is as follows:
w t = ( 1 E t ) / ( m t = 1 m E t )
p i t = y i t / i = 1 n y i t
E t = 1 ln n i = 1 n p i t ln p i t
In the formula, i is the sample reference, and t is the indicator reference. p i t represents the feature proportion, E t represents the information entropy, and w t represents the weight of the t -th indicator.

2.5.2. TOPSIS Model Was Used to Calculate the Values of Sensitivity, Adaptive Capacity, and TEV

On the basis of the indicator weight, the TOPSIS model can be used to calculate the value of each evaluation object. The calculation principle of the TOPSIS model is to calculate the distance between each evaluation object and the optimal (inferior) solution, and then determine the relative approximation degree between the evaluation object and the ideal solution, so as to calculate the evaluation value. In this study, it was introduced to calculate the annual value of the TEV of 58 major tourist cities in China from 2004 to 2009, as well as the values of sensitivity and adaptive capacity of the components of TEV. In this study, the formula of the TOPSIS model used in the calculation of sensitivity, adaptive capacity, and TEV is the same, with the only differences being the indicator types. The calculation formula for each step of the TOPSIS model is as follows [38,39]:
(1)
Construct the weighting matrix:
S = Y × W t
where Y is the matrix obtained after standardized processing in the entropy weight method mentioned above, and W t is the weight of indicator t .
(2)
Determine the optimal solution S t + and the worst solution S t for the t -th indicator:
S t + = max { S 1 t , S 2 t , , S m t } S t = min { S 1 t , S 2 t , , S m t }
(3)
Calculate the Euclidean distance between the optimal (inferior) solution and the positive (negative) ideal solution. i is the sample reference, and t is the indicator reference:
R i + = t = 1 n ( S t + S i t ) 2 ; R i = t = 1 n ( S t S i t ) 2
(4)
Calculate the proximity Ci:
C i = R i R i + + R i
In the formula, i is the sample reference. The C i value is within (0, 1). The higher the value of C i is, the better the evaluation object, and vice versa.
It should be noted that when calculating sensitivity, the indicator t in the formula contains S1–S10, a total of 10 indicators. When calculating adaptive ability, the indicator t in the formula includes A1–A17, a total of 17 indicators. When calculating TEV, the indicator t in the formula includes S1–S10 and A1–A17, a total of 27 indicators.

2.5.3. The Main Factors Affecting TEV Were Detected by the Obstacle Diagnosis Model

The obstacle diagnosis model can effectively analyze and identify the obstacles that affect the development level of the regional system elements and has been widely used in many fields. In this study, two problems can be clarified by introducing the obstacle degree model. First, it is clear which of the 27 indicators of TEV have a major impact on TEV. Second, the obstacle factors affecting TEV in different cities are clearly different. The formula is as follows [40]:
M i t = R t × P i t t = 1 n ( R t × P i t ) × 100 %
In the formula, i is the sample reference, and t is the indicator reference. M i t is the obstacle degree of the t -th indicator to the ecological tourism security in i samples; R t is the weight of each indicator, representing the contribution degree of the obstacle factors. P i t = 1 y i t represents the deviation between indicators and development goals, and y i t is the standardized value of each indicator. In addition, it should be noted that there may be deviations in evaluation results caused by accidental factors in a single year. Therefore, for the diagnosis results of the obstacle factors in 58 major tourist cities in China, the 16-year average, from 2004 to 2019, was used to obtain the diagnosis results.

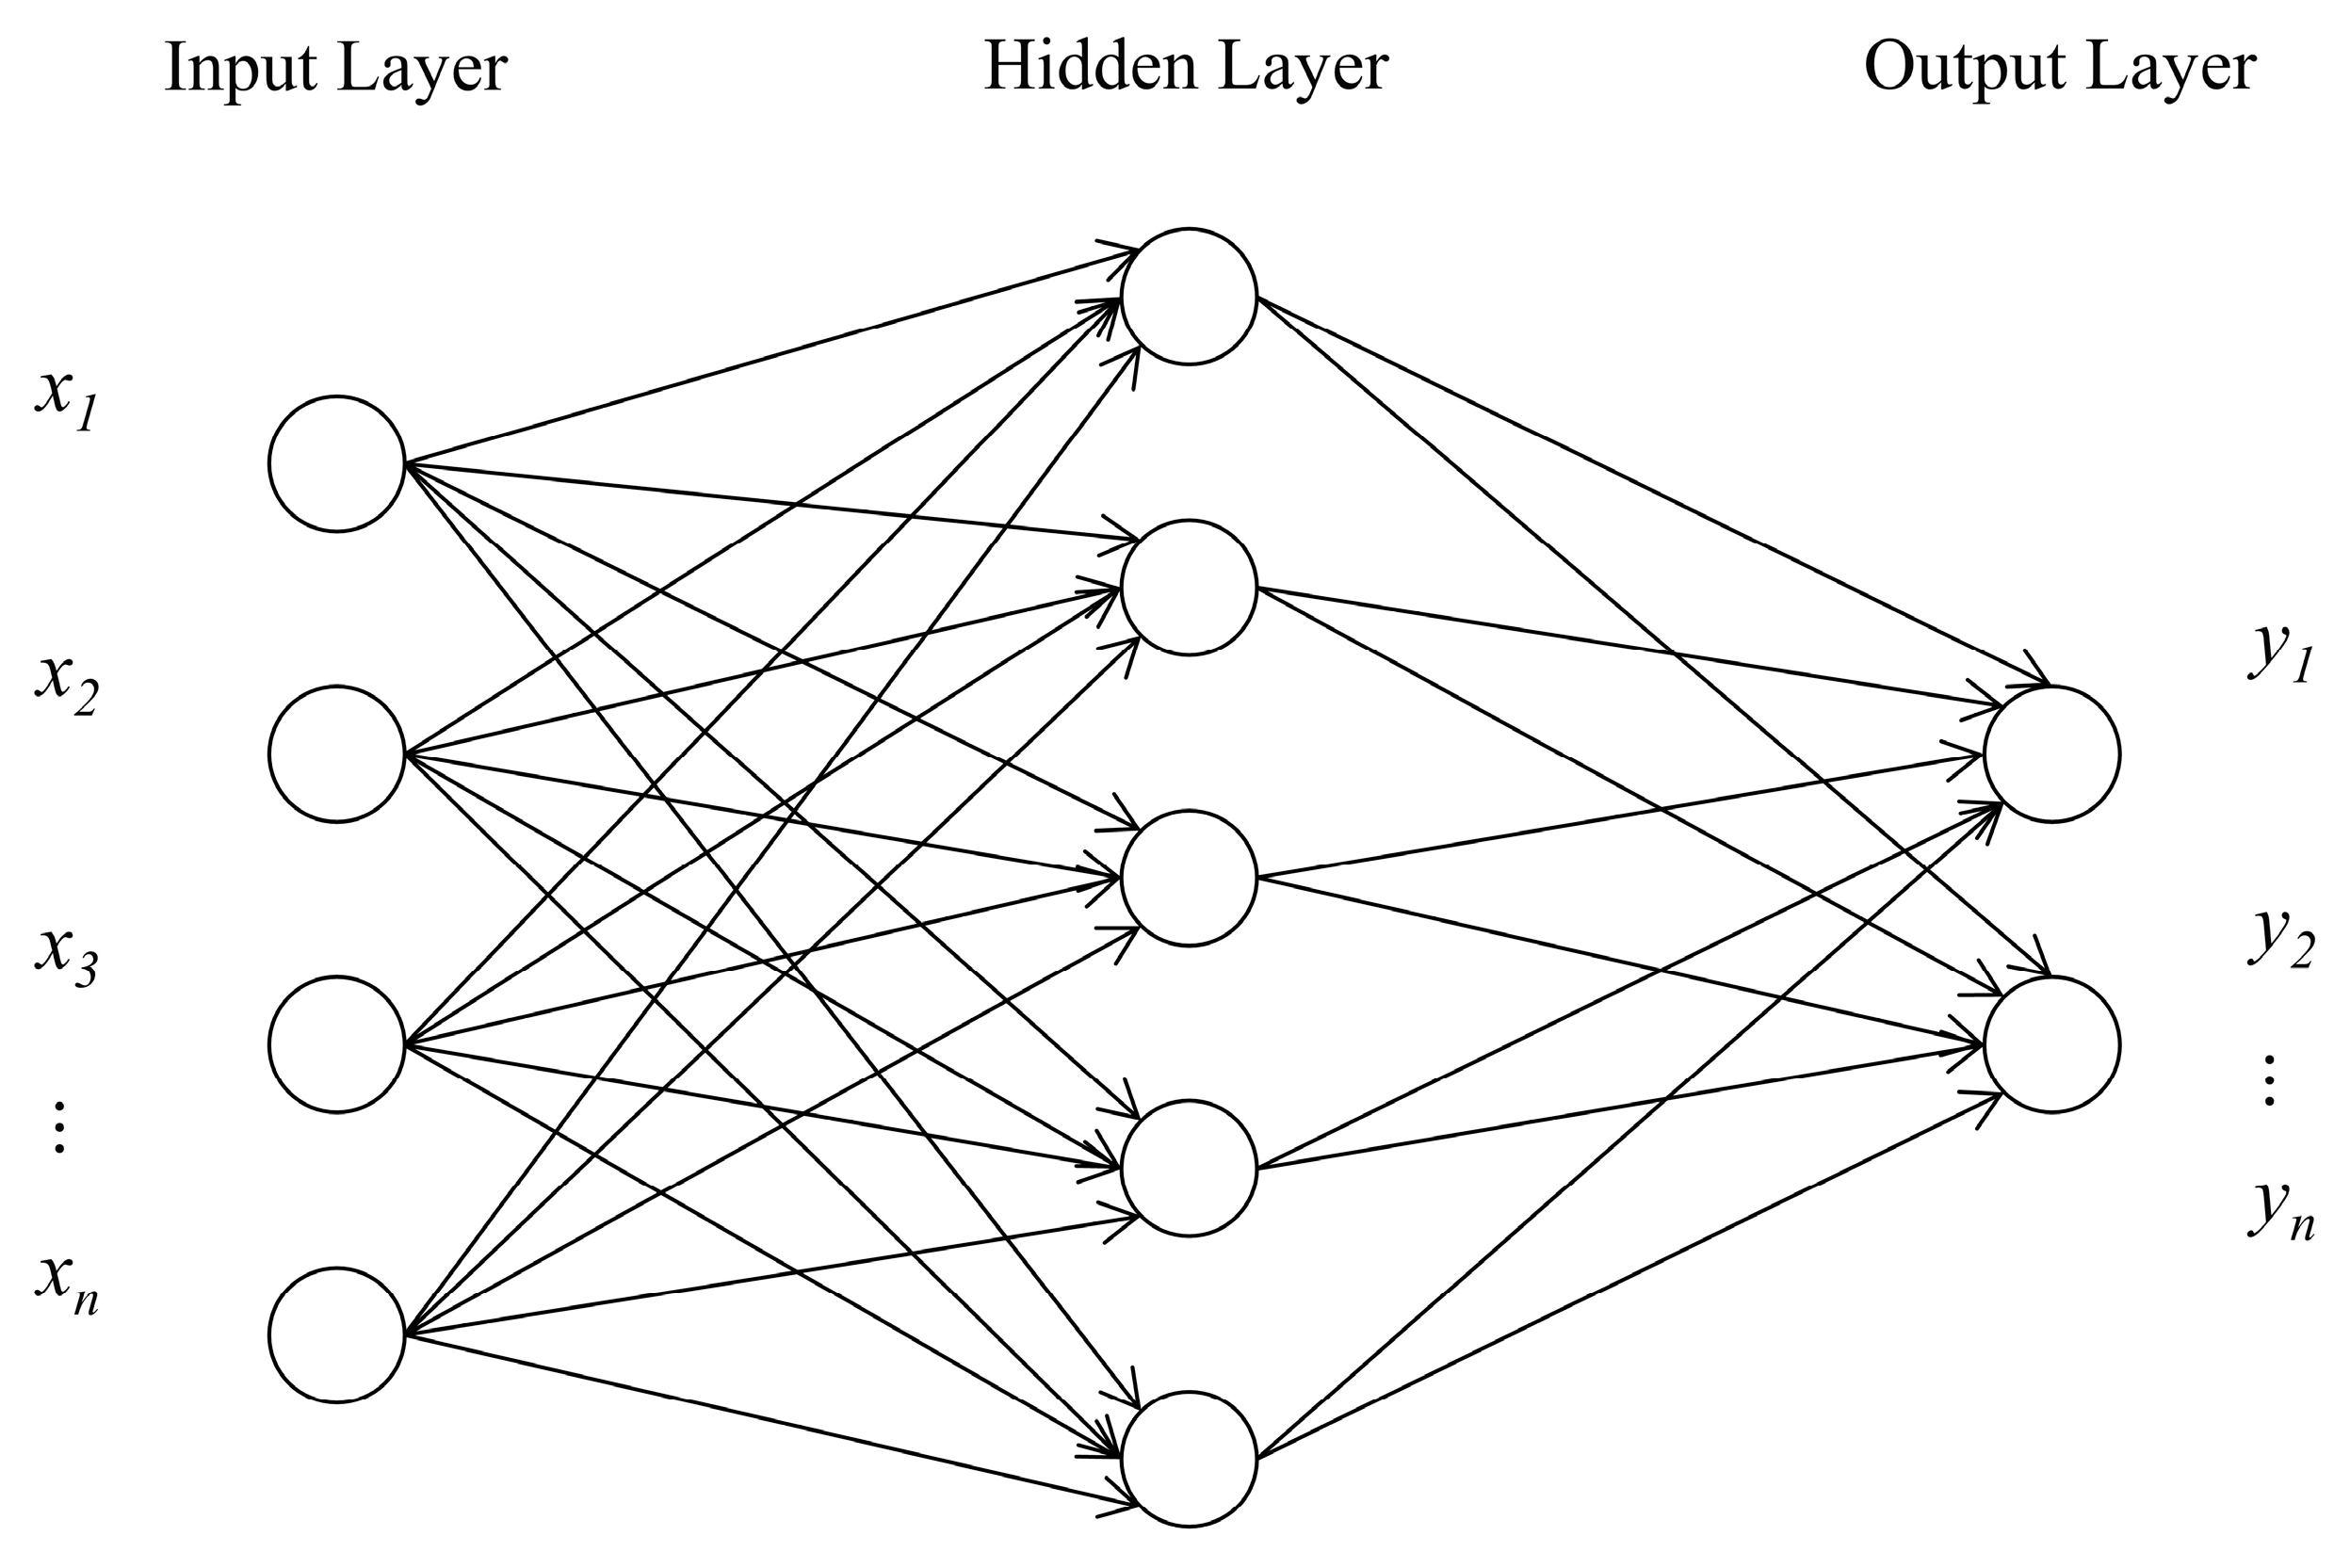
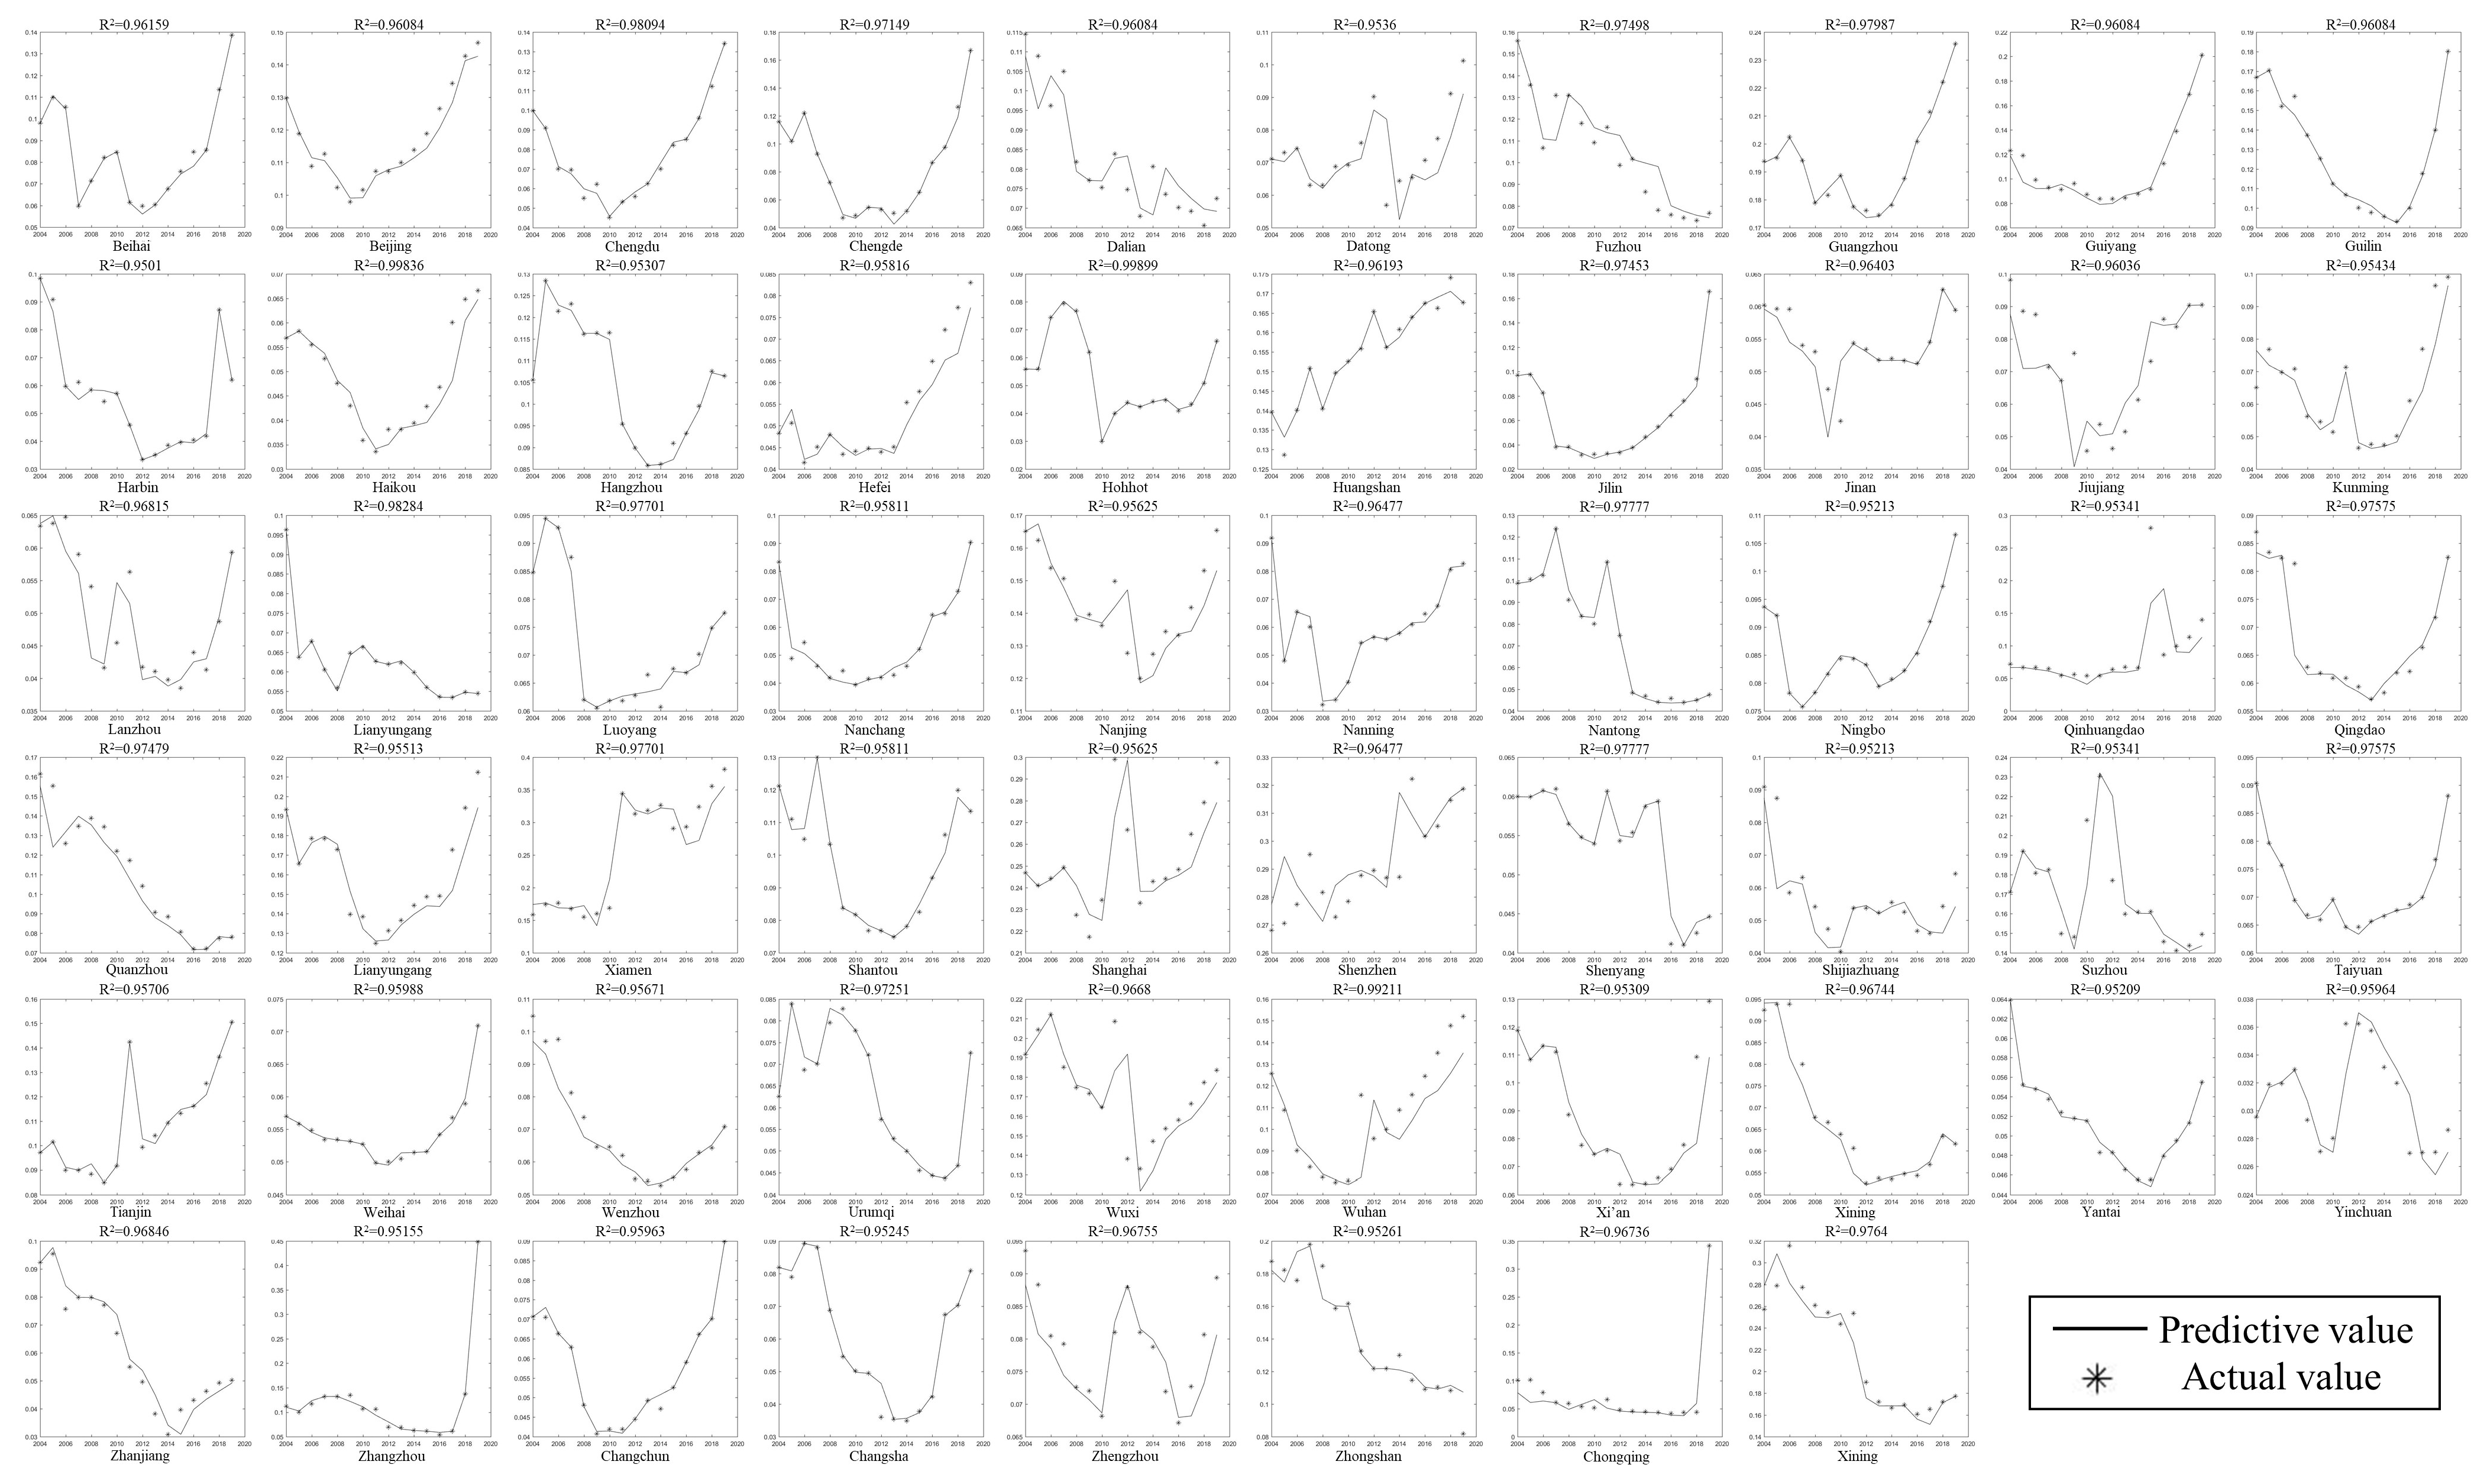
2.5.4. The Evolution Trends of TEV Were Predicted by the BP Neural Network Model

(1)
Model setting
The BP neural network, also known as the error-back propagation neural network, has been developed into the most important and widely used artificial neural network algorithm owing to its advantages such as flexible structure design, multiple training algorithms, and good operability [41]. The structure of the BP neural network is a multilayer forward neural network, with an input layer, several hidden layers, and an output layer (Figure 3). Neural networks are connected by links, each of which has a weight. Weight is the basic form of the neural network, and artificial neurons learn by constantly adjusting these weights. The process of a neural network involves the following steps [42]. The first is the selection framework; the second is deciding what kind of learning algorithm to use. Finally, the neural network is trained, which involves initializing the weight of the network and changing the weight value through a series of training steps.
(2)
Model building
The BP neural network with a three-layer structure was adopted. The input variable is the year corresponding to TEV index, the middle is the hidden layer, and the output variable is TEV index. The number of neurons in the hidden layer was determined by experiments. According to the number of neurons in the input layer and the output layer, the number of neurons in the hidden layer was tentatively determined as 8–12. By comparing the prediction errors of different hidden layer networks, the number of hidden layer neurons was finally set as 10.
(3)
Initial data processing and parameter setting
To prevent neurons from reaching the saturation state, the sample data were first normalized. MATLAB programming was used to normalize the sample data to the interval of 0–1, according to the positive and negative properties of the indicators. These data were taken as the input, and the standardized TEV was taken as the output data to form a training sample for the BP neural network. When the transfer function of the intermediate layer is an S-shaped tangent function, and the transfer function of the output layer is a linear function, the prediction result is optimized. Considering that the function trainlm converges quickly, and the training error of the network is relatively small, the LM algorithm was selected for training, the maximum training times were set as 1000, the target accuracy was set as 0.0001, and the learning rate was set as 0.01.
(4)
Model training and testing
The data of 58 major tourist cities in China, from 2004 to 2019, were trained separately. During the training, the sample data were randomly divided into two groups according to the proportions of 80% and 20% and used as training and test data, respectively. Figure 4 shows the regression accuracy of the neural network model. The correlation coefficient R 2 of the test samples was higher than 0.95, and the average error rate was 1.49%, showing a good fitting effect. Therefore, the neural network model can be used to better predict the TEV of China’s major tourist cities from 2021 to 2030.

3. Results

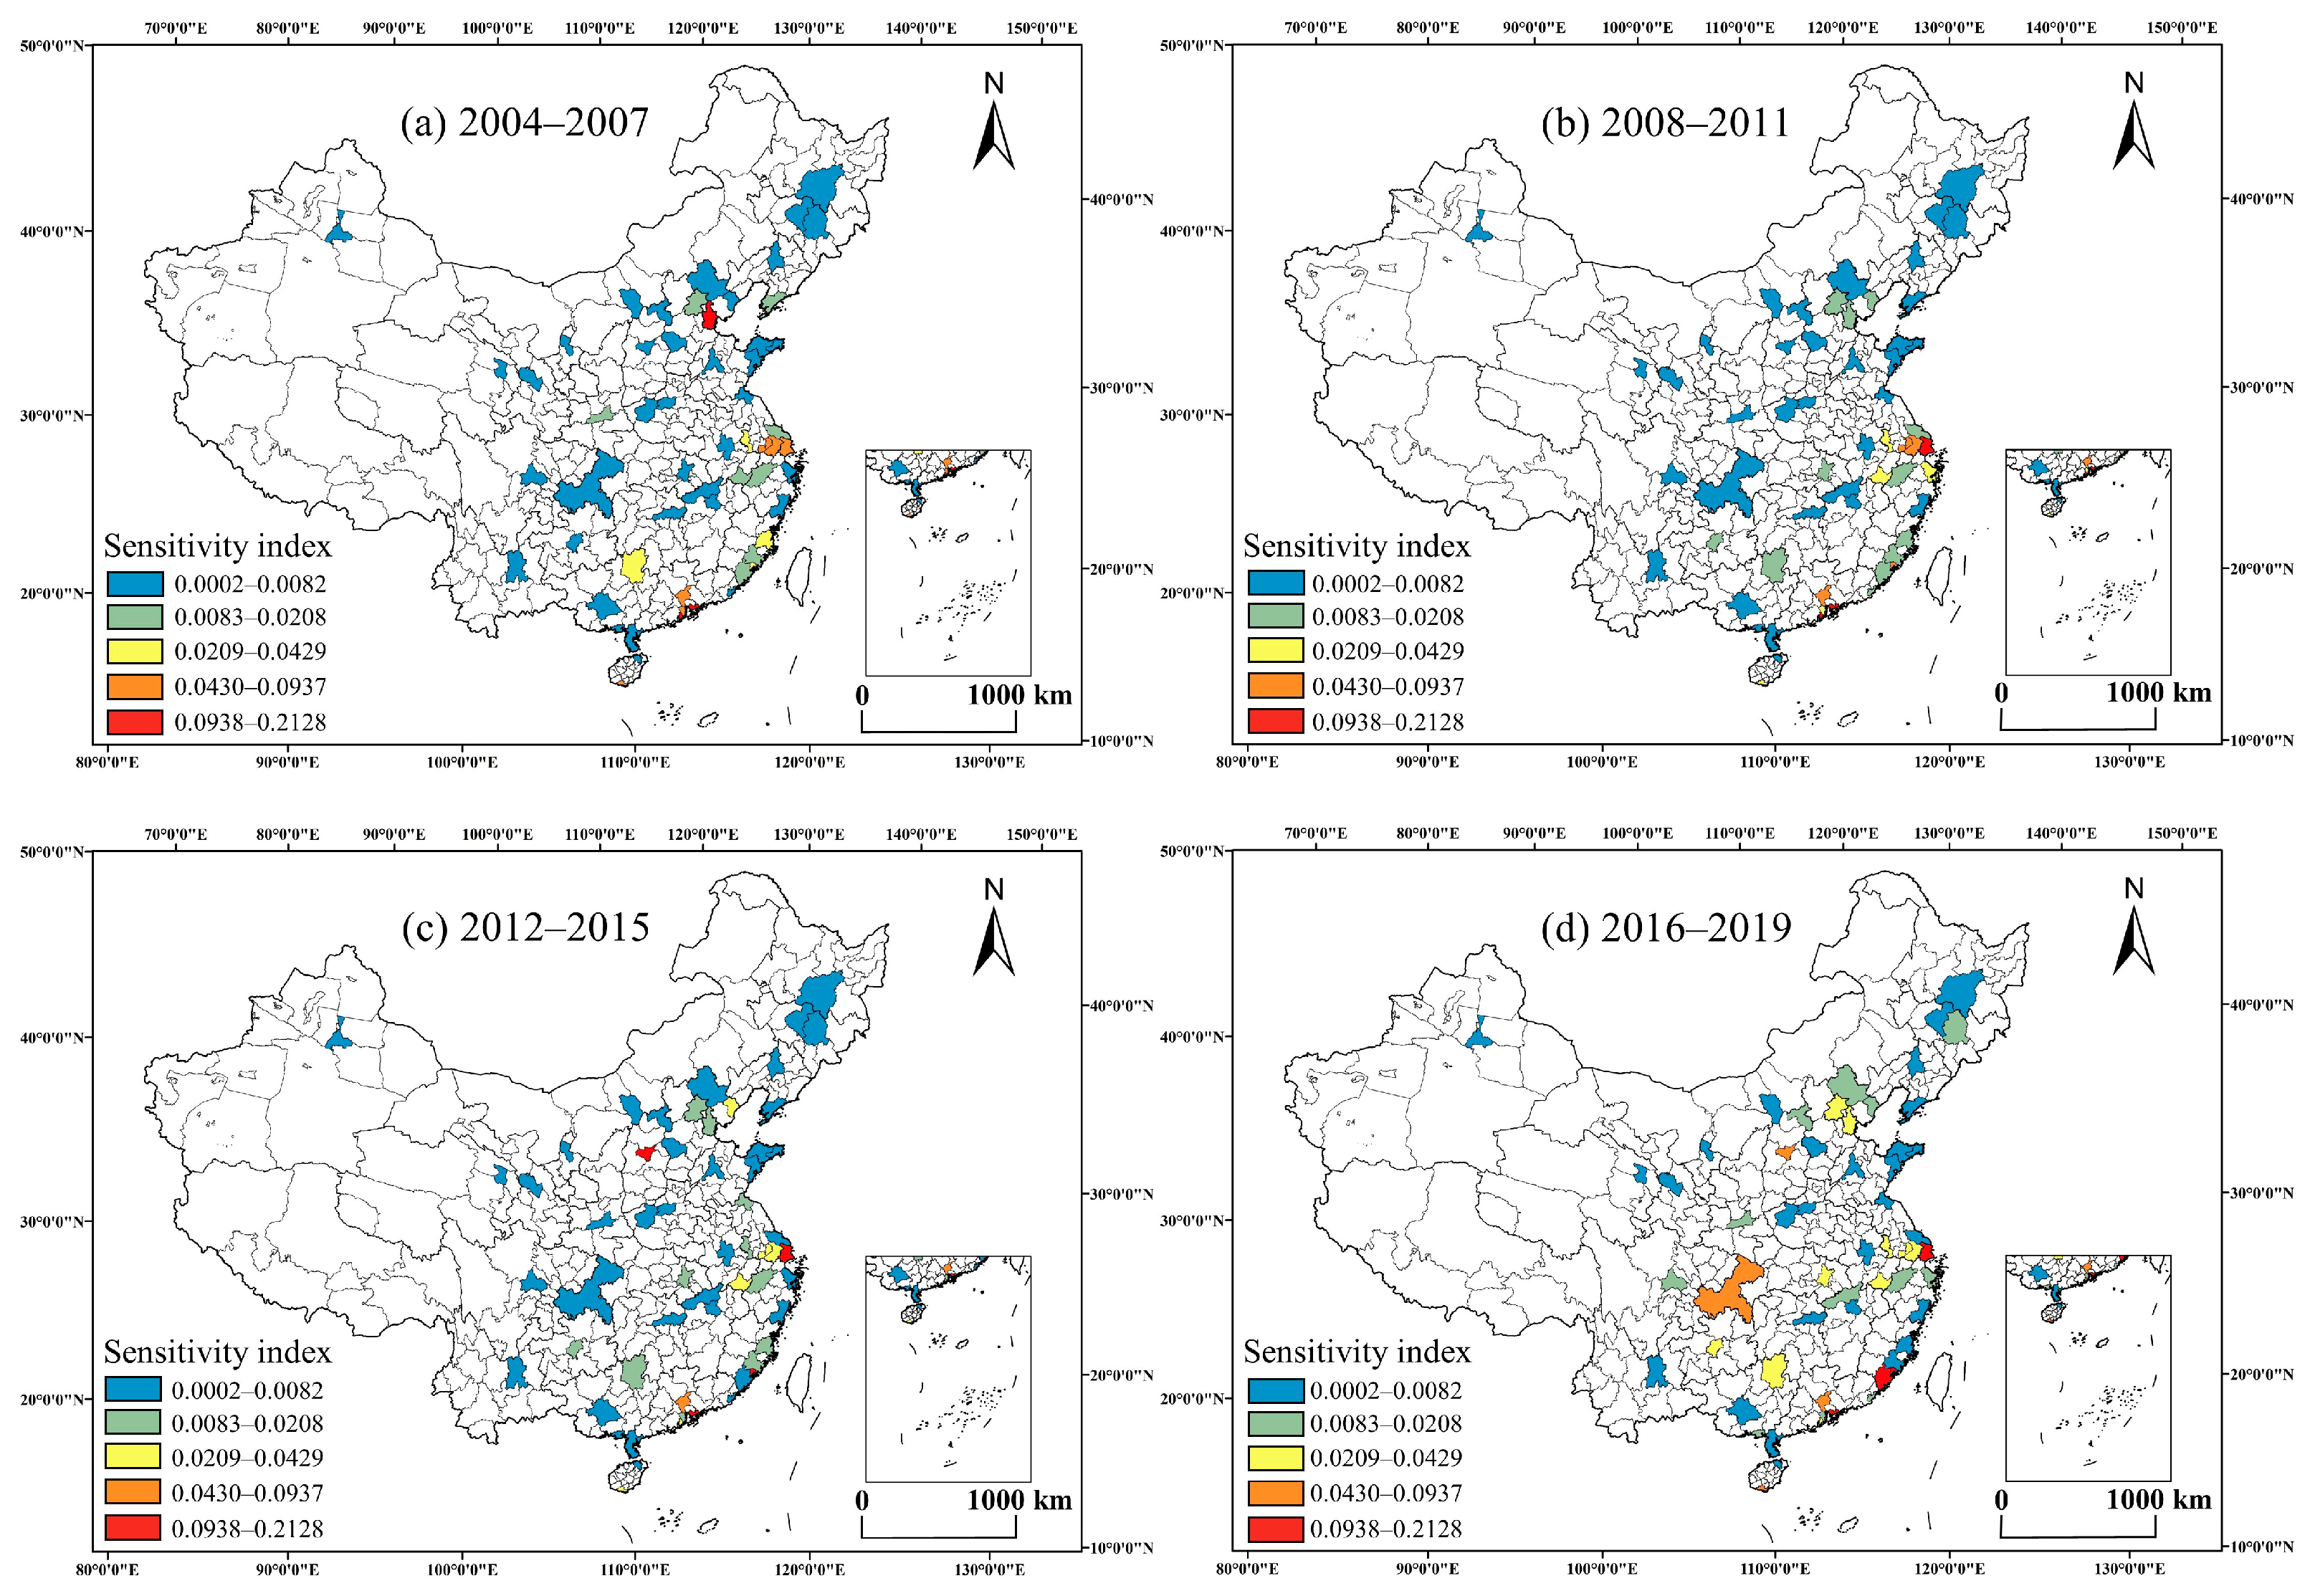
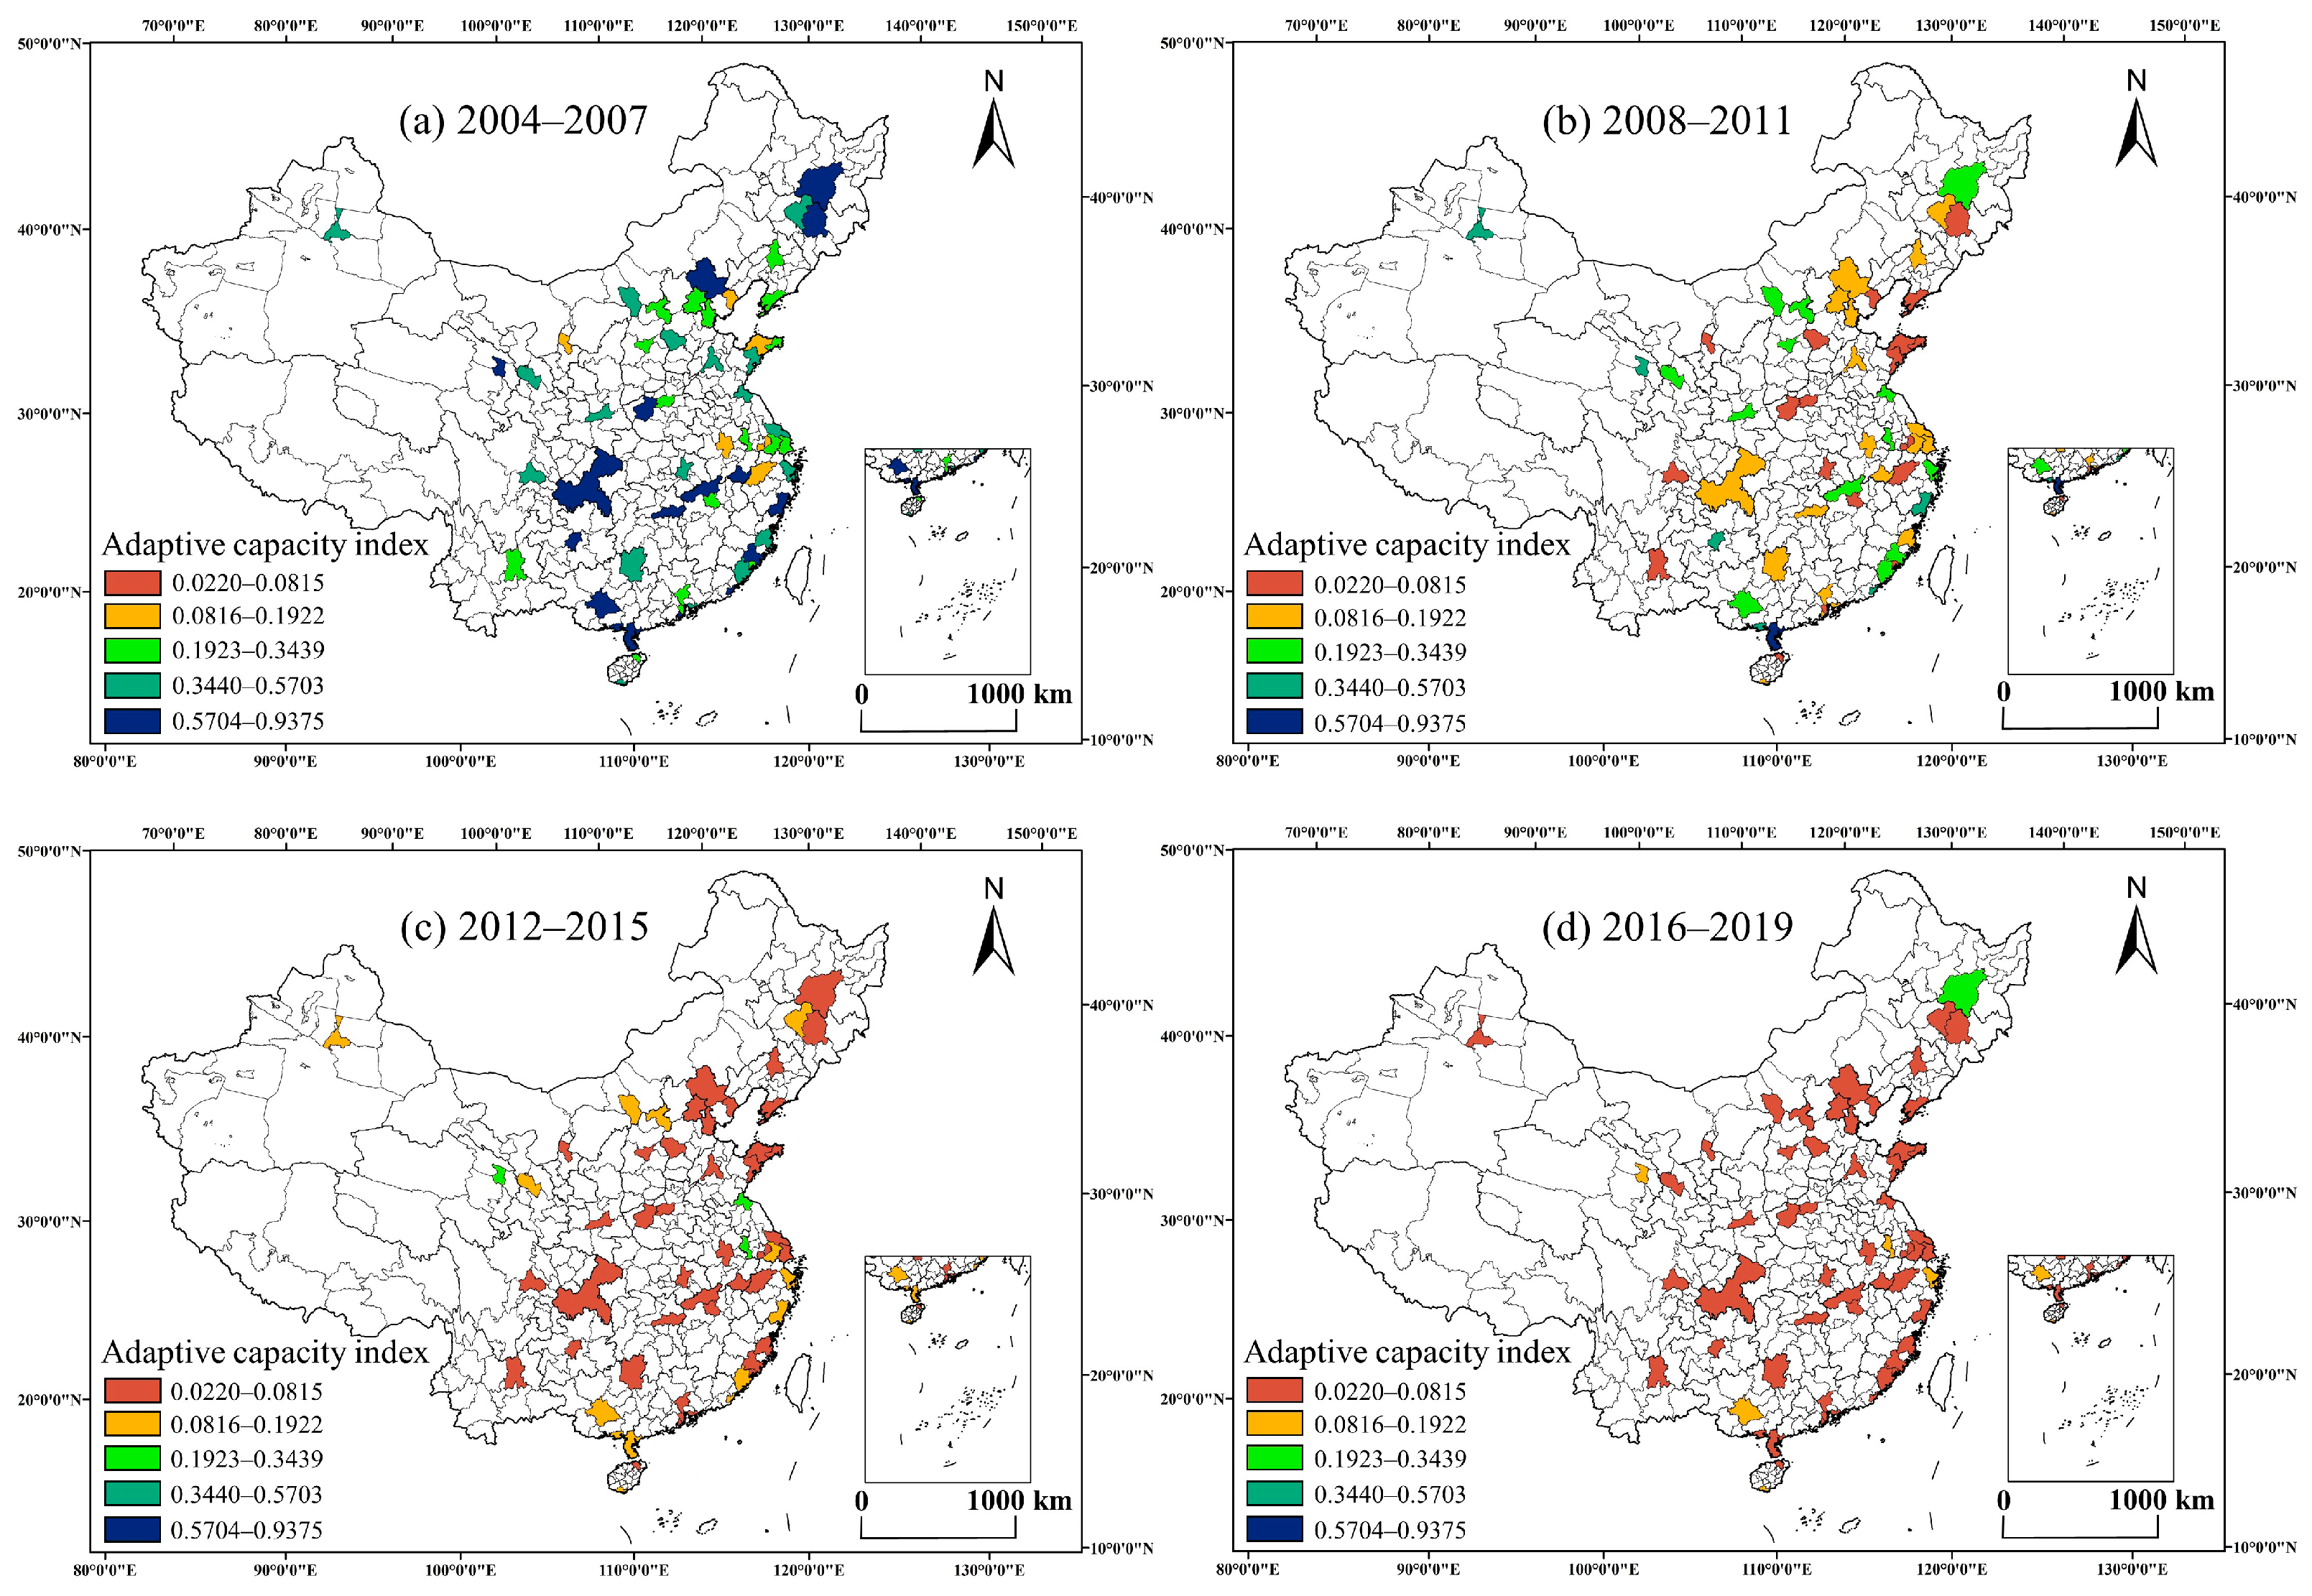
3.1. Spatiotemporal Evolution of Urban TEV

3.1.1. The Evaluation of Each Indicator Weight in Urban TEV

In this study, the weights of 27 indicators were calculated by using the entropy weight method, and the calculation results are shown in Table 2. Among them, S1–S10 are the indicators of the “sensitivity” part of the TEV, A1–A17 are indicators of “adaptive capacity” part of the TEV.

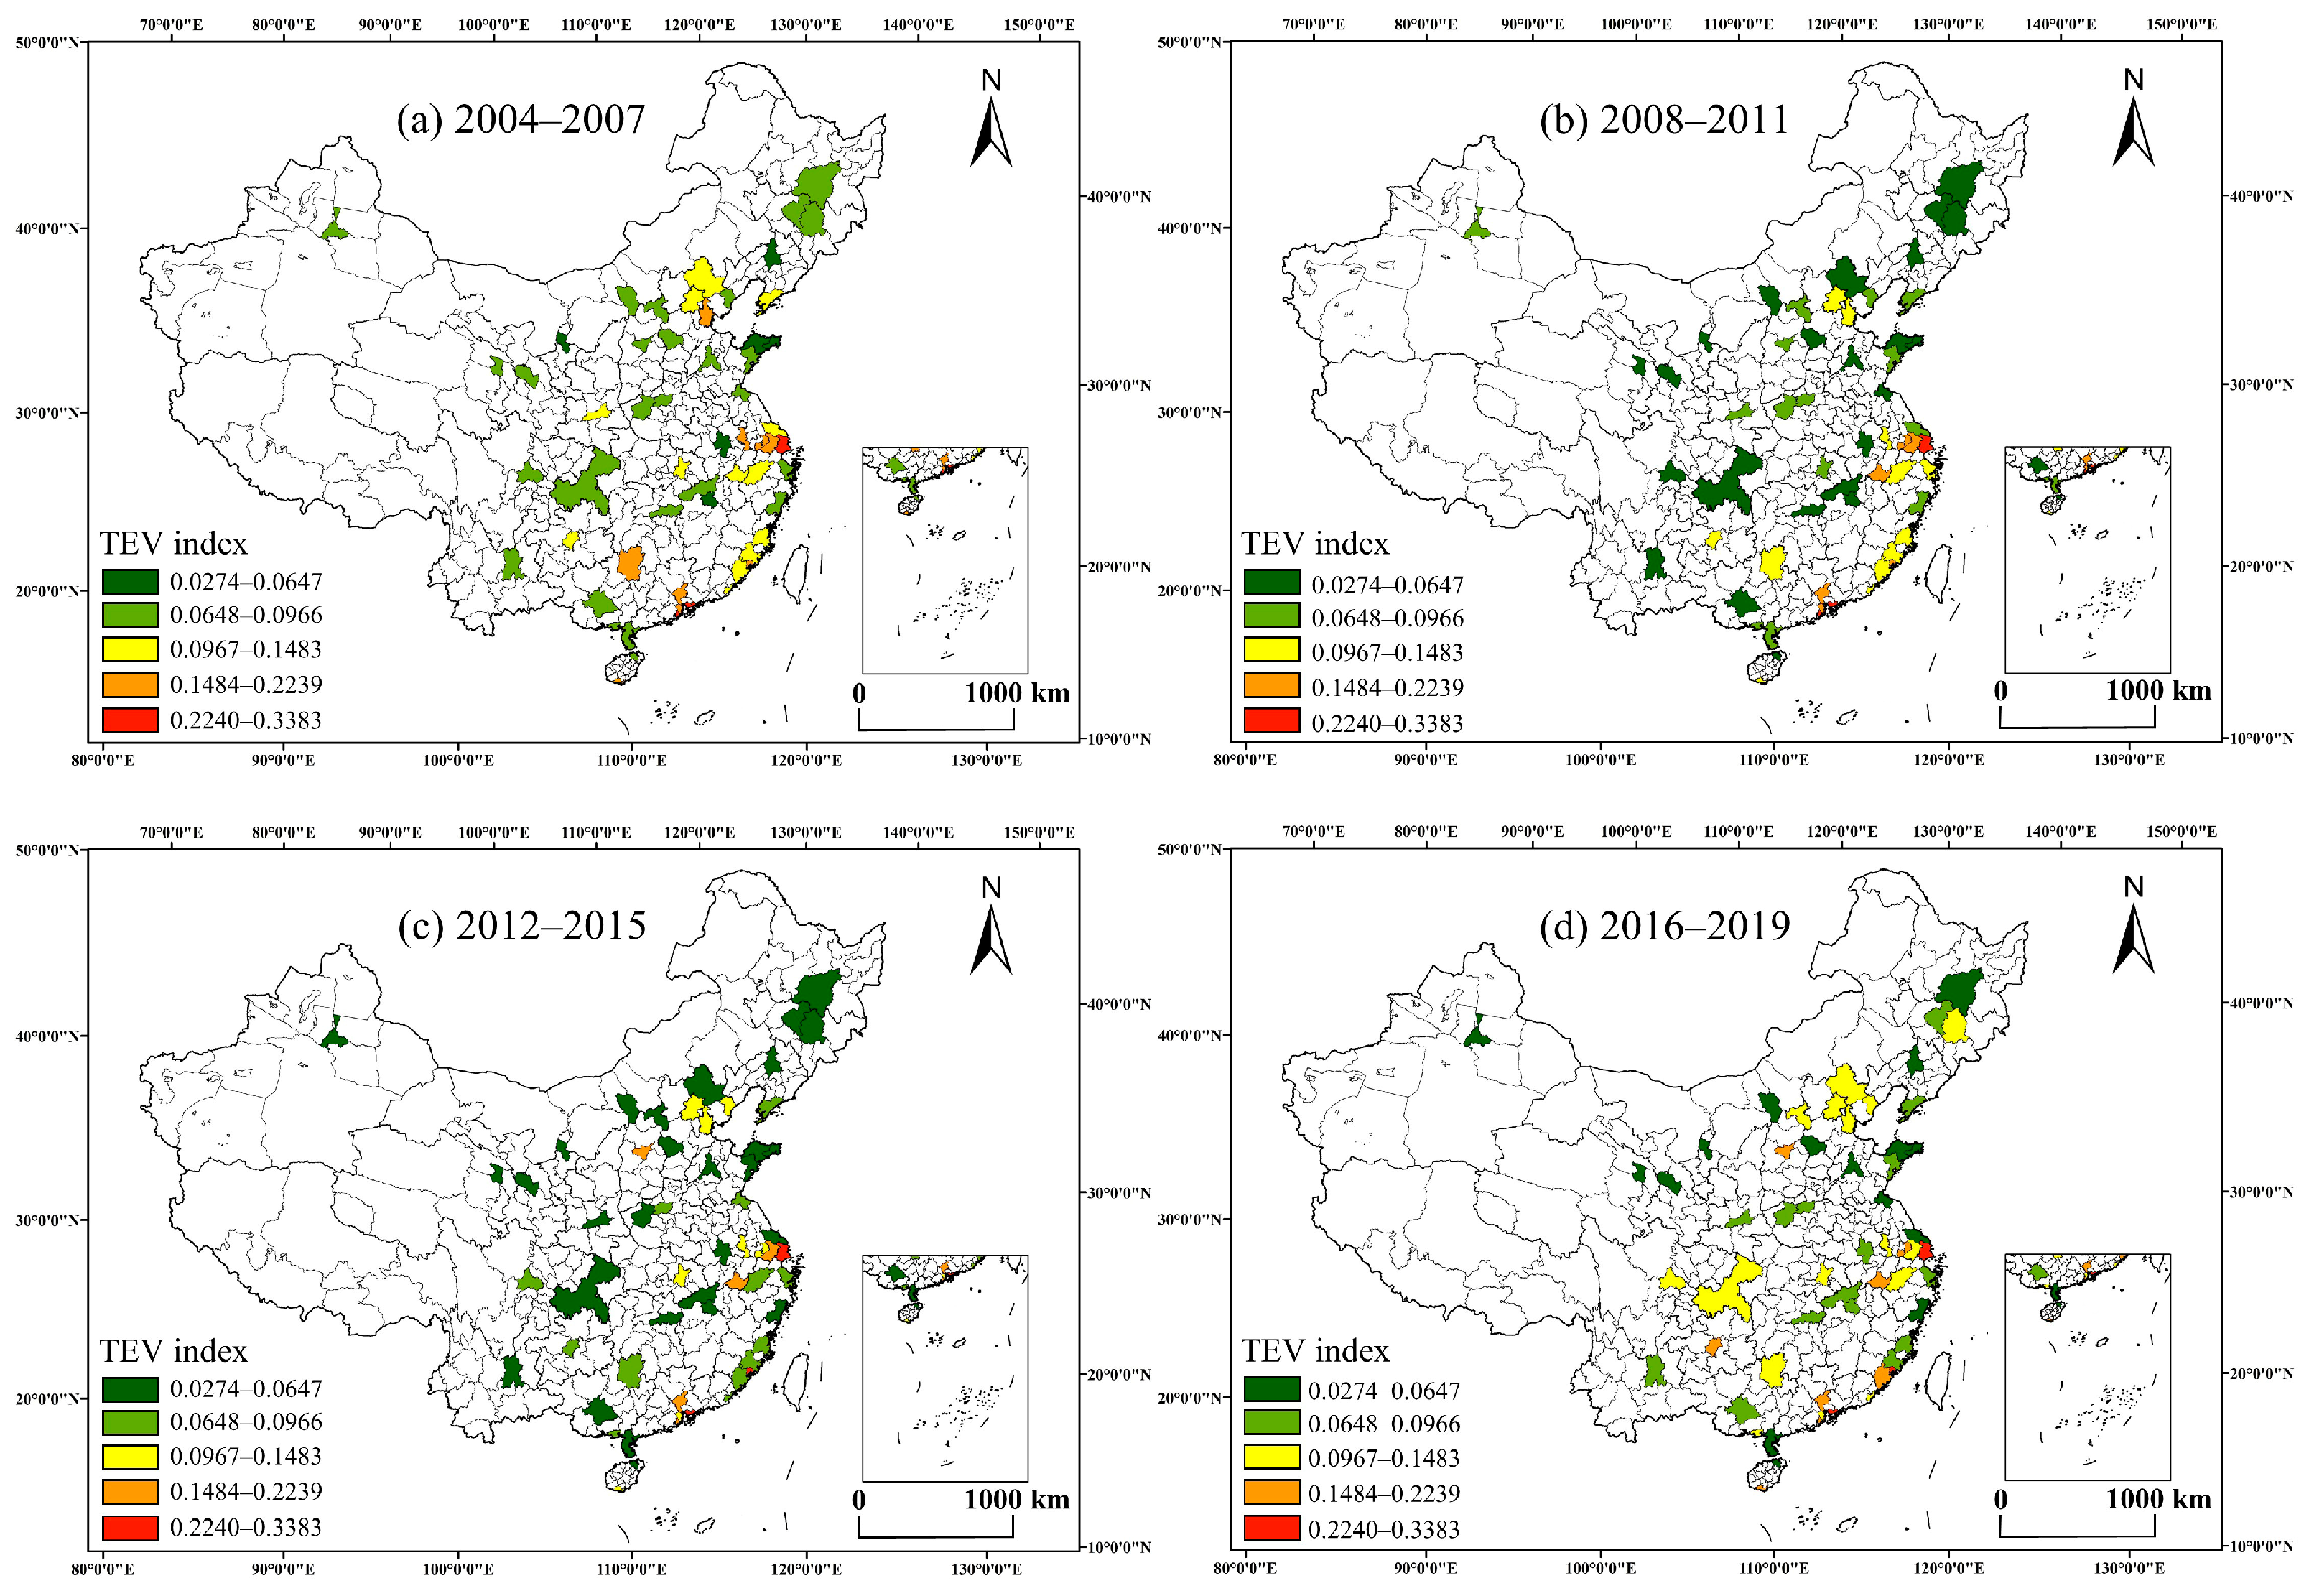
3.1.2. Spatiotemporal Changes of Urban TEV

Figure 5 shows the sensitivity dimension of the urban TEV. During the period from 2004 to 2007, cities with high sensitivity values were mainly distributed in economically developed regions such as Shanghai, Suzhou, Shenzhen, Zhuhai, and Guangzhou in China’s Yangtze River Delta and Pearl River Delta. In addition, Tianjin, located in Northern China, has a high sensitivity value. During the period from 2008 to 2011, the sensitivity values of all cities in this stage were basically similar to those in the previous stage, and only a few cities’ sensitivity values changed. For example, Shanghai was added as one of the cities with the highest sensitivity values, whereas the sensitivity of Tianjin declined in this stage. During the period from 2012 to 2015, among the cities with high sensitivity values, the value of Zhuhai declined, whereas the value of Taiyuan rose sharply and became one of the cities with the highest sensitivity values. In addition, the sensitivity values of Huangshan, Qinhuangdao, and other cities rose to a higher level. During the period from 2016 to 2019, the cities with the highest sensitivity were Shanghai, Xiamen, Zhangzhou, and Shenzhen, among which the sensitivity value of Zhangzhou increased the most. In addition, compared with the previous stage, the sensitivity of Chongqing has also been greatly improved.
Figure 6 shows the dimension of adaptive capacity of the urban TEV. During the period from 2004 to 2007, Harbin, Jilin, Chengde, Xining, Luoyang, Chongqing, Changsha, Huangshan, Guiyang, Quanzhou, and Nanning had the highest adaptive capacities. During the period from 2008 to 2011, the adaptive capacity of all cities as a whole declined significantly. Meanwhile, at this stage, Urumqi, Xining, Wenzhou, Guiyang, Beihai, Shantou, and other cities had the highest adaptive capacity. During the period from 2012 to 2015, the adaptive capacity of all cities decreased further on the whole. At this stage, the adaptive capacity of Lianyungang, Nanjing, and Xining were at their highest level. Compared with the previous stage, the adaptive capacity of many cities decreased significantly. During the period from 2016 to 2019, the adaptive capacity of all cities decreased further compared with the previous period. Only Harbin and Nanjing had a high level of adaptive capacity. The adaptive capacity of Lianyungang, Nanning, Xining, and other cities decreased significantly in this stage.
As shown in Figure 7, During the period from 2004 to 2007, cities with a high TEV were mainly distributed in the economically developed areas along the eastern coast of China, including Shanghai, Shenzhen, Zhuhai, Guangzhou, Zhongshan, and Tianjin. During the period from 2008 to 2011, Shanghai, Shenzhen, and Zhuhai still had the highest TEV, while the TEVs of the tourist cities in central and western China generally decreased. During the period from 2012 to 2015, the coastal cities of Shanghai, Xiamen, and Shenzhen had the highest TEV. The TEV of Ningbo, Fuzhou, Quanzhou, Zhangzhou, Shantou, and other coastal cities had decreased. The TEVs in the Middle and western regions of China generally had little change, and only the TEV in Taiyuan increased. During the period from 2016 to 2019, the TEV in Jilin, Chengde, Datong, Chengdu, Chongqing, Guilin, Beihai, and other cities increased significantly compared with the previous stage.

3.2. Obstacle Factor Diagnosis of TEV

Considering the space limitation, we only screened out the top five main obstacle factors of each city for display and explanation (Table 3).
Table 3 shows that in the obstacle factors of the TEV of China’s major tourist cities, S3 (proportion of international tourists out of total tourists), S6 (tourism output density), S8 (urban-industrial sulfur dioxide emissions per unit area), S9 (urban-industrial smoke and dust emission per unit area), and S7 (discharge of urban industrial wastewater per unit area) are the five indicators with the highest occurrence frequency. Thus, the five factors were the top five most critical factors affecting TEV values. In all 58 major tourist cities in China, S3 was the greatest obstacle factor affecting TEV, and the obstacle degree of all the other cities was above 0.2 except for Shenzhen, Taiyuan, and Zhuhai. The second obstacle factor of most cities was S6, and the obstacle degree was between 0.1234 and 0.1650. However, the second obstacle factor of a few cities, such as Guangzhou, Xiamen, Shanghai, and Shenzhen, was S9, and the obstacle degree was between 0.1276 and 0.1362. The third obstacle factors affecting TEV in 58 major tourist cities were S8 and S9. Among these 58 cities, S8 was the obstacle factor in 27 cities, and the obstacle degree was between 0.0989 and 0.1308. By comparison, S9 was the obstacle factor in 31 cities, and the obstacle degree was between 0.1109 and 0.1276. The fourth obstacle factor affecting TEV was similar to the third obstacle factor, and the fourth obstacle factors in most cities were mainly S8 and S9. In 27 cities, the fourth obstacle factor was S8, and the obstacle degree ranged from 0.1033 to 0.1252. In 22 cities, the fourth obstacle factor was S9, and the obstacle degree ranged from 0.1124 to 0.1259. In addition, heterogeneity was observed in some cities. For example, the fourth obstacle factor in Guangzhou, Xiamen, and Shanghai was S6, with the obstacle degree being between 0.0886 and 0.1228; whereas the fourth obstacle factor in Guiyang, Luoyang, Ningbo, Qinhuangdao, Shenzhen, and Taiyuan was S7, with an obstacle degree between 0.0987 and 0.1116. The fifth obstacle factor of 49 cities was S7, and the obstacle degree ranged from 0.0838 to 0.1196. In addition, the distribution of the fifth obstacle factor in other cities was scattered, among which the fifth obstacle factor in Guiyang, Luoyang, Ningbo, and Taiyuan was S8, and the obstacle degree ranged from 0.1034 to 0.1097. The fifth obstacle factor in Suzhou and Wuxi was S8, and the obstacle degrees were 0.0892 and 0.0957, respectively. The fifth obstacle factor in Xiamen was S10 (urban registered unemployment rate), and the obstacle degree was 0.0720. The fifth obstacle factor in Shenzhen was S6, and the obstacle degree was 0.0952. The fifth obstacle factor in Qinhuangdao was S9, and the obstacle degree was 0.1077.

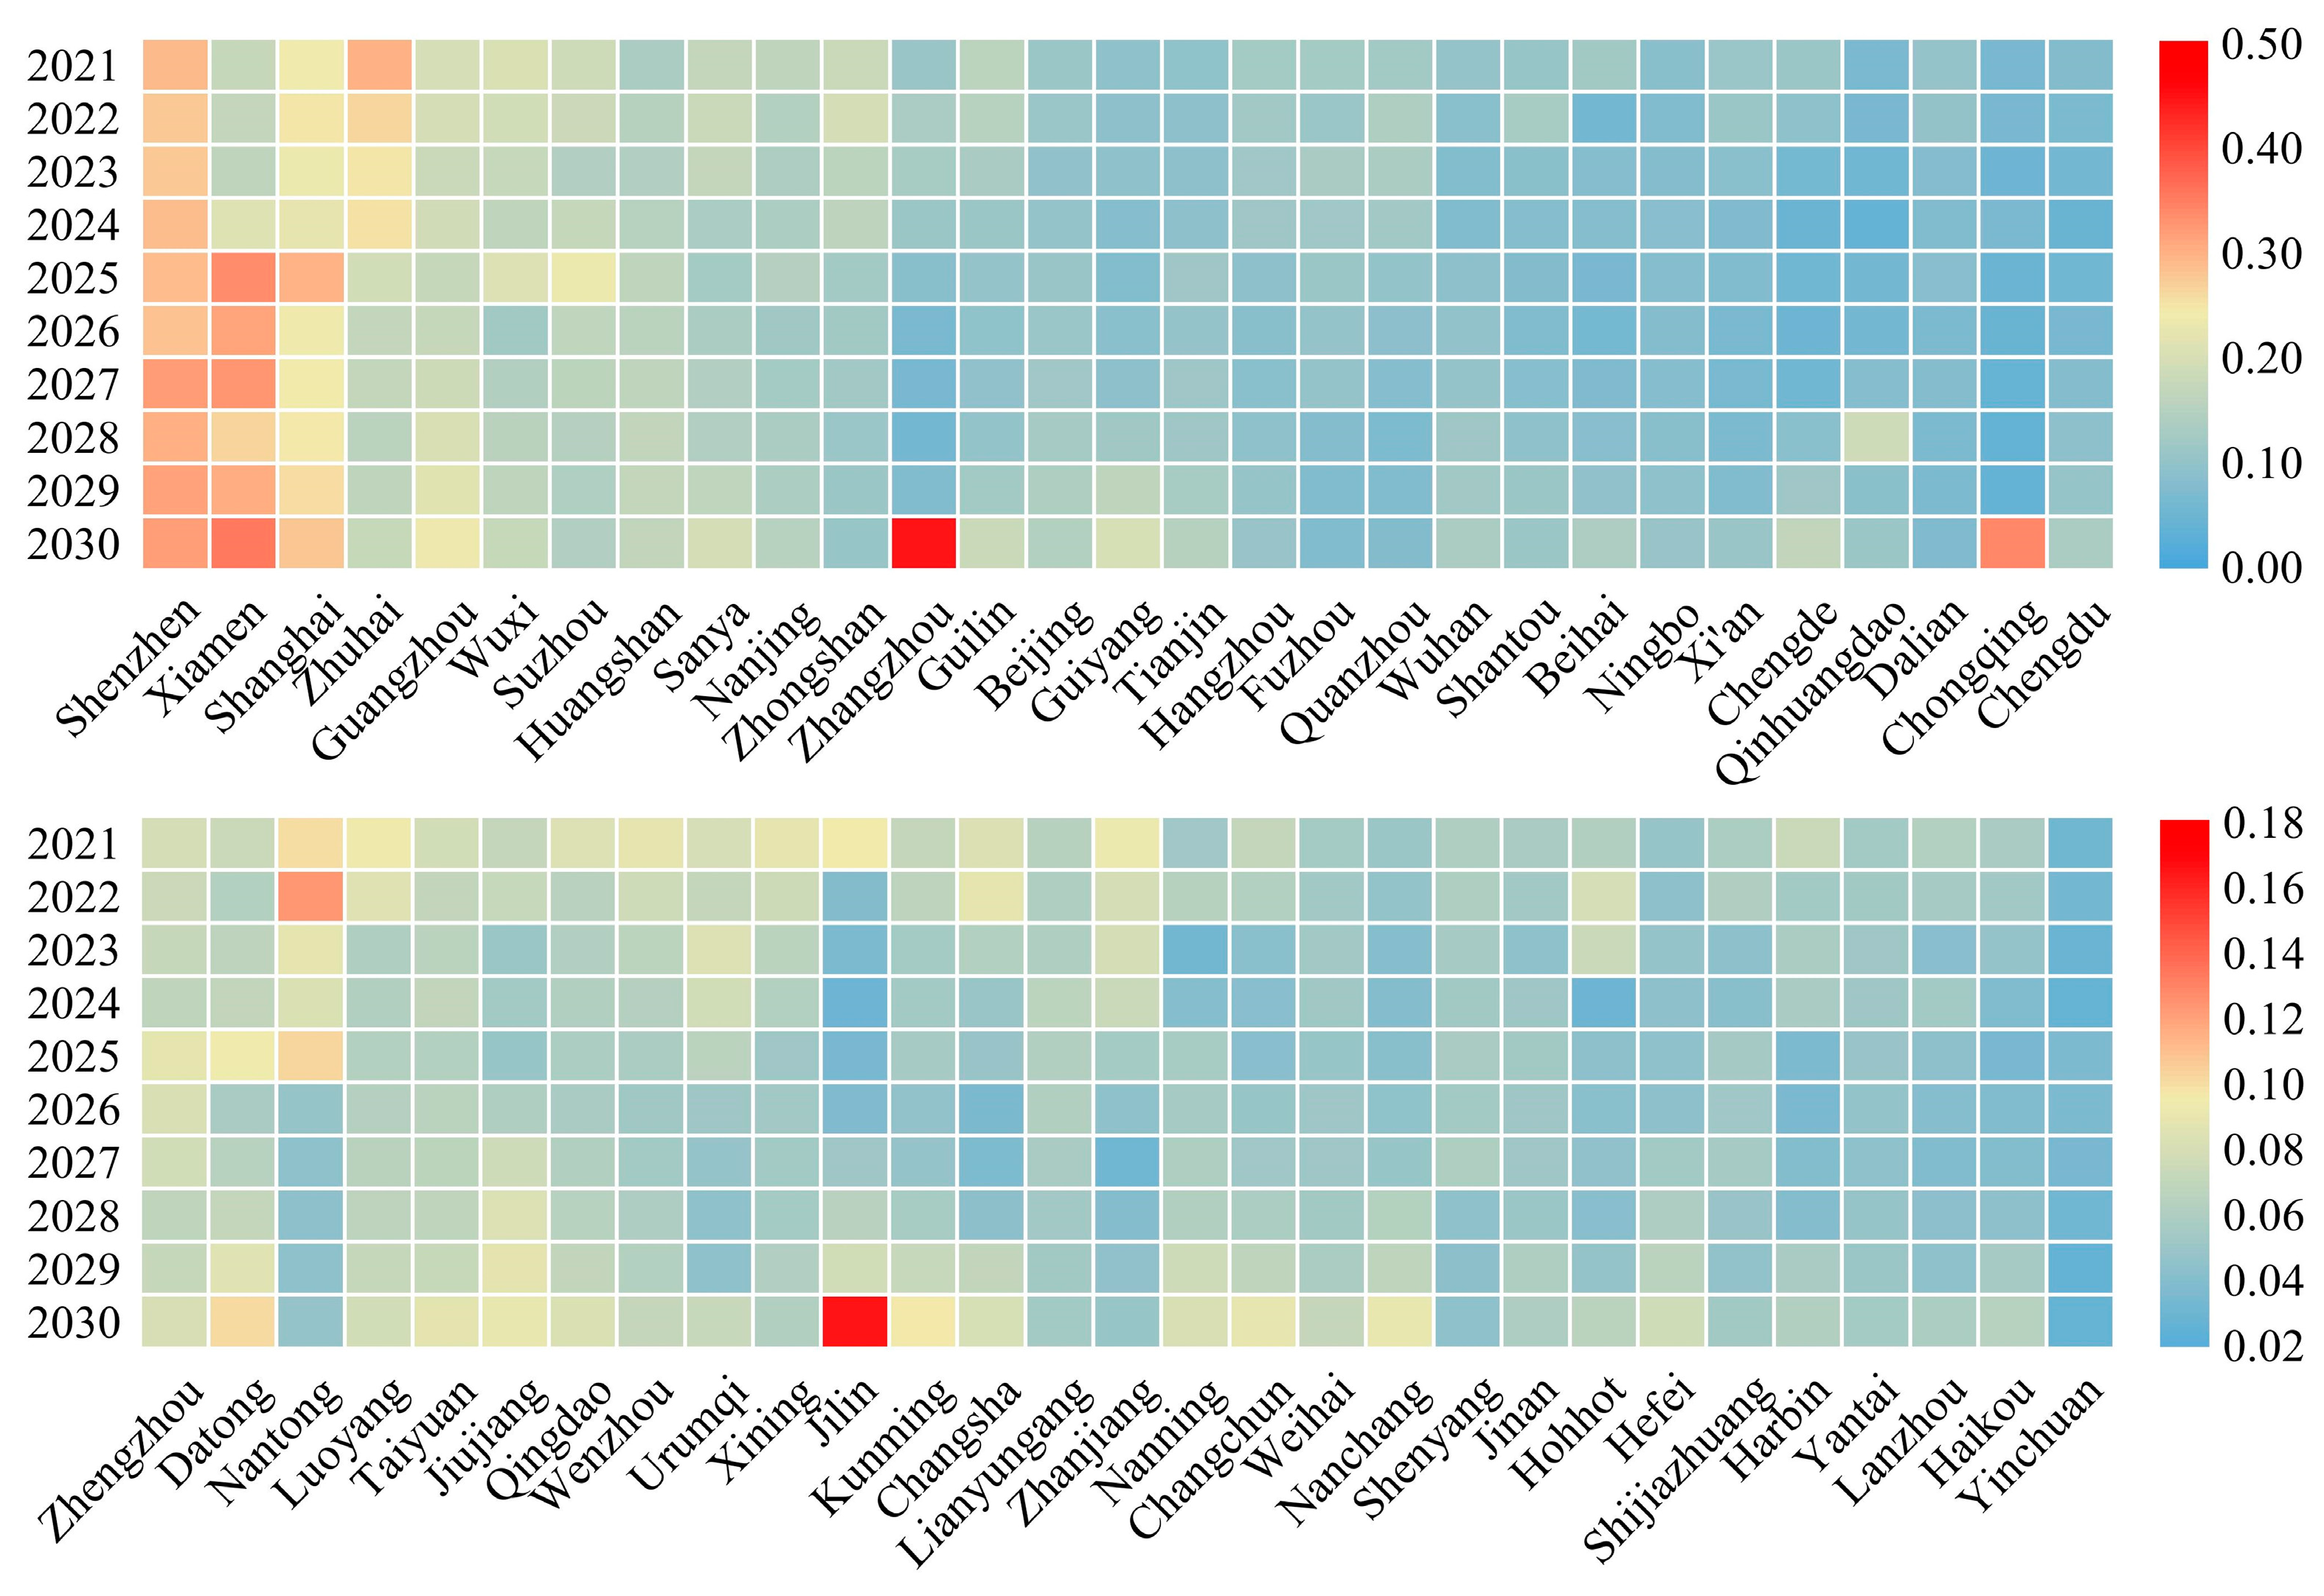
3.3. Prediction of the Evolution Trend of Urban TEV in the Next 10 Years

In this study, the vulnerability indices of the tourism economy from 2004 to 2019 were taken as sample data and imported into the trained network model to obtain the vulnerability values of the tourism economy from 2021 to 2030; Figure 8 shows the results. During the period of 2021–2030, although the TEV of many major tourist cities in China increases year by year, the cities with low TEV levels still occupy the dominant position. In this period, the cities with high TEV levels will be Shenzhen, Xiamen, Shanghai, and Zhuhai. These cities are all located in the eastern coastal zone of China, and the average values of their TEV will be 0.2911, 0.2621, 0.2510, and 0.2092, respectively. Low-level TEV cities are mostly concentrated in the northeast and western regions of China, such as Yinchuan, Lanzhou, Harbin, and Hohhot, and the average TEV are 0.0310, 0.0483, 0.0513, and 0.0531, respectively. In general, the TEV of high-level and low-level regions differ greatly, indicating that the TEV of major tourist cities in China have strong spatial heterogeneity during this period. The cities with high TEV are mostly distributed in the Yangtze River Delta and Pearl River Delta urban agglomerations along the eastern coast of China, whereas the cities with low TEV are scattered in the northeast, central, and western regions of China. This spatial feature is similar to the existing situation explored above.

4. Discussion

4.1. Internal Logic of Spatiotemporal Evolution of TEV

The tourism industry is highly sensitive due to location variability, complexity, and comprehensiveness. Under the influence of various factors, such as economy, society, and nature, TEV has formed significant regional differences [43]. During the study period, the cities with high TEV values are mainly distributed in the eastern region of China, with Shanghai, Shenzhen, Zhuhai, and other economically developed cities as typical representatives. These cities are located in the center of China’s economy, with convenient transportation and frequent business and trade exchanges at home and abroad. Owing to the high proportion of the regional tourism industries scale and a large number of inbound tourists, the regional tourism economy faces a higher risk of external impact, to some extent; thus, presenting strong vulnerabilities [44].
The cities with low TEV in China are widely distributed in the northeast, central, and western regions, and they are characterized by a contiguous distribution. First, Harbin, Jilin, and Changchun in northeast China are important old industrial bases. In recent years, the development speed of tourism has been slow compared with that of other regional central cities with developed tertiary industries. In addition, due to the remote geographical location, fewer long-distance tourists, weak ability to earn foreign exchange in tourism, and low dependence on the tourism industry, the cities show a low TEV [36]. Second, cities such as Urumqi, Yinchuan, and Lanzhou are located in the underdeveloped areas in the west of China; thus, the level of social and economic development is relatively weak. In addition, the status of the local tourism industry is not outstanding, and tourism visibility and attraction are not high. As a result, the development level of the tourism industry is low, the industrial correlation is not strong, and the tourism economy is weak [23]. Finally, due to the geographical location, ecological environment, and socioeconomic characteristics of the central Chinese cities, the multiplier effect and ripple effect of the tourism industry are relatively weak, and they do not occupy a dominant position in the economic structure so they exhibit low TEV levels. The above analysis shows that the vulnerability of China’s tourism economy generally still follows the distribution characteristics dominated by the economy, which echoes the previous research conclusions to a certain extent [23].
Overall, During the period from 2004 to 2011, the TEV of most tourism cities showed a decreasing trend year by year. At this stage, the tourism industry has not yet formed a perfect system, the growth of the tourism market is flat, and the tourism economy has not formed enough scale to cause strong economic sensitivity. Moreover, the tourism incentive policy accelerates the influx of tourism enterprises and the construction of tourism facilities, which makes the growth rate of regional tourism economic strain capacity higher than the sensitivity of the tourism economy [45]. During the period from 2012 to 2019, the TEV of most tourism cities showed a slight upward trend, which is closely related to the imbalance of industrial structure caused by the rapid growth of the tourism industry and the external dependence caused by international tourism income.

4.2. Obstacle Factors Affecting TEV

On the basis of the obstacle diagnosis model, this study measures the obstacle factors that affect TEV. The results show that the proportion of international tourists out of total tourists is the most influential factor, which is mainly due to the many unstable factors in the international environment, such as natural disasters, economic crisis, and social unrest. A series of factors may have a strong impact on inbound tourism and impact the whole tourism economic system [46,47]. Tourism output value density is the second major factor affecting TEV. According to Sun, due to the high sensitivity and low resistance of the tourism economic system to internal and external environmental disturbances, compared with other industries, it is very easy to lose the original structure, state, and functional attributes of the tourism economic system in internal and external environmental disturbances, thus leading to a fluctuating and unstable state [48]. The high density of the tourism industry in the local area will magnify this inherent defect to a certain extent [49]. In addition, urban-industrial sulfur dioxide emissions per unit area, urban industrial smoke and dust emission per unit area, and discharge of urban industrial wastewater per unit area of the three environmental factors have a great impact on TEV. This reflects that the development of the tourism industry has higher requirements for the local ecological environment, which is consistent with the views of Fei et al. [50]. At the same time, it also highlights the characteristics of the tourism economy as an "eco-socioeconomic" composite system [51]. The three are interdependent, adapt to each other, and penetrate, blend, and interact in their development [52]. How to realize the coordinated development of ecology, culture, and economy is a subject to be discussed in the future.

4.3. Trend Prediction of TEV

The prediction accuracy of the BP neural network model established in this study is more than 95%. Therefore, the prediction method proposed in this study is applicable to the development analysis of China’s urban TEV and can provide an important theoretical basis for the development and decision-making of the tourism industry. According to the evolution trend, TEV values in China’s major tourist cities will continue to show an increasing trend in the next 10 years. However, the rise of the TEV will obviously bring many adverse effects, so how to reasonably regulate TEV to achieve sustainable development of the tourism economy is an urgent issue to be discussed at present. For some scholars, TEV is accumulated by two forms of environmental stress: endogenous and exogenous [22]. The endogenous vulnerability factors are formed by the activities of the tourism economic system, including the irrationality of the internal structure of the tourism market structure, tourism income structure, tourism organization structure, tourism investment structure, and tourism product structure. Exogenous environmental stress is the abrupt change and gradual change of external environmental factors of the tourism economic system, such as the political environment, economic environment, natural environment, and tourism industry policy. This understanding means that to reduce TEV, we need to start from two aspects of internal structure optimization and external policy regulation.

5. Conclusions

At present, the rapid development of China’s tourism industry plays an evident role in promoting economic and social development. However, due to the inherent nature of the tourism industry, it is vulnerable to the impact of the internal and external environment. Therefore, promoting the sustainable development of the regional tourism economy is an objective requirement to evaluate and forecast the TEV in major tourist cities. Using panel data from 2004 to 2019, a comprehensive evaluation index system for TEV was constructed in this study, which used 58 major tourist cities in China as the research objects. The TEV was reasonably measured by using entropy weight method, TOPSIS model, obstacle diagnosis model, and BP neural network model. Finally, the spatiotemporal pattern, obstacle factors, and future trend of TEV were discussed.
The contributions of this study to the literature are as follows. Limited by the difficulty of obtaining statistical data, existing studies mostly compare the state of TEV in different cities from a horizontal perspective, and there is a lack of studies on the evolution process and mechanism of TEV in different cities from a vertical perspective [36]. In this study, panel data of a longer time scale were used to predict the evolutionary trend of TEV in the future, which can provide scientific reference for different tourism cities to formulate targeted tourism economic development policies. In addition, prediction is the basis of decision-making, but the traditional statistical methods have a strong assumption of the data distribution law, so the problem of random interference in the economic system has not been addressed [53]. In the prediction of the TEV, the existing time series analysis method can only reflect the linear law with a strong tendency and cannot describe the nonlinear characteristics. In this study, BP neural network was used to build a prediction model, which can excavate and predict the regularity of time series indicators. The application of this method not only enriches the research system of vulnerability methods but also has reference significance for other fields.
The findings of this study have several practical implications for the development of the urban tourism economy. First, in terms of the spatiotemporal pattern of evolution, cities with high TEV are mostly distributed in the eastern coastal urban agglomerations of China, while cities with low TEV are scattered in the northeastern, central, and western regions of China. This is the result of tourism industry dependence and is closely related to location, economy, nature, and other factors. Therefore, promoting the coordination of urban infrastructure, industrial structure, and the ecological environment should become an important measure of urban construction. Second, this study found that the five obstacle factors that have the greatest impact on the vulnerability of the urban tourism economy are the proportion of international tourists out of total tourists, tourism output density, urban industrial sulfur dioxide emissions per unit area, urban industrial smoke and dust emission per unit area, and discharge of urban industrial wastewater per unit area. This shows that accelerating the adjustment of economic structure and the transformation of economic mode [54], as well as the purification and discharge of waste gas, centralized treatment of hazardous waste and wastewater, and the improvement of tourists’ awareness of environmental protection, should become key issues to reduce TEV. Third, in the next 10 years, TEV of major tourist cities in China will increase, which is the result of the accumulation of endogenous structure and the stress of the exogenous environment. In order to effectively reduce the vulnerability of tourism economic development, we can adjust the orientation of the tourism industry development, highlight the driving effect of tourism association, and build a multi-pillar industry system.
Although this study measured and analyzed the spatiotemporal evolution, obstacle factors, and future trends of the TEV of China’s major tourist cities, it has limitations. The index system of this research is constructed on the basis of the general characteristics of all typical tourist cities in the dataset. However, due to the large area of China, cities in different regions in the natural environment, and social-cultural differences, the index system will ignore the heterogeneity between different cities, leading to uncertain factors. Future research may construct an inter-city differentiated index evaluation system according to the unique properties of each city. Such an evaluation system may make the measurement results more accurate. In addition, on the basis of the BP neural network, this study prefigured the time series evolution of the future TEV of China’s major tourist cities well. The overall model shows high precision, but some cases show a poor-fitting effect. Scholars point out that combination-prediction is better than single prediction [55]. Therefore, building a variety of prediction models for comparison, such as a GM (1,1) prediction model, linear regression prediction model, and time series prediction model supplemented by the BP neural network model to make decisions, presents a promising direction for future research.

Author Contributions

Conceptualization, Deping Chu; methodology, Chengkun Huang and Feiyang Lin; software, Chengkun Huang and Feiyang Lin; validation, Chengkun Huang, Feiyang Lin, and Deping Chu; formal analysis, Chengkun Huang; investigation, Chengkun Huang, Feiyang Lin, Lanlan Wang, and Jiawei Liao; data curation, Chengkun Huang, Feiyang Lin, Lanlan Wang, and Jiawei Liao; writing—original draft preparation, Chengkun Huang and Feiyang Lin; writing—review and editing, Chengkun Huang, Feiyang Lin, Deping Chu, and Junqian Wu; visualization, Chengkun Huang and Feiyang Lin; supervision, Deping Chu and Junqian Wu; project administration, Deping Chu and Junqian Wu; funding acquisition, Deping Chu. All authors have read and agreed to the published version of the manuscript.

Funding

This research was funded by the Natural Science Foundation of Fujian Province, China (grant number 2018J01743).

Institutional Review Board Statement

Not applicable.

Informed Consent Statement

Not applicable.

Data Availability Statement

Data sharing not applicable.

Conflicts of Interest

The authors declare no conflict of interest.

Appendix A

Table A1. Data sources for each case city.
CityData SourceCityData Source
BeihaiCCSY 2005–2020; Beihai SY 2005–2020; Beihai SCNESD 2004–2019; YCTS 2005–2018QingdaoCCSY 2005–2020; Qingdao SY 2005–2020; Qingdao SCNESD 2004–2019; YCTS 2005–2018
BeijingCCSY 2005–2020; Beijing SY 2005–2020; Beijing SCNESD 2004–2019; YCTS 2005–2018QuanzhouCCSY 2005–2020; Quanzhou SY 2005–2020; Quanzhou SCNESD 2004–2019; YCTS 2005–2018
ChengduCCSY 2005–2020; Chengdu SY 2005–2020; Chengdu SCNESD 2004–2019; YCTS 2005–2018SanyaCCSY 2005–2020; Sanya SY 2005–2020; Sanya SCNESD 2004–2019; YCTS 2005–2018
ChengdeCCSY 2005–2020; Chengde SY 2005–2020; Chengde SCNESD 2004–2019; YCTS 2005–2018XiamenCCSY 2005–2020; Xiamen SY 2005–2020; Xiamen SCNESD 2004–2019; YCTS 2005–2018
DalianCCSY 2005–2020; Dalian SY 2005–2020; Dalian SCNESD 2004–2019; YCTS 2005–2018ShantouCCSY 2005–2020; Shantou SY 2005–2020; Shantou SCNESD 2004–2019; YCTS 2005–2018
DatongCCSY 2005–2020; Datong SY 2005–2020; Datong SCNESD 2004–2019; YCTS 2005–2018ShanghaiCCSY 2005–2020; Shanghai SY 2005–2020; Shanghai SCNESD 2004–2019; YCTS 2005–2018
FuzhouCCSY 2005–2020; Fuzhou SY 2005–2020; Fuzhou SCNESD 2004–2019; YCTS 2005–2018ShenyangCCSY 2005–2020; Shenyang SY 2005–2020; Shenyang SCNESD 2004–2019; YCTS 2005–2018
GuangzhouCCSY 2005–2020; Guangzhou SY 2005–2020; Guangzhou SCNESD 2004–2019; YCTS 2005–2018ShenzhenCCSY 2005–2020; Shenzhen SY 2005–2020; Shenzhen SCNESD 2004–2019; YCTS 2005–2018
GuiyangCCSY 2005–2020; Guiyang SY 2005–2020; Guiyang SCNESD 2004–2019; YCTS 2005–2018ShijiazhuangCCSY 2005–2020; Shijiazhuang SY 2005–2020; Shijiazhuang SCNESD 2004–2019; YCTS 2005–2018
GuilinCCSY 2005–2020; Guilin SY 2005–2020; Guilin SCNESD 2004–2019; YCTS 2005–2018SuzhouCCSY 2005–2020; Suzhou SY 2005–2020; Suzhou SCNESD 2004–2019; YCTS 2005–2018
HarbinCCSY 2005–2020; Harbin SY 2005–2020; Harbin SCNESD 2004–2019; YCTS 2005–2018TaiyuanCCSY 2005–2020; Taiyuan SY 2005–2020; Taiyuan SCNESD 2004–2019; YCTS 2005–2018
HaikouCCSY 2005–2020; Haikou SY 2005–2020; Haikou SCNESD 2004–2019; YCTS 2005–2018TianjinCCSY 2005–2020; Tianjin SY 2005–2020; Tianjin SCNESD 2004–2019; YCTS 2005–2018
HangzhouCCSY 2005–2020; Hangzhou SY 2005–2020; Hangzhou SCNESD 2004–2019; YCTS 2005–2018WeihaiCCSY 2005–2020; Weihai SY 2005–2020; Weihai SCNESD 2004–2019; YCTS 2005–2018
HefeiCCSY 2005–2020; Hefei SY 2005–2020; Hefei SCNESD 2004–2019; YCTS 2005–2018WenzhouCCSY 2005–2020; Wenzhou SY 2005–2020; Wenzhou SCNESD 2004–2019; YCTS 2005–2018
HohhotCCSY 2005–2020; Hohhot SY 2005–2020; Hohhot SCNESD 2004–2019; YCTS 2005–2018UrumqiCCSY 2005–2020; Urumqi SY 2005–2020; Urumqi SCNESD 2004–2019; YCTS 2005–2018
HuangshanCCSY 2005–2020; Huangshan SY 2005–2020; Huangshan SCNESD 2004–2019; YCTS 2005–2018WuxiCCSY 2005–2020; Wuxi SY 2005–2020; Wuxi SCNESD 2004–2019; YCTS 2005–2018
JilinCCSY 2005–2020; Jilin SY 2005–2020; Jilin SCNESD 2004–2019; YCTS 2005–2018WuhanCCSY 2005–2020; Wuhan SY 2005–2020; Wuhan SCNESD 2004–2019; YCTS 2005–2018
JinanCCSY 2005–2020; Jinan SY 2005–2020; Jinan SCNESD 2004–2019; YCTS 2005–2018Xi’anCCSY 2005–2020; Xi’an SY 2005–2020; Xi’an SCNESD 2004–2019; YCTS 2005–2018
JiujiangCCSY 2005–2020; Jiujiang SY 2005–2020; Jiujiang SCNESD 2004–2019; YCTS 2005–2018XiningCCSY 2005–2020; Xining SY 2005–2020; Xining SCNESD 2004–2019; YCTS 2005–2018
KunmingCCSY 2005–2020; Kunming SY 2005–2020; Kunming SCNESD 2004–2019; YCTS 2005–2018YantaiCCSY 2005–2020; Yantai SY 2005–2020; Yantai SCNESD 2004–2019; YCTS 2005–2018
LanzhouCCSY 2005–2020; Lanzhou SY 2005–2020; Lanzhou SCNESD 2004–2019; YCTS 2005–2018YinchuanCCSY 2005–2020; Yinchuan SY 2005–2020; Yinchuan SCNESD 2004–2019; YCTS 2005–2018
LianyungangCCSY 2005–2020; Lianyungang SY 2005–2020; Lianyungang SCNESD 2004–2019; YCTS 2005–2018ZhanjiangCCSY 2005–2020; Zhanjiang SY 2005–2020; Zhanjiang SCNESD 2004–2019; YCTS 2005–2018
LuoyangCCSY 2005–2020; Luoyang SY 2005–2020; Luoyang SCNESD 2004–2019; YCTS 2005–2018ZhangzhouCCSY 2005–2020; Zhangzhou SY 2005–2020; Zhangzhou SCNESD 2004–2019; YCTS 2005–2018
NanchangCCSY 2005–2020; Nanchang SY 2005–2020; Nanchang SCNESD 2004–2019; YCTS 2005–2018ChangchunCCSY 2005–2020; Changchun SY 2005–2020; Changchun SCNESD 2004–2019; YCTS 2005–2018
NanjingCCSY 2005–2020; Nanjing SY 2005–2020; Nanjing SCNESD 2004–2019; YCTS 2005–2018ChangshaCCSY 2005–2020; Changsha SY 2005–2020; Changsha SCNESD 2004–2019; YCTS 2005–2018
NanningCCSY 2005–2020; Nanning SY 2005–2020; Nanning SCNESD 2004–2019; YCTS 2005–2018ZhengzhouCCSY 2005–2020; Zhengzhou SY 2005–2020; Zhengzhou SCNESD 2004–2019; YCTS 2005–2018
NantongCCSY 2005–2020; Nantong SY 2005–2020; Nantong SCNESD 2004–2019; YCTS 2005–2018zhongshanCCSY 2005–2020; zhongshan SY 2005–2020; zhongshan SCNESD 2004–2019; YCTS 2005–2018
NingboCCSY 2005–2020; Ningbo SY 2005–2020; Ningbo SCNESD 2004–2019; YCTS 2005–2018ChongqingCCSY 2005–2020; Chongqing SY 2005–2020; Chongqing SCNESD 2004–2019; YCTS 2005–2018
QinhuangdaoCCSY 2005–2020; Qinhuangdao SY 2005–2020; Qinhuangdao SCNESD 2004–2019; YCTS 2005–2018ZhuhaiCCSY 2005–2020; Zhuhai SY 2005–2020; Zhuhai SCNESD 2004–2019; YCTS 2005–2018

References

  1. Timmerman, P. Vulnerability, Resilience and the Collapse of Socieiy: A Review of Models and Possible Climatic Applications; Institute for Environmental Studies Toronto, Universisty of Toronto: Toronto, ON, Canada, 1981. [Google Scholar]
  2. Yamano, H.; Kayanne, H.; Yamaguchi, T.; Kuwahara, Y.; Yokoki, H.; Shimazaki, H.; Chikamori, M. Atoll island vulnerability to flooding and inundation revealed by historical reconstruction: Fongafale Islet, Funafuti Atoll, Tuvalu. Glob. Planet. Chang. 2007, 57, 407–416. [Google Scholar] [CrossRef]
  3. Toni, F.; Holanda, E. The effects of land tenure on vulnerability to droughts in Northeastern Brazil. Glob. Environ. Chang. 2008, 18, 575–582. [Google Scholar] [CrossRef]
  4. Wilson, K.; Newton, A.; Echeverría, C.; Weston, C.; Burgman, M. A vulnerability analysis of the temperate forests of south central Chile. Biol. Conserv. 2005, 122, 9–21. [Google Scholar] [CrossRef]
  5. Ho, H.C.; Knudby, A.; Chi, G. Spatiotemporal analysis of regional socio-economic vulnerability change associated with heat risks in Canada. Appl. Geogr. 2018, 95, 61–70. [Google Scholar] [CrossRef] [PubMed]
  6. Liu, W.; Li, L.; Chen, L.; Wen, M.; Wang, J.; Yuan, L.; Liu, Y.; Li, H. Testing a comprehensive volcanic risk assessment of tenerife by volcanic hazard simulations and social vulnerability analysis. ISPRS Int. Geo-Inf. 2020, 9, 273. [Google Scholar] [CrossRef]
  7. Susan, L.; Cutter, B.J.; Boruff, W.; Lynn, S. Social vulnerability to environmental hazards. Soc. Sci. Q. 2003, 84, 242–261. [Google Scholar] [CrossRef]
  8. Adrianto, L.; Matsuda, Y. Developing economic vulnerability indices of environmental disasters in small island regions. Environ. Impact Assess. Rev. 2002, 22, 393–414. [Google Scholar] [CrossRef]
  9. Wim, N.; Amelia, S.-P.; Mark, M. Measuring vulnerability: An overview and introduction. Oxf. Dev. Stud. 2009, 37, 183–191. [Google Scholar] [CrossRef]
  10. Altimari, A.; Balzano, S.; Zezza, G. Measuring economic vulnerability: A structural equation modeling approach. In Statistical Learning of Complex Data; Greselin, F., Deldossi, L., Bagnato, L., Vichi, M., Eds.; Springer: Cham, Switzerland, 2019; pp. 95–102. [Google Scholar]
  11. Briguglio, L. Small island developing states and their economic vulnerabilities. World Dev. 1995, 23, 1615–1632. [Google Scholar] [CrossRef]
  12. Briguglio, L.; Cordina, G.; Farrugia, N. Economic vulnerability and resilience: Concepts and measurements. Oxf. Dev. Stud. 2009, 37, 229–247. [Google Scholar] [CrossRef]
  13. Chan, V.K.Y. The Impact of the Global Financial Crisis on the Entertainment Tourism Industry: A Financial Engineering Case Study of Macao from 2007 to 2010. Syst. Eng. Procedia 2011, 1, 323–329. [Google Scholar] [CrossRef] [Green Version]
  14. Zhou, B.; Zhang, Y.; Zhou, P. Multilateral political effects on outbound tourism. Ann. Touris. Res. 2021, 88, 103184. [Google Scholar] [CrossRef]
  15. Kılıçlar, A.; Uşaklı, A.; Tayfun, A. Terrorism prevention in tourism destinations: Security forces vs. civil authority perspectives. J. Destin. Mark. Manag. 2018, 8, 232–246. [Google Scholar] [CrossRef]
  16. Altuntas, F.; Gok, M.S. The effect of COVID-19 pandemic on domestic tourism: A DEMATEL method analysis on quarantine decisions. Int. J. Hosp. Manag. 2021, 92, 102719. [Google Scholar] [CrossRef]
  17. Rosselló, J.; Becken, S.; Santana-Gallego, M. The effects of natural disasters on international tourism: A global analysis. Tour. Manag. 2020, 79, 104080. [Google Scholar] [CrossRef]
  18. Croes, R.; Ridderstaat, J.; Bak, M.; Zientara, P. Tourism specialization, economic growth, human development and transition economies: The case of Poland. Tour. Manag. 2021, 82, 104181. [Google Scholar] [CrossRef]
  19. Wang, Z.D. Dynamic relationship between tourism, economic growth, and environmental quality. J. Sustain. Tour. 2018, 26, 1928–1943. [Google Scholar] [CrossRef]
  20. Canh, N.P.; Thanh, S.D. Domestic tourism spending and economic vulnerability. Ann. Tour. Res. 2020, 85, 103063. [Google Scholar] [CrossRef]
  21. Su, F.; Chen, Y.; Zhang, P. Vulnerability assessment of tourism city’s economic system based on the set pair analysis: A case study of Zhoushan city. Sci. Geogr. Sin. 2013, 33, 538–544. (In Chinese) [Google Scholar]
  22. Li, F. The frangibility of tourism economy: Definition, formation mechanism and frame analysis. East China Econ. Manag. 2013, 27, 76–81. (In Chinese) [Google Scholar]
  23. Ma, H.Q.; Lian, Q.W.; Lun, Y.C. Spatial differentiation of tourism economic system vulnerability based on BP neural network in different provinces of China. Res. Sci. 2019, 41, 2248–2261. (In Chinese) [Google Scholar] [CrossRef]
  24. Huang, L.; Yin, X.; Yang, Y.; Luo, M.; Huang, S. “Blessing in disguise”: The impact of the Wenchuan earthquake on inbound tourist arrivals in Sichuan, China. J. Hosp. Tour. Manag. 2020, 42, 58–66. [Google Scholar] [CrossRef]
  25. Pham, T.D.; Dwyer, L.; Su, J.-J.; Ngo, T. COVID-19 impacts of inbound tourism on Australian economy. Ann. Tour. Res. 2021, 88, 103179. [Google Scholar] [CrossRef]
  26. Backer, E.; Ritchie, B. VFR Travel: A viable market for tourism crisis and disaster recovery? Int. J. Tour. Res. 2017, 19, 400–411. [Google Scholar] [CrossRef]
  27. Gurtner, Y. Returning to paradise: Investigating issues of tourism crisis and disaster recovery on the island of Bali. J. Hosp. Tour. Manag. 2016, 28, 11–19. [Google Scholar] [CrossRef]
  28. Raki, A.; Nayer, D.; Nazifi, A.; Alexander, M.; Seyfi, S. Tourism recovery strategies during major crises: The role of proactivity. Ann. Tour. Res. 2021, 103144. [Google Scholar] [CrossRef]
  29. Moghal, Z.; O’Connell, E. Multiple stressors impacting a small island tourism destination-community: A nested vulnerability assessment of Oistins, Barbados. Tour. Manag. Perspect. 2018, 26, 78–88. [Google Scholar] [CrossRef]
  30. Yin, P.; Liu, S.; Duan, P. Analysis on the vulnerability and obstacle indicators in island-type tourism destination—Take Zhoushan city for example. Ecol. Geogr. 2017, 37, 234–240. (In Chinese) [Google Scholar]
  31. Jia, Y.; Hu, J.; Xie, S.; Qiao, H.; Liu, D. Vulnerability and influence mechanisms of social-ecological system in poor mountainous tourism destinations. Hum. Geogr. 2021, 36, 155–164. (In Chinese) [Google Scholar]
  32. Liang, Z.; Xie, L. On the vulnerability of economic system of traditional tourism cities—A case from Guilin. Tour. Trib. 2011, 26, 40–46. (In Chinese) [Google Scholar]
  33. Yang, Y.; Wang, R. Research on vulnerability assessment of tourism economic system and the path optimization in border ethnic Region: A case study of Korean autonomous prefecture of Yanbian. Areal Res. Dev. 2015, 34, 104–109. (In Chinese) [Google Scholar]
  34. Huang, C.; Lin, F.; Chu, D.; Wang, L.; Liao, J.; Wu, J. Coupling relationship and interactive response between intensive land use and tourism industry development in China’s major tourist cities. Land 2021, 10, 697. [Google Scholar] [CrossRef]
  35. Polsky, C.; Neff, R.; Yarnal, B. Building comparable global change vulnerability assessments: The vulnerability scoping diagram. Glob. Environ. Chang. 2007, 17, 472–485. [Google Scholar] [CrossRef]
  36. Su, F.; Chu, Y.; Zhang, P. Analysis of economic vulnerability and obstacle factors of typical tourism cities in China. Ecol. Geogr. 2013, 33, 189–194. (In Chinese) [Google Scholar]
  37. Tian, L.; Tian, Y.; Yang, Y. Study on tourism economic system’s vulnerability assessment of Dali Prefecture based on TOPSIS. Res. Dev. Mark. 2017, 33, 1529–1534. (In Chinese) [Google Scholar]
  38. Chen, Y.; Zhu, M.; Lu, J.; Zhou, Q.; Ma, W. Evaluation of ecological city and analysis of obstacle factors under the background of high-quality development: Taking cities in the Yellow River Basin as examples. Ecol. Indic. 2020, 118, 106771. [Google Scholar] [CrossRef]
  39. Li, J.; Chen, Y.; Yao, X.; Chen, A. Risk management priority assessment of heritage sites in China based on entropy weight and TOPSIS. J. Cult. Herit. 2021, 49, 10–18. [Google Scholar] [CrossRef]
  40. Wang, D.; Shen, Y.; Zhao, Y.; He, W.; Liu, X.; Qian, X.; Lv, T. Integrated assessment and obstacle factor diagnosis of China’s scientific coal production capacity based on the PSR sustainability framework. Resour. Policy 2020, 68, 101794. [Google Scholar] [CrossRef]
  41. Li, S.; Wang, Y.; Hao, M.; Jiang, D.; Xun, Z.; Zhou, R. Site selection of digital signage in Beijing: A combination of machine learning and an empirical approach. ISPRS Int. Geo-Inf. 2020, 9, 217. [Google Scholar] [CrossRef] [Green Version]
  42. Wang, W.; Tang, R.; Li, C.; Liu, P.; Luo, L. A BP neural network model optimized by Mind Evolutionary Algorithm for predicting the ocean wave heights. Ocean Eng. 2018, 162, 98–107. [Google Scholar] [CrossRef]
  43. Broshi-Chen, O.; Mansfeld, Y. A wasted invitation to innovate? Creativity and innovation in tourism crisis management: A QC&IM approach. J. Hosp. Tour. Manag. 2021, 46, 272–283. [Google Scholar] [CrossRef]
  44. Gnangnon, S.K. Trade openness and structural vulnerability in developing countries. J. Ecol. Stud. 2016, 43, 70–89. [Google Scholar] [CrossRef]
  45. Deng, T.; Hu, Y.; Ma, M. Regional policy and tourism: A quasi-natural experiment. Ann. Tour. Res. 2019, 74, 1–16. [Google Scholar] [CrossRef]
  46. Wang, Y.-S. The impact of crisis events and macroeconomic activity on Taiwan’s international inbound tourism demand. Tour. Manag. 2009, 30, 75–82. [Google Scholar] [CrossRef]
  47. Hanon, W.; Wang, E. Comparing the impact of political instability and terrorism on inbound tourism demand in Syria before and after the political crisis in 2011. Asia Pac. J. Tour. Res. 2020, 25, 651–661. [Google Scholar] [CrossRef]
  48. Sun, G. Some responses to the doubt of whether tourism develops with certain rules. Tour. Sci. 2008, 22, 1–4. (In Chinese) [Google Scholar]
  49. Espiner, S.; Becken, S. Tourist towns on the edge: Conceptualising vulnerability and resilience in a protected area tourism system. J. Sustain. Tour. 2014, 22, 646–665. [Google Scholar] [CrossRef]
  50. Fei, J.; Lin, Y.; Jiang, Q.; Jiang, K.; Li, P.; Ye, G. Spatiotemporal coupling coordination measurement on islands’ economy-environment-tourism system. Ocean Coast. Manag. 2021, 212, 105793. [Google Scholar] [CrossRef]
  51. Tang, F.; Tao, W. Establish a composite system for sustainable tourism development. J. Dongbei Univ. Financ. Econ. 2001, 28–30. (In Chinese) [Google Scholar]
  52. Jia, Y.; Hu, J.; Liu, D. Spatial-temporal pattern of the coordinated development of ecology-culture-tour- ism of China’s provinces. World Reg. Stud. 2021, 30, 620–631. (In Chinese) [Google Scholar]
  53. Pan, D.; Shi, C. The forecasting method and application of the total retail sales of consumer goods in China. Stat. Decis. 2015, 96–98. (In Chinese) [Google Scholar]
  54. Demir, E.; Gozgor, G.; Paramati, S.R. To what extend economic uncertainty effects tourism investments? Evidence from OECD and non-OECD economies. Tour. Manag. Perspect. 2020, 36, 100758. [Google Scholar] [CrossRef]
  55. Zou, F.; Zou, D. A study on forecast of ecotourism demand in Hunan province based on the comparison of five models. Res. Environ. Yangtze Basin 2020, 29, 2406–2417. (In Chinese) [Google Scholar]
Figure 1. Spatial distribution of 58 major tourist cities in China.
Ijgi 10 00644 g001
Figure 2. Research framework.
Ijgi 10 00644 g002
Figure 3. Architecture of the BP neural network.
Ijgi 10 00644 g003
Figure 4. Accuracy tests of the BP neural network model.
Ijgi 10 00644 g004
Figure 5. Spatiotemporal evolution of the sensitivity index ((a) Average sensitivity index for 2004–2007 were shown; (b) Average sensitivity index for 2008–2011 were shown; (c) Average sensitivity index for 2012–2015 were shown; (d) Average sensitivity index for 2016–2019 were shown).
Ijgi 10 00644 g005
Figure 6. Spatiotemporal evolution of the adaptive capacity index ((a) Average adaptive capacity index for 2004–2007 were shown; (b) Average adaptive capacity index for 2008–2011 were shown; (c) Average adaptive capacity index for 2012–2015 were shown; (d) Average adaptive capacity index for 2016–2019 were shown).
Ijgi 10 00644 g006
Figure 7. Spatiotemporal evolution of the TEV index ((a) Average TEV index for 2004-2007 were shown; (b) Average TEV index for 2008-2011 were shown; (c) Average TEV index for 2012-2015 were shown; (d) Average TEV index for 2016-2019 were shown).
Ijgi 10 00644 g007
Figure 8. Predicted index of TEV in 2021–2030.
Ijgi 10 00644 g008
Table 1. Index system of TEV.
SystemPrimary IndicatorSecondary IndicatorUnitAttributeSerial Number
SensitivityIndustry core
element
Proportion of total earnings from tourism in GDP%PositiveS1
Elasticity coefficient of tourism to GDP growthPositiveS2
Proportion of international tourists out of total tourists%PositiveS3
Proportion of tourism foreign
exchange income in total tourism
revenue
%PositiveS4
Proportion of total tourism revenue in tertiary industry output value%PositiveS5
Tourism output density10,000 CNY/km2PositiveS6
Industry-related
element
Discharge of urban industrial wastewater per unit area10,000 tons/km2PositiveS7
Urban industrial sulfur dioxide
emissions per unit area
ton/km2PositiveS8
Urban industrial smoke and dust emission per unit areaton/km2PositiveS9
Urban registered unemployment rate%PositiveS10
Adaptive capacityIndustry potentialAnnual growth rate of total tourism income%NegativeA1
Annual growth rate of total tourist
arrivals
%NegativeA2
Economic vitalityGDP per capitaCNYNegativeA3
GDP growth rate%NegativeA4
Fixed asset investment per capita10,000 CNYNegativeA5
Per capita year-end deposit balance of financial institutionsCNYNegativeA6
Environmental
protection
Green coverage rate in built-up areas%NegativeA7
Urban green space per capitam2/personNegativeA8
Household harmless garbage disposal rate%NegativeA9
Centralized sewage treatment rate%NegativeA10
Public servicePer capita postal revenueCNYNegativeA11
The number of doctors per 10,000
people
PersonNegativeA12
Per capita expenditure in local general public budgetsYuanNegativeA13
Per capita paved road area at the end of the yearkm2NegativeA14
Number of buses per 10,000
people
BusNegativeA15
Number of subscribers with broadband internet access10,000 householdsNegativeA16
Per capita revenue from telecommunications servicesCNYNegativeA17
Table 2. The Weight of each indicator.
Serial NumberWeightSerial NumberWeightSerial NumberWeight
S10.0603S100.0580A90.0006
S20.0006A10.0003A100.0411
S30.1984A20.0002A110.0007
S40.0868A30.0010A120.0036
S50.0514A40.0045A130.0011
S60.1340A50.0004A140.0013
S70.1290A60.0010A150.0005
S80.1043A70.0016A160.0003
S90.1168A80.0014A170.0008
Table 3. Obstacle factors and obstacle degree of TEV of major tourist cities in China.
CityLevel 1Level 2Level 3Level 4Level 5CityLevel 1Level 2Level 3Level 4Level 5
BeihaiS3(0.2238)S6(0.1445)S9(0.1146)S8(0.1137)S7(0.1076)QingdaoS3(0.2215)S6(0.1408)S9(0.1159)S8(0.1136)S7(0.1065)
BeijingS3(0.2295)S6(0.1234)S8(0.1216)S9(0.1203)S7(0.1117)QuanzhouS3(0.2255)S6(0.1517)S9(0.1191)S8(0.1189)S7(0.1046)
ChengduS3(0.2257)S6(0.1369)S8(0.1164)S9(0.1161)S7(0.1047)SanyaS3(0.2328)S6(0.1455)S8(0.1308)S9(0.1259)S7(0.1196)
ChengdeS3(0.2238)S6(0.1528)S8(0.1201)S9(0.1171)S7(0.1112)XiamenS3(0.2370)S9(0.1276)S8(0.1107)S6(0.0989)S10(0.0720)
DalianS3(0.2268)S6(0.1474)S9(0.1185)S8(0.1170)S7(0.1006)ShantouS3(0.2208)S6(0.1382)S9(0.1155)S8(0.1083)S7(0.0965)
DatongS3(0.2250)S6(0.1508)S9(0.1149)S8(0.1132)S7(0.1098)ShanghaiS3(0.2528)S9(0.1301)S8(0.0989)S6(0.0886)S7(0.0850)
FuzhouS3(0.2229)S6(0.1497)S9(0.1171)S8(0.1162)S7(0.1106)ShenyangS3(0.2215)S6(0.1445)S9(0.1135)S8(0.1134)S7(0.1068)
GuangzhouS3(0.2110)S9(0.1288)S8(0.1229)S6(0.1228)S7(0.1063)ShenzhenS3(0.1948)S9(0.1362)S8(0.1285)S7(0.0987)S6(0.0952)
GuiyangS3(0.2304)S6(0.1384)S9(0.1177)S7(0.1107)S8(0.1097)ShijiazhuangS3(0.2250)S6(0.1481)S9(0.1143)S8(0.1093)S7(0.1034)
GuilinS3(0.2220)S6(0.1565)S8(0.1245)S9(0.1212)S7(0.1148)SuzhouS3(0.2421)S6(0.1422)S9(0.1244)S8(0.1053)S4(0.0892)
HarbinS3(0.2209)S6(0.1484)S8(0.1180)S9(0.1141)S7(0.1086)TaiyuanS3(0.1902)S6(0.1477)S9(0.1175)S7(0.1116)S8(0.1095)
HaikouS3(0.2157)S6(0.1400)S8(0.1173)S9(0.1133)S7(0.1063)TianjinS3(0.2183)S6(0.1360)S9(0.1217)S8(0.1111)S7(0.1082)
HangzhouS3(0.2344)S6(0.1480)S8(0.1243)S9(0.1243)S7(0.1002)WeihaiS3(0.2182)S6(0.1413)S9(0.1135)S8(0.1123)S7(0.1063)
HefeiS3(0.2204)S6(0.1407)S8(0.1154)S9(0.1132)S7(0.1060)WenzhouS3(0.2223)S6(0.1446)S8(0.1162)S9(0.1157)S7(0.1065)
HohhotS3(0.2196)S6(0.1468)S8(0.1132)S9(0.1130)S7(0.1079)UrumqiS3(0.2163)S6(0.1485)S9(0.1139)S8(0.1133)S7(0.1079)
HuangshanS3(0.2314)S6(0.1583)S8(0.1290)S9(0.1245)S7(0.1178)WuxiS3(0.2338)S6(0.1252)S9(0.1161)S8(0.1033)S4(0.0957)
JilinS3(0.2242)S6(0.1498)S8(0.1183)S9(0.1150)S7(0.1078)WuhanS3(0.2302)S6(0.1303)S9(0.1175)S8(0.1122)S7(0.1008)
JinanS3(0.2201)S6(0.1405)S9(0.1119)S8(0.1103)S7(0.1046)Xi’anS3(0.2258)S6(0.1418)S9(0.1174)S8(0.1163)S7(0.1068)
JiujiangS3(0.2248)S6(0.1502)S8(0.1174)S9(0.1161)S7(0.1087)XiningS3(0.2209)S6(0.1475)S9(0.1119)S8(0.1101)S7(0.1066)
KunmingS3(0.2205)S6(0.1468)S9(0.1156)S8(0.1153)S7(0.1093)YantaiS3(0.2208)S6(0.1449)S9(0.1145)S8(0.1127)S7(0.1063)
LanzhouS3(0.2185)S6(0.1460)S8(0.1127)S9(0.1124)S7(0.1062)YinchuanS3(0.2158)S6(0.1452)S9(0.1109)S8(0.1104)S7(0.1037)
LianyungangS3(0.2228)S6(0.1463)S8(0.1154)S9(0.1144)S7(0.1063)ZhanjiangS3(0.2186)S6(0.1479)S8(0.1160)S9(0.1141)S7(0.1066)
LuoyangS3(0.2256)S6(0.1476)S9(0.1155)S7(0.1091)S8(0.1090)ZhangzhouS3(0.2170)S6(0.1607)S8(0.1276)S9(0.1243)S7(0.0928)
NanchangS3(0.2197)S6(0.1414)S8(0.1144)S9(0.1127)S7(0.1021)ChangchunS3(0.2212)S6(0.1451)S8(0.1169)S9(0.1138)S7(0.1083)
NanjingS3(0.2353)S6(0.1309)S9(0.1195)S8(0.1105)S7(0.0910)ChangshaS3(0.2199)S6(0.1411)S8(0.1161)S9(0.1139)S7(0.1072)
NanningS3(0.2234)S6(0.1480)S8(0.1182)S9(0.1152)S7(0.1075)ZhengzhouS3(0.2245)S6(0.1372)S9(0.1125)S8(0.1052)S7(0.1018)
NantongS3(0.2227)S6(0.1473)S9(0.1146)S8(0.1121)S7(0.1010)ZhongshanS3(0.2103)S6(0.1413)S9(0.1162)S8(0.1085)S7(0.0838)
NingboS3(0.2278)S6(0.1412)S9(0.1183)S7(0.1041)S8(0.1034)ChongqingS3(0.2342)S6(0.1650)S9(0.1272)S8(0.1252)S7(0.1181)
QinhuangdaoS3(0.2261)S6(0.1479)S8(0.1115)S7(0.1084)S9(0.1077)ZhuhaiS3(0.1987)S6(0.1454)S9(0.1276)S8(0.1150)S7(0.1060)
Publisher’s Note: MDPI stays neutral with regard to jurisdictional claims in published maps and institutional affiliations.

