Article

Investigating the Urban Spatial Growth by Using Space Syntax and GIS—A Case Study of Famagusta City

Department of Architecture, Faculty of Fine Arts, Design and Architecture, Cyprus International University, North Cyprus, Via Mersin 10, 99258 Nicosia, Turkey
*
Author to whom correspondence should be addressed.
ISPRS Int. J. Geo-Inf. 2021, 10(10), 638; https://doi.org/10.3390/ijgi10100638
Submission received: 27 June 2021 / Revised: 26 August 2021 / Accepted: 13 September 2021 / Published: 24 September 2021
(This article belongs to the Special Issue Georeference of Historical Maps)

Abstract

:
Urban morphology studies generally study how a city grows and transforms to embody its embedded history. This study examines the potentials of using space syntax and GIS methods to study the morphological evolution of traditional city centers throughout the historical periods. Using space syntax properties, human activities and movement patterns in the city can be investigated, typically by considering the degree to which urban spaces are integrated and connected. Through the syntactic analysis of street networks, urban planners can derive a better comprehending of the evolution of urban growth, and gain new insights to help with the new urban development. Space syntax theory and tools can extend the modeling capabilities of GIS, particularly in terms of the development of new advances and experimentation in the analysis of street network systems. Indeed, this study brings academic rigor and attention to details in the spatial growth and morphological evolution in the case of Famagusta city. The finding of this study will redound to the advantage of society considering that socio-economic processes and physical configuration play a significant role in the evolution of a city.

1. Introduction

Urban morphology is a science that examines the physical shape of cities as well as the main factors and processes that shape them over time [1]. One of the main purposes of urban morphological research is to identify patterns in structure, formation, and evolution in the built environment in order to understand how the elements work together [2]. Space syntax theory has provided substantial computational support in the past two decades for the development of spatial morphological studies, in particular urban systems analysis. The space syntax approach focuses on the properties of the space and the relationships between space and movement rather than the morphology of spaces [1]. Numerous empirical studies have indicated the significance of space syntax for the understanding of urban structures. Evaluation of the existing literature found many studies that cover related matters to this research such as socio-economic activities and physical structure influences in urban forms, the spatial configuration of the urban form, the configurational approach to analytical urban design, and morphological evolution of the urban cores [3,4,5,6,7]. However, they do not sufficiently illustrate the morphological variations of the syntactic urban cores at the local level, investigating how the physical structures and socio-economic activities affect urban development and its forms.
The use of space syntax has contributed to the comprehension of the spatial growth of a city as an object formed through society. On the other hand, it can affect or develop certain socio-economic processes in society. Within the scope of this article, the purpose of studying the syntactic method is to achieve a detailed study of the spatial growth of the city during the historical periods and understanding the location of socio-economic activities on the spatial growth of a city. One of the limitations in this study is the lack of available data on the real state’s land values that could confirm the reliability in describing the geography of the settlement and its actual working. Therefore, the socio-economic context is limited to the combination of different activities and functions over a wider area. In this respect, any given building or land utilization is a part of the socio-economic context.
The space syntax approach is useful to identify the spatial relations of the historical center and their challenges in the new urban development. Morphological analysis is used to determine the morphological structure of the built environment, and qualitative and quantitative evaluation of the elements and forms [8]. Accordingly, it is convenient to collaborate between GIS and the morphological approach. The collaboration of space syntax and GIS-based methods facilitate the application of space syntax capabilities and benefits towards morphological evolution of traditional centers of cities throughout the historical periods. Even though space syntax has been widely utilized by urban planners, the collaboration of its displaying capabilities and potential within GIS is still an ongoing obstacle from a computational viewpoint, and it does not give an accurate response on how such collaboration should be made from a computational approach, apart from some empirical applications which are program embedded [9]. Scholars can gain wide geographical databases and integrate the modeling capabilities of GIS with the potential of morphological studies [10]. Space syntax techniques and theory suggest that urban configuration affects human spatial movement patterns in the city, making it possible to predict which paths will be used more than others. Nevertheless, the theoretical and empirical framework of space syntax and GIS-based methods is scattered around in various academic writings. Therefore, this study provided a comprehensive overview of the various concepts used in the syntax of the space method. A collaboration of space syntax with GIS-based methods to study the morphological evolution of cities offers new perspectives to the development of urban morphology studies. Incorporating space syntax in GIS provides some important advantages to both GIS and urban morphology research. There are also some important recent discussions within the GIS-based research community on how spatial models developed within GIS correspond to the way human beings perceive and act in their environment [11].
In particular, this study investigated the morphological evolution of street networks in the case of Famagusta city by using space syntax and GIS-based methods throughout the historical phases. The research is intended with the need of understanding built environments in terms of the spatial growth to understand the physical configuration and socio-economic preferences about space proxemics during the historical periods.
Meanwhile, configurational studies have addressed centrality by way of a spatial development using spatial examination [12,13,14,15], wherein the street network (demonstrating the streets as segment lines) is the main component. As a result, the first hypothesis leads to the second one: If the spatial configuration affects the location of socio-economic activities, then they affect the evolution of the city during the historical periods. This study might be generalized through the systematic application of the space syntax method and effective theories of natural movement to other cases worldwide, in which the predictive capacity of space syntax analysis provides an amazing procedure for predicting the spatial growth and evolution of cities. It contributes to an evaluation of spatial configuration effects on locations of socio-economic activity and the level of vitality of city centers.

2. Material and Methods

Space syntax is a collection of theories and methods for analyzing cities that use space as the basic generator of the city [16]. Since the 1970s, a considerable body of investigation has used the “space syntax” approach to study the morphology of the physical city and its relatives to the functional city. Bill Hillier and his colleagues at the Unit for Architectural Studies, University College London [17,18] originally conceived space syntax in 1980. Space syntax techniques can be used for morphological analyses of architectural plans, buildings, urban plans, and urban areas. These techniques are used to describe the configuration of an urban structure and attempts to explain human behavior and socio-economic activities from the perspective of spatial configuration. The space syntax approach provides an alternative understanding to study the relationship between human movement and spatial configuration through the analysis of how spaces are integrated or connected within an urban area [19,20].
In this part, the basic principle of space syntax, as well as the conceptual basis, the operational techniques, and the configurational indices will be introduced and described with specific reference to the most distinctive aspects (the notion of configuration, different modes of system construction, different configurational indices).

2.1. The Notion of Configuration

In space syntax, the term “configuration” is mostly used to indicate the fact that, as a network of spaces, while shown in the plan of an environment, all feasible ways in which spatial units are demonstrated to interrelate with each other, though the configuration represents a network state that describes relationships between separate spatial units. Space syntax assumes that the spatial networks can be defined as dissimilar configurations for analytic purposes, however, these configurations coincide in social reality [7]. The spatial configurations of a city are governed by the spatial distribution of movement that is “naturally” formed by the spatial layout. In this context [17], offers two main proposals.
Firstly, he contends that configuration is the key determinant of the distribution of movement flows and co-presence in space. Movement is viewed as a way to predict how people use space based on its configuration. The organization of the street network drives movement and as it shapes movements, it also establishes a distribution of land uses [18].
Secondly, he contends that the scattering of land use patterns results from their dependency on movement in the urban grid. The result of changes in street connectivity aimed at attracting more people shows that this in turn tends to attract retail and other uses that depend on the volume of pedestrian traffic and therefore pedestrian density [21]. The configuration of urban street networks that are studied in the analytical framework of space syntax is based on two theories related to movement. Space syntax addresses the connectivity of streets to identify spaces that are easily accessible with their urban spaces compared to a more segregated space [14]. Space syntax suggests some innovations at the level of the relationships between urban space and movement, either vehicular or pedestrian. [18] define the movement created by the layout configuration as a natural movement. They argue that movement has a morphological dimension or, in other words, is a functional product of the inherent nature of the layout. How spatial relationships within an urban area or a building are represented is another characteristic element of space syntax. This representation is translated into an axial map [17].

2.2. Axial and Segment Maps

One of the most essential syntactic tools to analyze the urban area is the axial map, which represents the road network as the longest and lowest straight lines [22]. Axial lines are applied in space syntax to simplify the links between the spaces that make up the urban morphology.
When the space syntax research field started in the 1980s, the main element of analysis of street configurations was the axial line [17]. In space syntax research, the basis for the investigation of the interaction between people and urban form is the street network. The most common method of analysis uses a modified representation of the street network based on network elements called axial lines [23]. The axial line is defined as the longest visibility line for representing individual linear spaces in urban environments. The least number of axial lines that cover the free space of an urban environment constitute what is often called an axial map [24].
The axial map is created by representing in straight lines the geometry of the street network of a city [17,23,25]. The axial representation is created by the drawing of lines that show the longest lines of accessibility within a given built environment. In contrast, accessibility measurements in the space syntax method have raised criticisms about the use of axial lines and their reliance on topological distances rather than the measurement of metric components [15,26,27]. Space syntax provides the techniques showing how to represent a layout as a configuration using each of these units, which are called the axial map, the segment map, the convex map, and the visual fields of the layout. Based on the axial map, a segment map can be generated by dividing each axial line at the intersections with other lines. For a segment map, three kinds of analysis methods which are metric analysis, topological analysis, and angular analysis can be performed to calculate the integration and choice measures for a given urban street network. In a segment map, the axial lines of an axial map are broken into segments at their intersections [28,29].
The axial lines were transformed into segment lines by a space syntax among the new developments, which introduced refined accessibility analytics called angular segment analysis [30,31]. Figure 1 shows an example of a basic segmented axial map.
Segment angular analysis is based on the same concept as the axial line, with the difference in the division of axial lines into segments. At the points where the axial lines intersect, each axial line is divided into segments. Segment lines are argued for a more accurate assessment of shortest paths determined by their least angle change of direction, which allows not only topological measurements but also metric and geometric distances to be measured throughout and across the road network [25]. Each street segment is therefore studied according to how accessible it is from all other segments of streets in a city. The analysis allows three descriptions of the distance among each street segment and its neighboring area. These three notions of distance are used to calculate two measures that indicate measures of centrality [21]:
  • Topological: considered as the fewest directional rotation between one segment to the others;
  • Metric: considered as the distance in meters among a segment and all other segments;
  • Geometrical or angular: considered as the shortest path based on the least angular deflection. This means that when a body moves from one point to another, the distance is weighted due to the change in direction.

2.3. Syntactic Measures

Among several syntactic measures, integration is the most important criterion when applied to the segment and axial maps of space syntax. The value of an integration line in the segment or axial map is defined in terms of the shortest paths between the line and all others in the network [21]. Integration illustrates the proximity of one street segment to all others under each definition of distance.
Choice has been another significant centrality measure of space syntax, which computes the distance of shortest paths among each pair of segments that every segment lies on under any definition of distance [32]. The choice is “betweenness” for structural sociologists, while integration is “closeness”. In contrast with integration, a choice indicates the degree to which a line is located on the network’s shortest paths from one line to another. The choice value of a certain axial line is calculated by dividing the number of the shortest routes into any two lines on the axial map that contains the line divided by the shortest paths among any two lines on the map. The choice value of a segment, on the other hand, is computed by substituting the shortest paths with paths that have the lowest angular cost for each potential origin and destination pair of the given segment [30]. As noted above, the most important parameters in this study would be integration value and choice degrees at varying radii.
The configurations of traditional cores of Famagusta with its modern development are investigated by displaying them in terms of the structure of spaces through segment and axial maps. The configuration parameters such as choice, and local and global integration with various distances are considered.
As presented in the space syntax literature, the technique of measuring the potential for movement in a street network considers two types of movement that each human journey involves [14,17,32,33]:
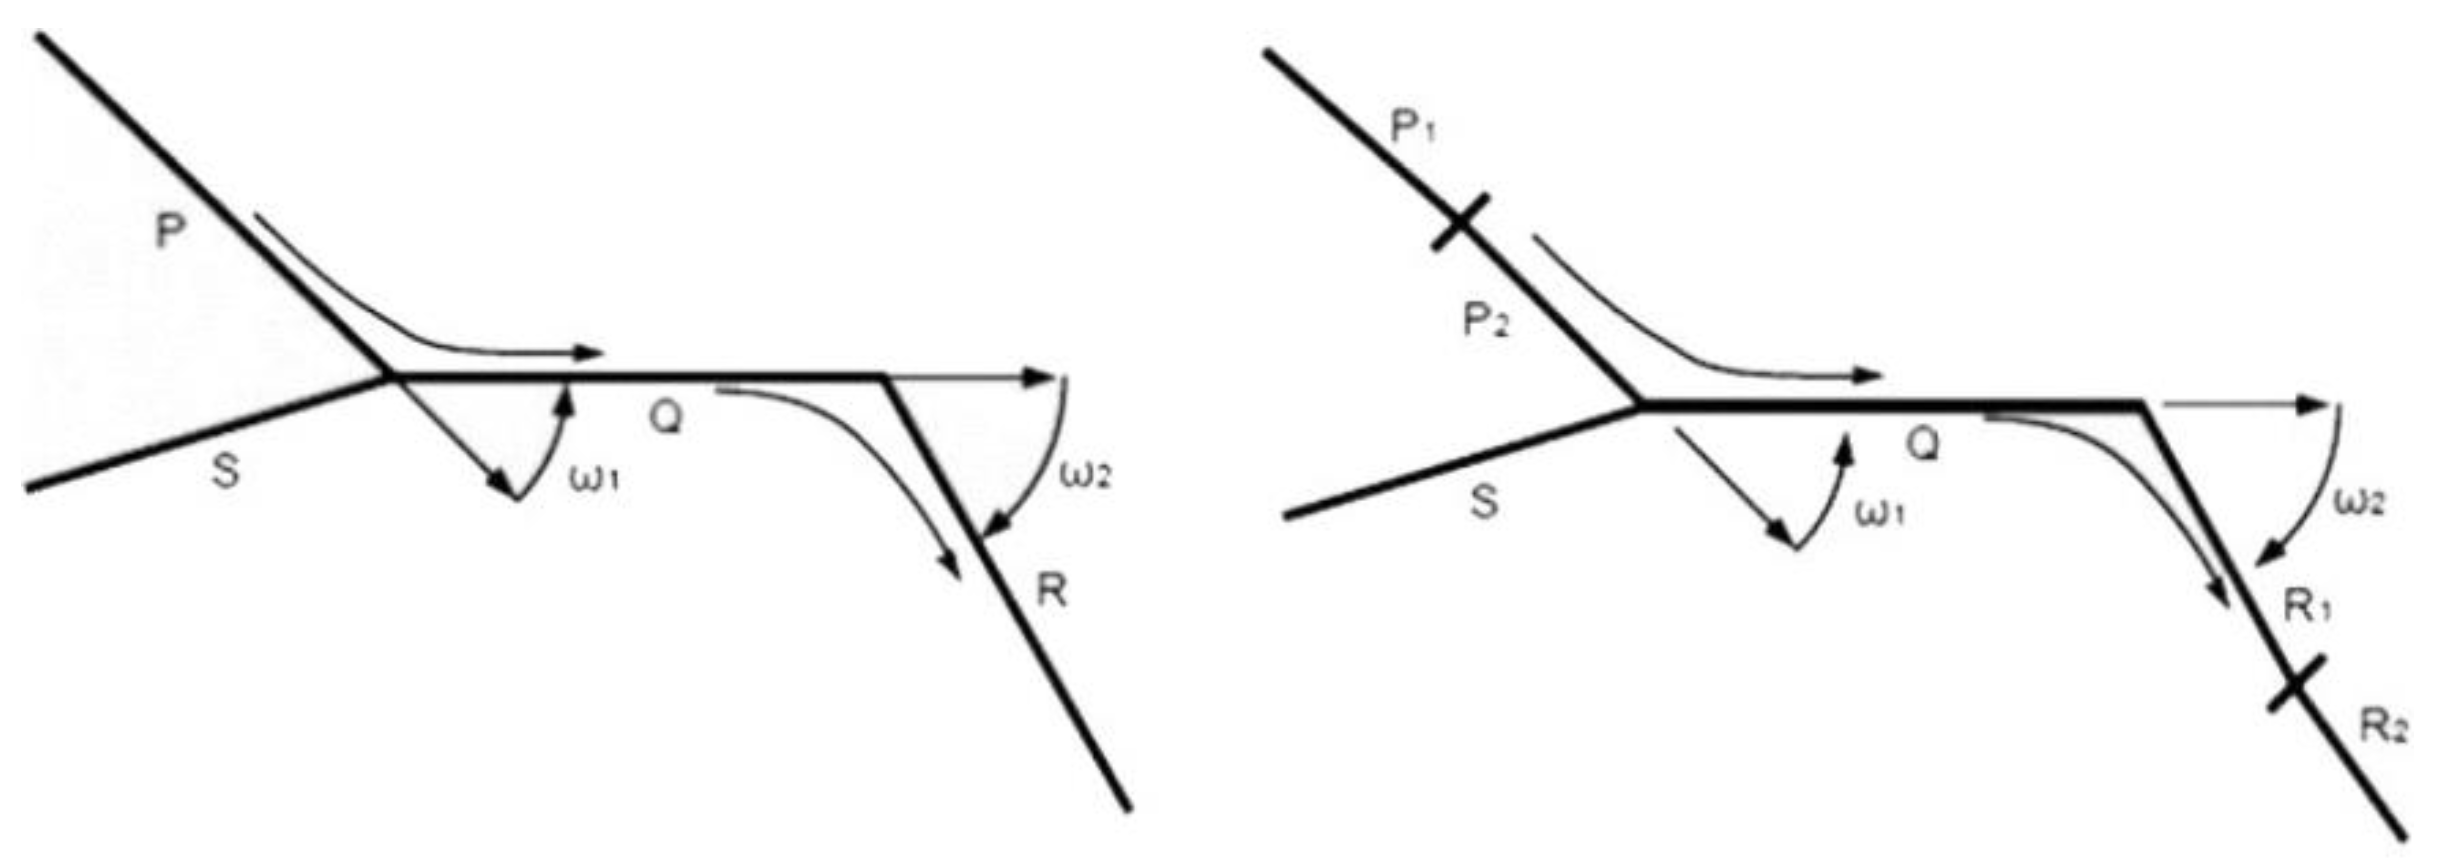
  • Choosing a destination from a starting point—determining where to go—termed a to-movement component of the trip;
  • Choosing the spaces to pass through on the way to the destination—choosing the path to get there—termed a through-movement element of the trip.
Thus, each definition of distance leads to a calculation of integration and choice, which results in a different examination of the street network: the metric description of distance shows a structure of shortest paths for integration and choice; the topological description displays the least turning map of structures, and the geometric description presents a system with the slightest angle change map [21].
On the one hand, the measure of choice refers to how one can traverse from one location to another—making a through-movement trip. Thus, the morphology of routes establishes a norm of how to move through the urban system. Conversely, the measure of integration defines how easily one location can be reached to another. People make a lot of small trips and a small number of large trips, so destinations that are closer to the origin will generally have more potential as destinations. Accordingly, the measures of integration by segment angular analysis in Depthmap and different metric radii are considered as follows: Among numerous syntactic measures, integration value has been the most significant parameter which measures how many turns we should do to switch from one line to another and how easy it is to go from one line to all other network lines. The integration significance of a line in the segment or axial map is described in terms of the shortest routes among the lines in the network. Global integration analysis displays the calculation of the spatiality of a street axis in terms of the total number of changes in direction to other streets of a city. The fewer changes of direction, the higher the global integration value [17,21,33]. The key to measuring the local integration of a built environment lies in computing the average value of the mean depth of all streets in an urban area. In contrast to integration value which estimating the “to-movement” of the urban environments, the choice value is useful in approximating the “through-movement.” The choice indicates the degree to which a line is in the shortest paths from one line to another in the network. The choice value is measured to link with flows of movements in axial maps by separating the number of straight routes between every two lines [30]. Choice value designates how likely the line is to be chosen on paths from all features to all others in a network and thus representing its potential for through-movement [28]. Two main morphological variables of integration and choice are listed in Table 1 to describe their formulas.

2.4. GIS-Based Methodology “Kernel Density Estimation”

Geographic information systems (GIS) are a subset of information that collect, integrate, store, edit, analyze, share, and display spatial and geographic information [37]. GIS enhances a spatial and statistical analytical database to digital mapping abilities. While already a popular tool of research and applications in the fields of geography, planning, recent years have seen distinct progress in the use of GIS for the historical analysis of cities [38,39]. On the other hand, GIS provides a rich set of spatial data analysis and visualization competencies that support urban studies. Furthermore, the principles that emphasize space syntax theory can extend the capabilities of GIS modeling, on the other hand, especially in terms of recent advances and experiments in urban systems analysis. The central essence of GIS first leads to a consideration of the relation between GIS and urban history as a branch of the rapidly developing field of historical GIS. More specifically, this study uses GIS to evaluate the relationship of GIS for examining historically developed urban forms by representing town plan analysis. As [40] interpret, historical GIS demonstrates the well-known ability of GIS software to collect and visualize urban historical spatial data.
Kernel density estimation, a spatial analysis technique, has been broadly used in point of interest (POI) data analysis and is frequently used to discover spatial “hot spots”, such as density of roads, retail areas hotspots, accident hotspots [41,42,43]. The methodology is based on the kernel density estimation (KDE) that operates along with denser street networks of Famagusta city throughout different periods.
Table 2 shows the formula and illustration for calculating the point and linear density. The point density tool calculates the density of point properties around each output raster cell. The line density tool calculates the density of linear properties in the neighborhood of each output raster cell. Density is calculated in units of length per unit of area.

2.5. Case Study of Famagusta

The use of a single case study methodology, which is typical in the field of urban planning and design, enables the scholars to develop a thorough studying of the case by understanding it in detail [45]. This research explores Famagusta city as a case study. Famagusta, located on the eastern shore of the island of Cyprus in the Eastern Mediterranean Sea, is the second-largest city of Northern Cyprus. According to [46], “Famagusta is one of the most precious specimens of medieval fortification left in the world”. What makes Famagusta distinctive among the world cities is its dual characteristics of historical grace and modern development. On the one hand, it is a richly layered historic urban place of extraordinary cultural and traditional heritage. On the other hand, it is surrounded by Varosha and a port which have the great strategic and potential socio-economic value. As one of the cities in Cyprus, Famagusta’s urban character and function have significant effects on urban spatial evolution, which makes the development pattern of Famagusta different from other Cypriot cities to some extent.
Figure 2 represents the location of Famagusta and its spatial structure according to the new development. The socio-economic transformation of the city around the nineteenth century accelerated its expansion beyond the city walls. In recent years, the city has expanded to the northwest due to military-controlled areas, the Varosha closed area (southeastern neighboring region), and the establishment of the Eastern Mediterranean University. The Varosha region, located southeast of the walled city, is a vast district that has been off-limits to the population since 1974. This district contained 143 administrative offices, 60 hostels, 45 hotels, 21 banks, about 3000 commercial entities, 99 recreation centers, 24 theaters/cinemas, 4649 residential houses, and 380 incomplete constructions, all left empty and unused since 1974 [47]. After the war in 1974, after the island’s segregation into two regions (Turkish in the north, Greek in the south), Famagusta lost its dominant position, and Varosha became a “ghost town” that is completely uninhabited, empty, and entombed. This also affected and put pressure on the walled city, which was the commercial and trading center of Famagusta.
In the last 30 years since the inauguration of the Eastern Mediterranean University, Famagusta’s rapid urbanization has contributed to the transformation of urban development and significant changes in the urban spatial structure. Precisely, in the last 15 years, the growth of urban areas and the evolution of urban morphology have become an important symbol of urban development. Parts of the city are physically divided due to the Cyprus conflict since 1974 [47]. Varosha is surrounded by barbed wire and entry is prohibited. Buildings and streets are empty. However, it has recently reopened for visiting. Famagusta is a worthy case study due to the diversity of civilization and the evolution of urban patterns over historical periods. The medieval city of Famagusta is enclosed in the modern town and surrounded by its circuit of bastions and walls built by the Venetian rulers in the sixteenth century, the old town partly survives to this day [49].
The history and development of the urban center of Famagusta and the walled city as a unique region of the city date back to the first century A.D. This city has developed throughout seven particular periods: the initial eras (648–1192 AD- the base of the city); Lusignan period (1192–1489); Genoese period (1373–1464); Venetian period (1489–1571); Ottoman period (1571–1878); British Colonial period (1878–1960); period of Republic of Cyprus 1960–1974; and after the war in 1974 [50].
Famagusta served as a trading and active Mediterranean port through the ages, the home of evolving and transient populations changing with each conquest and territorial conflict. Lately, the walled city has suffered from decline and deterioration due to several factors, including the political stalemate that followed the political conflicts after 1963, the division of the island in 1974, and the economic and growth dynamics that separated Northern Cyprus and Famagusta in particular. The walled city of Famagusta has managed to maintain its strong medieval character. The urban pattern of the walled city includes the main square, the narrow organic street network, several monumental buildings, among them the Lala Mustafa Pasha Mosque (formerly the Cathedral of St. Nicholas), one, or two-story courtyard houses, and storage buildings [51]. The growth and development of the Famagusta urban pattern can be considered in six periods:
The Lusignan period (11891489) was accepted as the peak of the island of Cyprus in terms of socio-economic prosperity and the level of civilization [52]. During this period, the walled city of Famagusta was an important place because of its natural harbor; a citadel and a castle were built to protect the city. The city has been known as a lively commercial port with an active social life, while more than three hundred churches were built—only some still survive [53].
The Venetians (1489‒1571) rebuilt and improved the fortifications and walls of Famagusta, enabling them to withstand artillery [49]. During the Venetian era, the administration of the island seems to be highly militaristic, thus the physical appearance and the layout of the settlements had been formed accordingly. In this period, walls, churches, and other buildings were constructed, elevating Famagusta’s role as a center of mercantile activity in the Mediterranean [54]. It was the Venetians who made Famagusta into the fortified city. The current walls are mainly from the fifteenth and sixteenth centuries and provide a great example of a strong medieval city with citadels, bastions, rocky moats, and gates [49].
The city was conquered by the Ottomans in (1571‒1878). The Ottoman policy dramatically changed the fate of Famagusta [54]. The Ottoman policy towards the walled city affected socio-economic life as well as physical and spatial shape. The Ottomans, while engaged in some new construction projects, were mainly content with maintaining the existing buildings and structures and using them with the necessary changes and developments to adapt to the socio-economic and cultural life of the new inhabitants. Therefore, the cathedral was transformed into the Lala Mustafa Pasha Mosque [49].
Britain’s empire (1878‒1960) took control in 1878 and began the process of modernization. In 1878, the Ottomans leased the island to the British. It was annexed by Britain in 1914 after the outbreak of World War I, and in 1925 the island became a crown colony in the British Empire. The expansion of cities beyond the southern walls, which had already begun in the Ottoman period, accelerated. The British also built an administrative area between the walls and Maraş (Varosha) intending to develop an alternative city center that would mostly include administrative and commercial activities. However, the walled city retained its importance as a traditional core as well as a residential neighborhood. What characterized the British period apart from what had been identified before was the construction of new buildings and Famagusta roads and the demolition of other buildings according to the traditional pattern and urban features [54].
During the period 1960 to 1974 (the Republic of Cyprus in 1960) the administration of the city was divided into two municipalities, the Turkish (mainly within the walled city) and the Greek (all other districts). As a result, the walled city was overshadowed by the rapid development of the Varosha, although its historical structures were still important despite the political difficulties. During this period, the walled city was neglected and substantial development did not take place, which resulted in a static state in terms of the urban pattern [52].
In the period from 1974 to the present, the walled city has undergone stagnant development dynamics, as many of the new settlers, many of whom are refugees, have been located outside the walls. This prevented further growth to the south by diverting pressure away from the developments within the closure and buffering of Varosha. The development of the city then turned northwards [55,56]. The 1974 occurrence was the watershed between the two communities. This event shattered the political, social, economic, and physical dynamics of Famagusta. However, now there is more freedom of movement and a stronger desire for a political compromise between the two sectors. In this period, due to the abounded Varosha and the establishment of the EMU University, the growth of the city extended toward the north.
Figure 3 shows the morphological evolution of the walled city in Famagusta during the last six historical periods. The city grew organically from the main square and its related axes.

2.6. Data Collection

This study assumed a spatial analytical methodology according to the collaboration of “space syntax” and GIS methods, to quantitatively explore the spatial growth of the historical core of Famagusta and the evolution of its street networks grid in the way to becoming today’s modem city. Mostly the angular segment analysis was selected, which can reflect the characteristics of various sections of the axis. Space syntax utilizes connection graphs taken from the segment maps to excavate the structure of spatial morphological variables and uses the morphological variables computed on this basis to qualify urban spaces quantitatively [21]. The traditional approach of urban morphological study is focused on the structure of urban settlements, and it is mostly from a geographical point of view. In the new field, space syntax offers precision measurements of spatial configuration and is used to study urban morphology from a different perspective. To evaluate the investigation of the study areas, a syntactic analysis was carried out in order to trace the changes using the collected maps. In addition, this study developed a kernel density estimation method for estimating the density of points on the street networks and implement the method in the GIS environment. It intends to show the application of the ordinary two-dimensional kernel method to density estimation on the evolution of the nucleus of the street network.
The use of syntactical measures, integration, and choice from syntax analysis allowed us to make a comparison between the two phases of development with the current city form of the historical center of the city. As previously described, space syntax methodology works with two key concepts of centrality–integration and choice (also mentioned as potential to-movement and potential through-movement). When considering results of measures mainly addressed by segment maps (e.g., angular segment analysis), to-and through-movement were associated with basic components of human movement [57], to-movement (integration) relating to visitors’ movement; and through-movement (choice) relating to inhabitants’ movement.
This article applies the segment angular analysis—a study in which the metric radius can be used to measure angular turns as a metric boundary. The analysis is useful for finding the main lines that are most relevant to the ‘through- and to’ movements in the system [29].
In this analysis, two categories of parameters “integration” and “choice” were interpreted in the case of Famagusta, which estimated the potential movement defined in the literature of space syntax theory. In terms of data collection of this study, the redevelopment maps, projects, analysis, articles, and satellite images were collected as a multi-aspect approach. In addition, as mentioned, the case study method was used to compare the morphological formation of historical core and transformation process during different eras. To study the transformation of urban morphology in Famagusta, secondary data and maps such as base maps and satellite maps from Google Earth (2019) were used for the syntactic and morphological analyses. These maps and documents were analyzed to understand the historical growth and change in urban morphology in Famagusta city. The data included the maps of Famagusta representing the Lusignan period until the current city era. The first historical phase (1192–1489) which is the historical center of the city was located inside the walled city of Famagusta. Six syntactic models were established based on historical maps drawn/published respectively in 1192–1489, 1489–1571, 1571–1878, 1878–1960, 1960–1974, and after 1974 up to today. First, an axial map of the entire city of Famagusta and the walled city was generated. Then, angular integration and choice values were calculated on the generated axial map by using UCL Depthmap 10 software to represent the to-movement and through-movement potential, respectively. The Famagusta street network data were provided and were given access by the municipality. The data include all city streets and routes, stored as line shapefiles. In addition to physical location and characteristics, information such as street names and transit route characteristics were also available. Both sets of data were current as of 2020.
The study was carried out through three phases:
-
The first phase contained a historical review and spatial analysis of the urban growth of Famagusta based on previous studies. The roles that physical configuration and socio-economic activities based on the land use distributions have played in different periods were also sought through current literature as historical clues for the subsequent spatial analysis;
-
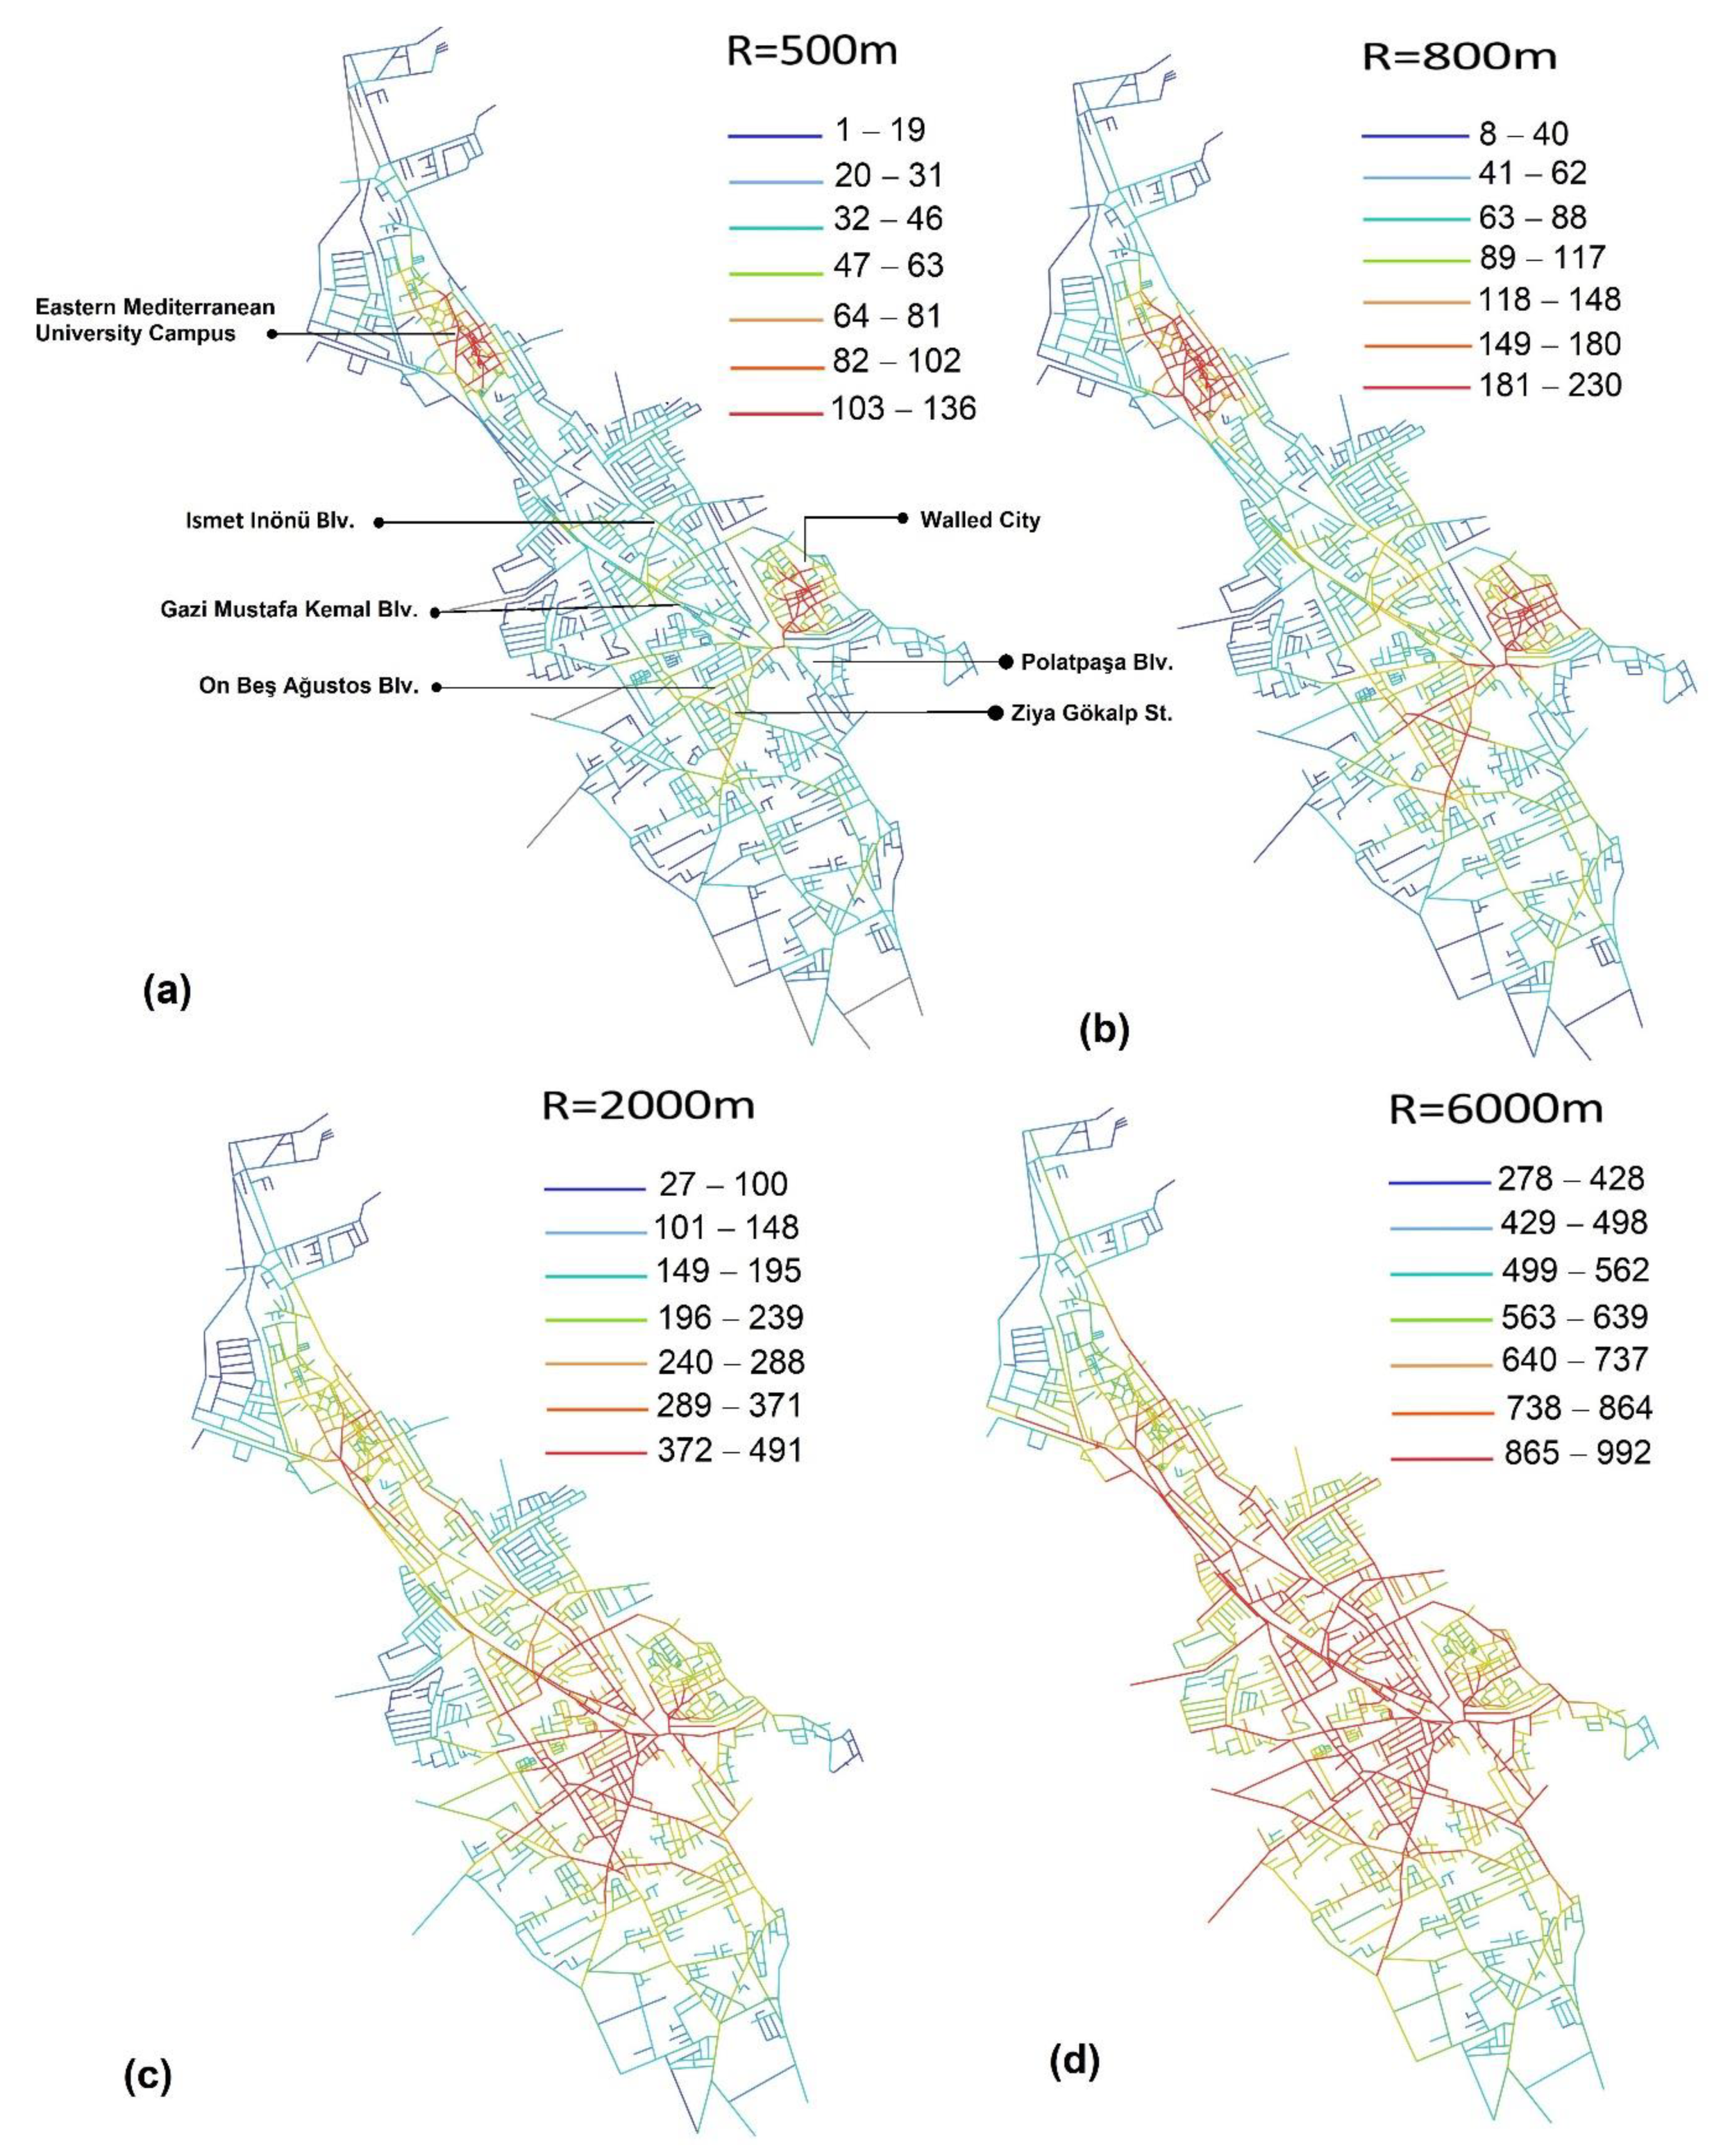
The second phase involved a comprehensive spatial analysis containing a space syntax analysis on the morphological evolution of Famagusta. Integration and choice measures were automatically calculated in Depthmap for any defined radius used;
-
The third phase involved a GIS-based methodology for determining the density of street networks, and the growth of the city from the traditional core was laid out. The kernel density estimator (KDE) was calculated with ArcGIS.
The integration value can be viewed on the map with a variety of colors, from red for most integrated roads and blue for the most segregated streets. The integration indicators at radius-n of a line consider the n-steps required to cover all the lines in the entire system. Thus, the integration value calculated at a lesser radius described a local syntactic property than that computed at a higher radius. The metric radius refers to the metric distance from each segment across all available streets from that segment to the distance from the radius. For instance, the amount of segments needed in the network to reach all other segments without a radius restriction was supposed to be a measure with radius “n” (Rn).
If a radius of 500 m was measured, segments were only considered within the radius area and no segments were estimated beyond that radius. This implies that only the local relations between segment elements were known within 500 m along the adjacent segment lines from each of them. Both systems were processed for axial analysis at varied topological radii (Rn) and angular segment analysis at varying metric radii (500, 800, 2000, 6000, n); measures of integration and choice were processed at all metric radii.
This study led to considerate syntactic logic behind the street network evolution identifying which directions were the most accessible street network development. The outcomes of this study were based on the syntactical investigation of Famagusta city. This is why the result of this article or the analysis drawn from the morphological examination may only apply to Famagusta city.

3. Syntactic Analysis of the Case Study

The configurational analysis allowed us to identify some chief points in the urban evolution of Famagusta. Within the period under study (1192–after 1974), six periods were considered. As shown in Figure 3, the analysis of the axial maps discovered the formation and transformation of the street network configuration, towards a greater urbanity. The analysis of the axial maps showed how residents have historically transformed the street network according to their needs. The integration core of a city was mainly formed with the highest integrated axial lines. The integration core in the development area seemed to be intensified by local grids, attracting cafes, restaurants, and retail shops. It reflects the argument of [33] that a successful commercial center requires two parts of spatial character: the higher value in global integration and the intensification of the local grid. The urban growth of Famagusta in different periods based on the street network system is shown in Figure 4.
Famagusta became important in the time of Lusignan because of its natural harbor: The citadel and fort were constructed to preserve the town. Thus, in the thirteenth century, Famagusta was originally a small fishing village and became a major trading center between East and West during the Lusignan period [50]. The Venetians transformed Famagusta from a military base into a fortified town. A fantastic example of a strong medical town, the walled city dates back to the fifteenth century. The city’s urban pattern was then mainly developed through the main axis south/north and south-east/north-west directions, and the city center was located inside the St. Nicholas Church triangle, its square, and Venetian Palace [47,50]. The Venetian period saw the development of a relatively high number of pathways; the streets with high integration values at the radii of 250, 500, 1000 m, and n, including Istiklal Road, Server Somuncuoglu, and Sinan Paşa Street. It was during this period that the main access to the walled city developed, and buildings were placed around the market square in the historic center of the city.
In 1571, the Ottomans conquered the city. The population was primarily concentrated in the southern half of the walled city during the Ottoman period, and the organic urban pattern was enriched by the development of cul-de-sacs. Expansion of the city outside the walls toward the south, already started during the Ottoman period, was then accelerated [47,50]. During this period, the street network in the walled city was interlinked with supplementary accesses and several new streets, with most axes had a high integration value at the radii of 250, 500, 1000 m, and n. This indicates the enhancement of access and the integration of the street network system in this period, but a limited number of buildings was constructed in the walled city. The Ottomans hired the island to the British in 1878, and the island became a genuine British Empire colony in 1910.
The British constructed an administrative center between the walls and the Varosha region as part of its colonial experience. At the beginning of the British period, the most destruction took place in the Walled City [53]. During this period, development expanded outside of the city walls, including Polatpaşa Street; however, the high integration values remained within the walled city. During this period, the attitude of the new government led to a change in the new pattern of development of the historic district, so that new roads were built contrary to the traditional texture.
In 1960, the British left the Island, and the Republic of Cyprus was established as a partnership between the Greek Cypriots and Turkish. During the Republic of Cyprus period, the direction of development transformed towards the west of the walled city; the street network system further expanded, including Istiklal Road and Lala Mustafa Paşa Street, driving the connectivity axis of the walled city to the outside. Following the events of 1974, there was a stagnant period of development throughout the city due to uncertainty in political and socio-economic conditions [50,59]. In the current city, the historic district has low global integration and high local integration. The walled city is no longer the most integrated area as it once was in local integration. Subsequently, the integration and choice values of the whole city and the defined historical center were comparatively analyzed.
As mentioned before, the angular integration and choice indicate the to- and through-movement intensity on a certain segment in the street network [21]. Based on the results of these analysis, the integration and choice values of the city were calculated and an integration and choice map was generated. Both analyses have been limited to the radii of 500 and 800 m to determine local, i.e., pedestrian and bicycle movement, and 2000 and 6000 m for the global structure and vehicle movement in the city. Furthermore, the integration maps concerning the whole city are presented in Figure 5.
Figure 5 shows the segment angular integration of Famagusta, highlighting the axes with high integration. Unexpectedly, Ismet Inönü street is not the most integrated path in the city in the angular global integration map; this is probably due to the lack of connections, between this and other streets, generated by military bases. This is accredited to the increasing use of vehicle and public transport developments, besides the advancement of communication-related technologies. Moreover, the walled city region as a whole has the highest value of local integration through a radius of 500 m. While within a radius of 800 m, in addition to the walled city as the highest level of local integration, the EMU campus and On Beş Ağustos street have the highest local integration value, respectively. However, in the radii of 2000 and 6000, the main and commercial streets such as Ismet Inönü street, Gazi Mustafa Kemal streets and the streets leading to them have the highest level of integration. The numerical value in Figure 5′s legend represents the number of accesses leading to the desired space. The most locally integrated streets are where the most vital pedestrian-friendly streets in the historical center of walled city and university campus are. Along with the globally integrated streets, new development streets, and the main city center with a high number of individual stores, chain shops, and cafés have the highest degree of integration in which the development process of the city is well seen colored in red. According to the measure of local integration at 500 and 800 m, inferring that it is at these radii that the structure of the grid reflects local movement, the dominant streets with the highest integrated degrees are those related to the historical and cultural centers.
Figure 6 shows the angular global choice, and angular local choice maps of the city. In the radii of 500 and 800, the inner streets of Walled City and Eastern Mediterranean University campus have the highest level of choice. However, Ismet Inönü street, Gazi Mustafa Kemal street, On Beş Ağustos street, Ziya Gökalp street, Tümen street has the highest value of global choice through a radius of 2000 m. While in the radii of 6000, the main and commercial streets and axes leading to them have the highest level of choice.
All of the above analyses emphasized how Ismet Inönü street is the most important street in the city as a commercial and administrative area with the highest value of choice and integration. The main institutional and commercial centers of Famagusta are located along this street. The traditional approach of this article has been the evolution process of urban form by studying the processes that have led to the current urban form. The presence of Varosha is a key hindrance to the further development and growth of the walled city and the whole area. A balance of development will be required to achieve this, as will a decision-making and management framework that encompasses and integrates the walled city, greater Varosha, and the northern and eastern suburbs, including Eastern Mediterranean University. These two aspects have played a key role in the functioning and morphology of the city and its evolution. Figure 7 shows the growth of the city by pointing to the existence of physical barriers and important phases.

4. Discussion

In terms of city organization, the walled city has developed throughout history in different phases, under different social, economic, cultural, and political conditions. By reviewing the available literature, studies have covered many topics including morphological characteristics of the walled city of Famagusta and spatial characteristics of Cyprus port cities by analyzing the physical layout and syntactic characteristics [52,60,61] The division of Cyprus in 1974 and the establishment of the Eastern Mediterranean University in 1979 significantly changed the morphology of Famagusta. Since then, the city has been developing away from the walled city and towards the university campus, which is now one of the main factors of socio-economic activities in the city [50,55]. The historical center of Famagusta (walled city) has experienced considerable transformation throughout the rapid physical and socio-economic transitions in the last 30 years.
In addition, considering the prediction of the spatial growth of the city through the main configurational variables (integration and choice) and due to the physical barriers created during history, which include the Varosha district and establishment of the university, and the military zone, the key obstacles have contributed to the further growth of the city. The spatial growth has undergone extensive directional changes toward the north. The urban evolution processes of Famagusta city witnessed significant phases of formation and transformation, as obvious in its street networks. In terms of morphological characteristics, Famagusta city can be evaluated in two parts: the historical center (walled city), and the newly developing parts outside the walls. The findings of this study will redound to the advantage of society, considering how physical configuration plays a significant role in the evolution of a city. In addition, due to the presence of Varosha and the military zone as a key obstacle to the further development of the walled city and the whole area, the planners and local authorities could have utilized this threat as a potential area for new rapid development as a regional commercial and social center.
With studying the evolution process of the historical center of Famagusta, a space syntax-based analytical tool along with an analysis based on the kernel density in GIS was applied to investigate the urban morphological changes of Famagusta city. The study also described the relationship between spatial structure and different functional patterns (e.g., the commercial area) within the timespan under study (1192–after 1974) of six periods. The results of this study showed that the historical center, which is the local integration center, has gradually decayed its global value in recent eras. It was also highlighted by the results of the analyses that the physical and socio-economic structure of the city affects the integration and choice values. The modern Ismet Inönü is the most significant street in the city because the longer commercial lanes offer more value than the historical organic pattern of the walled city. In addition, according to studies conducted by GIS-based techniques, the historical core of the city has the highest rate of density in different periods compared to other areas of the city.
Furthermore, using ArcMap, the growth process of the city in districts and street networks has been investigated by means of the current status maps in different periods (Figure 7). Kernel density estimation methods have also been used in visualizing street patterns at different periods, with the objective of understanding and potentially predicting density patterns. Various analysis has indicated that the layout of the evolution of street networks is influenced by certain physical configurations and socio-economic activities, and the street network, which is a bridge to connect the historical center to the new development, and this plays an important role in the urban evolution of the city. Figure 8 shows the kernel density estimation by the ArcGIS spatial analyst based on the lines and street network of Famagusta throughout the last six historical periods.
The use of a single case study methodology, which is typical in the field of urban planning and design, enables the scholars to develop a comprehensive and thorough studying of the case by understanding it in detail [45]. Despite this, the generalizability case results in other contexts than the one studied, and cannot easily be generalized or reliably replicated. Multiple case studies have quieted the skeptics somewhat, but effective multiple studies benefit from careful case selection [62]. This study might be generalized in similar cases for internal or external generalization through the collaboration of systematic application of the space syntax methods and GIS-based modeling capabilities, in which the predictive capacity of both approaches provides an amazing procedure for predicting the spatial growth and evolution of cities throughout the history. The association between the morphological approach “syntactic analysis” and GIS-based method will facilitate the application of space syntax capabilities and benefits towards any urban studies in which the structure and the function of the city is a component.

5. Conclusions

This study showed that, in a physical configuration, as a consequence of the relative depth distribution (i.e., integration), the most integrated spaces in the system tend to attract certain types of land use that benefit from the concentration of people. Thus, the most integrated streets are the ones most used by people and lined with main global functions and local shops. In Famagusta, the integration of different phases is found mostly along with the commercial interface and the integration core follows the pattern of linear commercial and other major administrative functional activities (e.g., Ismet Inönü and Gazi Mustafa Kemal streets). These streets are well recognized for city-scale commercial activities, and these streets fall within the global integration. The results show that these are highly integrated both in terms of the global street network, and these roads have more choice.
The walled city is no longer the urban center in terms of commercial, development, circulation, and socio-economic activity—rather, multiple centers exist in the sprawling growth to the north and west of the old center. The historical core of Famagusta remains intact and functioning but devalorized. Political disputes have led to a recession in the walled city and of course in the closed areas of Varosha. The scattering of apartments, commercial, and suburban developments along roads (especially in İsmet İnönü Street) distributed outward from the walled city has progressively debilitated it as the center of socio-economic activity of the region. As politics change and allow Famagusta to regain its role as a regional urban nucleus and recreational destination, the walled city must be strengthened as the only historical center in the region. To achieve this goal, a balance between the development of walled city, Varosha, the northern and eastern suburbs, including Eastern Mediterranean University will be required, as will a management framework and decision-making that encompasses and integrates the walled city.
So far, the specific findings of this research have discussed the syntactic analysis and process of the growth of the city based on the physical obstacles and activities. Enhancing the research structure will lead to more meticulous evaluations and the outreach of other closely relevant fields of research. Consequently, due to the limitation of data and the fact that it is difficult to obtain precise data on the socio-economic variables to simplify a more comprehensive examination of the spatial configuration, future continuations of this sector of the study would also profit from adding the factor of density, land value, and transportation into the analysis.

Author Contributions

Conceptualization, Mitra Allahmoradi, and Cemil Atakara; methodology, Cemil Atakara, and Mitra Allahmoradi; software, Mitra Allahmoradi; validation, Cemil Atakara, and Mitra Allahmoradi; formal analysis, Mitra Allahmoradi, and Cemil Atakara; investigation, Mitra Allahmoradi, and Cemil Atakara; resources, Mitra Allahmoradi, and Cemil Atakara; data curation, Mitra Allahmoradi, and Cemil Atakara; writing—original draft preparation, Mitra Allahmoradi, and Cemil Atakara; writing—review and editing, Mitra Allahmoradi, and Cemil Atakara; visualization, Mitra Allahmoradi, and Cemil Atakara; supervision, Cemil Atakara; project administration, Mitra Allahmoradi, and Cemil Atakara. Both authors have read and agreed to the published version of the manuscript.

Funding

This research received no external funding.

Data Availability Statement

The study did not report any data.

Conflicts of Interest

The authors declare no conflict of interest.

References

  1. Oliveira, V. Teaching Urban Morphology; The Urban Book Series; Oliveira, V., Ed.; Springer: Berlin/Heidelberg, Germany, 2018. [Google Scholar] [CrossRef]
  2. Kropf, K. Ambiguity in the definition of built form. Urban Morphol. 2014, 18, 41–57. [Google Scholar]
  3. Choudhary, P.; Adane, V. Spatial configurations of the urban cores in central India. Proc. Int. Space Syntax Symp. 2012, 8028, 1–19. [Google Scholar]
  4. Karimi, K. A configurational approach to analytical urban design: ‘Space syntax’ methodology. Urban Des. Int. 2012, 17, 297–318. [Google Scholar] [CrossRef]
  5. Kung, F.-C.; Wang, P. A Spatial Network Approach to Urban Configurations. SSRN Electron. J. 2011. [Google Scholar] [CrossRef]
  6. Nankervis, M. Influencing urban form: Economic development and the evolution of Australian urban forms. J. Archit. Plan. Res. 1992, 9, 325–337. [Google Scholar]
  7. Rashid, M. Space syntax: A network-based configurational approach to studying urban morphology. In The Mathematics of Urban Morphology; Birkhäuser: Basel, Switzerland, 2019; pp. 199–251. [Google Scholar] [CrossRef]
  8. Bortnyk, S.; Pohorilchuk, N.; Kovtoniuk, O.; Korohoda, N. The use of GIS in the morphological analysis of pistes. Geoinform. Theor. Appl. Asp. 2020, 2020, 1–5. [Google Scholar] [CrossRef]
  9. Jiang, B.; Claramunt, C.; Klarqvist, B. Integration of space syntax into GIS for modeling urban spaces. Int. J. Appl. Earth Obs. Geoinf. 2000, 2, 161–171. [Google Scholar] [CrossRef]
  10. Moudon, A. Urban morphology as an emerging interdisciplinary field. Urban Morphol. 1977, 1, 3–10. [Google Scholar]
  11. Freksa, C.; Mark, D.M. Spatial information theory: Cognitive computational foundations of geographic information science. In Proceedings of the International Conference Cosit ‘99, Stade, Germany, 25–29 August 1999; Springer: Berlin/Heidelberg, Germany, 1999. [Google Scholar]
  12. Crucitti, P.; Latora, V.; Porta, S. Centrality in networks of urban streets. Chaos Interdiscip. J. Nonlinear Sci. 2006, 16, 15113. [Google Scholar] [CrossRef]
  13. Cutini, V. Centrality and Land Use: Three Case Studies on the Configurational Hypothesis. Cybergeo 2001. [Google Scholar] [CrossRef]
  14. Hillier, B. The Hidden Geometry of Deformed Grids: Or, Why Space Syntax Works When It Looks as Though It Shouldn’t. Environ. Plan. B 1999, 26, 169–191. [Google Scholar] [CrossRef]
  15. Porta, S.; Crucitti, P.; Latora, V. The Network Analysis of Urban Streets: A Primal Approach. Environ. Plan. B Plan. Des. 2006, 33, 705–725. [Google Scholar] [CrossRef] [Green Version]
  16. Karimi, K. Space syntax: Consolidation and transformation of an urban research field. J. Urban Des. 2017, 23, 1–4. [Google Scholar] [CrossRef] [Green Version]
  17. Hillier, B.; Hanson, J. The Social Logic of Space; Cambridge University Press: Cambridge, UK, 1984. [Google Scholar]
  18. Hillier, B.; Penn, A.; Hanson, J.; Grajewski, T.; Xu, J. Natural movement: Or, configuration and attraction in urban pedestrian movement. Environ. Plan. B Plan. Des. 1993, 20, 29–66. [Google Scholar] [CrossRef] [Green Version]
  19. Larkham, P.J. The study of urban form in Great Britain. Urban Morphol. 2006, 10, 117–141. [Google Scholar]
  20. Van Nes, A. Applied mathematics on urban space. In The Mathematics of Urban Morphology: Modeling and Simulation in Science, Engineering and Technology; D’Acci, L., Ed.; Springer: Berlin/Heidelberg, Germany, 2019; pp. 253–270. [Google Scholar] [CrossRef]
  21. Hillier, B. Space is the Machine; Cambridge University Press: Cambridge, UK, 1996. [Google Scholar]
  22. Batty, M. The Mathematics of Urban Morphology; D’Acci, L., Ed.; Springer International Publishing: Berlin/Heidelberg, Germany, 2019. [Google Scholar]
  23. Penn, A. Space Syntax and Spatial Cognition or Why the Axial Line? Environ. Behav. 2003, 35, 30–65. [Google Scholar] [CrossRef]
  24. Liu, X.; Jiang, B. Defining and generating axial lines from street center lines for better understanding of urban morphologies. Int. J. Geogr. Inf. Sci. 2012, 26, 1521–1532. [Google Scholar] [CrossRef]
  25. Turner, A.; Penn, A.; Hillier, B. An algorithmic definition of the axial map. Environ. Plan. B Plan. Des. 2005, 32, 425–444. [Google Scholar] [CrossRef]
  26. Ratti, C. Space syntax: Some inconsistencies. Environ. Plan. B Plan. Des. 2004, 31, 487–499. [Google Scholar] [CrossRef]
  27. Steadman, P. Guest Editorial, Development in Space Syntax. Environ. Plan. B Plan. Des. 2004, 31, 483–486. [Google Scholar] [CrossRef]
  28. Dalton, N. Fractional configurational analysis and a solution to the Manhattan problem. In Proceedings of the 3rd International Space Syntax Symposium, Atlanta, GA, USA, 7–11 May 2001; p. 26. [Google Scholar]
  29. Turner, A. Angular analysis. In Proceedings of the 3rd International Space Syntax Symposium, Georgia Institute of Technology, Atlanta, GA, USA, 1 January 2001. [Google Scholar]
  30. Turner, A. From Axial to Road-Centre Lines: A New Representation for Space Syntax and a New Model of Route Choice for Transport Network Analysis. Environ. Plan. B Plan. Des. 2007, 34, 539–555. [Google Scholar] [CrossRef] [Green Version]
  31. Xia, C.; Zhang, A.; Wang, H.; Yeh, A.G.O. Predicting the expansion of urban boundary using space syntax and multivariate regression model. Habitat Int. 2019, 86, 126–134. [Google Scholar] [CrossRef]
  32. Hillier, B.; Iida, S. Network effects and psychological effects: A theory of urban movement. In Proceedings of the 5th International Space Syntax Symposium, Delft, The Netherlands, 13–17 June 2005; pp. 553–564. [Google Scholar]
  33. Hillier, B. The art of place and the science of space. World Archit. 2005, 185, 96–102. [Google Scholar]
  34. Wu, L.W.; Chang, J.C.; Guo, S.J. Application of space syntax for resolving working space conflicts in building construction. In Proceedings of the 5th International Conference on Engineering Computational Technology, Gran Canaria, Spain, 12–15 September 2006. [Google Scholar] [CrossRef]
  35. Zhu, H.; Liu, J.; Liu, H.; Wang, X.; Ma, Y. Recreational business district boundary identifying and spatial structure influence in historic area development: A case study of Qianmen area, China. Habitat Int. 2017, 63, 11–20. [Google Scholar] [CrossRef]
  36. Blanchard, P.; Volchenkov, D. Urban Area Networks and Beyond; Understanding Complex Systems; Spinger: Berlin/Heidelberg, Germany, 2009; pp. 151–157. [Google Scholar] [CrossRef]
  37. Maliene, V.; Grigonis, V.; Palevicius, V.; Griffiths, S. Geographic information system: Old principles with new capabilities. Urban Des. Int. 2011, 16, 1–6. [Google Scholar] [CrossRef]
  38. Griffiths, S. GIS and research into historical “Spaces of Practice”: Overcoming the epistemological barriers. In History and GIS; Springer: Berlin/Heidelberg, Germany, 2012; pp. 153–171. [Google Scholar] [CrossRef]
  39. Vis, B.N. Cities Made of Boundaries: Mapping Social Life in Urban Form; UCL Press: London, UK, 2018. [Google Scholar]
  40. Gregory, I.; Ell, P.S. Historical Gis: Technologies, Methodologies, and Scholarship; Cambridge University Press: Cambridge, UK, 2012. [Google Scholar]
  41. Anderson, T.K. Kernel density estimation and k-means clustering to PROFILE road accident hotspots. Accid. Anal. Prev. 2009, 41, 359–364. [Google Scholar] [CrossRef]
  42. Gerber, M.S. Predicting crime using Twitter and kernel density estimation. Decis. Support Syst. 2014, 61, 115–125. [Google Scholar] [CrossRef]
  43. Yang, J.; Zhu, J.; Sun, Y.; Zhao, J. Delimitating urban commercial central districts by combining kernel density estimation and ROAD intersections: A case study in Nanjing city, China. ISPRS Int. J. Geo-Inf. 2019, 8, 93. [Google Scholar] [CrossRef] [Green Version]
  44. ArcMap. How Kernel Density Works-ArcMap. Documentation. (n.d.). Available online: https://desktop.arcgis.com/en/arcmap/latest/tools/spatial-analyst-toolbox/how-kernel-density-works.htm (accessed on 12 September 2021).
  45. Gao, Y.; Shahab, S.; Ahmadpoor, N. Morphology of urban villages in China: A case study OF Dayuan village in Guangzhou. Urban Sci. 2020, 4, 23. [Google Scholar] [CrossRef]
  46. Haggard, H.R. A Winter Pilgrimage; Tauchnitz: London, UK, 1902; p. 153. [Google Scholar]
  47. Önal, Ş.; Dağli, U.; Doratli, N. The urban problems of Gazimagusa (Famagusta) and proposals for the future. Cities 1999, 16, 333–351. [Google Scholar] [CrossRef]
  48. Christodoulou, N. The role of planning in the ethnonationality contested city: The case of Famagusta. Ph.D. Thesis, University of Nicosia, Nicosia, Cyprus, 2016. Unpublished. Available online: https://www.aljazeera.com/features/2016/9/12/how-a-ghost-town-embodies-the-cypriot-divide (accessed on 12 September 2021).
  49. Edbury, P.W. Medieval and Renaissance Famagusta: Studies in Architecture, Art, and History; Routledge: Oxfordshire, UK; Georgia Institute of Technology: Atlanta, GA, USA, 2017. [Google Scholar]
  50. Perbellini, G. Famagosta a Cipro—Famagusta in Cyprus; Biblion: Milan, Italy, 2011. [Google Scholar]
  51. Gunnis, R. Historic Cyprus: A Guide to Its Towns and Villages, Monasteries, and Castles; K. Rustem & Bro: Nicosia, Cyprus, 1973. [Google Scholar]
  52. Doratlı, N.; Hoskara, Ö.S.; Zafer, N.; Ozgurun, A. The walled city of Famagusta (Gazimagusa): An opportunity for planned transformation. In Proceedings of the ISUF International Conference—The Planned City, Trani, Italy, 3–6 July 2003. [Google Scholar]
  53. Luke, H. Cyprus: A Portrait and an Appreciation; Harrap: London, UK, 1965. [Google Scholar]
  54. Mason, R.; Tumer, E.U.; Ayșem, K.Ü.; Silman, R.; Severson, K.; Schmid, W. The Walled City of Famagusta: A Compendium of Preservation Studies, 2008–2012; World Monuments Fund: New York, NY, USA, 2014. [Google Scholar]
  55. Doratlı, N.; Önal, Ş.; Dağli, U. Revitalising the Walled City of Gazimagusa (Famagusta). Open House Int. 2001, 26, 42–59. [Google Scholar]
  56. Oktay, D. Cyprus: The South and the North. In Urban Issues and Urban Policies in the New EU Countries; van Kempen, R., Vermeulen, M., Baan, A., Eds.; Ashgate: Aldershut, UK, 2005. [Google Scholar]
  57. Hillier, B. Spatial sustainability in cities: Organic patterns and sustainable forms. In Proceedings of the 7th International Space Syntax Symposium, Stockholm, Sweden, 8–11 June 2009; Koch, D., Marcus, L., Steen, J., Eds.; Royal Institute of Technology (KTH): Stockholm, Sweden, 2009; pp. 1–20. [Google Scholar]
  58. Allahmoradi, M.; Cömert, N.Z. A new complementary model for integrating historico-geographical and configurational approaches: The case of Famagusta. Urban Morphol. 2021, 25, 111–136. [Google Scholar]
  59. Doratlı, N. A model for conservation and revitalization of historic urban quarters in Northern Cyprus. Ph.D. Thesis, Eastern Mediterranean University, Gazimağusa, Cyprus, 2000. Unpublished. [Google Scholar]
  60. Cömert, Z.N.; Özgece, N. Delimitation of Morphological Regions of Famagusta Old Town. In Proceedings of the Designing Urban Design: Towards a Holistic Perspective, Ankara, Turkey, 4–6 October 2016. [Google Scholar]
  61. Özgece, N.; Edgü, E. ‘Syntactic Comparison of Cyprus Port Cities: Famagusta and Limassol’. In Proceedings of the Ninth International Space Syntax Symposium, Seoul, Korea, 31 October–3 November 2013; Sejong University Press: Seoul, Korea, 2013; pp. 042:1–042:10. [Google Scholar]
  62. Campbell, S. Case Studies in Planning: Comparative Advantages and the Problem of Generalization; Working Paper; University of Michigan: Ann Arbor, MI, USA, 2003. [Google Scholar]
Figure 1. Illustrative street segment [30].
Ijgi 10 00638 g001
Figure 2. (Left): Location of Famagusta in Cyprus and Famagusta map, (right): main development zones of Famagusta [48].
Ijgi 10 00638 g002
Figure 3. Historical periods of urban growths of Famagusta (by authors).
Ijgi 10 00638 g003
Figure 4. Syntactical growth processes of Famagusta during the historical periods [58].
Ijgi 10 00638 g004
Figure 5. (a) angular local integration at a radius of 500 m; (b) angular local integration at a radius of 800 m; (c) angular global integration at a radius of 2000 m; (d) angular global integration at a radius of 6000 m.
Ijgi 10 00638 g005
Figure 6. (a) angular local choice at a radius of 500 m; (b) angular local choice at a radius of 800 m; (c) angular global choice at a radius of 2000 m; (d) angular global choice at a radius of 6000 m.
Ijgi 10 00638 g006
Figure 7. The development process of the Famagusta based on the physical barriers and directions.
Ijgi 10 00638 g007
Figure 8. The kernel density map for Famagusta street network applying ArcGIS default parameters (by authors).
Ijgi 10 00638 g008
Table 1. Two main morphological variables.
Calculation of the Integration and Choice Value
IntegrationChoice
Integration is a measure for the interrelations between space i and other spaces in the structure [21]. The depth value signifies the smallest number of steps linking one node to the others. Di is the total depth value and dij is the shortest trail between the ith and jth nodes, n is the number of nodes, and MDi is the mean depth value. The integration of a node is measured as the average depth of the node to all other nodes, similar to the measurement of relative asymmetry (RAi) [34]. The formula is as follows:Choice refers to the number of times a certain space emerges on the shortest path among two other spaces [35]. It measures the frequency at which a street segment is likely to be part of a specific path between all possible pairs of start and endpoints within a given radius [36]. Unlike integration, choice gives the degree to which a line lies on the simplest paths from one line to another line in the network. The mathematical formula to calculate choice is as follows:
ParametersDescriptionParametersDescription
Di D i = j = 1 n d i j
D i = Depth   Value
n = total   components
Cc (Pi)
Equation:
C C ( P i ) = ( K d i k ) 1
MDi M D i = j = 1 n d i j ( n 1 )
M D i = Mean   depth   value
dikdik refers to the length of a geodesic (shortest path) between nodes Pi and Pk
RAi
RAAi
R A i = 2 ( M D i 1 ) ( n 2 ) ,   R R A i = R A i D
RA = relative asymmetry
RRA = real relative asymmetry
CB(Pi)
Equation:
C B ( P i ) = j K g i k ( P i ) / g i k ( j < k )
Rn D = 2 ( n ( log 2 ( ( n + 2 ) 3 ) 1 + 1 ( n 1 ) ( n 2 )
Rn = 1/RRA
gjk(pi)gjk(pi) is the number of geodesics between nodes pj and pk that contain node pi, and gjk is the number of all geodesics between pj and pk [29]
Table 2. Formulas and illustration for calculating kernel density [44].
Predicting the Density for Points and Lines
The Predicted Density at a New (x, y) Location Is Determined by the Following Formula:
  D e n s i t y = 1 ( r a d i u s ) 2 i = 1 n [ 3 π ·   p o p i   ( 1 ( d i s t i r a d i u s ) 2 ) 2 ]
For   d i s t i < r a d i u s
i = 1…, n are the input points. Only include points in the sum if they are within the radius distance of the (x, y) location.
popi is the population field value of point i, which is an optional parameter.
disti is the distance between point i and the (x, y) location.
The line density tool calculates the density of linear features in the area of each output raster cell. Density is calculated in units of length per unit of area. A raster cell is displayed with its circular area. Lines L1 and L2 represent the length of the portion of each line. The consistent density values are V1 and V2.
Thus:
Density = ((L1 * V1) + (L2 * V2))/(area of circle)
Ijgi 10 00638 i001
Ijgi 10 00638 i002
The circular neighborhood and a raster cell are used to define the length of the line density.
Publisher’s Note: MDPI stays neutral with regard to jurisdictional claims in published maps and institutional affiliations.

