Abstract
An airline alliance is a group of member airlines that seek to achieve the same goals through routes and airports. Hence, airports’ connectivity plays an essential role in understanding the linkage between different markets, especially the impact of neighboring airports on focal airports. An airline alliance airport network (AAAN) comprises airports as nodes and routes as edges. It could reflect a clear collaborative proportion within AAAN and competitive routes between AAANs. Recent studies adopted an airport- or route-centric perspective to evaluate the relationship between airline alliances and their member airlines; meanwhile, they mentioned that an airport community could provide valuable air transportation information because it considers the entire network structure, including the impacts of the direct and indirect routes. The objectives are to identify spatial patterns of market region in an airline alliance and characterize the differences among airline alliances (Oneworld, Star Alliance, and SkyTeam), including regions of collaboration, competition, and dominance. Our results show that Star Alliance has the highest collaboration and international market dominance among three airline alliances. The most competitive regions are Asia-Pacific, West Asia, Europe, and North and Central America. The network approach we proposed identifies market characteristics, highlights the region of market advantages in the airline alliance, and also provides more insights for airline and airline alliances to extend their market share or service areas.
1. Introduction
In the highly competitive commercial air transportation market, airline alliances are groups that contain several member airlines seeking to achieve the same goals [1,2]. As a member of such an alliance, airlines can expand their networks and increase the frequency of their flights by collaborating with other member airlines; additionally, they can reduce the cost of their facilities, expansion, and marketing [3,4,5]. Airline alliances want to expand their market region and raise their market share; therefore, all member airlines within an airline alliance are from different countries (except for one particular case in the SkyTeam alliance). As mentioned above, airline alliance airport networks (AAANs), that is, global-scale airport networks that are connected by member airline flights, are sizeable commercial unions; there are currently three large airline alliances (Oneworld, Star Alliance, and SkyTeam) in the world.
Market-related airline alliance studies have mainly focused on the traffic impact of member airlines [6], the advantages of code-sharing [7,8], the collaborative relationships within airline alliances, and the competitive relationships among airline alliances [9,10]; however, the studies have neglected to investigate the connectivity of airports within an airline alliance. Connectivity in the aviation market plays an essential role in linking one airport to another within a market.
In airport network studies, the focus is on the network properties of regional and worldwide airport networks; geographic, economic, and political approaches have been used to explain the patterns in these airport networks, including worldwide networks [11], Chinese airport networks [12,13], Brazilian airport networks [14], and economy-wide networks (e.g., European airport networks) [15]. However, collaborative and competitive routes have not been evaluated through network analysis. Network analysis considers the connectivity of airports and the market contributions of neighboring airports that will influence the regional market. Furthermore, Rocha [16] mentioned that the airport community is a set of airports with high connections to each other, and could provide valuable information about the air transportation market because it considers the entire network structure, including the impacts of the direct and indirect routes. Therefore, the airline alliance airport networks have an important characteristic, all member airlines within an airline alliance have relatively consistent commercial targets, and the market characteristics (collaborative and competitive) are comprised of flights and destinations in the specific regions; therefore, using a network approach could enhance understanding of the market layout.
The objective of this study is to utilize the concept of airport community to understand the spatial patterns of the market region in an airline alliance and characterize the differences between airline alliances (Oneworld, Star Alliance, and SkyTeam), including regions of collaboration, competition, and dominance. It could improve the understanding of the spatial characteristics of the market regions of the three airline alliances.
2. Data
Flight schedule data were gathered from the Innovata 2017 flight database [17], which covers approximately 99% of available flight schedule data. The airport database used was OpenFlights.org for the location information of each airport, including IATA code, airport name, city, country, longitude, and latitude. For each airline alliance, we extracted all destination airports as nodes and routes as edges to form the alliance’s AAAN. The number of flights in 2017 for each route is the weight of each edge in the AAAN; in other words, the weight of each route is not equal. A route with a higher number of flights has a higher weight of the edge. Overall, there are 1830 destinations and 10,825 routes among the three airline alliances.
3. Methods
The methods consist of three parts: first, we identify the airport community as high-density market regions with the Infomap algorithm and highlight important airports by their PageRank values; second, all airport communities are classified into domestic and international airport communities according to the proportion of airport nationalities within an airport community; finally, we evaluate three major metrics to measure the collaborative proportion within an airline alliance, dominant routes between airline alliances, and competitive routes among airline alliances.
3.1. Identifying Market Regions in Each Airline Alliance
We adopt the Infomap algorithm, which is recognized as a widely used community detection method [18,19], to delineate airport communities characterized by high interactions between airports and flights. Infomap utilizes a random walk to calculate the frequency of flights between one airport and another within an airport network and gathers neighboring airports with a high frequency of flights connecting them into an airport community [20]. Then, the algorithm merges airport communities based on the number of flights connecting them to other airport communities. The concept of Infomap is to minimize the entropy of overall possible airport communities L(M) as Equation (1).
where is the frequency-weighted average entropy of across-airport communities, and is the frequency-weighted average entropy within an airport community i. The is the probability of exiting (and entering) airport community i, and is the probability of visiting the airports within the airport community. The entropy is measured by a random variable X with the frequencies pi in the n states .
Therefore, the optimization of Infomap is to minimize the probability of an airport connecting to another airport in the other airport community so that the airports within an airport community could have high connections with each other. The Infomap algorithm is used to partition the directed and weighted complex network into several hierarchical communities that have higher within-community interactions than cross-community interactions. We select the layer containing the number of airport communities closest to the number of member airlines to characterize market regions within an airline alliance.
PageRank represents the probability of landing at a particular airport when starting from any airport in the AAAN [21]. Therefore, a higher PageRank value represents a higher probability of arriving at that specific airport; in other words, the PageRank value of an airport could reflect the hub characteristic because an airport has a large number of flights from different origins.
3.2. Categorizing the Type of Market Regions
The airport communities of each AAAN are categorized as one of two types of market regions, domestic or international, based on the nationality proportion of the airports within the airport community. We use the number of countries within an airport community to distinguish between domestic and international airport communities. If 50% of the airports within an airport community are in the same country, we regard this as a domestic airport community; otherwise, it is an international airport community. Additionally, all member countries in the European Union (EU) are regarded as comprising a single region because they have more economic, political, and trade relationships with each other than with other countries outside the EU.
3.3. Characterizing Airline Alliances
Three types of market characteristics in airline alliance markets were identified through the airport community concept: collaborative proportion within each airline alliance, dominant routes between each airline alliance, and competitive routes among airline alliances.
3.3.1. Collaborative Proportions
An international airport community demonstrates the strength of connection between member airlines, so it could indicate and highlight the frequent connections to present the collaboration between member airlines. The frequent connections could offer multiple choices for passengers in flexible travel planning to increase the revenue of member airlines [22]. On the other side, member airlines could share the ground staff, ground facilities, and maintenance service to decrease operation costs [3,23]. Hence, the size of an international airport community could be regarded as representing a collaborative proportion in an AAAN. The level of collaboration is determined by calculating the proportion of the number of airports in all international airport communities to the total number of airports through which the airline alliance operates, which quantitatively illustrates the extent of collaboration between two airlines within the alliance as Equation (2).
where is the number of airports in all international airport communities of airline alliance and is the number of airports in airline alliance .
The collaborative proportion reflects the amount of collaboration within an airline alliance. We also use the network density of each airport community to represent the collaborative density between member airlines, which can indicate the connectivity between destinations within an international airport community. A high connectivity density indicates that most airports are connected to each other (maximum value is one). In other words, this metric could show the connectivity of international routes, and better connectivity raises the convenience in cross-country traveling. Also, it improves the passenger capacity and competitiveness in this region [22].
3.3.2. Dominant and Competitive Routes
We quantify the level of competition between airline alliances based on the overlapping distribution of flight routes and define it through two more market characterizations: dominant and competitive routes. In general, the dominant and competitive routes are defined by the number of airlines in a specific route. The greater and smaller number of airlines indicate a competitive and dominant route, respectively [24,25]. Along with this concept, we implement the overlapping routes of airport communities between airline alliances to identify these two market characteristics. A dominant route (DR) is defined as Equation (3),
Here, i and j are the departure and arrival airports with the route , while and are the airport communities of the airline alliance m to which the airports i and j belong. Within an airline alliance, a dominant route arises when any two connected airports with a route belong to the same airport community. True with the three airline alliances, a route connecting two airports of one airport community is called a competitive route (CR). It is defined as Equation (4),
4. Results
4.1. Market Regions of the Three Airline Alliances
In Table 1, the flight statistics of the three airline alliances are summarized. Code-share flights are excluded because double-counting would lead to an incorrect number of flights. The data shows that Star Alliance has the widest market layout, the largest market share, and the highest number of member airlines, destinations, routes, and flights among the three airline alliances. Overall, these three airline alliances have a 57% market share of the entire aviation market.

Table 1.
Overview of three main airline alliances in 2017 *.
As shown in Figure 1, Oneworld, Star Alliance, and SkyTeam have similar major market regions: Asian, European, and American. However, the share of these three AAANs in each major market is different. Star Alliance operates the most extensive market among the three. SkyTeam focuses on the market in Asia and Europe (overall proportion: 80%) rather than the Pacific area. Oneworld has a relatively average distribution across the three major markets but does not operate in the African area.
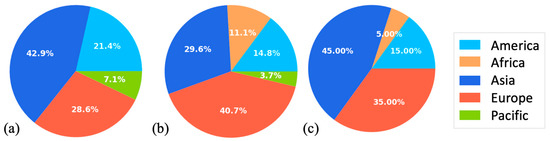
Figure 1.
Regional market share of carriers in each AAAN ((a): Oneworld; (b): Star Alliance; (c): SkyTeam).
4.2. Airport Communities in the Three Airline Alliances
In Table 2, we select the first layer of Oneworld, the second layer of Star Alliance, and the second layer of SkyTeam to represent the market layout based on the number of airport communities in each layer.
Table 2.
The number of airport communities in each airline alliance.
Our result shows that the number of airport communities in the Oneworld network is similar to the number of member airlines; however, the numbers of airport communities in the Star Alliance and SkyTeam networks are much lower than the number of member airlines each alliance has. This phenomenon indicates that the operation regions of the member airlines within an airline alliance have considerable overlap; therefore, the connectivity and interaction between airports is enlarged and enhanced. In contrast, the operation region of each member airline of the Oneworld alliance has less overlap, which means that the connectivity between different member airlines is relatively lower than that within each member airline.
4.3. The Market Layout of an Airline Alliance
Oneworld is mainly concentrated in the American and European markets (Figure 2a) because the airport node size and flight concentration of these two regions are much larger than those of the other regions. Notably, Oneworld is focused on a few Asian regions, and these market regions, such as Japan, Hong Kong, Malaysia, Sri Lanka, West Asia, and Australia, are relatively geographically distant from each other. In contrast to Oneworld, both Star Alliance and SkyTeam are focused not only on the Asian market but also on the American and European markets (Figure 2b,c). Overall, the market layout of Star Alliance and SkyTeam in terms of spatial distribution is more homogenous than that of Oneworld.


Figure 2.
Spatial distribution of the airport communities in each airline alliance: (a) Oneworld, (b) Star Alliance, and (c) SkyTeam. The node colors represent airport communities; the node sizes are PageRank values, which refer to the importance of airports in terms of their landing probability; the circle and square node style demonstrate the domestic and international airport community, respectively. The lines represent routes.
In the Asia-Pacific market, Star Alliance and SkyTeam have larger airport nodes, higher flight concentrations, and more airport communities than Oneworld. The largest airport communities in both of these airline alliances are comprised of Chinese airports. Remarkably, the Chinese airports within SkyTeam’s airport community have relatively higher importance than those in Star Alliance’s airport community because SkyTeam has two Chinese airlines (China Southern Airlines and China Eastern Airlines).
Oneworld and SkyTeam both have only one airport community in North America; however, Star Alliance has three airport communities there: two of them are mainly composed of airports in Canada, and the last comprises mainly airports in the United States. In terms of the member airline composition of these alliances, Oneworld and SkyTeam each have only one North American airline (Oneworld: American Airlines; SkyTeam: Delta Airlines), but there are two North American airlines in Star Alliance (Air Canada and United Airlines). United States air transportation is characterized by a high traffic volume and a well-developed airport network, both of which enhance the country’s internal connectivity; furthermore, North American airlines are uniformly distributed among the three airline alliances. Hence, the political boundaries of the United States could be considered to demarcate one airport community.
In Latin America, Oneworld has the largest number of airport communities and covers most of the South American countries; Star Alliance only has two airport communities but still covers most of the major airports in Latin American countries. The LATAM Airlines Group, the largest airline group in Latin America, is part of Oneworld, which is the main operator in South American countries (e.g., Brazil, Chile, Peru, and Paraguay); Star Alliance has the second-largest airline in Latin America, Avianca, which serves most of the Central American market (e.g., Colombia, Costa Rica, Ecuador, El Salvador, and Guatemala).
4.4. Domestic and International Airport Communities
As shown in Figure 2, which depicts the spatial distribution of domestic airport communities for each AAAN, we find that each continent has numerous domestic airport communities, and slight differences occur when an airline alliance has a member airline located a long distance away from the primary market; for example, Oneworld has PJSC Siberia Airlines (Russia), Qantas (Australia), Malaysia Airlines (Malaysia), and the LATAM Airlines Group (South America); Star Alliance has Air India (India); SkyTeam has Garuda Indonesia Airlines (Indonesia) and Aerolineas Argentinas (Argentina).
Overall, the common characteristic among the domestic airport communities of these three AAANs is that they are located in geographically large countries (e.g., United States, Russia, and China), isolated regions (geographically far from other airport communities in the AAAN, e.g., Australia, New Zealand, and Indonesia), or have a well-developed and robust domestic airport network within their respective countries (e.g., Japan and Vietnam).
There are significantly fewer international airport communities (the average is four) than domestic airport communities (the average is 12.67) because domestic connections are the primary factor constituting an airport community. International airport communities show relatively high connectivity between countries, and these communities’ airports are usually the major airports in each country, which could be regarded as gateways to the important airports of other countries.
The Star Alliance airport community in Central America is worth mentioning here. As we noted before, the airport communities of Oneworld and SkyTeam in Latin America are domestic airport communities, but interestingly, the airport community of Star Alliance is an international community. One of Star Alliance’s Latin American member airlines is Avianca, which primarily serves destinations in Central and South America (for example, Colombia, Costa Rica, Ecuador, El Salvador, and Guatemala). The geographic size of countries in Central America is relatively small, so these countries have a limited number of airports; as a result, most of the connections inside this airport community are international, which is why the airport community of Star Alliance in Central America is an international community.
4.5. Quantifying Collaborative Proportions
In Table 3, the international airport communities with a low network density (<0.1) mainly appear in countries that do not have enough airports within the country (e.g., some countries in West Asia and Africa); as a result, the number of international connections is much higher than the number of domestic connections. The international airport communities with high network density (>0.1) are characterized by high connectivity across different countries (e.g., Asia-Pacific and America); for instance, most of the major airports in the Asia-Pacific area (Oneworld: the 3rd airport community; Star Alliance: the 16th airport community; SkyTeam: the 14th airport community) are strongly connected because the number of flights and network density there are relatively higher. Table 4 shows that Star Alliance has the highest level of collaboration among the three airline alliances.
Table 3.
Network density of international airport communities.
Table 4.
Collaborative proportions of the three airline alliances.
4.6. Dominant Routes on Routes among Airline Alliances
A dominant market position is indicated by the fact that only one airline alliance considers the departure and arrival airports with a route to be in the same market. According to Table 5, Star Alliance is the most dominant airline alliance out of all three alliances. First, the destination countries of Star Alliance are widely distributed throughout the world (=114), and the alliance has market dominance on the highest number of routes (=1109) among the three airline alliances; second, Star Alliance has more international impact caused by the relatively high proportion of international routes on which it has an international market position (=30.21%); nevertheless, it has market dominance on higher numbers of both domestic and international routes than SkyTeam and Oneworld.
Table 5.
Descriptive statistics on the market dominance of each airline alliance.
Figure 3 shows the spatial distribution of market dominance for each airline alliance. Oneworld primarily serves the region from India to Europe and connects the United States and Central America. Star Alliance shows a strong presence in the European, North American, Latin American, and Chinese markets. SkyTeam focuses on the Chinese, European, and North American markets and the inter-continental region (from North America to Europe and from Europe to Africa).
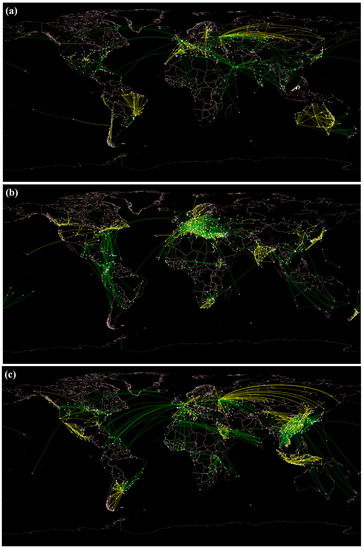
Figure 3.
Spatial distribution of market dominance of each airline alliance ((a) Oneworld; (b) Star Alliance; (c) SkyTeam). The nodes illustrate the airport locations. The yellow and green lines represent the domestic and international routes, respectively.
4.7. Competitive Routes among Airline Alliances
A competitive market is one in which the departure and arrival airports are both within one market region in each of the airline alliances. The results show that competitive markets are distributed across 83 countries with 3111 routes, where the number of domestic routes and international routes is 2675 (85.99%) and 436 (14.01%), respectively.
As shown in Figure 4, the spatial distribution of competitive domestic markets is across three major regions: North America, Europe, and Asia-Pacific. While the international competitive markets are across four regions: North/Central America, Europe, West Asia, and Asia-Pacific. Remarkably, the United States has the largest number of domestic competitive routes (=2288, 85.53% of the dominant competitive routes).
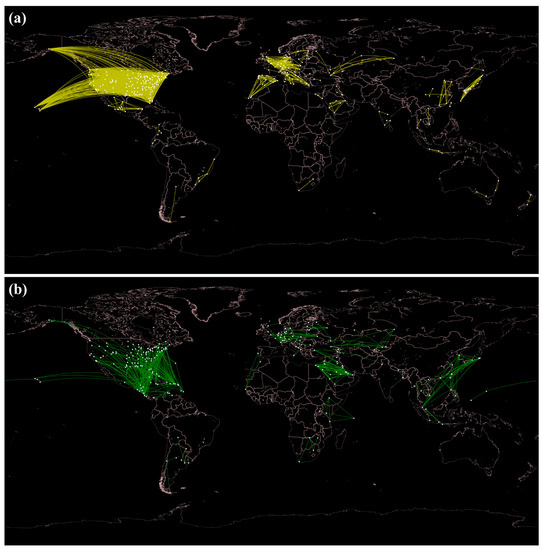
Figure 4.
Spatial distribution of competitive markets across the entire airline alliance market: (a) domestic and (b) international competitive markets. The nodes illustrate the airport locations. The yellow and green lines represent the domestic and international routes, respectively.
5. Discussion
This study uses the airport community concept to reveal the market regions of each airline alliance; besides, it classifies all airport communities into two types: domestic or international airport communities. International airport communities are quantitatively characterized by collaborative proportions between the member airlines of each airline alliance, and the collaboration regions of each airline alliance are illustrated. We further utilize the overlapping routes of airport communities between airline alliances to identify the regions in which each airline alliance has market dominance and the most competitive regions among the three airline alliances. We find that Star Alliance has the highest level of collaboration and the international market dominance among the three airline alliances. The most competitive regions are Asia-Pacific, West Asia, Europe, and North/Central America. Remarkably, the three market characteristics that we propose to characterize market regions are similar to those emerging from the results of market investigations and previous studies. The following discussion covers the significance of the airport community, the characteristics of domestic and international airport communities, the collaborative proportions between member airlines within an airline alliance, the regional market dominance of each airline alliance, the competitive routes among airline alliances, the possible implications of this work for airline alliance strategies, and the limitations of the study and, finally, offers a summary.
The airport community concept plays an important role in identifying the regions of collaboration of each airline alliance, the regions of market dominance of each airline alliance, and the most competitive regions among the three airline alliances. Previous studies have usually adopted the airport or route perspective to evaluate how airline alliances affect passenger volume, air fares, traffic factors, or market shares. However, those studies have neglected the neighboring airports of the focal airports and routes, and this might bias the results or evaluation because the market contributions of neighboring airports will influence the regional market. Burghouwt and Veldhuis [25] use the connectivity concept to measure the dominant hubs and market share of each airline alliance in the transatlantic market. Pitfield [27] reports that airline alliances have different impacts on the traffic and market shares of six specific European–US routes. As shown in Figure 2 and Table 3, Table 4 and Table 5, our results show that both US and European regions have several airport communities; in other words, the airports in these regions have different market characteristics due to the impact of neighboring airports. Hence, comparing airports from different airport communities may yield inconsistent insights on market characteristics. We further apply the airport community concept to assess three important market characteristics (collaborative, dominant, and competitive metrics) based on the connectivity between airports and demonstrate the market structure of each airline alliance. As a result, the identified airport communities of each airline alliance could be regarded as constitutive of geographic and behavioral segmentation because both spatial distribution patterns and high-concentration airport networks are compressed into our concept.
We find that domestic airport communities are the most common community type among the three airline alliances. Countries that have a vast territory, high domestic demand, or strict aviation regulations [15,28] tend to form domestic airport communities [27]. People who live in a geographically large country need to take domestic flights to travel long distances within the country. This may be the reason that such large countries usually have high-density domestic airports that are highly connected to each other with high passenger flows [29]; this phenomenon is similar to that revealed in a previous study that uses the domestic airport network concept [30]. Hence, the domestic airport community construct is suitable for characterizing large countries with high domestic demand within an AAAN.
Compared to the number of domestic airport communities, we find that the number of international airport communities among the three airline alliances is lower because the domestic connections are much more than international connections within an airline alliance [31]. Besides, the countries have small domestic markets or strong trade or tourism connections with surrounding countries (e.g., low population, lack of domestic airports, or a small territory) [32]. Our results show that all three airline alliances have an international airport community in the Asia-Pacific region, which is the most competitive region according to an annual report from OAG [24]. Therefore, the size of international airport communities can be regarded as arising from collaborative proportions between member airlines. In such regions of an international airport community, a member airline may want to increase the flight frequency on a certain route through increasing flight frequency to encourage passengers to buy tickets because the airline in question is more convenient or offers more options and flexibility for passengers in planning their trips. In addition, passengers can travel much more easily to inland areas of other countries via domestic flights on another member airline. Countries that include international airport communities have high connectivity with other countries. As a result, the international airport community construct is appropriate for highlighting such collaboration between regions.
The number of flights, member airlines, and destinations are crucial factors that affect the emergence of international airline collaborations. Such collaborations attempt to enhance the regional impact of the airlines involved by increasing the number of flights in the region; more specifically, the airlines can adopt code-share flights to win customers on both sides of the collaboration [33]. We find that Star Alliance has the highest level of collaboration among its member airlines, followed by Oneworld and SkyTeam [34,35]. This result is consistent with that of Zou and Chen [36], who show that Star Alliance has the largest number of flights and the highest percentage of code-sharing member airlines of the three airline alliances. Star Alliance has the largest number of member airlines and flights and the widest variety of routes; therefore, the member airlines have a higher probability of collaborating with each other. Additionally, the member airlines of Star Alliance come from different continents. By mapping the spatial distribution of the international airport community, we further show that the three airline alliances have a common international airport community in the Asia-Pacific area, which indicates that this region is an important region of collaboration because of its high competitiveness. As a result, the international airport community is suitable for identifying collaboration within each airline alliance.
Each airline alliance has its own market region [37]. Each alliance’s composition of member airlines by country is different, and the domestic flights of each member airline within an airline alliance are different from the domestic flights of the other two airline alliances. For example, all airline alliances have a member airline from the United States; however, each airline has its own hubs and the number of flights on specific routes, which is why each airline alliance’s member airline from the United States has a different spatial distribution of the market region in our results. Moreover, each member airline within an airline alliance has different partner airlines in the surrounding countries and connections of different strengths with its partner airlines; this affects the formulation of each market region. In addition to serving different destinations, the alliances also have a different number of flights on each route so that they each have relative market dominance in different regions [38]. Our result shows that each airline alliance has its dominant regions; for instance, Star Alliance has a relatively high market impact on Central America, which is similar to the market statistics from CAPA [39]. Moreover, we find that Star Alliance has market dominance for a higher number of routes than the other two airline alliances; in other words, Star Alliance has a higher market share than the others, which is consistent with a market report from IATA [26]. The proposed dominant market characteristic using the airport community construct is suitable for evaluating dominant routes between airline alliances and for demonstrating the spatial distribution of the dominant market of each airline alliance.
According to our results, international competitive routes among airline alliances highlight the important market areas, which are distributed in the North American, Asia-Pacific, West Asian, European, and Central American regions, as well as some regions in Africa. Interestingly, the network structure of competitive regions resembles a complete network; therefore, these regions have a high concentration flow between them. Previous studies have focused on the European and North American markets [40,41]; however, recent aviation reports indicate that Africa (5.1%), West Asia (4.8%), Asia-Pacific (4.7%), Latin America (3.8%), North America (2.8%), and Europe (2.5%) are major potential market regions with high annual growth rates in passenger volume [42,43]. The top ten most competitive international routes have been found to be located in the Asia-Pacific region [24], consistent with our results. The domestic market of the United States is highly competitive, which is similar to the IATA report [26]. The methods proposed based on the airport community concept are workable for identifying the most competitive regions among the three airline alliances.
The presence of a domestic airport community indicates that most of the passengers traveling through those airports are from the same region or country. This indicates that flights between these airports are more frequent than flights between other airports. From a market perspective, all member airlines that operate flights within such an airport community need to adapt to the culture and language of the region (e.g., local customer preferences) to attract customers [44,45]. International airport communities are areas of high connectivity, which indicates that most of the passengers traveling through these airports take advantage of the airports to connect to other countries, but the number of connections (usually international) within the airport community is much higher than the number of domestic connections. Hence, member airlines could design some cross-country marketing strategies (e.g., advertisements featuring imagery from the different countries or cities in the airport community) and provide in-flight cross-country services (e.g., arrangements for cabin crew to provide multilingual services and translations) based on the included countries [46].
This study has some limitations. First, we use the number of flights to estimate the concentration flow of a route due to the lack of actual passenger data; thus, a large number of flights with low passengers might overestimate the importance of a specific airport. Second, there is no flight status of each flight in our dataset, so that the interaction between airport communities or within an airport community might be slightly different due to flight cancellation (e.g., wars, mechanical problems, or other reasons). Third, the market of airports with a high proportion of connecting flights might be overestimated because the connecting flights cannot be differentiated in our dataset. Fourth, some international airport communities (e.g., the international airport community of Star Alliance in Central/ South America) present an airport community of a single member airline. These member airlines could gather passengers from different countries to other regions; thus, they play a complementarity role among member airlines.
6. Conclusions
We have differentiated the market layout of three airline alliances and classified all their airport communities into two types: domestic and international. A domestic airport community usually appears in those countries that have a vast territory, high domestic demand, or strict aviation regulations. On the other side, an international airport community appears in those countries that have small domestic markets or strong trade or tourism connections with surrounding countries. Moreover, we have evaluated three types of market regions (collaborative, dominant, and competitive) within the airline alliance market based on the airport community concept. The ranking and spatial distribution of the collaborative proportion and dominant routes of each airline alliance as well as the competitive routes among all airline alliances, are determined and highlighted. Star Alliance has the highest level of collaboration among its member airlines and market dominance for a higher number of routes than the other two airline alliances. The spatial distribution of dominant routes in each airline alliance shows that each airline alliance has its own market region. Remarkably, the most competitive domestic routes concentrate on the United States, while the international routes are distributed in the North American, Asia-Pacific, West Asian, European, and Central American regions. The concept of the airport community is not only used for identifying the collaborative, dominant, and competitive regions of the three airline alliances. Furthermore, the international airport community could highlight potential service and marketing opportunities because it represents frequent international routes. Our findings might prove useful for airline market operators (in terms of planning new routes, adjusting the frequency of flights on a route, or engaging in public relations campaign activities) and airline alliances (in terms of decision-making about adding new partner airlines or adjusting development goals for the organization) to extend their market share or service area through an alternative approach.
Author Contributions
Conceptualization, Chun-Hsiang Chan, Tzai-Hung Wen, Jiun-Huei Proty Wu, and Tzu-How Chu; Methodology, Chun-Hsiang Chan; Software, Chun-Hsiang Chan; Validation, Chun-Hsiang Chan, Tzai-Hung Wen, Jiun-Huei Proty Wu, and Tzu-How Chu; Formal Analysis, Chun-Hsiang Chan; Investigation, Chun-Hsiang Chan; Resources, Chun-Hsiang Chan and Tzai-Hung Wen; Data Curation, Chun-Hsiang Chan and Tzai-Hung Wen; Writing—Original Draft Preparation, Chun-Hsiang Chan; Writing—Review and Editing, Tzai-Hung Wen, Jiun-Huei Proty Wu, and Tzu-How Chu; Visualization, Chun-Hsiang Chan; Supervision, Tzai-Hung Wen, Jiun-Huei Proty Wu, and Tzu-How Chu; Project Administration, Tzai-Hung Wen, Jiun-Huei Proty Wu, and Tzu-How Chu; Funding Acquisition, Chun-Hsiang Chan and Tzai-Hung Wen. All authors have read and agreed to the published version of the manuscript.
Funding
This study was funded by the Ministry of Science and Technology (MOST) of Taiwan (MOST 108-2420-H-002 -025 –DR and MOST 108-2638-H-002-002-MY2) and the National Health Research Institutes (NHRI) of Taiwan (NHRI-110A1-MRCO-01212102). The authors also acknowledge the financial support provided by the Infectious Diseases Research and Education Center, the Ministry of Health and Welfare (MOHW) and National Taiwan University (NTU). The funders had no role in the study design, data collection and analysis, or manuscript preparation.
Data Availability Statement
The data presented in this study are available on request from the corresponding author.
Acknowledgments
Thanks for four anonymous reviewers and all the editors who contributed to their comments and suggestions to improve the quality of the manuscript.
Conflicts of Interest
The authors declare no conflict of interest.
References
- Kuzminykh, N.; Zufan, P. Airline alliances and their influence on firm performance. Procedia Econ. Financ. 2014, 12, 329–333. [Google Scholar] [CrossRef][Green Version]
- Abhimanyu, B.; Fariba, A. Factors affecting the operational success of strategic airline alliances. Transportation 1998, 25, 331–355. [Google Scholar]
- Oum, T.H.; Park, J.-H. Airline alliances: Current status, policy issues, and future directions. J. Air Transp. Manag. 1997, 3, 133–144. [Google Scholar] [CrossRef]
- Oum, T.H.; Park, J.H.; Zhang, A. Globalization and Strategic Alliances: The Case of the Airline Industry; Pergamon Press: New York, NY, USA, 2000. [Google Scholar]
- Dresner, M.E.; Windle, R.J. Alliances and code-sharing in the international airline industry. Built Environ. (1978) 1996, 22, 201–211. [Google Scholar]
- Park, J.-H.; Zhang, A. Airline alliances and partner firms’ outputs. Transport. Res. E Log. 1998, 34, 245–255. [Google Scholar] [CrossRef]
- Brueckner, J.K. International Airfares in the Age of Alliances: The effects of codesharing and antitrust immunity. Rev. Econ. Stat. 2003, 85, 105–118. [Google Scholar] [CrossRef]
- Brueckner, J.K.; Lee, D.N.; Singer, E.S. Alliances, codesharing, antitrust immunity, and international airfares: Do previous patterns persist? J. Compet. Law Econ. 2011, 7, 573–602. [Google Scholar] [CrossRef]
- Bilotkach, V. Airline partnerships, antitrust immunity, and joint ventures: What we know and what I think we would like to know. Rev. Ind. Organ. 2019, 54, 37–60. [Google Scholar] [CrossRef]
- Fageda, X.; Flores-Fillol, R.; Theilen, B. Hybrid cooperation agreements in networks: The case of the airline industry. Int. J. Ind. Organ. 2019, 62, 194–227. [Google Scholar] [CrossRef]
- Guimerà, R.; Mossa, S.; Turtschi, A.; Amaral, L.A.N. The worldwide air transportation network: Anomalous centrality, community structure, and cities’ global roles. Proc. Nat. Acad. Sci. USA 2005, 102, 7794. [Google Scholar] [CrossRef]
- Du, W.-B.; Zhou, X.-L.; Lordan, O.; Wang, Z.; Zhao, C.; Zhu, Y.-B. Analysis of the Chinese airline network as multi-layer networks. Transport. Res. E-Log. 2016, 89, 108–116. [Google Scholar] [CrossRef]
- Zhang, J.; Cao, X.-B.; Du, W.-B.; Cai, K.-Q. Evolution of Chinese airport network. Phys. A Stat. Mech. Appl. 2010, 389, 3922–3931. [Google Scholar] [CrossRef] [PubMed]
- Da Rocha, L.E.C. Structural evolution of the Brazilian airport network. J. Stat. Mech. Theory Exp. 2009, 4, P04020. [Google Scholar] [CrossRef]
- Lordan, O.; Sallan, J.M. Analyzing the multilevel structure of the European airport network. Chin. J. Aeronaut. 2017, 30, 554–560. [Google Scholar] [CrossRef]
- Rocha, L.E.C. Dynamics of air transport networks: A review from a complex systems perspective. Chin. J. Aeronaut. 2017, 30, 469–478. [Google Scholar] [CrossRef]
- Cirium Official Website. Available online: https://www.cirium.com/who-we-are/market-share-and-schedules-data/ (accessed on 14 January 2021).
- Aldecoa, R.; Marín, I. Exploring the limits of community detection strategies in complex networks. Sci. Rep. 2013, 3, 2216. [Google Scholar] [CrossRef]
- Lancichinetti, A.; Fortunato, S. Community detection algorithms: A comparative analysis. Phys. Rev. E 2009, 80, 056117. [Google Scholar] [CrossRef]
- Rosvall, M.; Axelsson, D.; Bergstrom, C.T. The map equation. Eur. Phys. J. Spec. Top. 2010, 178, 13–23. [Google Scholar] [CrossRef]
- Brin, S.; Page, L. The Anatomy of a Large-Scale Hypertextual Web Search Engine. Comput. Netw. 1998, 30, 107–117. [Google Scholar] [CrossRef]
- Iatrou, K.; Alamdari, F. The empirical analysis of the impact of alliances on airline operations. J. Air Transp. Manag. 2005, 11, 127–134. [Google Scholar] [CrossRef]
- Youssef, W.; Hansen, M. Consequences of strategic alliances between international airlines: The case of Swissair and SAS. Transp. Res. Part A Policy Pract. 1994, 28, 415–431. [Google Scholar] [CrossRef]
- OAG. Busiest Routes 2020; Official Aviation Guide of the Airways: Luton, UK, 2020. [Google Scholar]
- Burghouwt, G.; Veldhuis, J. The competitive position of hub airports in the transatlantic market. J. Air Transp. Manag. 2006, 11, 106–130. [Google Scholar]
- IATA. Traveler Numbers Reach New Heights; International Air Transport Association: Montreal, QC, Canada, 2018. [Google Scholar]
- Pitfield, D.E. The impact on traffic, market shares and concentration of airline alliances on selected European—US routes. J. Air Transp. Manag. 2007, 13, 192–202. [Google Scholar] [CrossRef][Green Version]
- Ovcharov, A.O.; Vasiljeva, M.V.; Shirin, S.S. The russian tourist industry: Structure, trends, competitiveness at the world market. Rev. Eur. Stud. 2015, 7, 151–161. [Google Scholar] [CrossRef]
- Wandelt, S.; Sun, X.; Zhang, J. Evolution of domestic airport networks: A review and comparative analysis. Transp. B 2017, 1–17. [Google Scholar] [CrossRef]
- Oriol, L.; Richard, K. Measuring the vulnerability of global airline alliances to member exits to member exits. In Proceedings of the World Conference on Transport Research, Shanghai, China, 10–15 July 2016; pp. 7–16. [Google Scholar]
- Lordan, O.; Sallan, J.M.; Escorihuela, N.; Gonzalez-Prieto, D. Robustness of airline route networks. Phys. A Stat. Mech. Appl. 2016, 445, 18–26. [Google Scholar] [CrossRef]
- Mahutga, M.C.; Xiulian, M.; Smith, D.A.; Timberlake, M. Economic globalisation and the structure of the world city system: The Case of Airline Passenger Data. Urban Stud. 2010, 47, 1925–1947. [Google Scholar] [CrossRef]
- Casanueva, C.; Gallego, Á.; Castro, I.; Sancho, M. Airline alliances: Mobilizing network resources. Tour. Manag. 2014, 44, 88–98. [Google Scholar] [CrossRef]
- Lordan, O.; Sallan, J.M.; Simo, P.; Gonzalez-Prieto, D. Robustness of airline alliance route networks. Commun. Nonlinear Sci. 2015, 22, 587–595. [Google Scholar] [CrossRef]
- Klophaus, R.; Lordan, O. Codesharing network vulnerability of global airline alliances. Transp. Res. Part A Policy Pract. 2018, 111, 1–10. [Google Scholar] [CrossRef]
- Zou, L.; Chen, X. The effect of code-sharing alliances on airline profitability. J. Air Transp. Manag. 2017, 58, 50–57. [Google Scholar] [CrossRef]
- John, B.; Pat, H. Airline alliacnes: Cooperating to compete. J. Transp. Manag. 1994, 1, 209–227. [Google Scholar]
- Douglas, I.; Tan, D. Global airline alliances and profitability: A difference-in-difference analysis. Transp. Res. Part A Policy Pract. 2017, 103, 432–443. [Google Scholar] [CrossRef]
- CAPA. Latin America’s Matrix of Airlines and Partnerships Has Changed Drastically during the Last Decade, Driven by the Mergers of Avianca and TACA and LAN and TAM; Consolidation & Alliances in Latin America: Sydney, Australia, 2017. [Google Scholar]
- Park, J.-H.; Zhang, A. An empirical analysis of global airline alliances: Cases in north atlantic markets. Rev. Ind. Organ. 2000, 16, 367–384. [Google Scholar] [CrossRef]
- Ito, H.; Lee, D. Domestic code sharing, alliances, and airfares in the U.S. airline industry. J. Law Econ. 2007, 50, 355–380. [Google Scholar] [CrossRef]
- IATA. Annual Review; International Air Transport Association: Montreal, QC, Canada, 2018; p. 68. [Google Scholar]
- IATA. IATA Forecasts Passenger Demand to Double Over 20 Years; International Air Transport Association Geneva: Geneva, Switzerland, 2016; p. 3. [Google Scholar]
- Cyr, D.; Trevor-Smith, H. Localization of web design: An empirical comparison of German, Japanese, and United States web site characteristics. J. Am. Soc. Inf. Sci. Tec. 2004, 55, 1199–1208. [Google Scholar] [CrossRef]
- Shneor, R. Influences of culture, geography and infrastructure on website localization decisions. Cross Cult. Manag. 2012, 19, 352–374. [Google Scholar] [CrossRef]
- Luo, Y.; Shenkar, O. The multinational corporation as a multilingual community: Language and organization in a global context. In Language in International Business: Developing a Field; Brannen, M.Y., Mughan, T., Eds.; Springer International Publishing: Cham, Switzerland, 2017; pp. 59–92. [Google Scholar] [CrossRef]
Publisher’s Note: MDPI stays neutral with regard to jurisdictional claims in published maps and institutional affiliations. |
© 2021 by the authors. Licensee MDPI, Basel, Switzerland. This article is an open access article distributed under the terms and conditions of the Creative Commons Attribution (CC BY) license (http://creativecommons.org/licenses/by/4.0/).