Residual Multi-Attention Classification Network for A Forest Dominated Tropical Landscape Using High-Resolution Remote Sensing Imagery


Abstract
1. Introduction
2. Materials and Methods
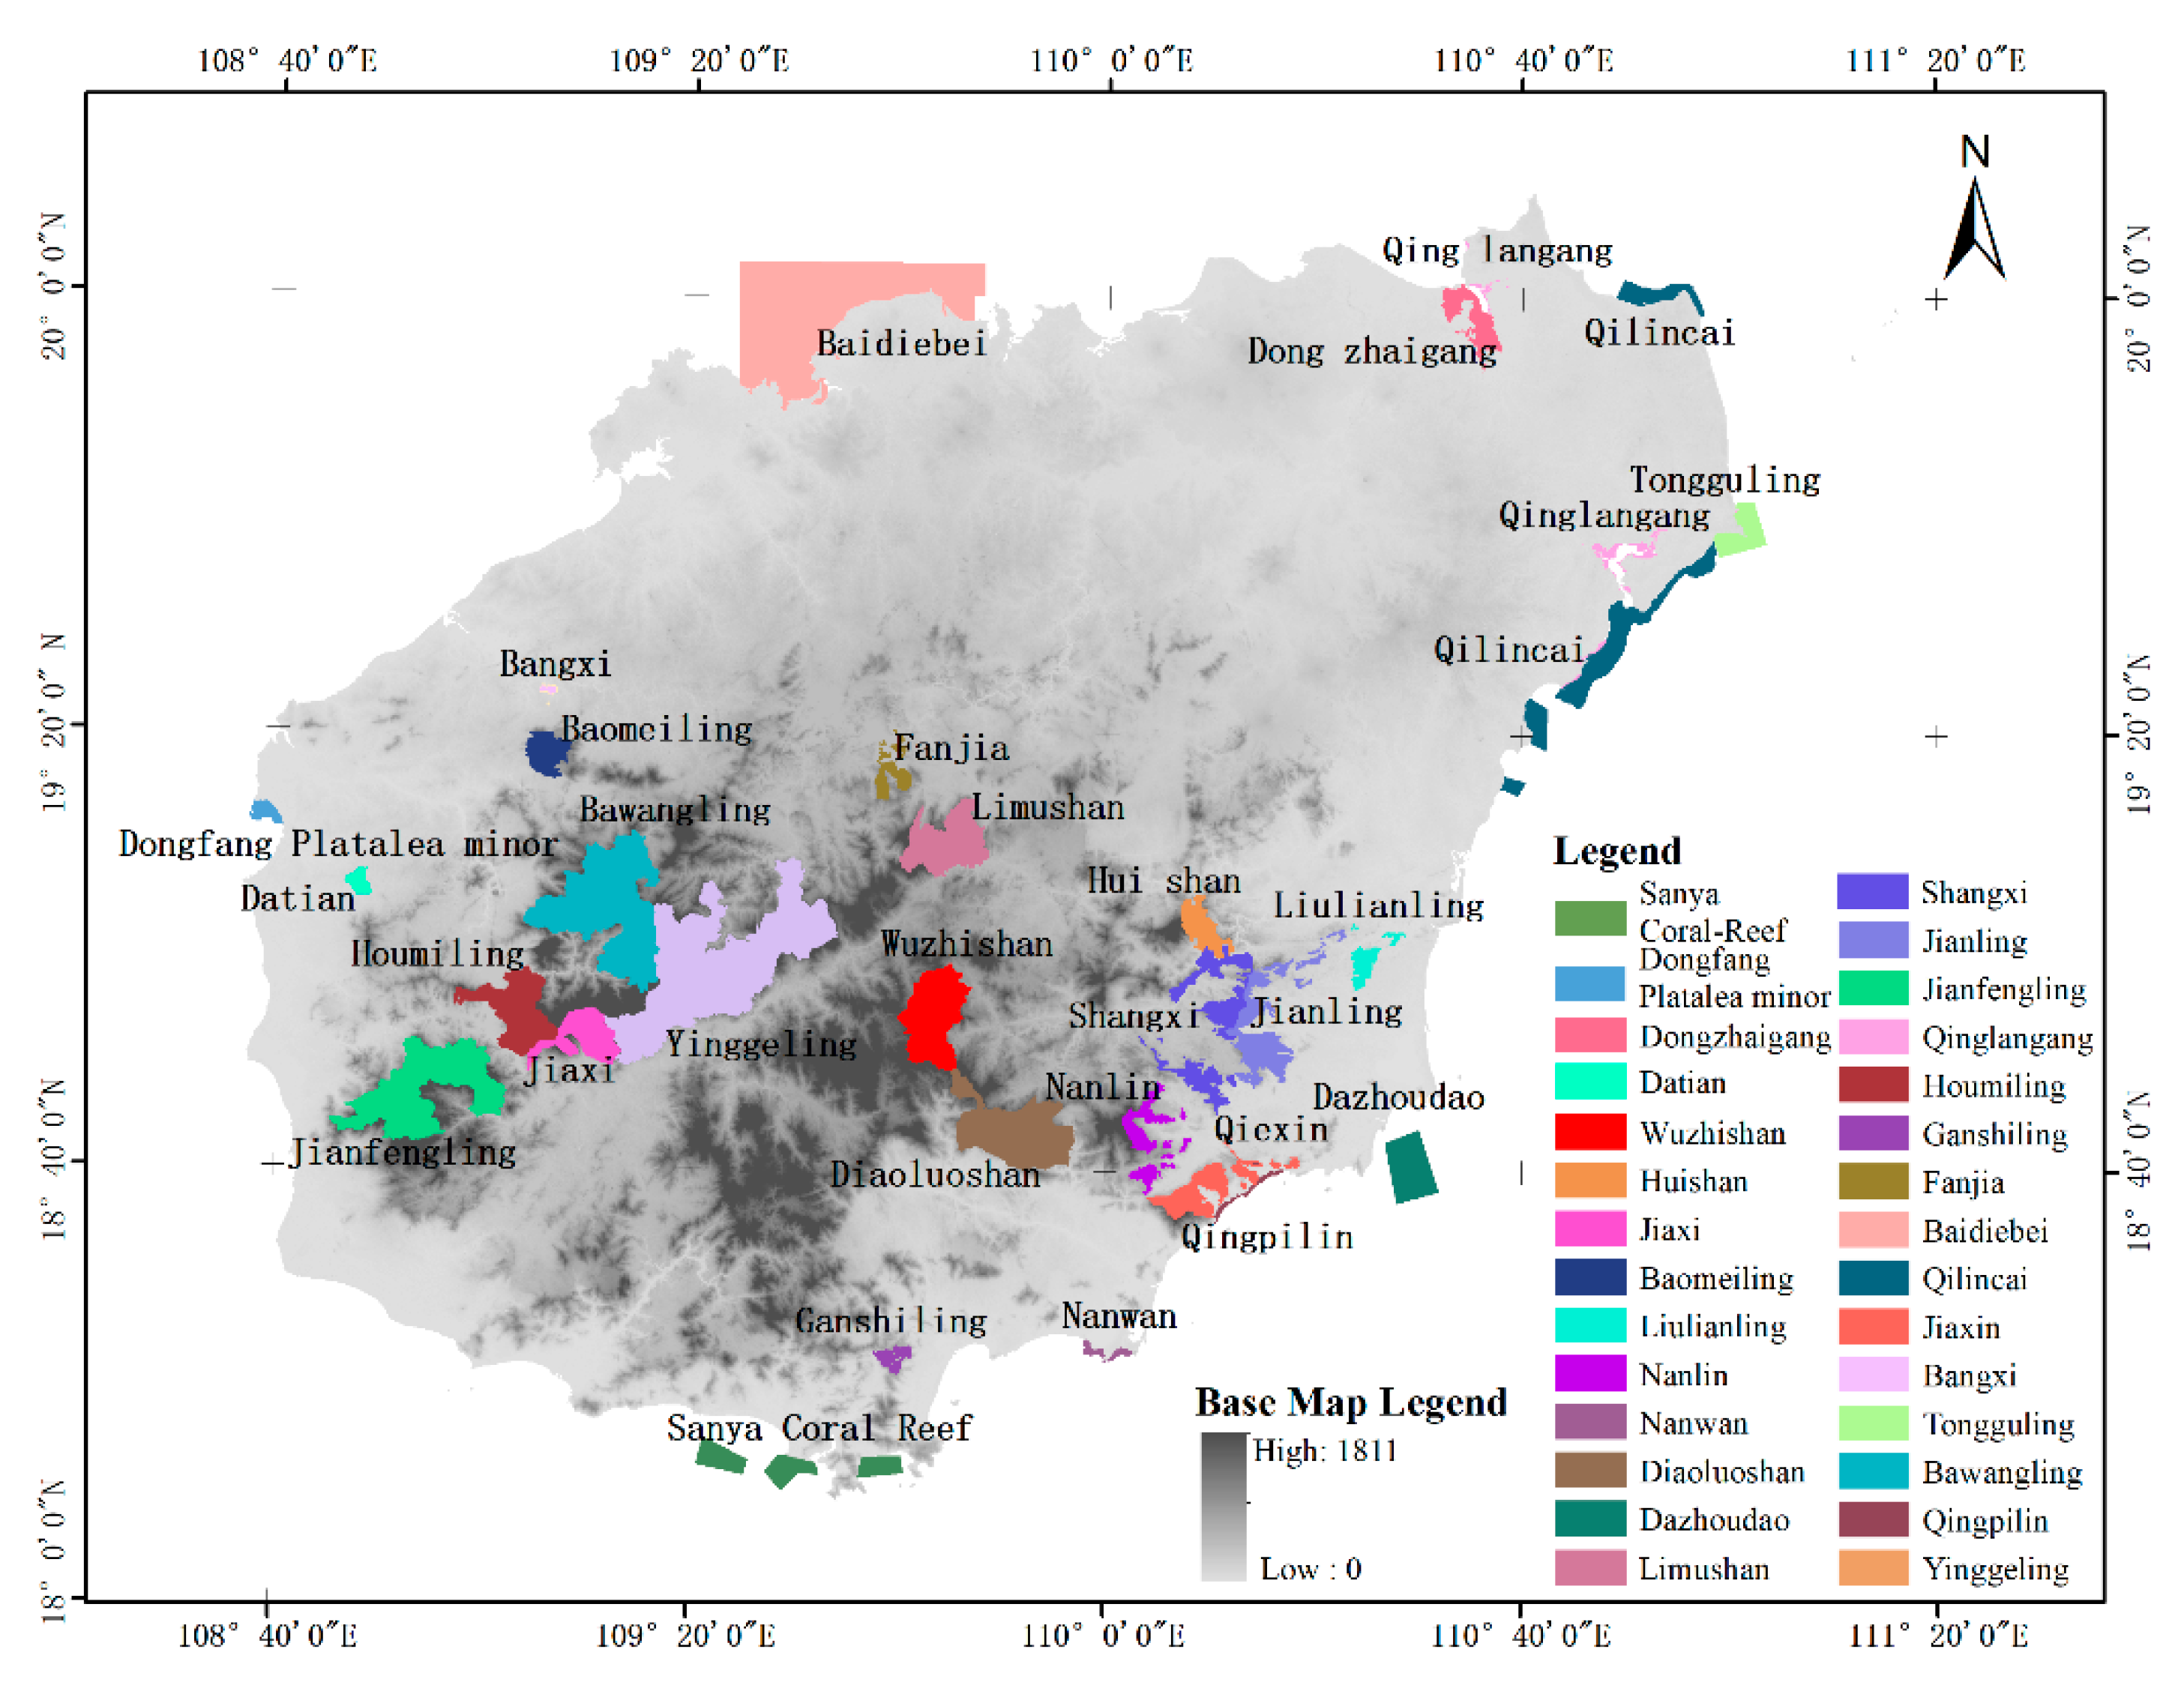
2.1. Study Area
2.2. Dataset
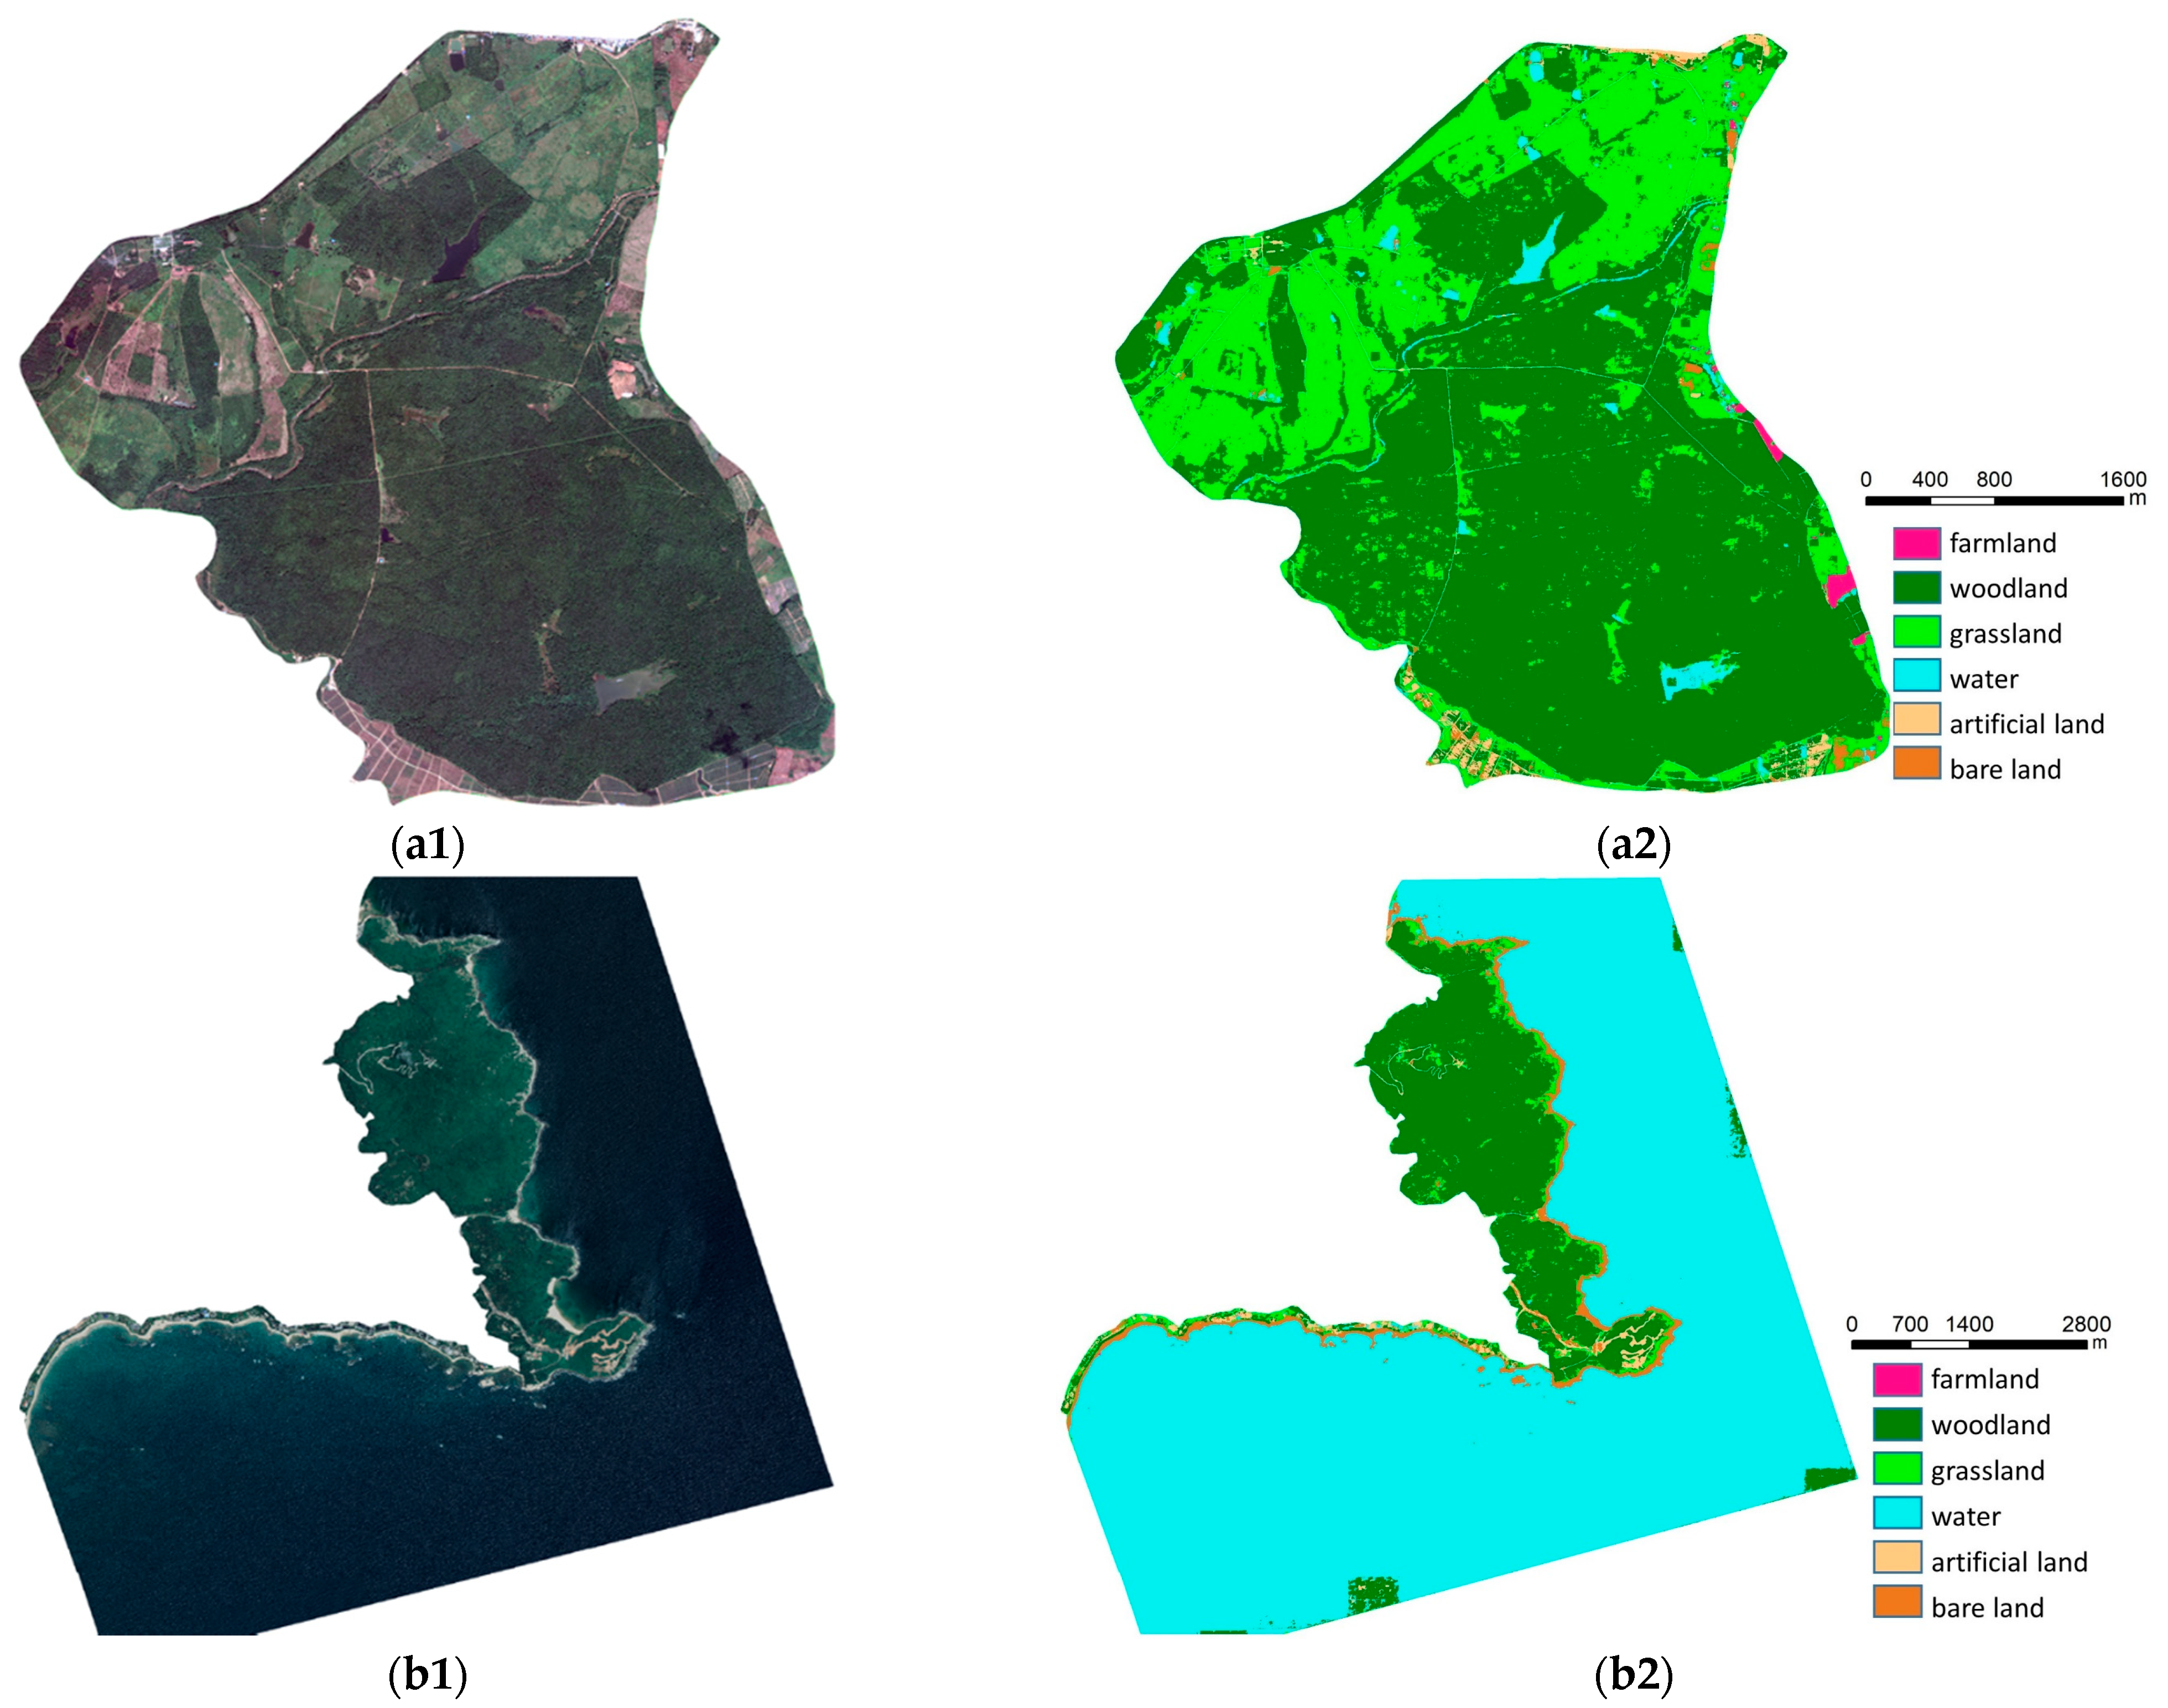
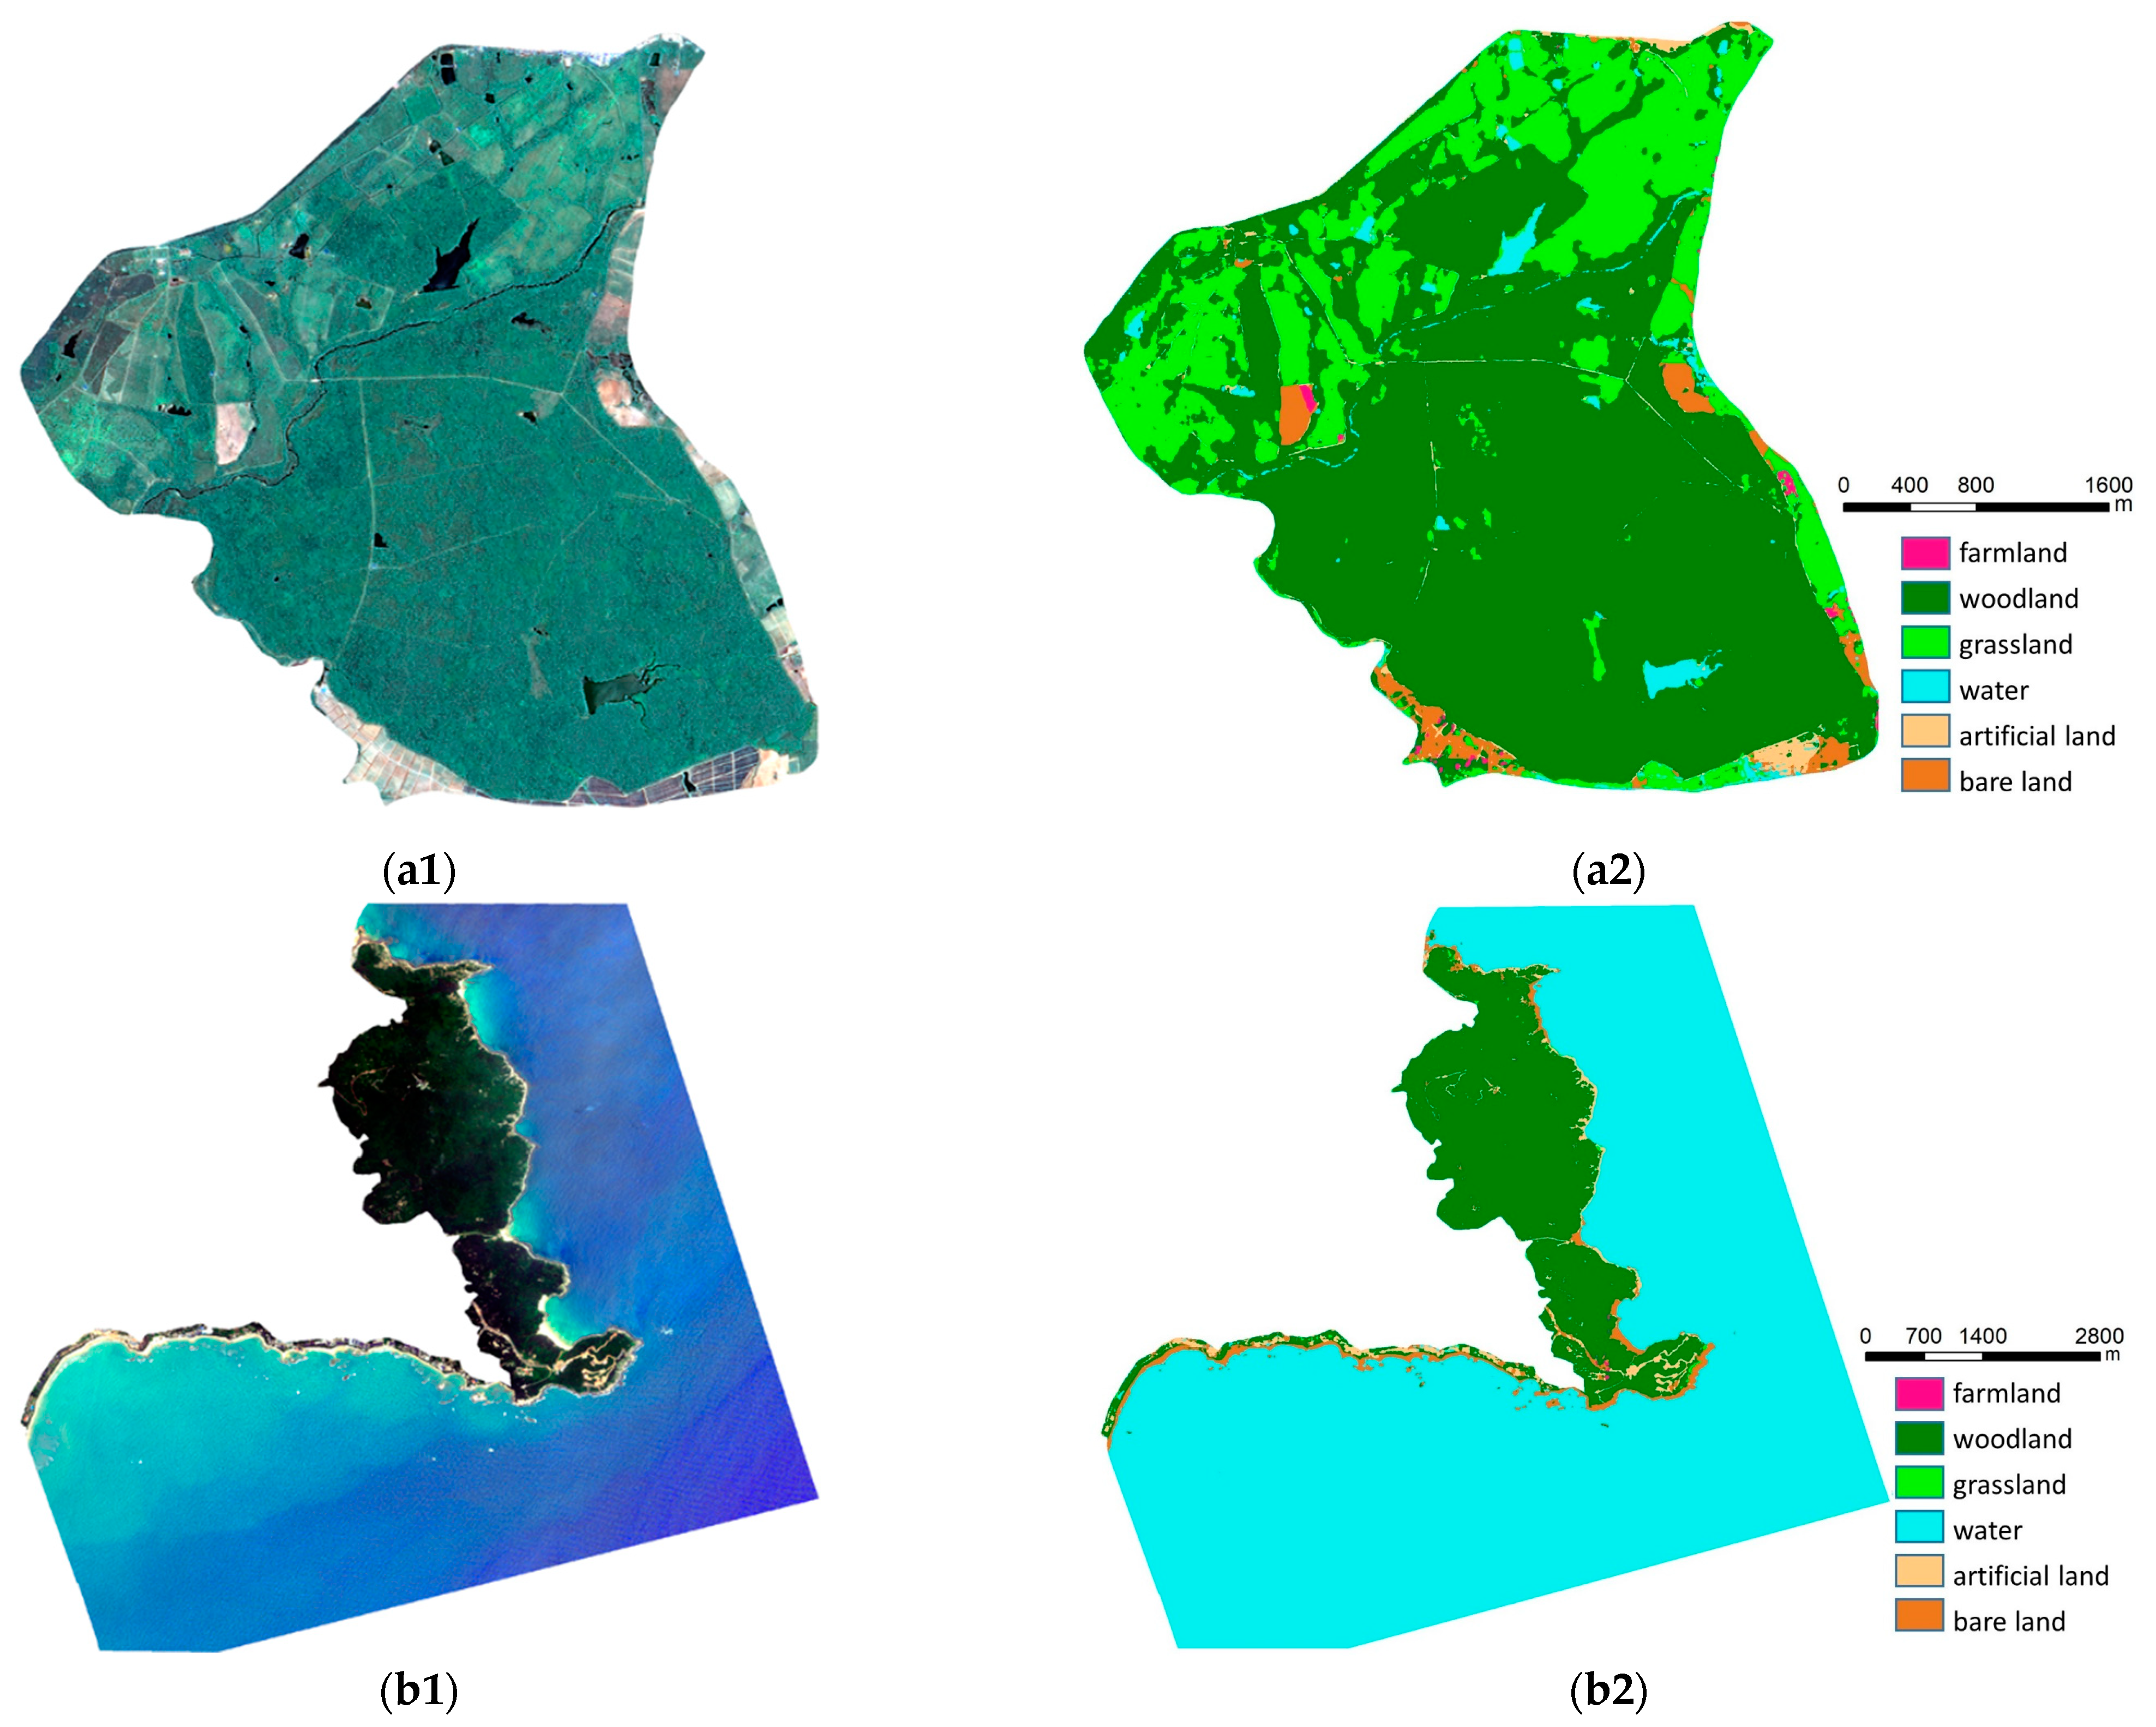
2.2.1. Hainan Nature Reserve Dataset with True Color Images (Dataset A)
2.2.2. Hainan Nature Reserve Dataset with Multi-Spectral Images (Dataset B)
2.2.3. Public Dataset
2.3. Methods
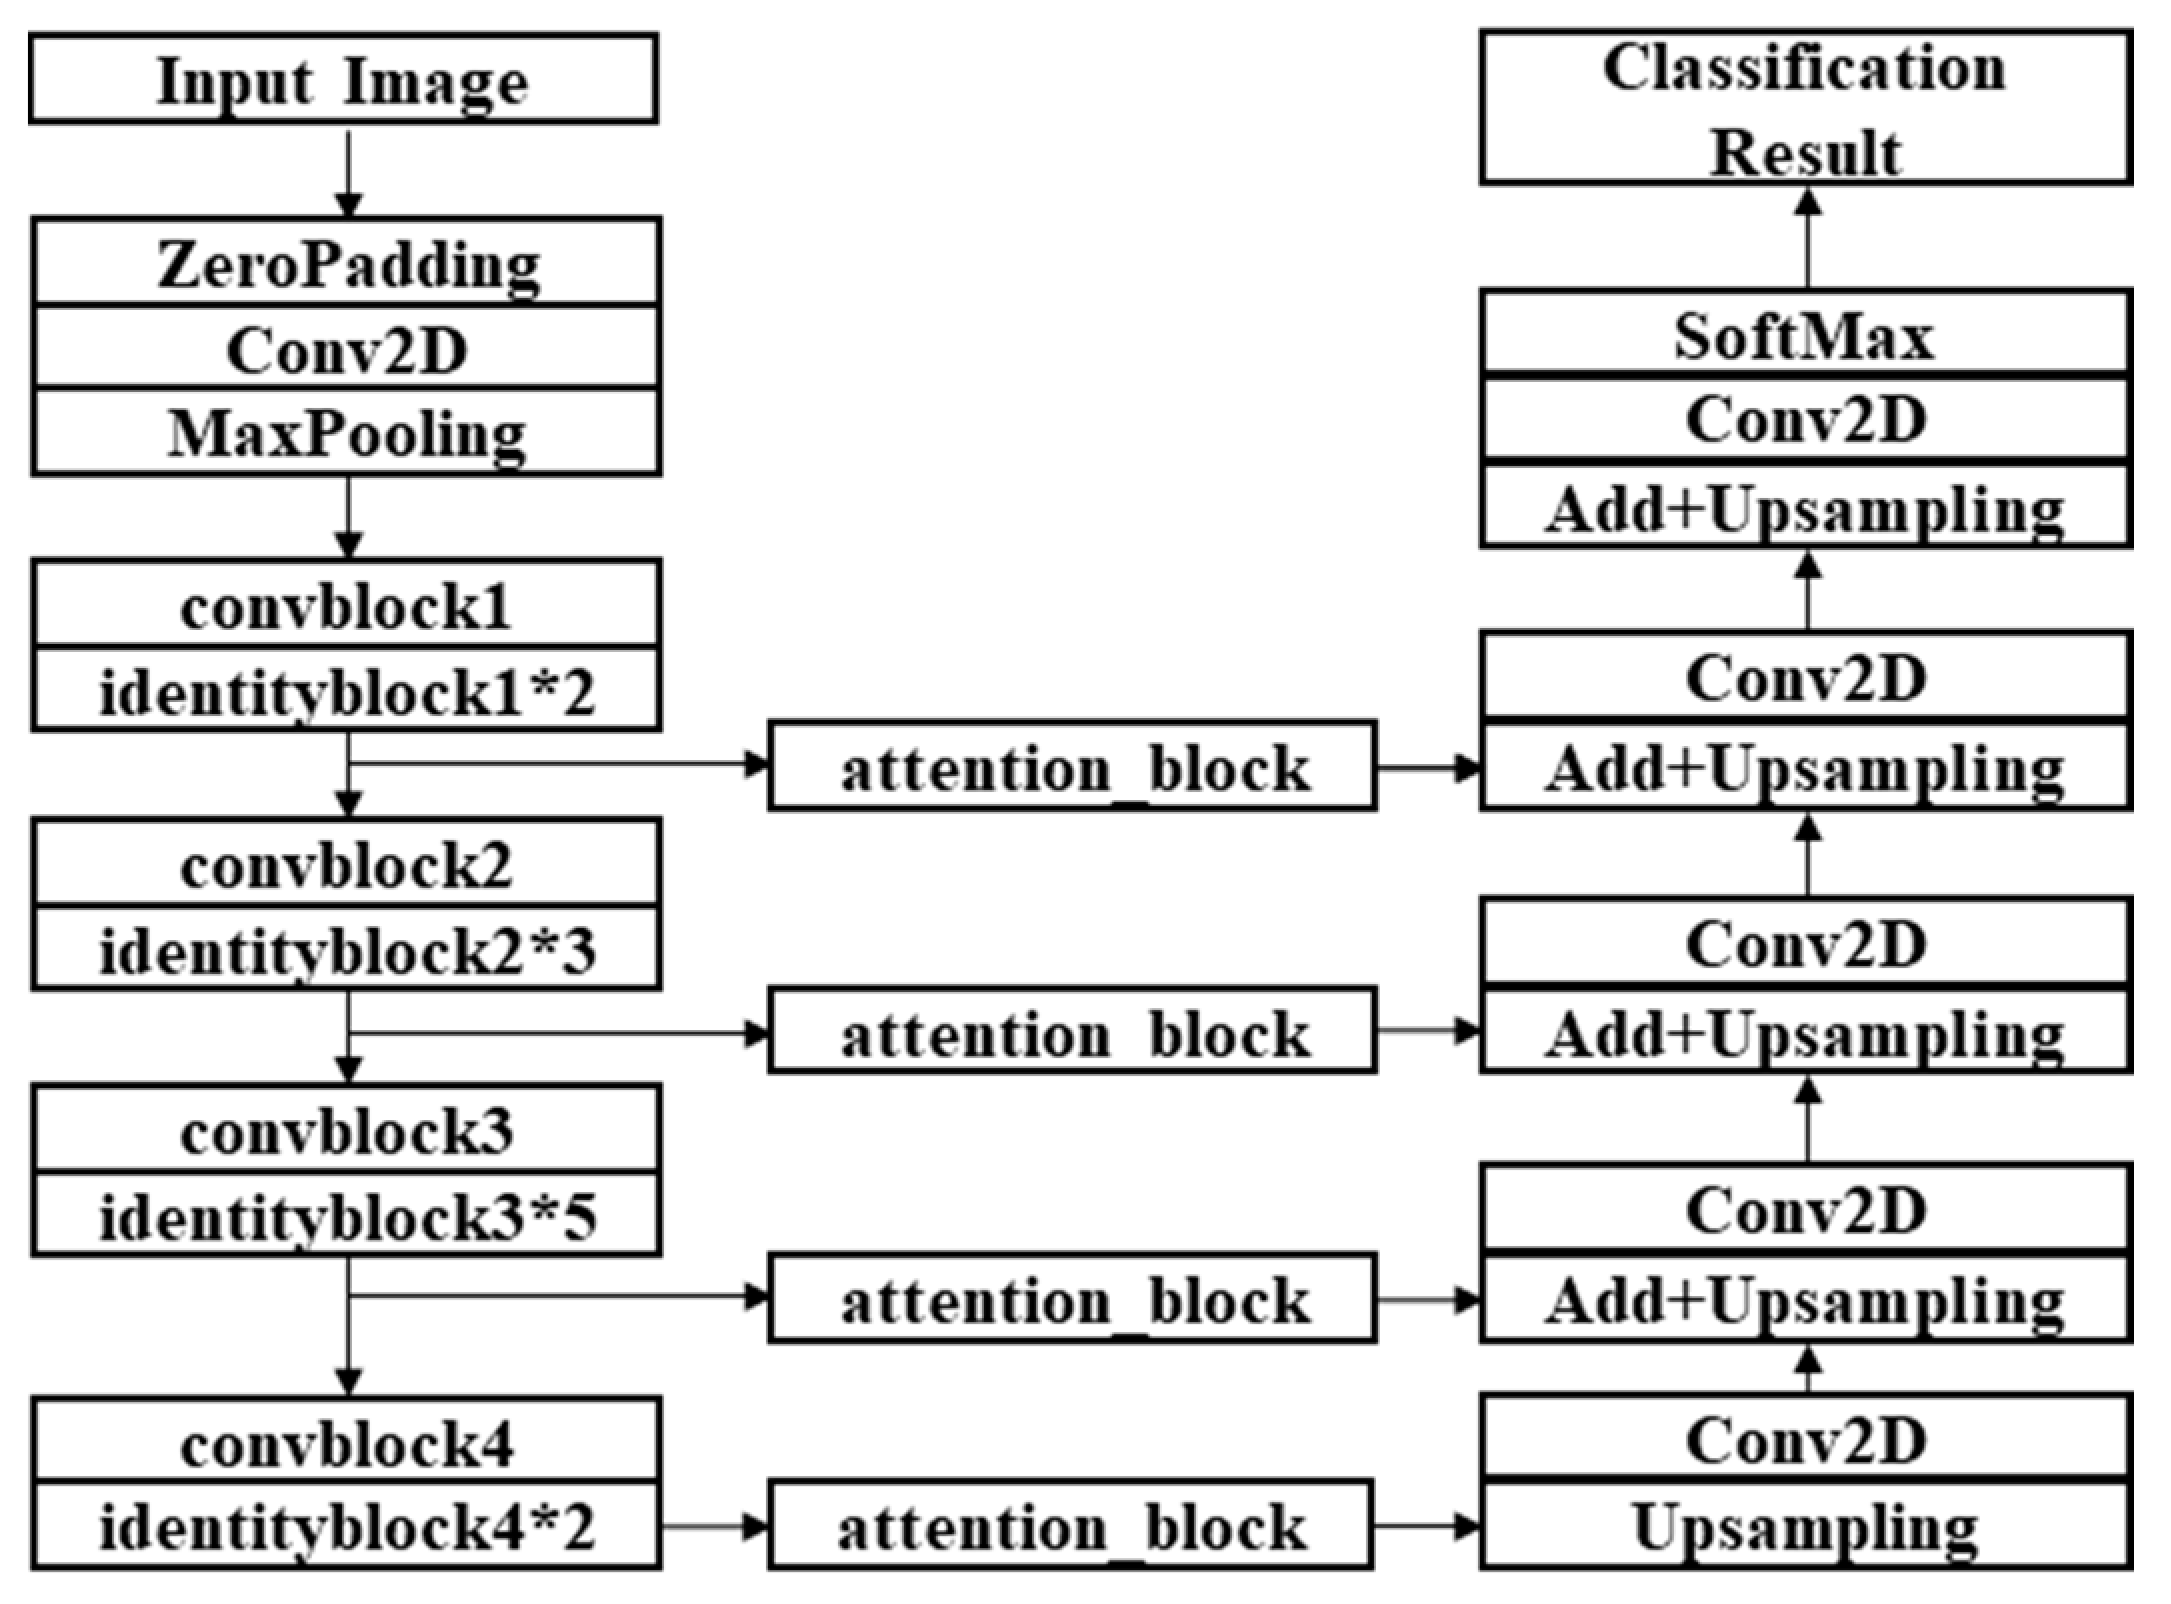
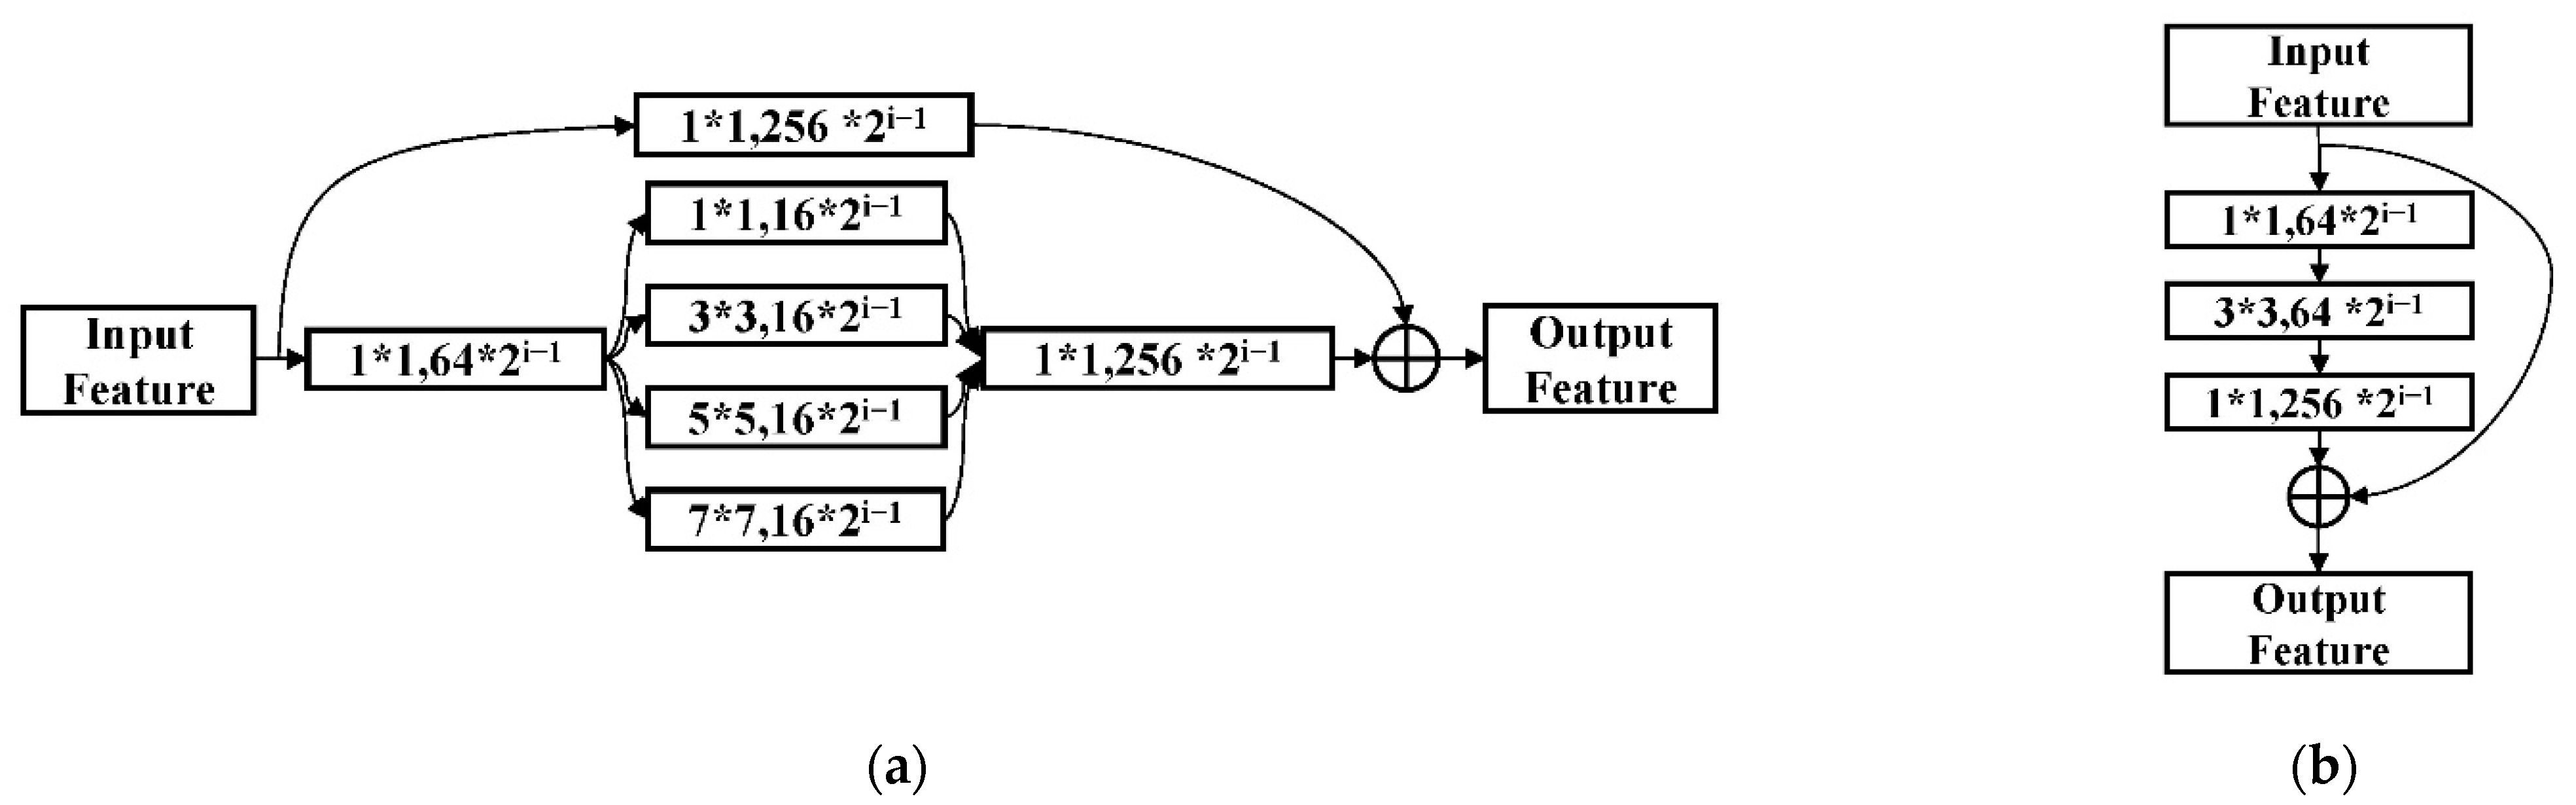
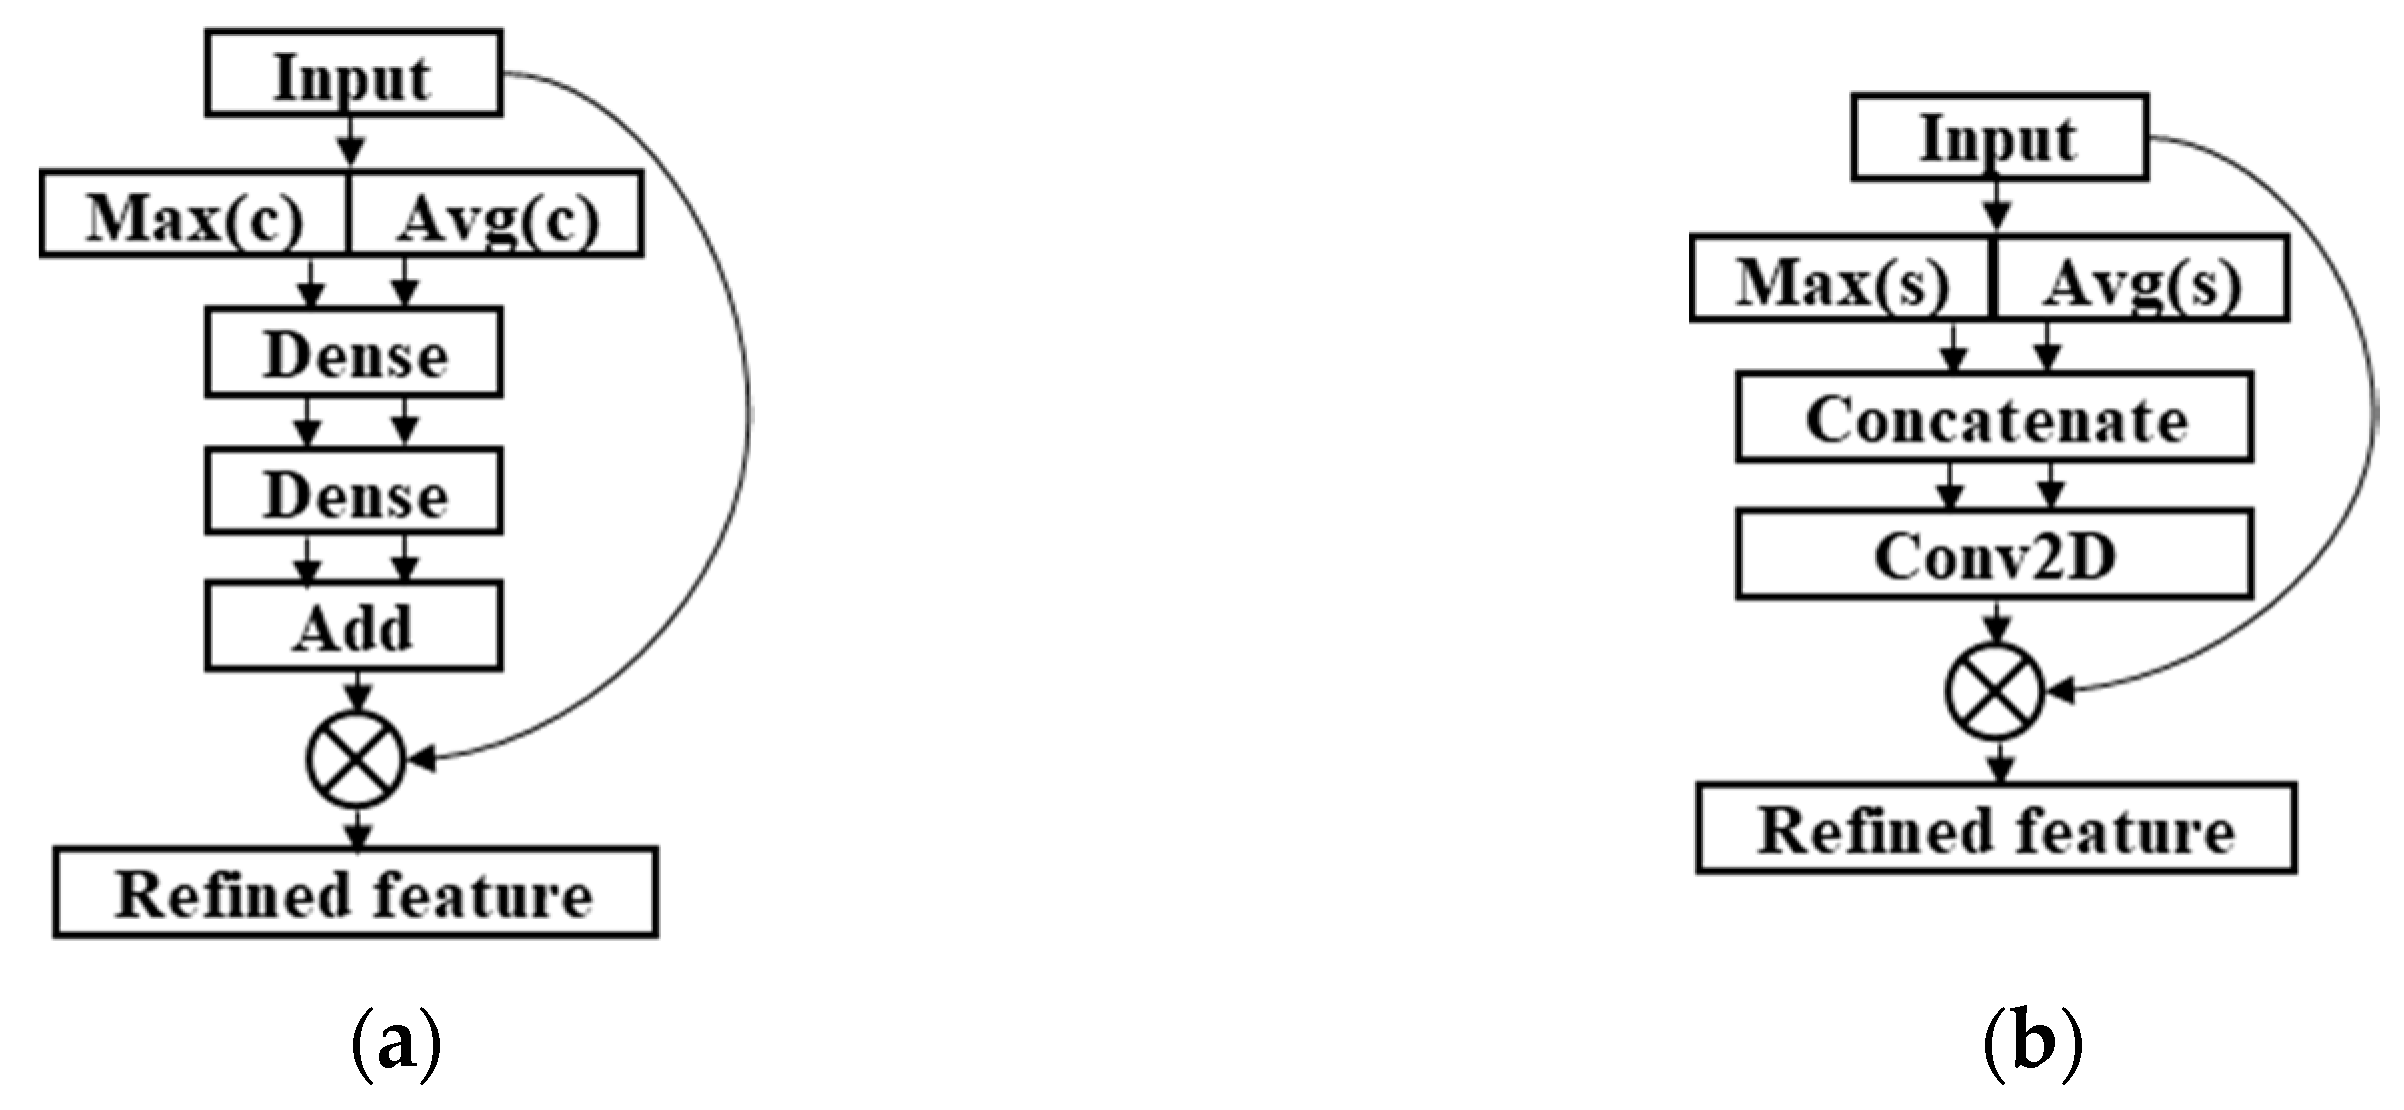
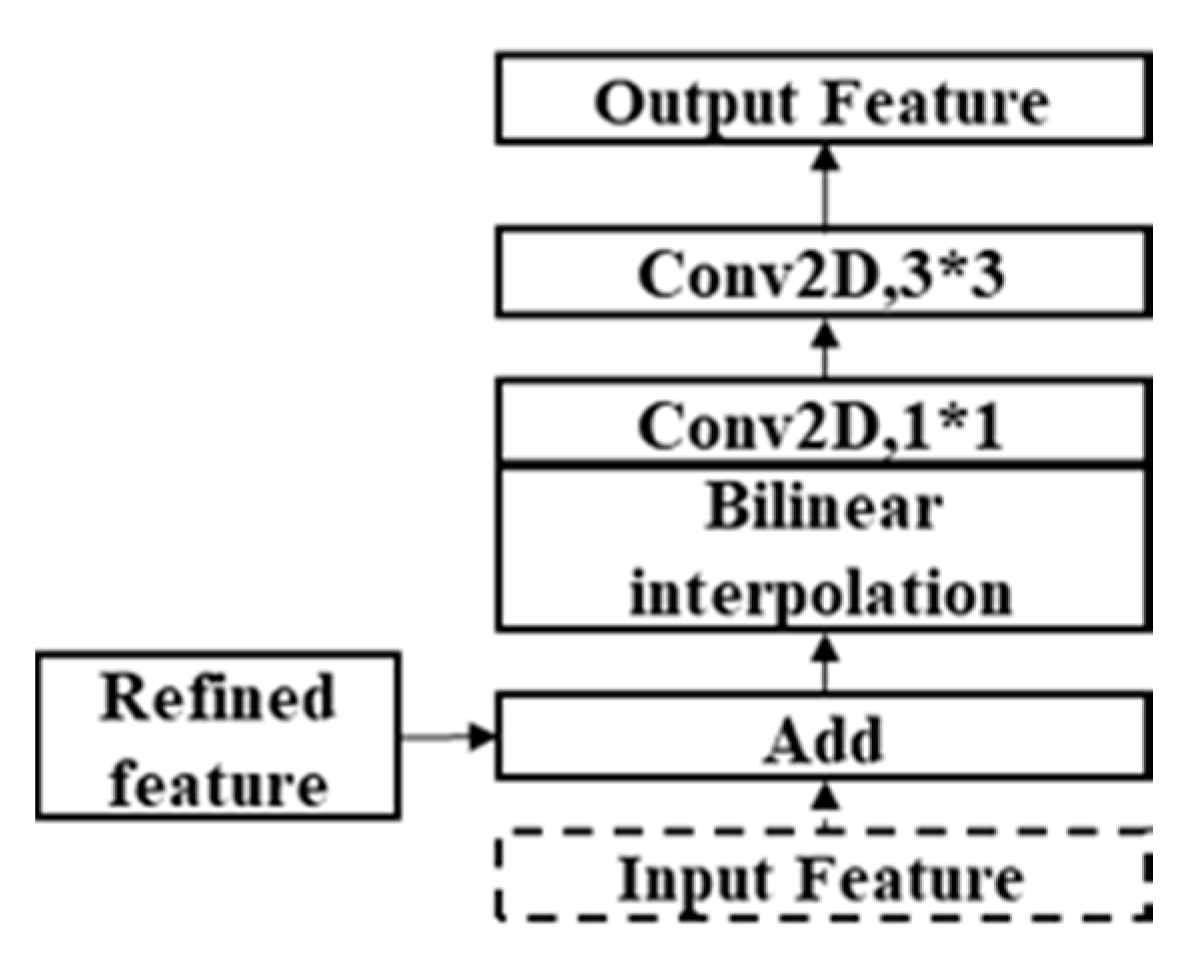
2.3.1. Structure of ResMANet
2.3.2. Four SOTA Semantic Segmentation Networks
2.3.3. Joint Loss Function
3. Results and Discussion
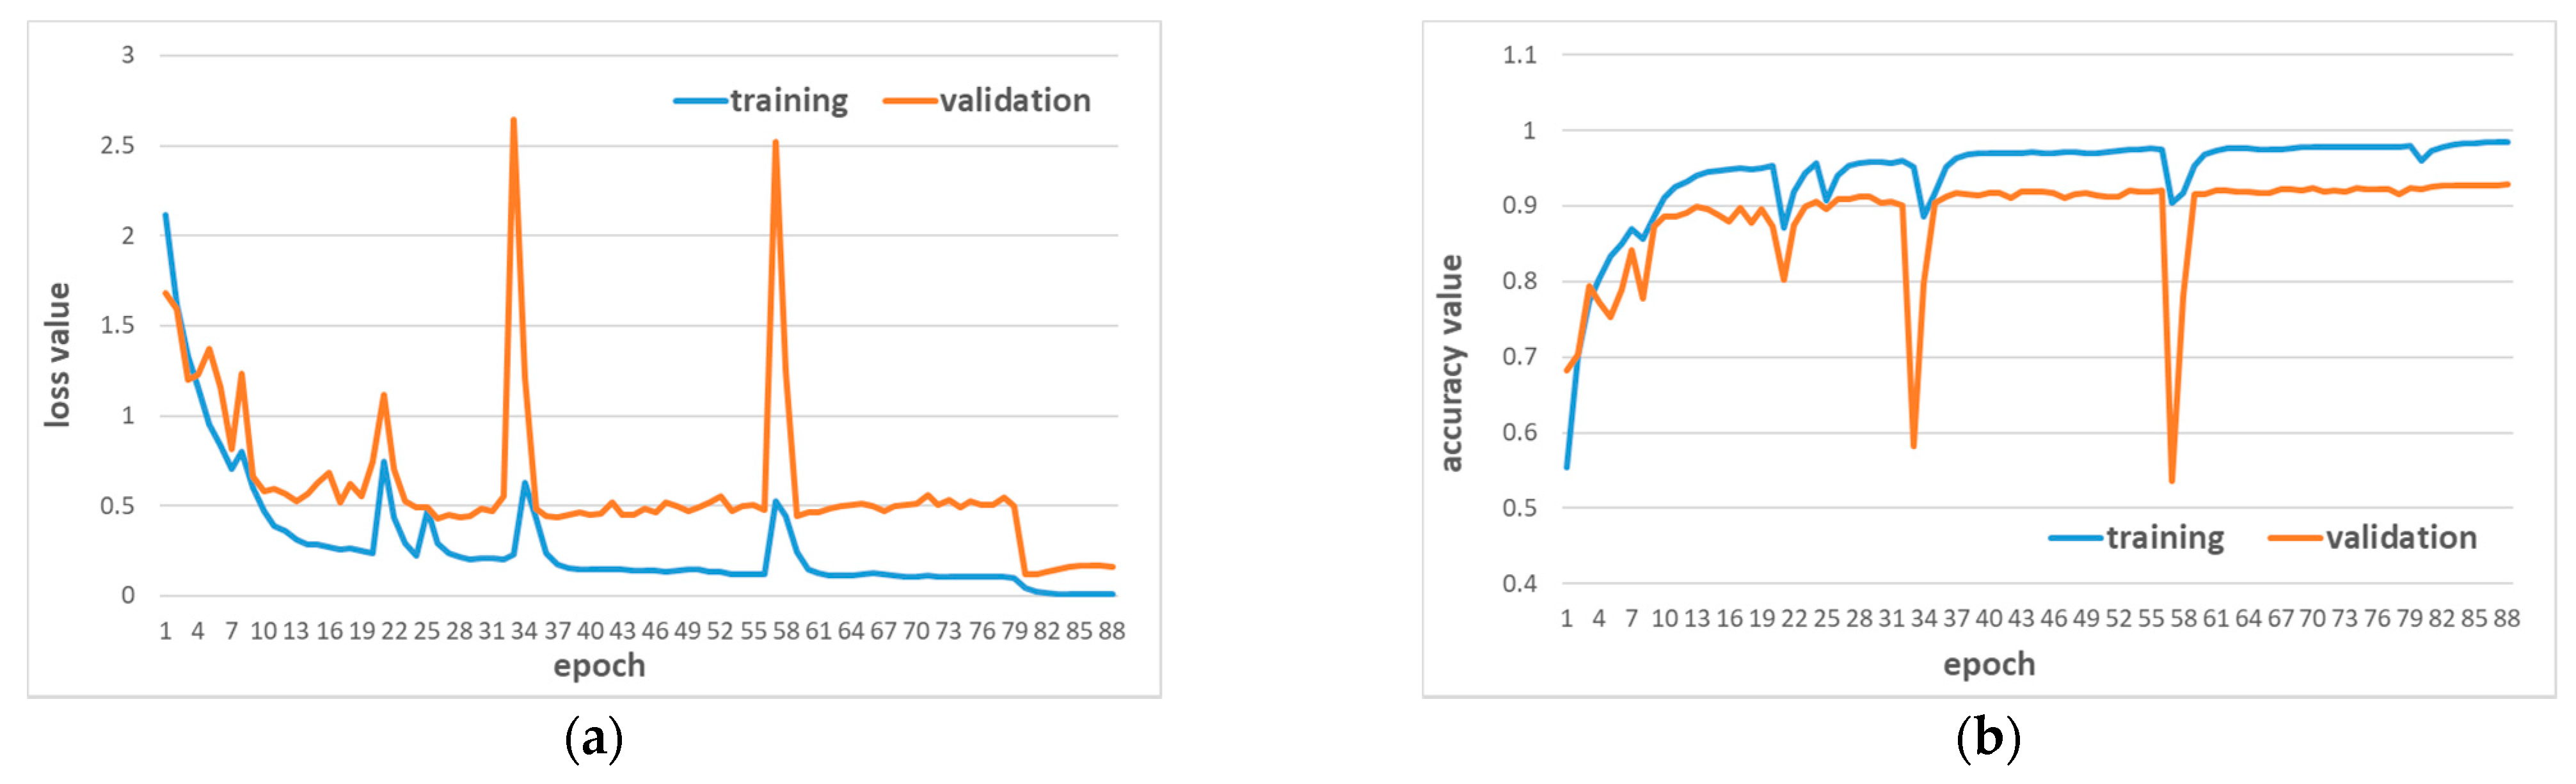
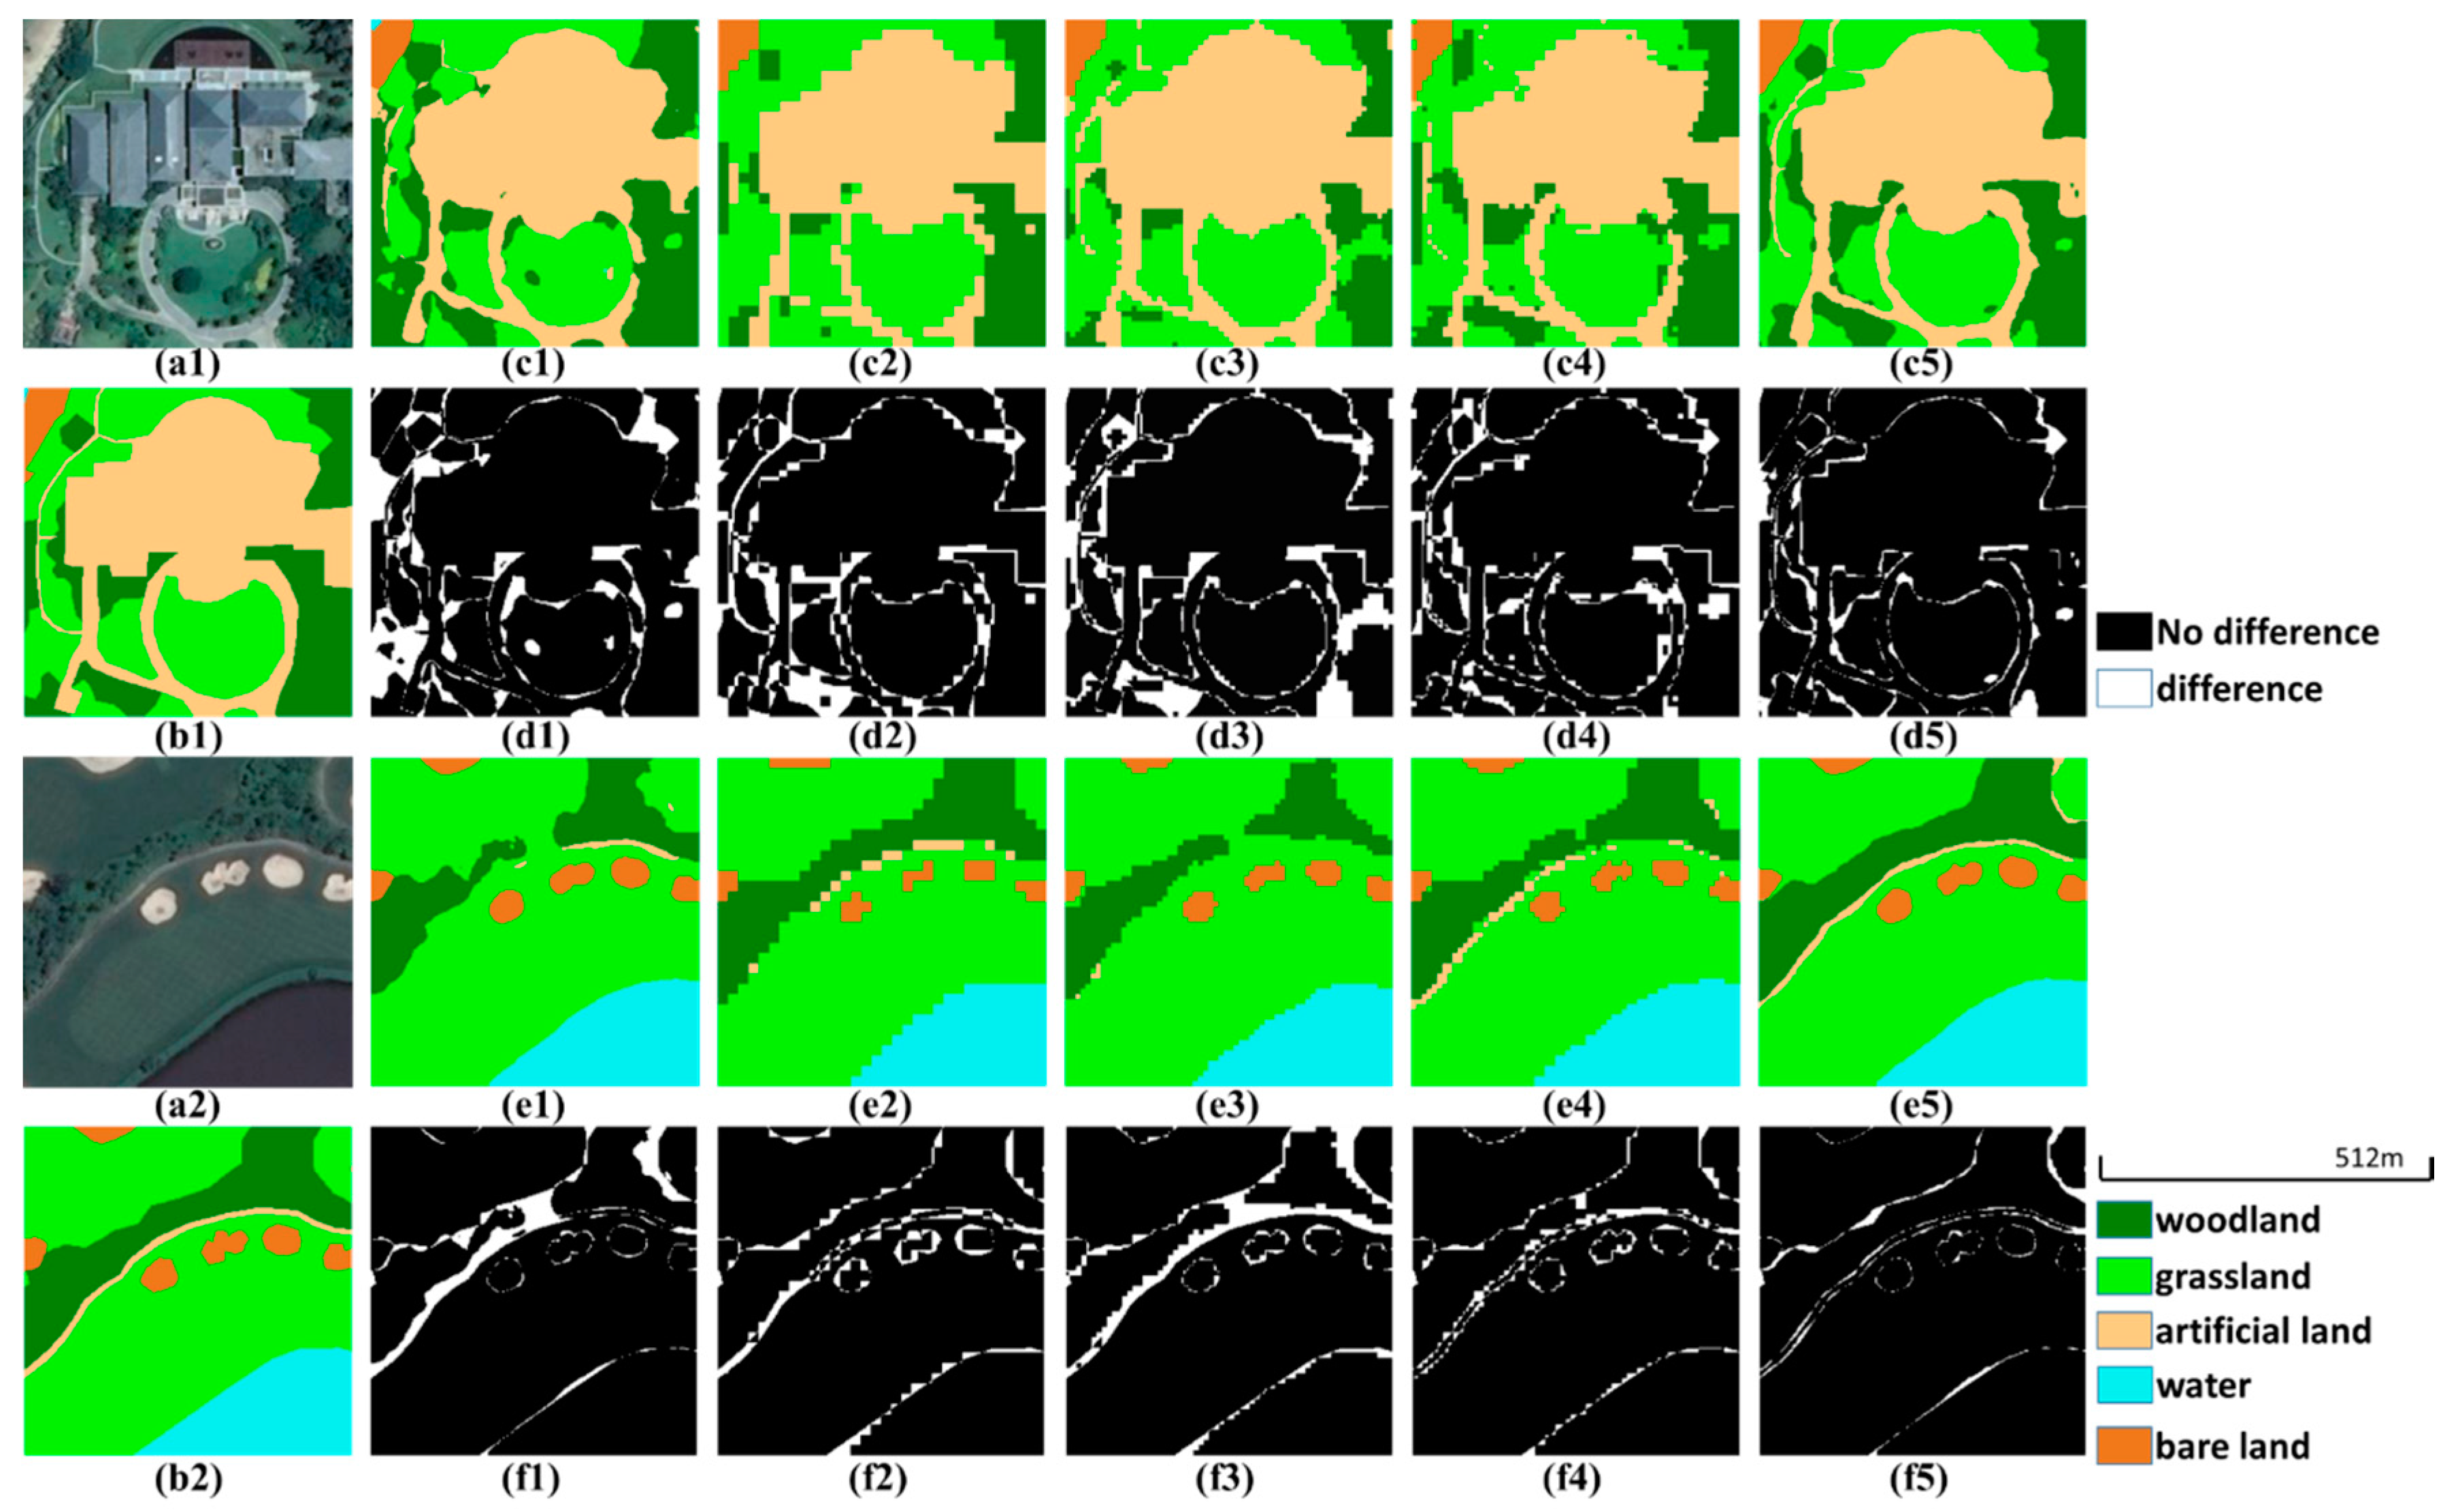
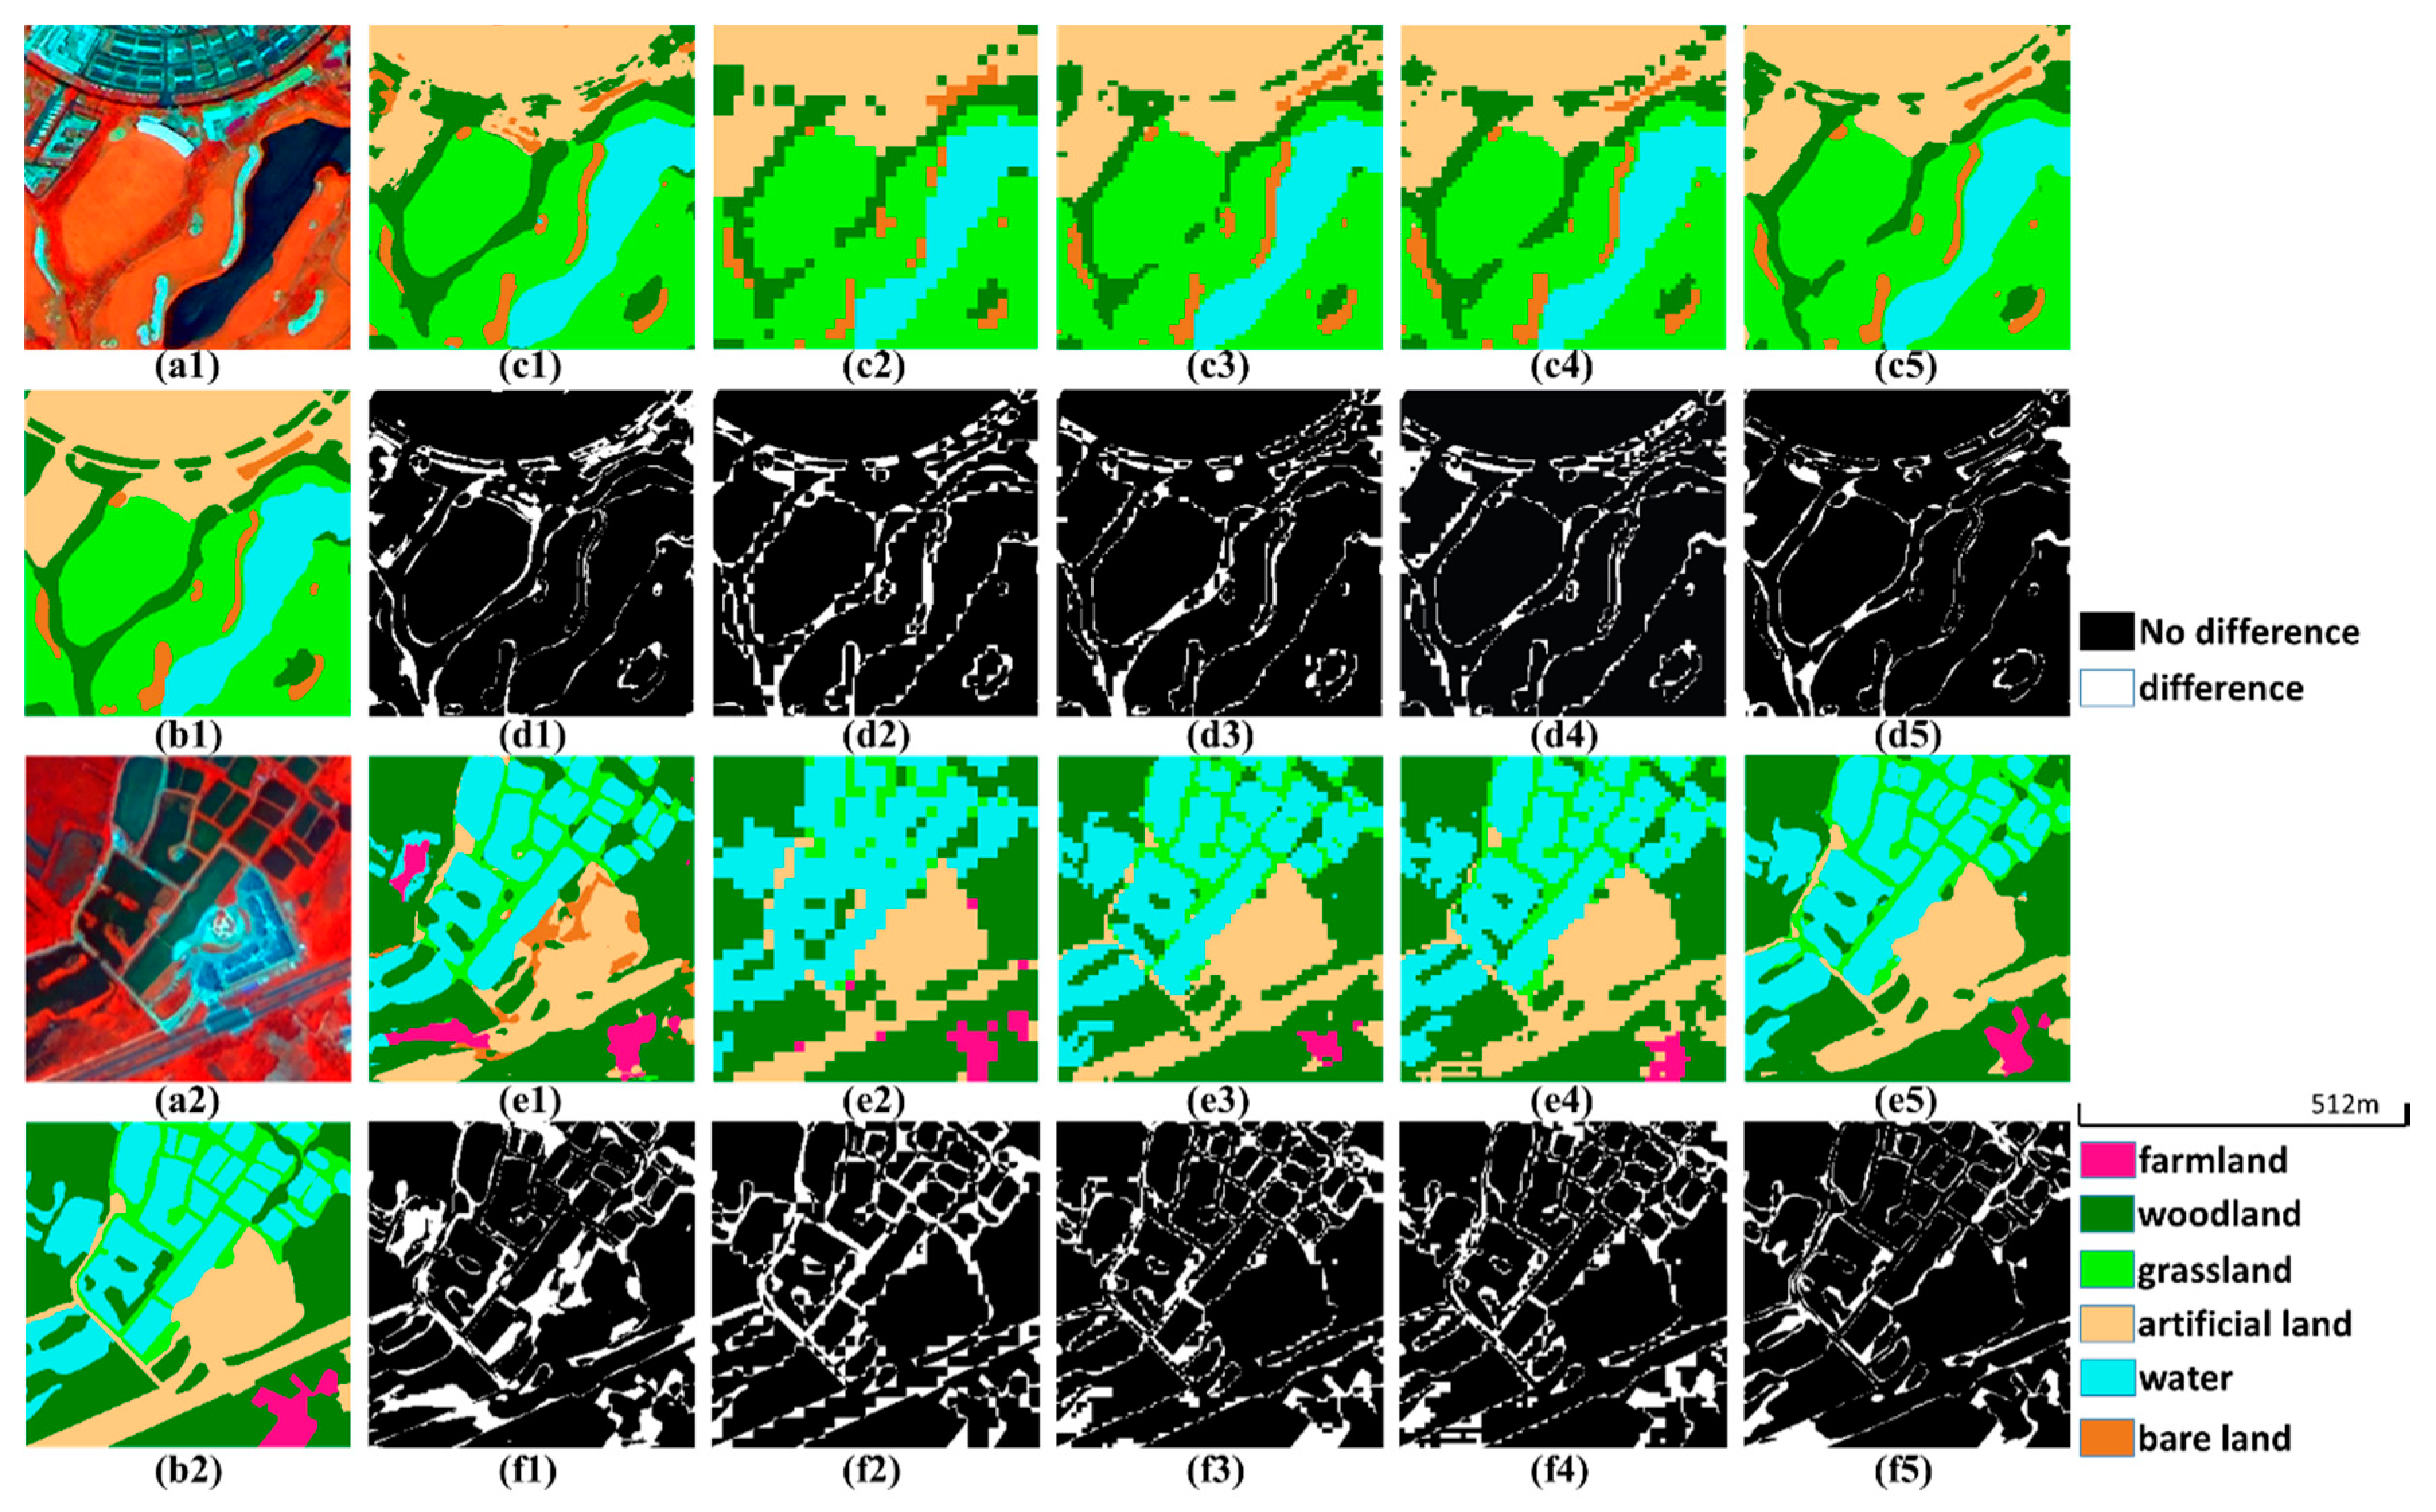
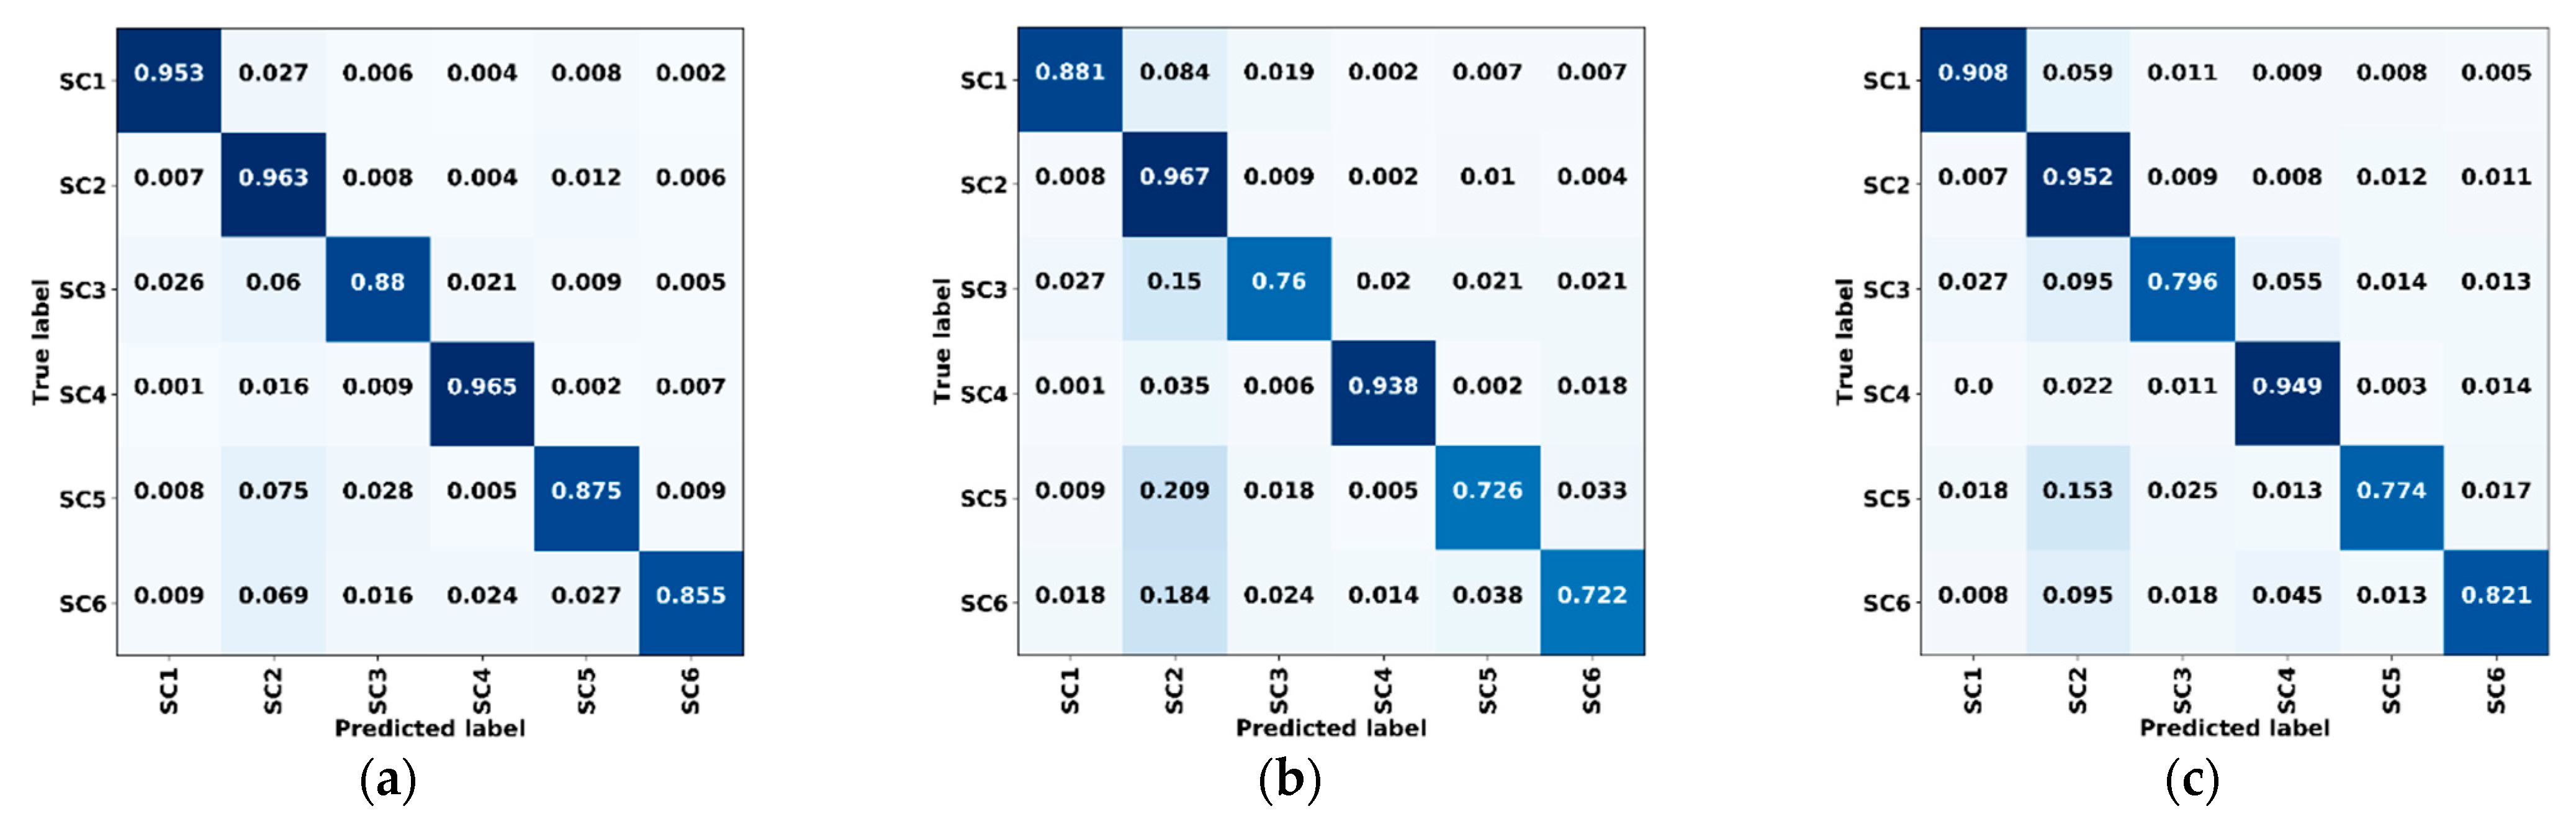
3.1. Experiments on Dataset A
3.2. Experiments on Dataset B
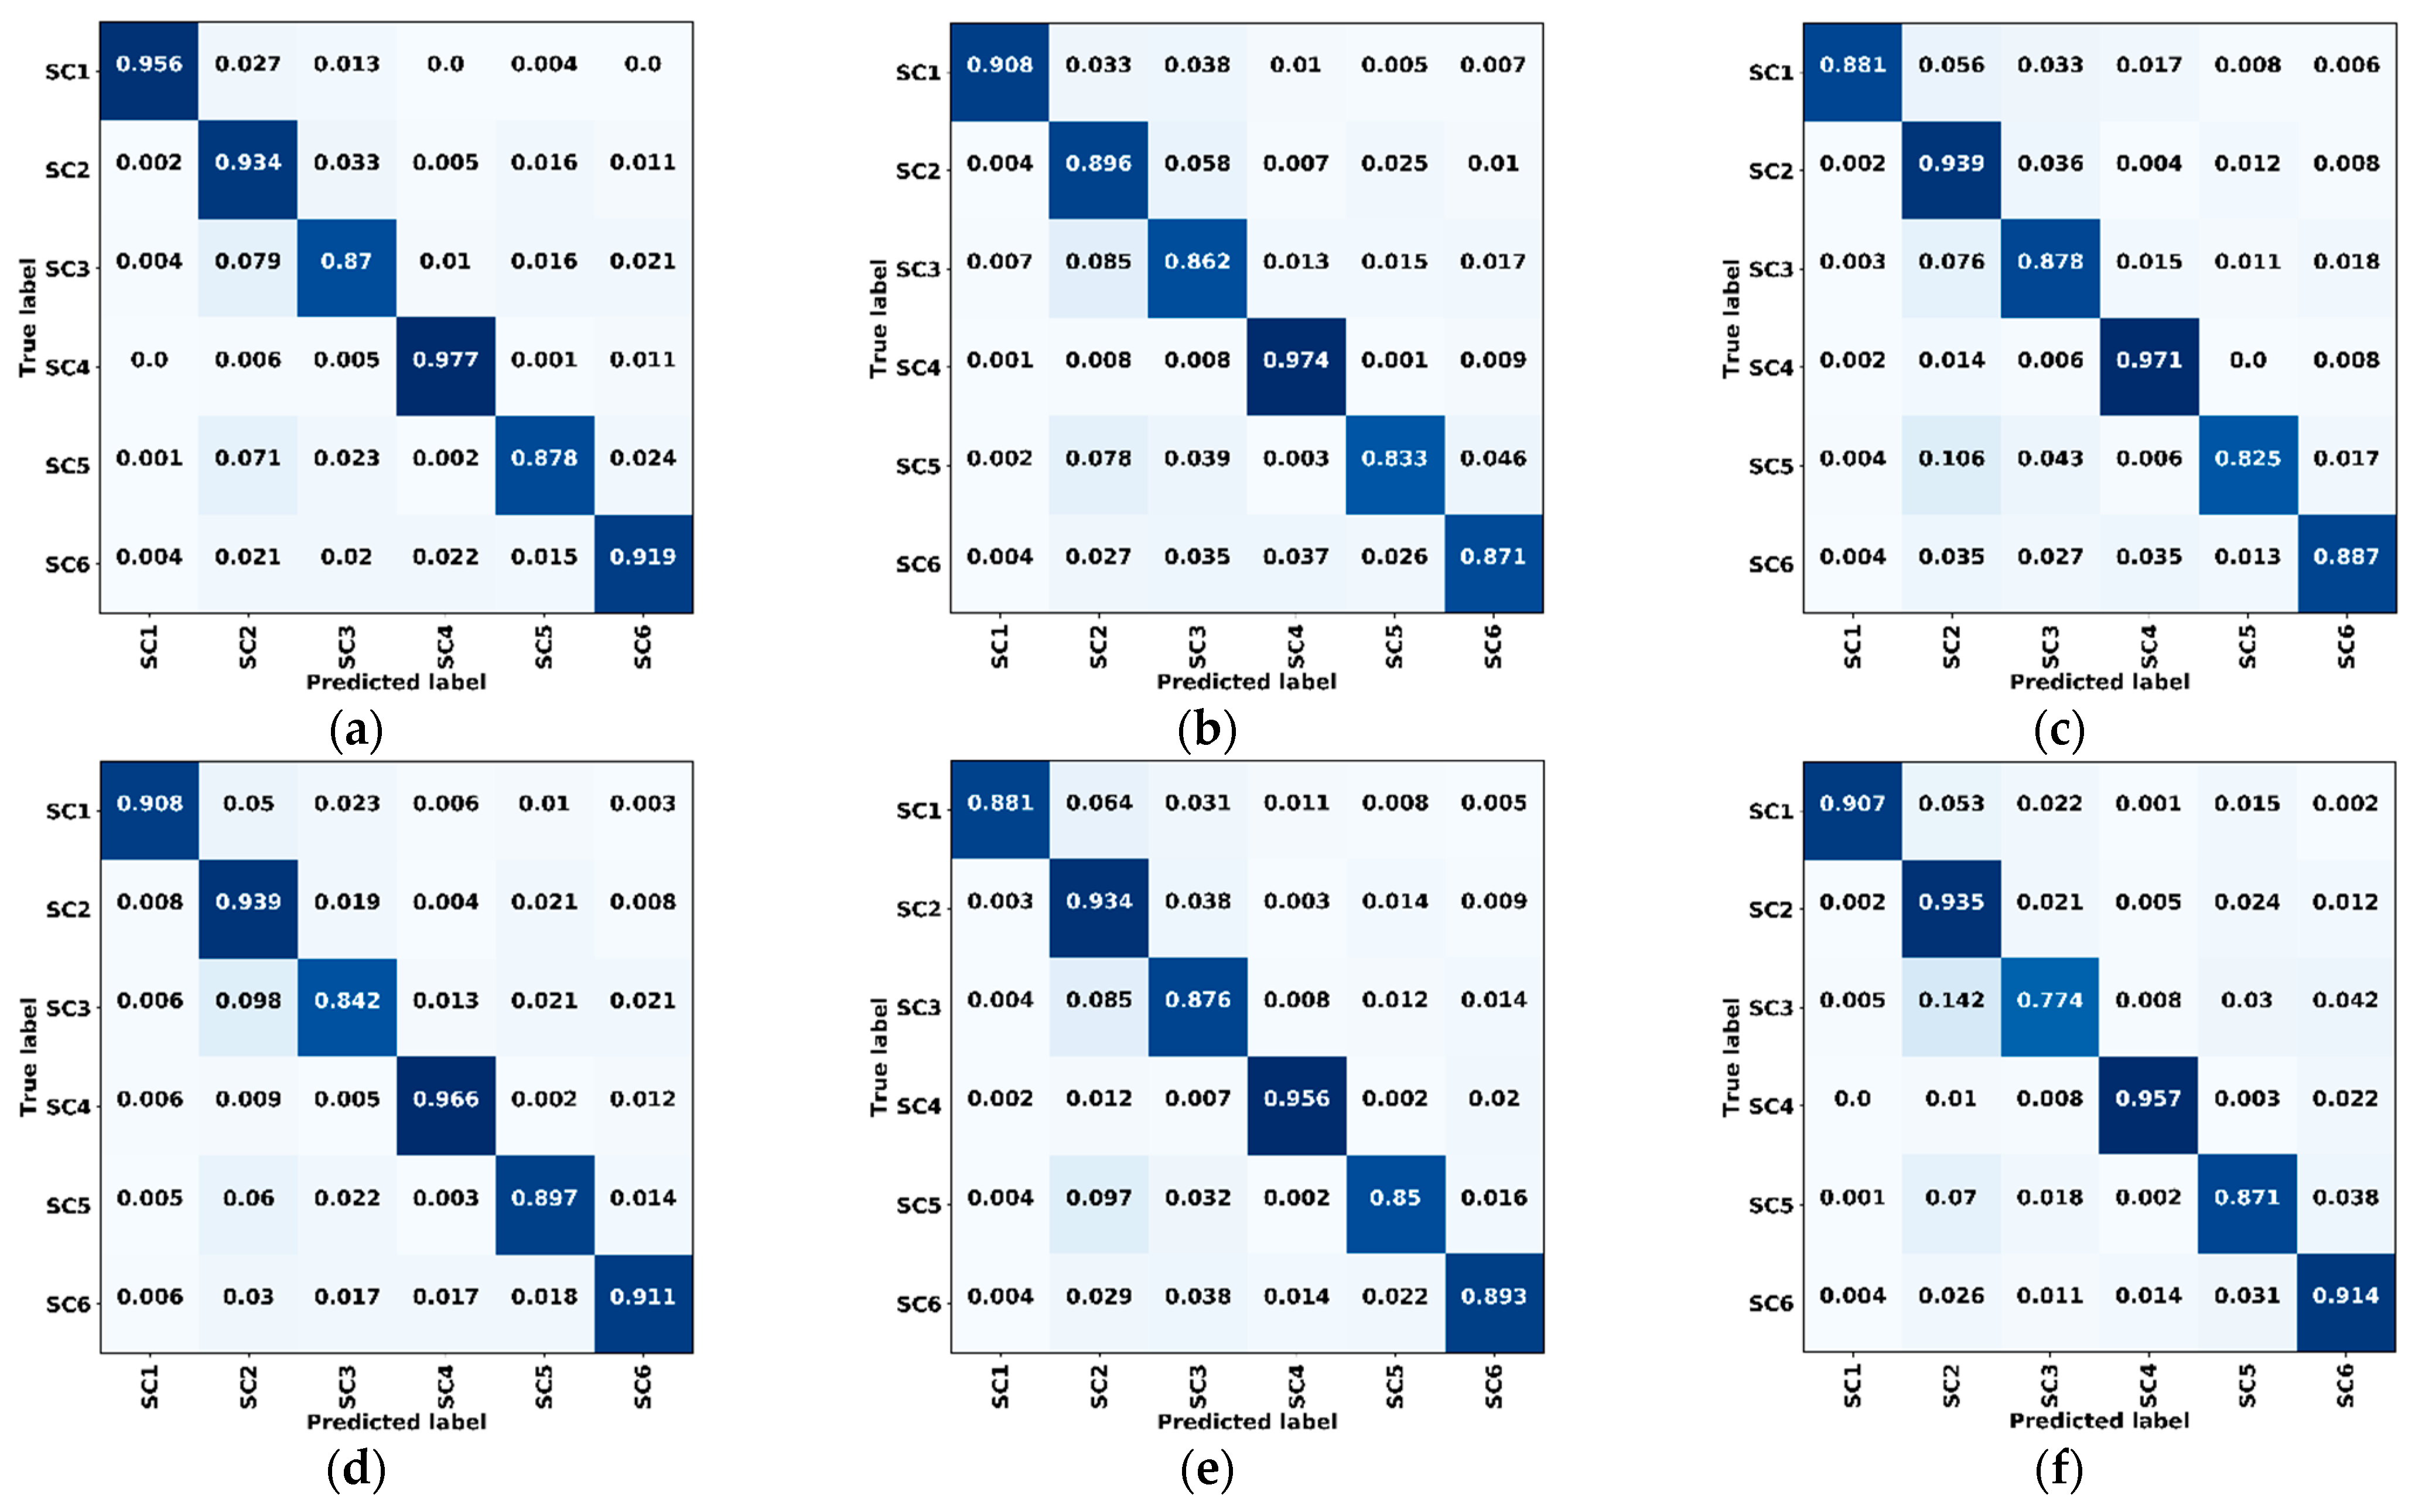
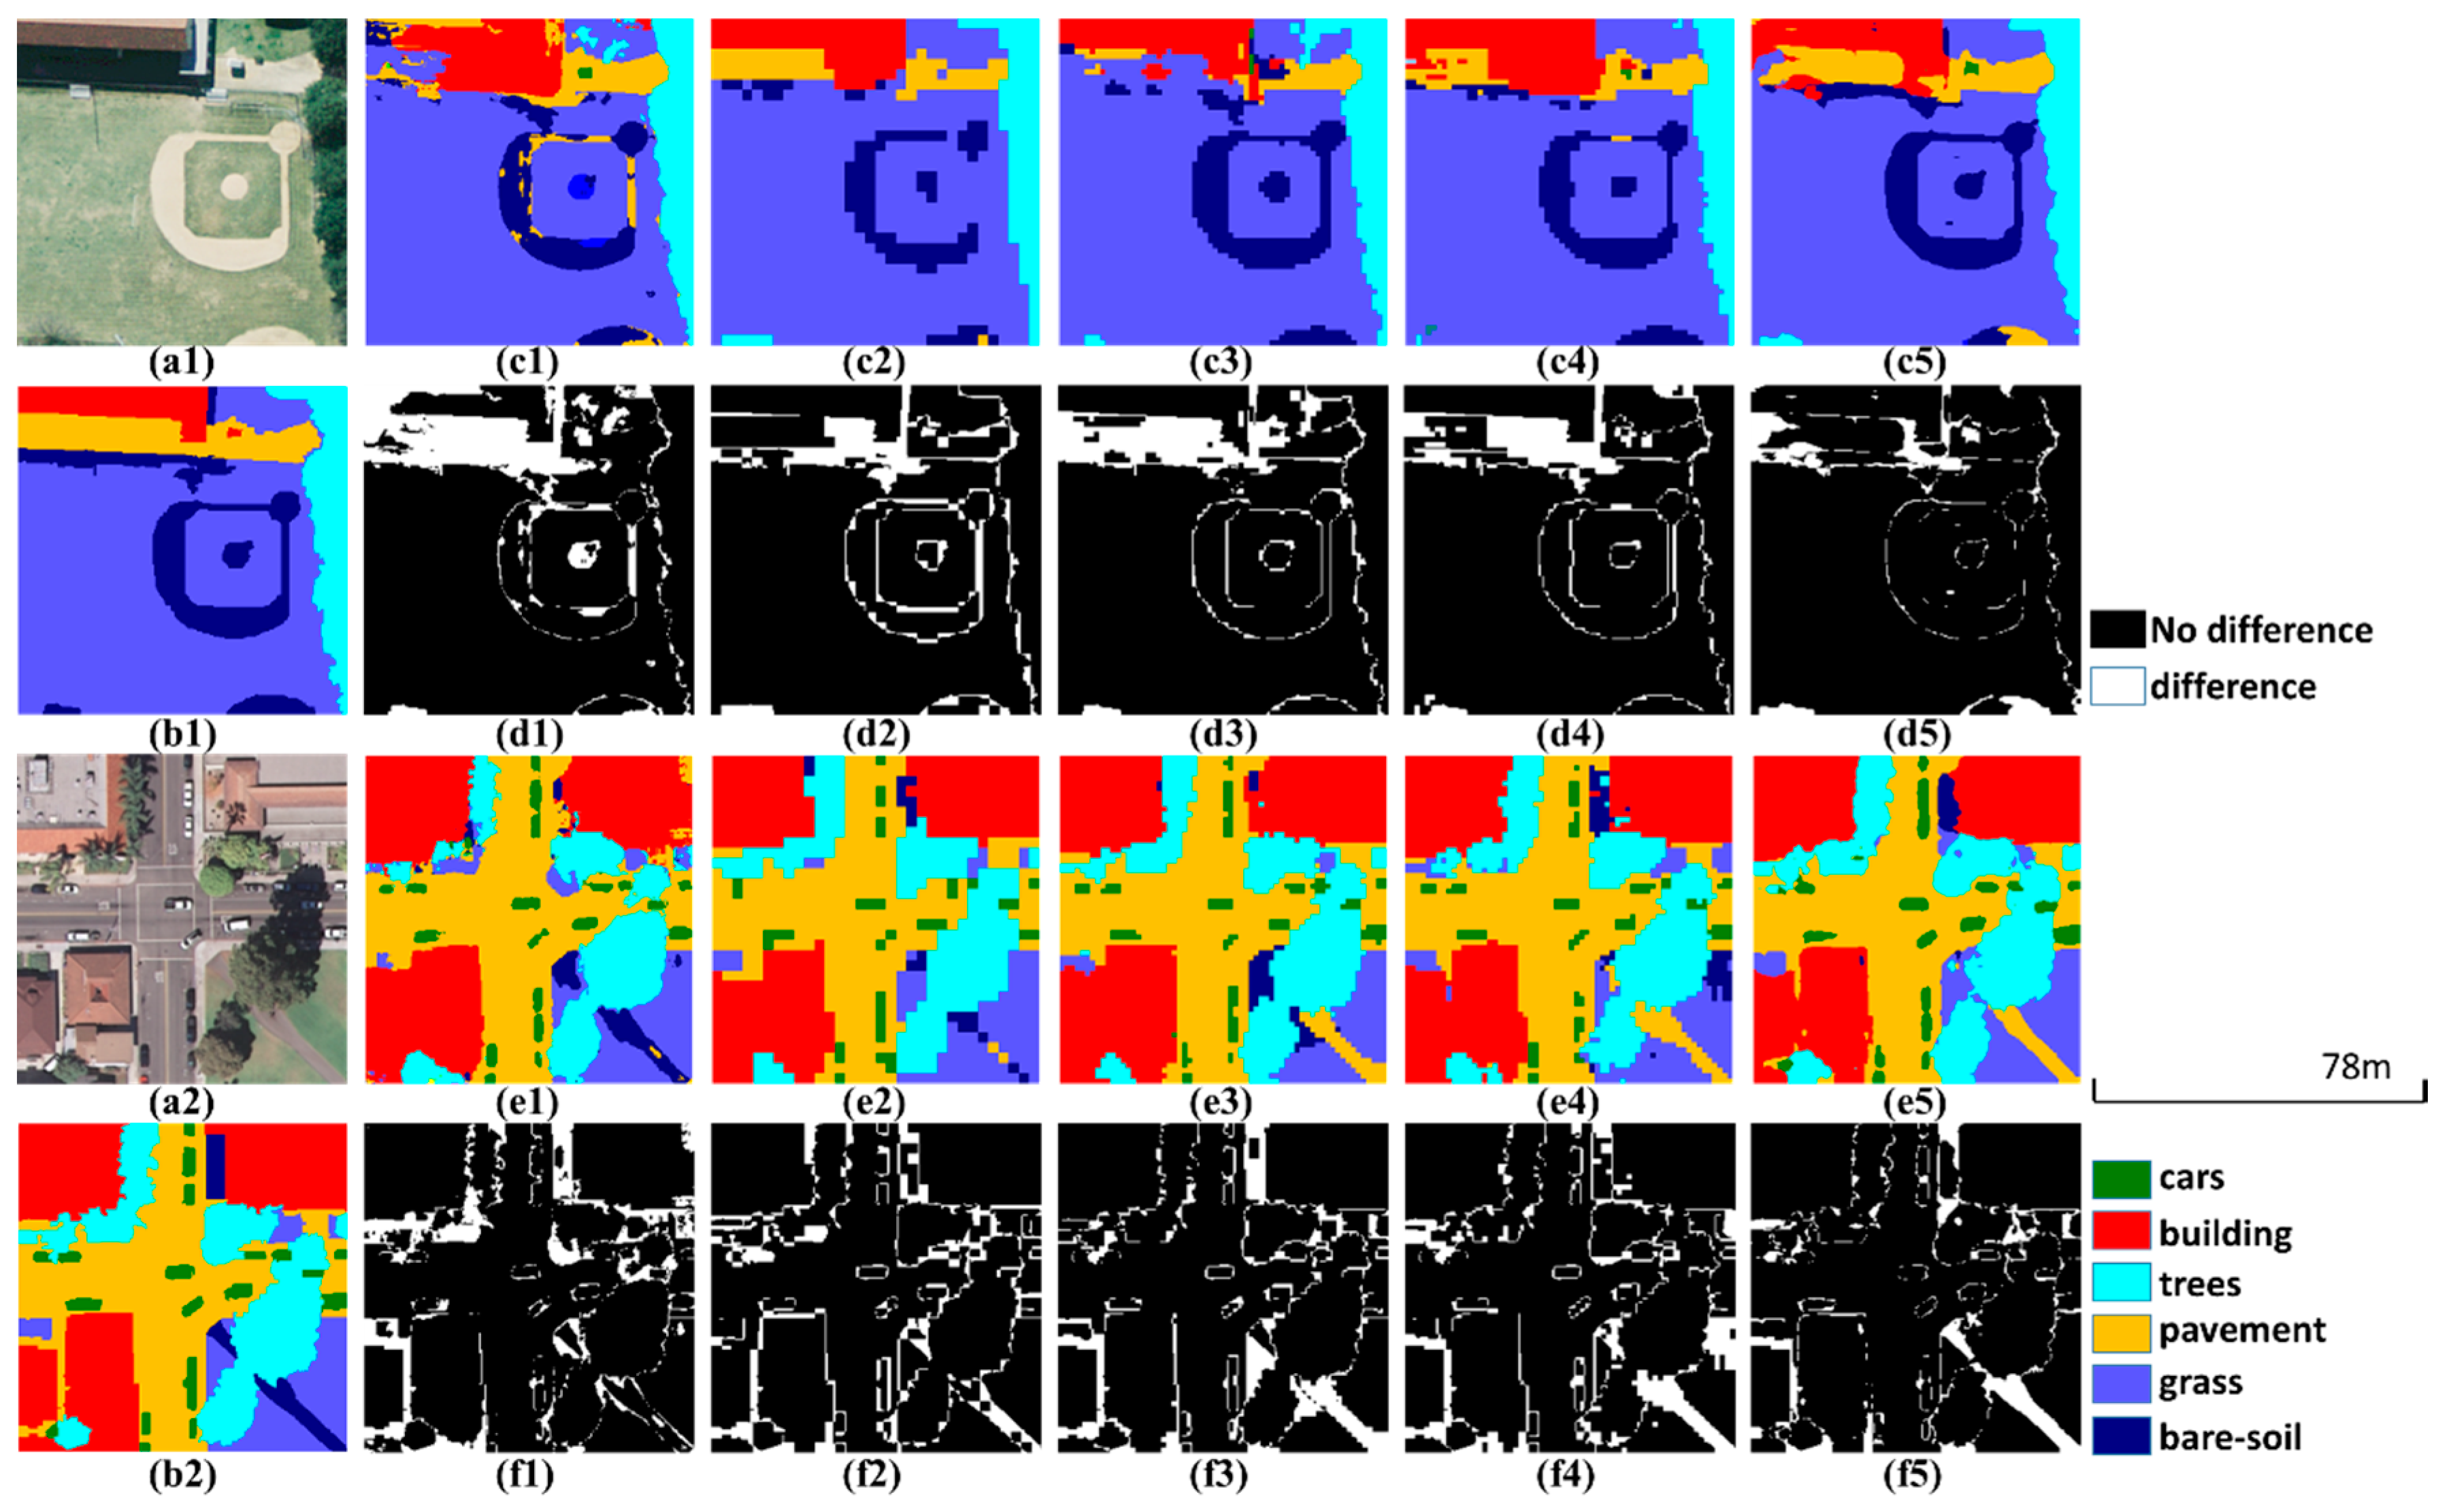
3.3. Experiments on the Public Datasets
4. Conclusions
Author Contributions
Funding
Data Availability Statement
Conflicts of Interest
References
- The Food and Agriculture Organization (FAO). Global Forest Resources Assessment. 2015. Available online: http://www.fao.org/forest-resources-assessment/past-assessments/fra-2015 (accessed on 9 December 2020).
- Cabrera-Barona, P.F.; Bayón, M.; Durán, G.; Bonilla, A.; Mejía, V. Generating and Mapping Amazonian Urban Regions Using a Geospatial Approach. ISPRS Int. J. Geo-Inf. 2020, 9, 453. [Google Scholar] [CrossRef]
- Häme, T.; Kilpi, J.; Ahola, H.; Rauste, Y.; Antropov, O.; Rautiainen, M.; Sirro, L.; Bounepone, S. Improved Mapping of Tropical Forests with Optical and SAR Imagery, Part I: Forest Cover and Accuracy Assessment Using Multi-Resolution Data. IEEE J. Sel. Top. Appl. Earth Obs. Remote Sens. 2013, 6, 74–91. [Google Scholar] [CrossRef]
- Häme, T.; Stenberg, P.; Andersson, K.; Rauste, Y.; Kennedy, P.; Folving, S.; Sarkeala, J. AVHRR-based forest proportion map of the Pan-European area. Remote Sens. Environ. 2001, 77, 76–91. [Google Scholar] [CrossRef]
- Bullock, E.L.; Woodcock, C.E.; Olofsson, P. Monitoring tropical forest degradation using spectral unmixing and Landsat time series analysis. Remote Sens. Environ. 2020, 238, 110968. [Google Scholar] [CrossRef]
- Ghosh, S.M.; Behera, M.D. Aboveground biomass estimation using multi-sensor data synergy and machine learning algorithms in a dense tropical forest. Appl. Geogr. 2018, 96, 29–40. [Google Scholar] [CrossRef]
- Hinton, G.E.; Salakhutdinov, R.R. Reducing the Dimensionality of Data with Neural Networks. Science 2006, 313, 504–507. [Google Scholar] [CrossRef]
- Krizhevsky, A.; Sutskever, I.; Hinton, G.E. Imagenet Classification with Deep Convolutional Neural Networks. Commun. ACM 2017, 60, 84–90. [Google Scholar] [CrossRef]
- Simonyan, K.; Zisserman, A. Very Deep Convolutional Networks for Large-Scale Image Recognition. arXiv 2014, arXiv:1409.1556. [Google Scholar]
- Szegedy, C.; Liu, W.; Jia, Y.; Sermanet, P.; Reed, S.; Anguelov, D.; Erhan, D.; Vanhoucke, V.; Rabinovich, A. Going Deeper With Convolutions. In Proceedings of the IEEE Conference on Computer Vision and Pattern Recognition, Boston, MA, USA, 7–12 June 2015; pp. 1–9. [Google Scholar]
- He, K.; Zhang, X.; Ren, S.; Sun, J. Deep Residual Learning for Image Recognition. In Proceedings of the IEEE Conference on Computer Vision and Pattern Recognition, Las Vegas, NV, USA, 26 June–1 July 2016; pp. 770–778. [Google Scholar]
- Huang, G.; Liu, Z.; Van Der Maaten, L.; Weinberger, K.Q. Densely Connected Convolutional Networks. In Proceedings of the IEEE Conference on Computer Vision and Pattern Recognition, Honolulu, HI, USA, 21–26 July 2017; pp. 4700–4708. [Google Scholar]
- Long, J.; Shelhamer, E.; Darrell, T. Fully Convolutional Networks for Semantic Segmentation. In Proceedings of Proceedings of the IEEE Conference on Computer Vision and Pattern Recognition, Boston, MA, USA, 7–12 June 2015; pp. 3431–3440. [Google Scholar]
- Badrinarayanan, V.; Kendall, A.; Cipolla, R. SegNet: A Deep Convolutional Encoder-Decoder Architecture for Image Segmentation. IEEE Trans. Pattern Anal. Mach. Intell. 2017, 39, 2481–2495. [Google Scholar] [CrossRef]
- Ronneberger, O.; Fischer, P.; Brox, T. U-Net: Convolutional Networks for Biomedical Image Segmentation. In Proceedings of the International Conference on Medical Image Computing and Computer-Assisted Intervention, Munich, Germany, 5–9 October 2015; pp. 234–241. [Google Scholar]
- Chen, L.-C.; Zhu, Y.; Papandreou, G.; Schroff, F.; Adam, H. Encoder-Decoder with Atrous Separable Convolution for Semantic Image Segmentation. In Proceedings of the European Conference on Computer Vision (ECCV), Munich, Germany, 8–14 September 2018; pp. 801–818. [Google Scholar]
- Woo, S.; Park, J.; Lee, J.-Y.; So Kweon, I. CBAM: Convolutional Block Attention Module. In Proceedings of the European Conference on Computer Vision (ECCV), Munich, Germany, 8–14 September 2018; pp. 3–19. [Google Scholar]
- Park, J.; Woo, S.; Lee, J.-Y.; Kweon, I.S. BAM: Bottleneck Attention Module. arXiv 2018, arXiv:1807.06514. [Google Scholar]
- Hoeser, T.; Kuenzer, C. Object Detection and Image Segmentation with Deep Learning on Earth Observation Data: A Review-Part I: Evolution and Recent Trends. Remote Sens. 2020, 12, 1667. [Google Scholar] [CrossRef]
- Kussul, N.; Lavreniuk, M.; Skakun, S.; Shelestov, A. Deep Learning Classification of Land Cover and Crop Types Using Remote Sensing Data. IEEE Geosci. Remote. Sens. Lett. 2017, 14, 778–782. [Google Scholar] [CrossRef]
- Zhu, L.; Chen, Y.; Ghamisi, P.; Benediktsson, J.A. Generative Adversarial Networks for Hyperspectral Image Classification. IEEE Trans. Geosci. Remote Sens. 2018, 56, 5046–5063. [Google Scholar] [CrossRef]
- Liu, Y.; Gao, L.; Xiao, C.; Qu, Y.; Zheng, K.; Marinoni, A. Hyperspectral Image Classification Based on a Shuffled Group Convolutional Neural Network with Transfer Learning. Remote Sens. 2020, 12, 1780. [Google Scholar] [CrossRef]
- Zou, Q.; Ni, L.; Zhang, T.; Wang, Q. Deep Learning Based Feature Selection for Remote Sensing Scene Classification. IEEE Geosci. Remote Sens. Lett. 2015, 12, 2321–2325. [Google Scholar] [CrossRef]
- Zhang, Z.; Liu, Q.; Wang, Y. Road Extraction by Deep Residual U-Net. IEEE Geosci. Remote Sens. Lett. 2018, 15, 749–753. [Google Scholar] [CrossRef]
- Xu, Y.; Xie, Z.; Feng, Y.; Chen, Z. Road Extraction from High-Resolution Remote Sensing Imagery Using Deep Learning. Remote Sens. 2018, 10, 1461. [Google Scholar] [CrossRef]
- Xu, Y.; Wu, L.; Xie, Z.; Chen, Z. Building Extraction in Very High Resolution Remote Sensing Imagery Using Deep Learning and Guided Filters. Remote Sens. 2018, 10, 144. [Google Scholar] [CrossRef]
- Liu, P.; Liu, X.; Liu, M.; Shi, Q.; Yang, J.; Xu, X.; Zhang, Y. Building Footprint Extraction from High-Resolution Images via Spatial Residual Inception Convolutional Neural Network. Remote Sens. 2019, 11, 830. [Google Scholar] [CrossRef]
- Han, X.; Zhiyun, O.; Xiaoke, W.; Jingzhu, Z. Spatial Distribution Characteristics of Soil Erosion in Hainan Island by GIS. J. Soil Water Conserv. 1999, 5, 75–80. [Google Scholar]
- Yang, Y.; Newsam, S. Bag-Of-Visual-Words and Spatial Extensions for Land-Use Classification. In Proceedings of the 18th SIGSPATIAL International Conference on Advances in Geographic Information Systems, San Jose, CA, USA, 2–5 November 2010; pp. 270–279. [Google Scholar]
- Shao, Z.; Yang, K.; Zhou, W. Performance Evaluation of Single-Label and Multi-Label Remote Sensing Image Retrieval Using a Dense Labeling Dataset. Remote Sens. 2018, 10, 964. [Google Scholar] [CrossRef]
- Shao, Z.; Zhou, W.; Deng, X.; Zhang, M.; Cheng, Q. Multilabel Remote Sensing Image Retrieval Based on Fully Convolutional Network. IEEE J. Sel. Top. Appl. Earth Obs. Remote Sens. 2020, 13, 318–328. [Google Scholar] [CrossRef]
- Zhao, H.; Shi, J.; Qi, X.; Wang, X.; Jia, J. Pyramid Scene Parsing Network. In Proceedings of the IEEE Conference on Computer Vision and Pattern Recognition, Honolulu, HI, USA, 21–26 July 2017; pp. 2881–2890. [Google Scholar]
- Sudre, C.H.; Li, W.; Vercauteren, T.; Ourselin, S.; Cardoso, M.J. Generalised Dice Overlap as a Deep Learning Loss Function for Highly Unbalanced Segmentations. In Deep Learning in Medical Image Analysis and Multimodal Learning for Clinical Decision Support; Springer: Cham, Switzerland, 2017; pp. 240–248. [Google Scholar]
- Lin, T.-Y.; Goyal, P.; Girshick, R.; He, K.; Dollár, P. Focal Loss for Dense Object Detection. In Proceedings of the IEEE International Conference on Computer Vision, Venice, Italy, 22–29 October 2017; pp. 2980–2988. [Google Scholar]
- Milletari, F.; Navab, N.; Ahmadi, S.-A. V-Net: Fully Convolutional Neural Networks for Volumetric Medical Image Segmentation. In Proceedings of the 2016 Fourth International Conference on 3D Vision (3DV), Stanford, CA, USA, 25–28 October 2016; pp. 565–571. [Google Scholar]
- Rahman, M.A.; Wang, Y. Optimizing Intersection-Over-Union in Deep Neural Networks for Image Segmentation. In Proceedings of the International Symposium on Visual Computing, Las Vegas, NV, USA, 12–14 December 2016; pp. 234–244. [Google Scholar]
- He, K.; Zhang, X.; Ren, S.; Sun, J. Delving Deep into Rectifiers: Surpassing Human-Level Performance on ImageNet Classification. In Proceedings of the IEEE International Conference on Computer Vision, Santiago, Chile, 13–16 December 2015; pp. 1026–1034. [Google Scholar]


| Satellite | B1 (μm) | B2 (μm) | B3 (μm) | B4 (μm) | Panchromatic (μm) | |
|---|---|---|---|---|---|---|
| GF-1 | Wavelength | 0.45–0.52 | 0.52–0.59 | 0.63–0.69 | 0.77–0.89 | 0.45–0.90 |
| Resolution | 8 m | 2 m | ||||
| GF-2 | Wavelength | 0.45–0.52 | 0.52–0.59 | 0.63–0.69 | 0.77–0.89 | 0.45–0.90 |
| Resolution | 4 m | 1 m | ||||
| ZY-3 | Wavelength | 0.45–0.52 | 0.52–0.59 | 0.63–0.69 | 0.77–0.89 | 0.45–0.80 |
| Resolution | 6 m | 2 m | ||||
| Nets | Training (Seconds/Epoch) | Prediction (Seconds/1,000,000 Pixel) |
|---|---|---|
| U-Net | 80 | 0.69 |
| PSPNet (ResNet-50) | 85 | 0.83 |
| DeepLabv3+ (ResNet-50) | 73 | 0.89 |
| U-Net (ResNet-50) | 50 | 0.63 |
| ResMANet | 74 | 0.85 |
| Nets | PA | UA | OA | MIoU |
|---|---|---|---|---|
| U-Net | 88.98% | 89.05% | 90.02% | 80.51% |
| PSPNet (ResNet-50) | 91.70% | 89.67% | 91.75% | 83.06% |
| DeepLabv3+ (ResNet-50) | 90.70% | 91.05% | 92.10% | 83.39% |
| U-Net (ResNet-50) | 91.03% | 89.84% | 91.51% | 82.71% |
| ResMANet (CEL) | 89.73% | 89.31% | 90.51% | 81.16% |
| ResMANet | 92.20% | 92.23% | 92.80% | 85.78% |
| Nets | Training (Seconds/Epoch) | Prediction (Seconds/1,000,000 Pixel) |
|---|---|---|
| U-Net | 35 | 0.68 |
| PSPNet (ResNet-50) | 37 | 0.79 |
| DeepLabv3+ (ResNet-50) | 32 | 0.88 |
| U-Net (ResNet-50) | 22 | 0.60 |
| ResMANet | 30 | 0.71 |
| Nets | PA | UA | OA | MIoU |
|---|---|---|---|---|
| U-Net | 88.28% | 83.22% | 90.00% | 75.47% |
| PSPNet (ResNet-50) | 88.47% | 86.67% | 90.95% | 78.15% |
| DeepLabv3+ (ResNet-50) | 89.50% | 87.43% | 91.83% | 79.60% |
| U-Net (ResNet-50) | 88.43% | 88.16% | 91.45% | 79.38% |
| ResMANet (CEL) | 89.83% | 87.58% | 92.08% | 80.00% |
| ResMANet | 91.10% | 90.02% | 93.17% | 82.85% |
| Nets | PA | UA | OA | MIoU |
|---|---|---|---|---|
| U-Net | 85.63% | 83.04% | 83.89% | 73.37% |
| PSPNet (ResNet-50) | 87.79% | 87.58% | 90.65% | 79.03% |
| DeepLabv3+ (ResNet-50) | 89.47% | 89.71% | 90.82% | 80.04% |
| U-Net (ResNet-50) | 87.86% | 85.26% | 88.41% | 76.79% |
| ResMANet | 90.97% | 90.90% | 91.52% | 83.75% |
Publisher’s Note: MDPI stays neutral with regard to jurisdictional claims in published maps and institutional affiliations. |
© 2021 by the authors. Licensee MDPI, Basel, Switzerland. This article is an open access article distributed under the terms and conditions of the Creative Commons Attribution (CC BY) license (http://creativecommons.org/licenses/by/4.0/).
Share and Cite
Yu, T.; Wu, W.; Gong, C.; Li, X. Residual Multi-Attention Classification Network for A Forest Dominated Tropical Landscape Using High-Resolution Remote Sensing Imagery. ISPRS Int. J. Geo-Inf. 2021, 10, 22. https://doi.org/10.3390/ijgi10010022
Yu T, Wu W, Gong C, Li X. Residual Multi-Attention Classification Network for A Forest Dominated Tropical Landscape Using High-Resolution Remote Sensing Imagery. ISPRS International Journal of Geo-Information. 2021; 10(1):22. https://doi.org/10.3390/ijgi10010022
Chicago/Turabian StyleYu, Tong, Wenjin Wu, Chen Gong, and Xinwu Li. 2021. "Residual Multi-Attention Classification Network for A Forest Dominated Tropical Landscape Using High-Resolution Remote Sensing Imagery" ISPRS International Journal of Geo-Information 10, no. 1: 22. https://doi.org/10.3390/ijgi10010022
APA StyleYu, T., Wu, W., Gong, C., & Li, X. (2021). Residual Multi-Attention Classification Network for A Forest Dominated Tropical Landscape Using High-Resolution Remote Sensing Imagery. ISPRS International Journal of Geo-Information, 10(1), 22. https://doi.org/10.3390/ijgi10010022