Determining Cover Management Factor with Remote Sensing and Spatial Analysis for Improving Long-Term Soil Loss Estimation in Watersheds


Abstract
1. Introduction
2. Methods
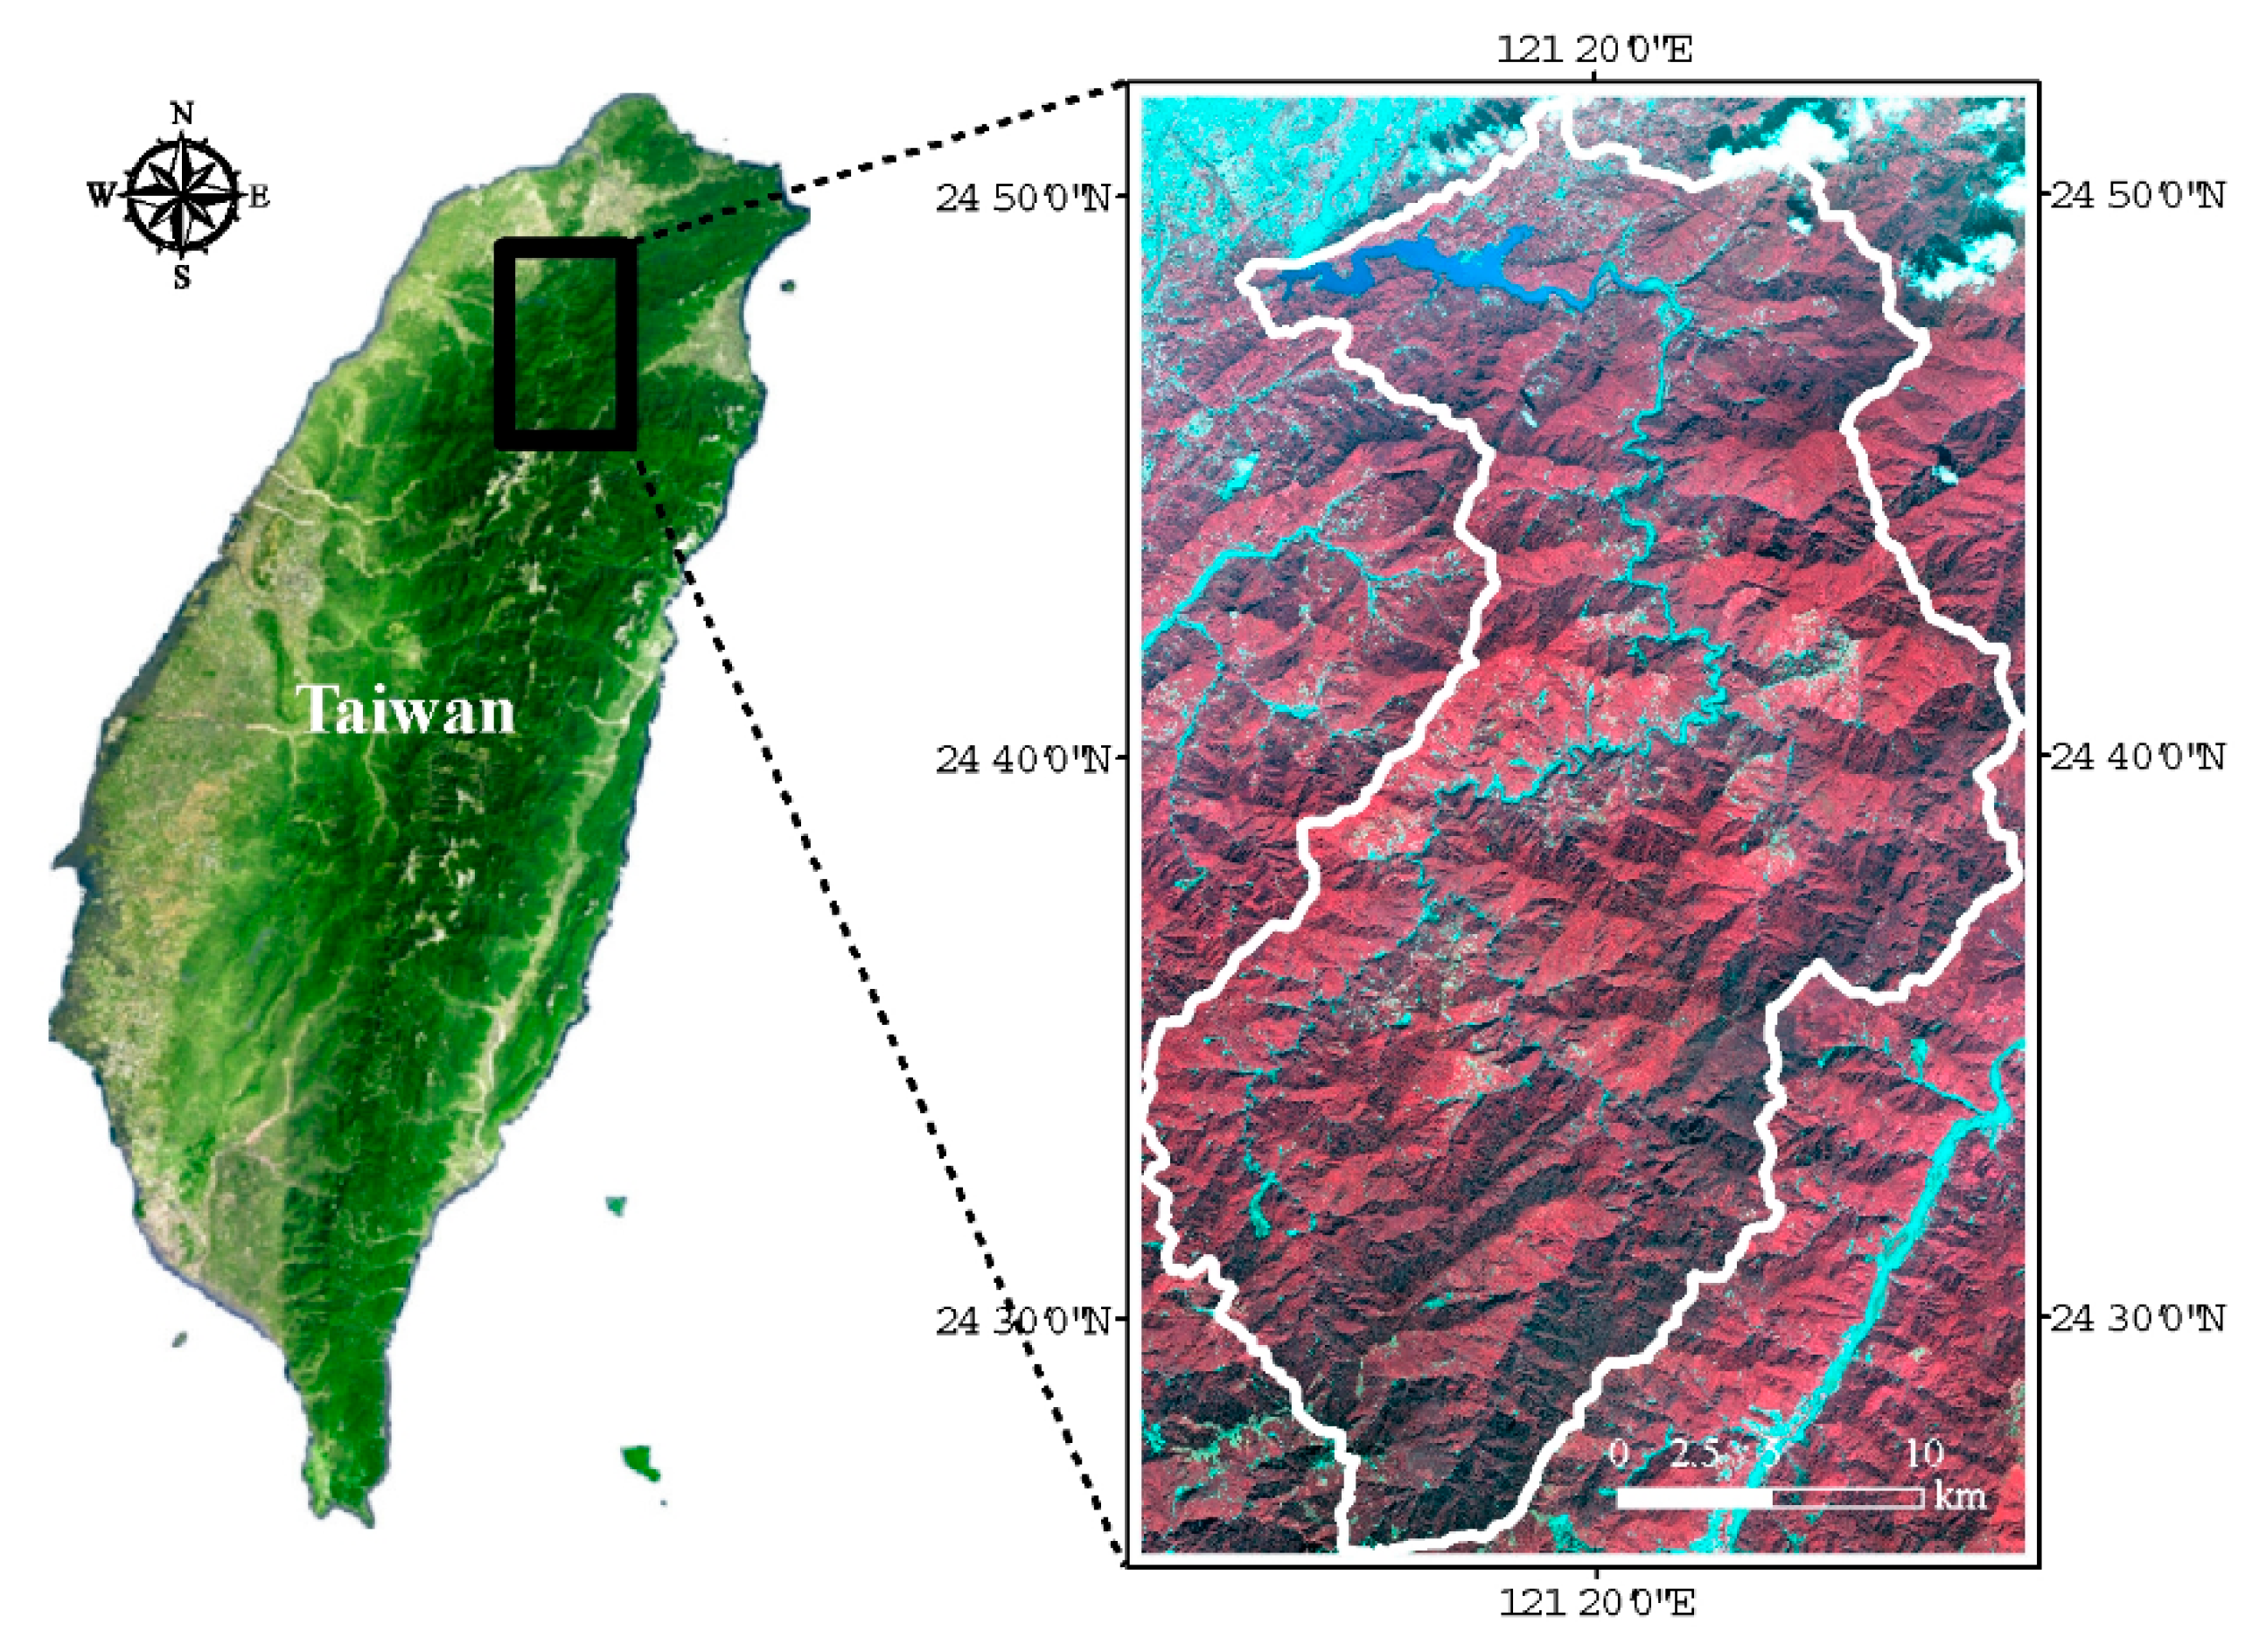
2.1. Study Area
2.2. Materials and Data Preprocessing
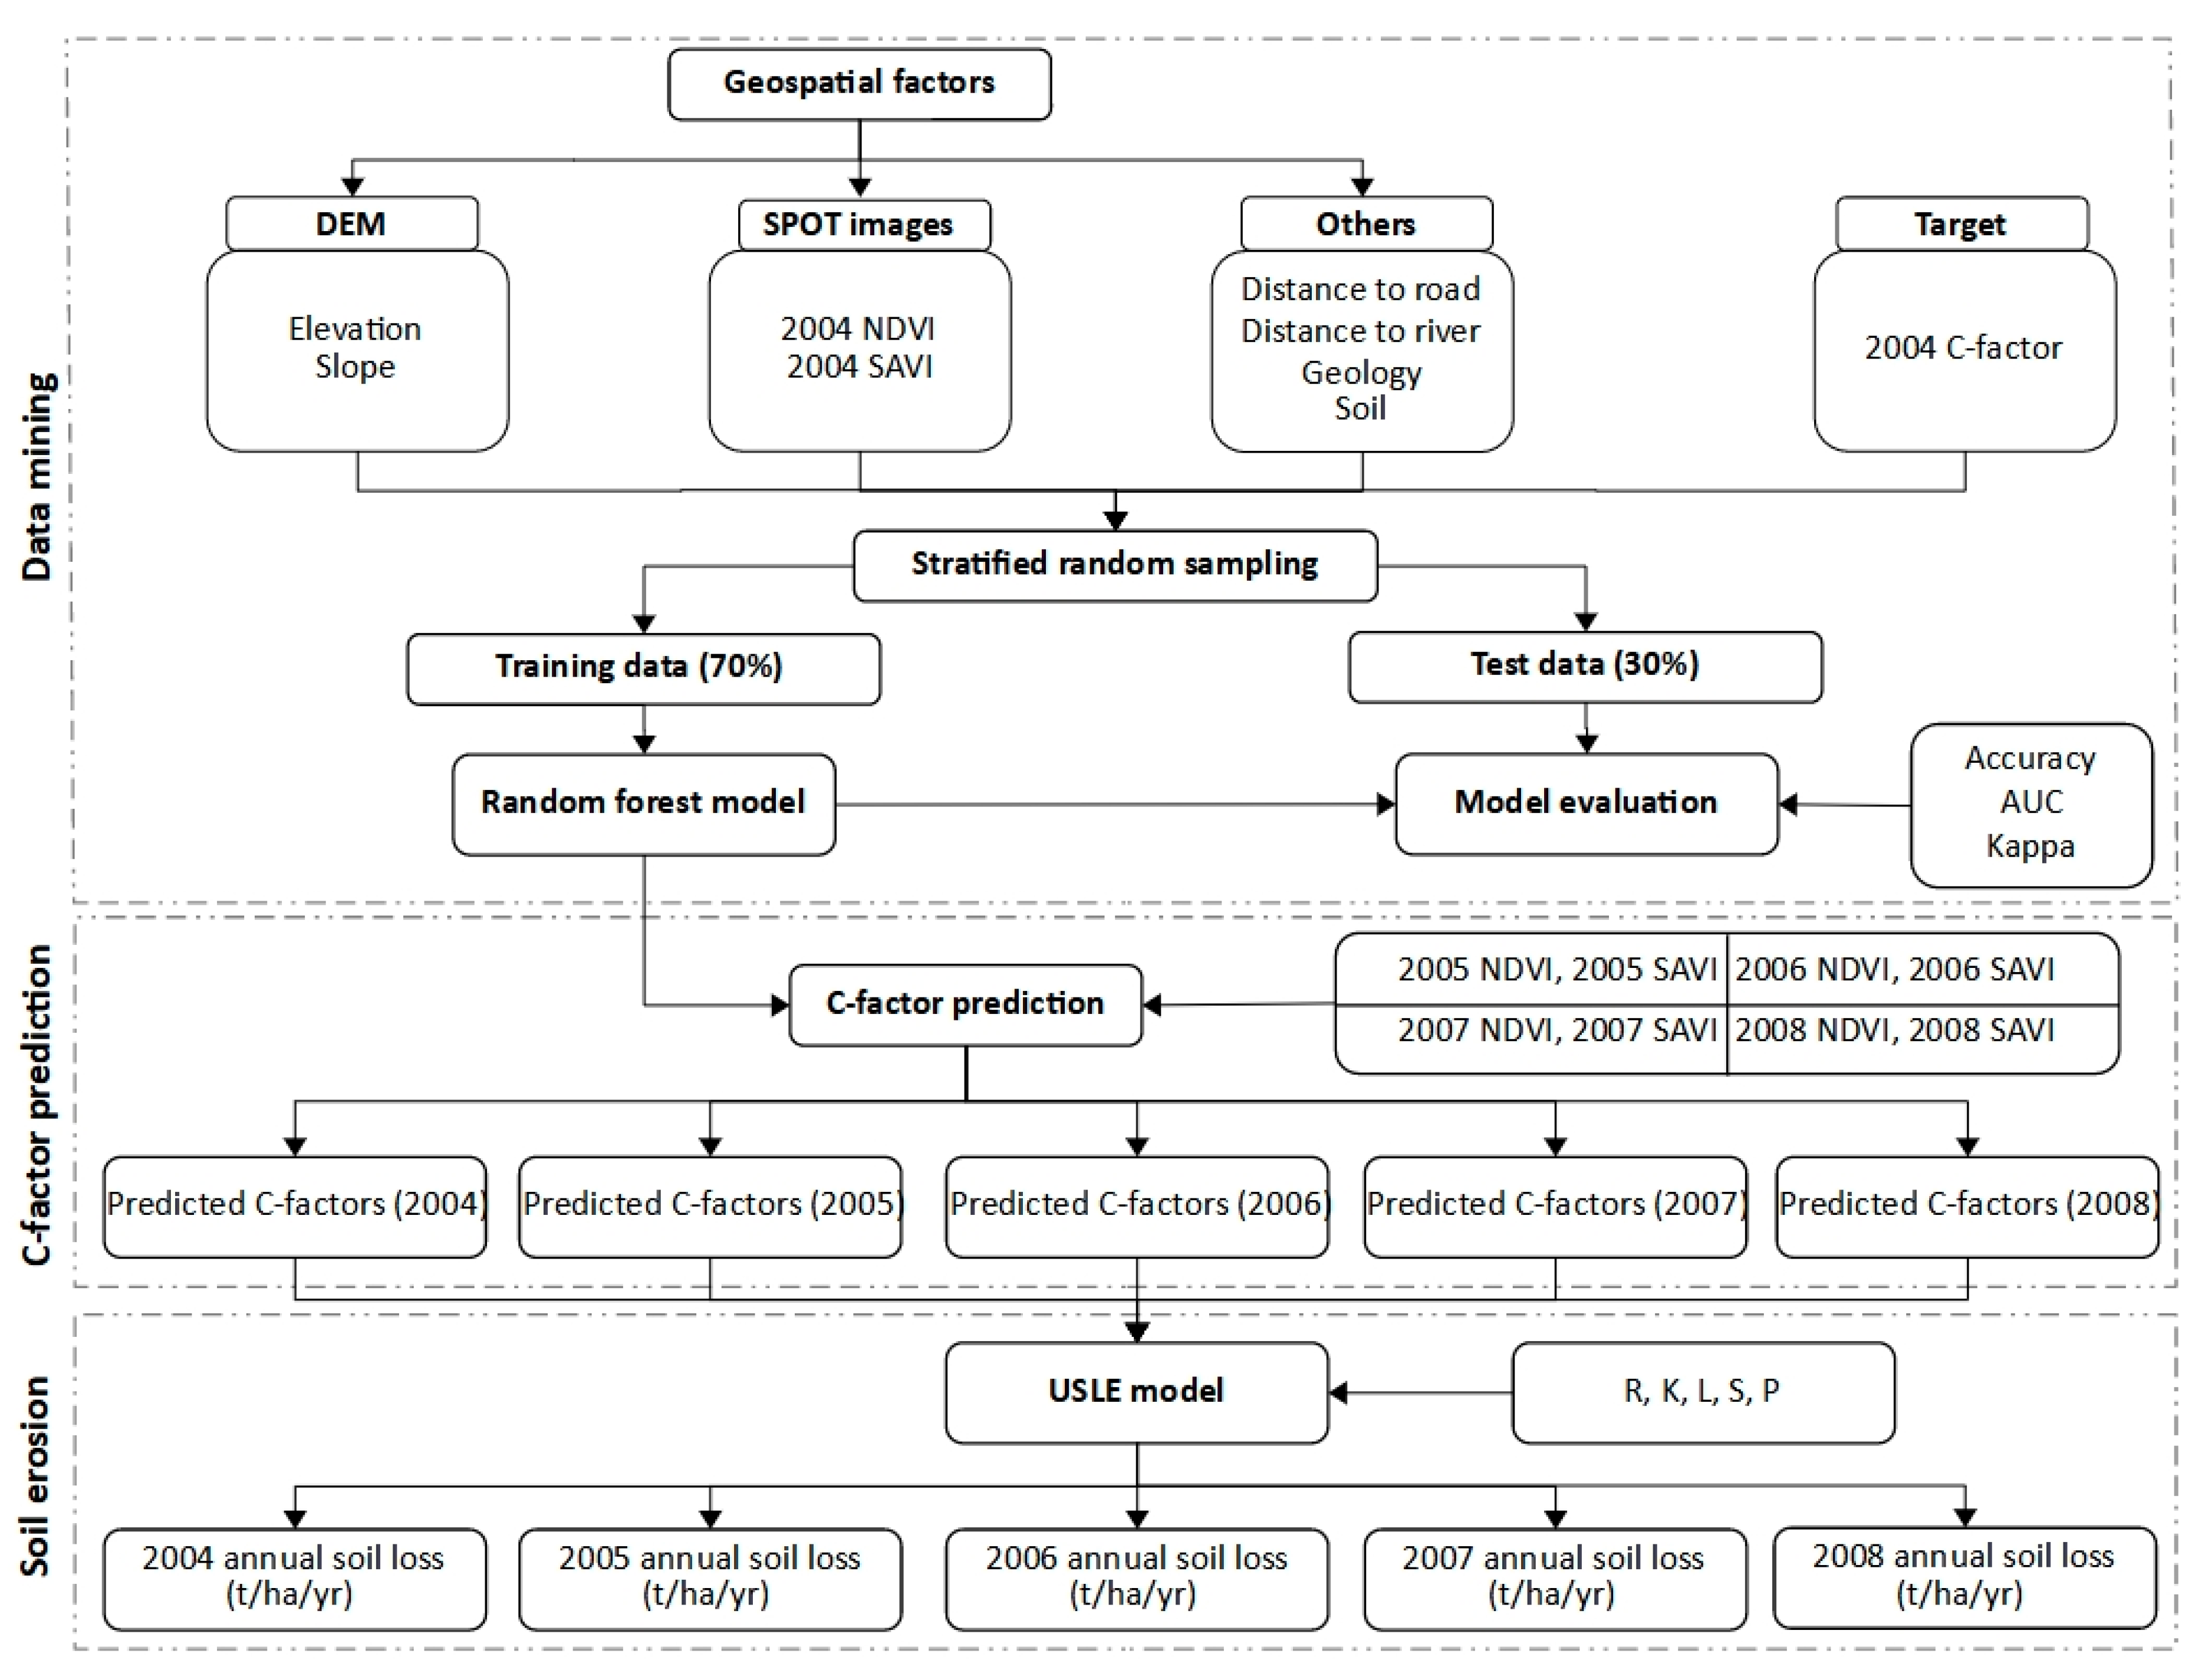
2.3. Data Mining Analysis
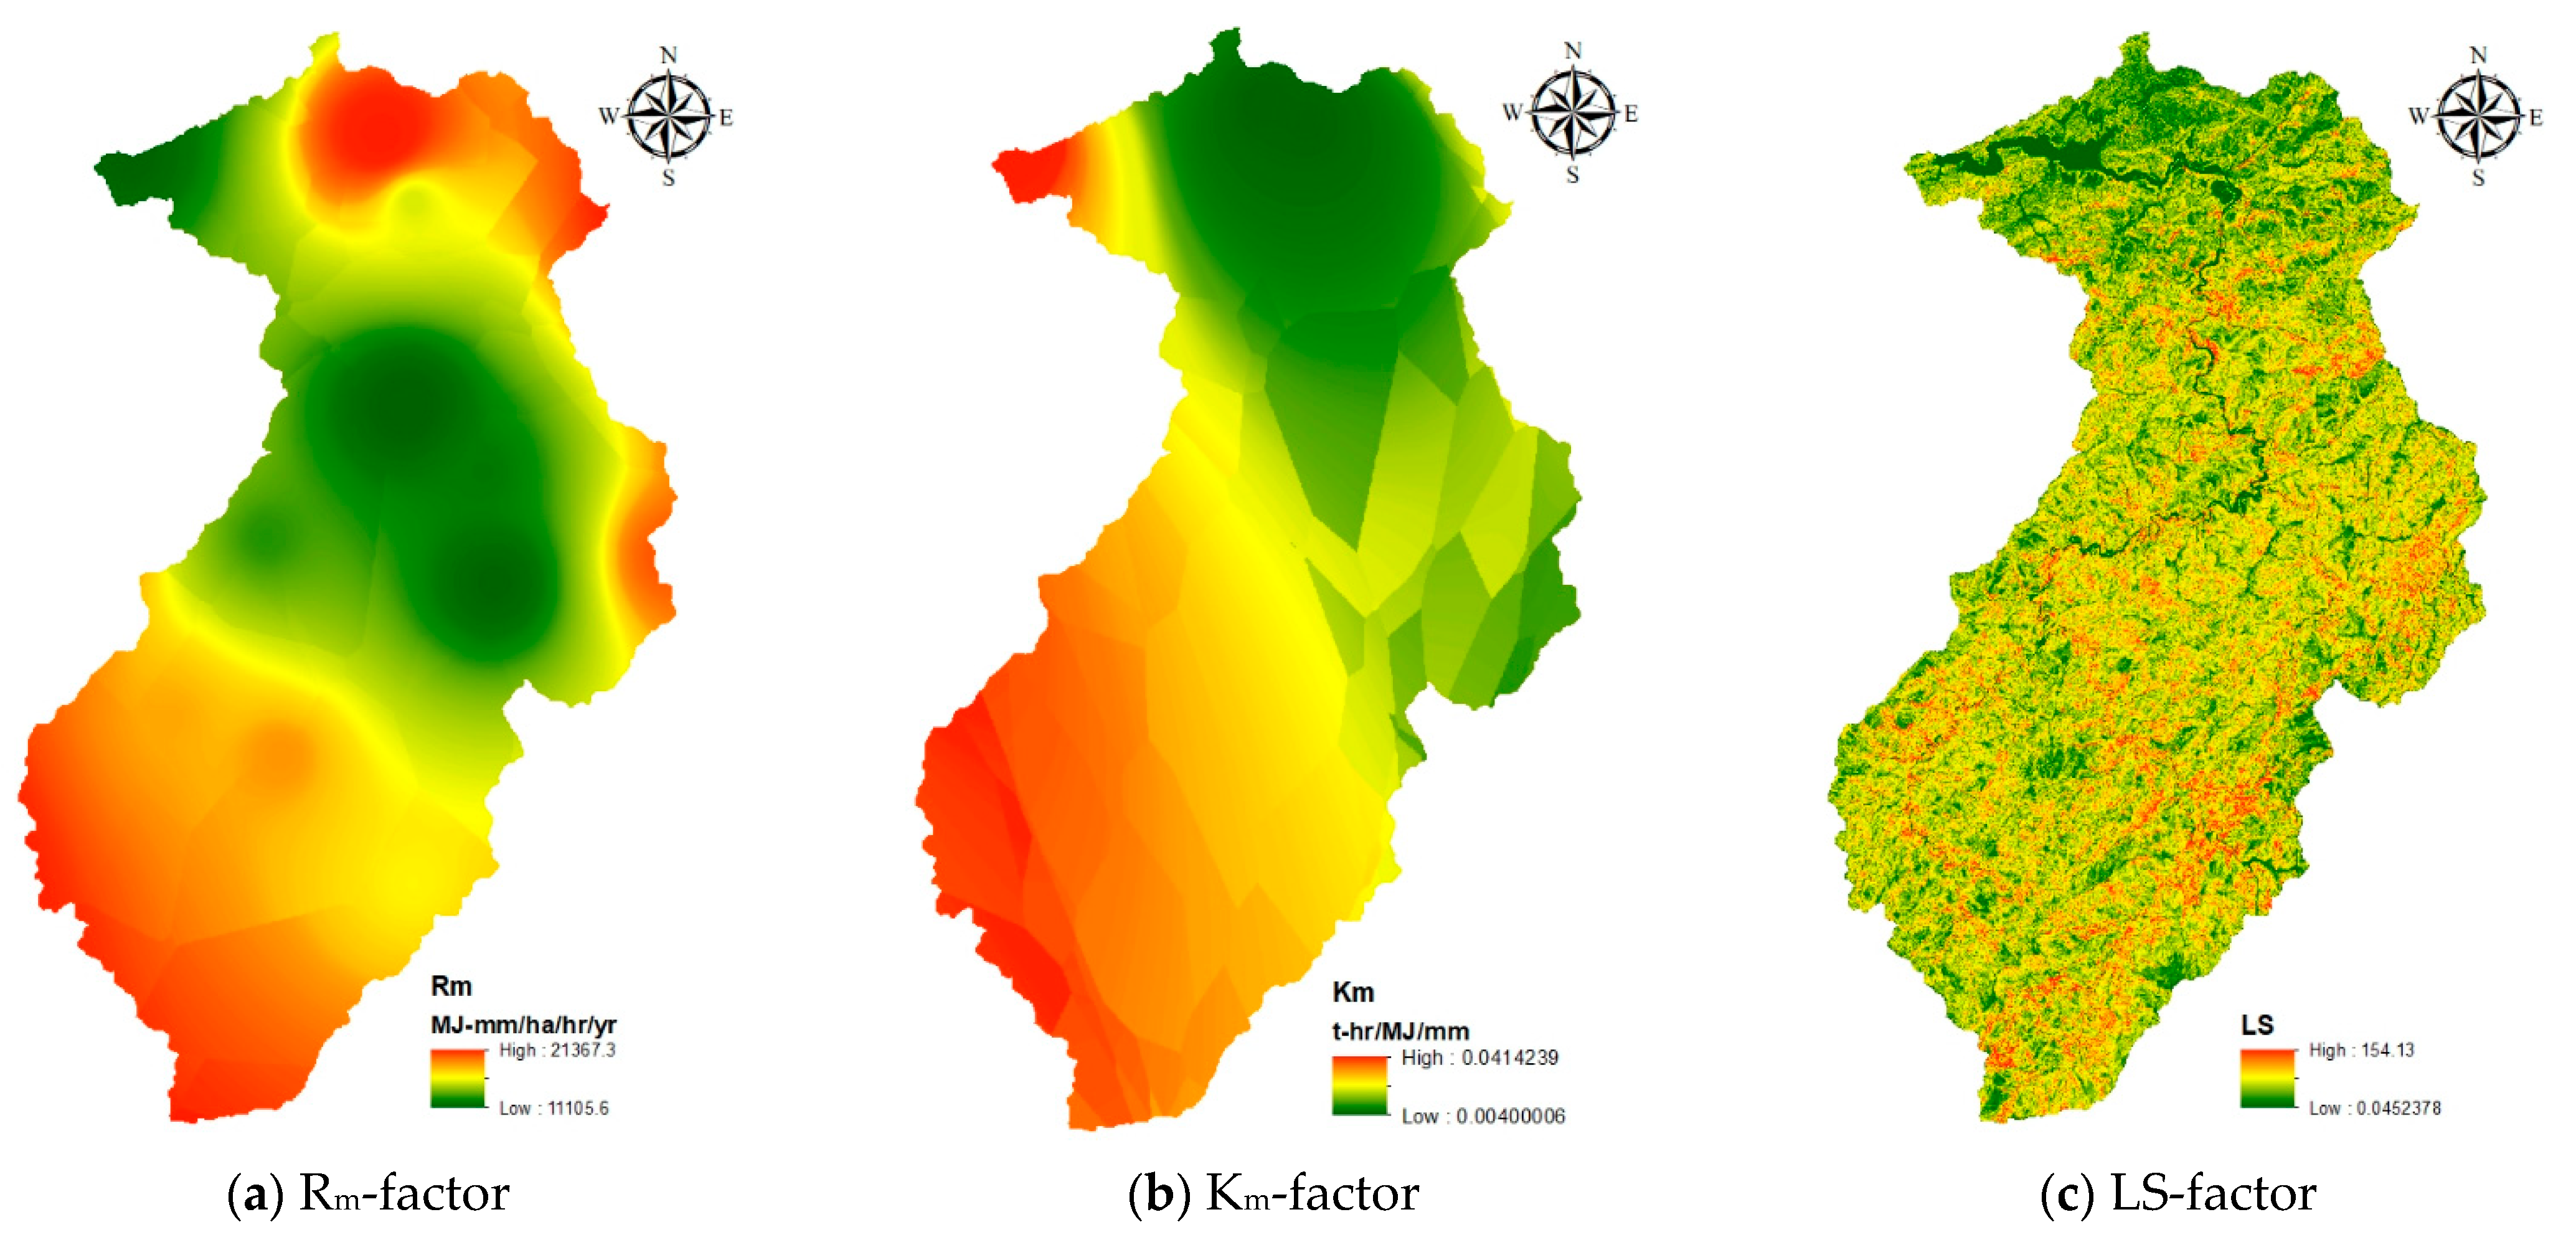
2.4. USLE Computation
3. Results and Discussion
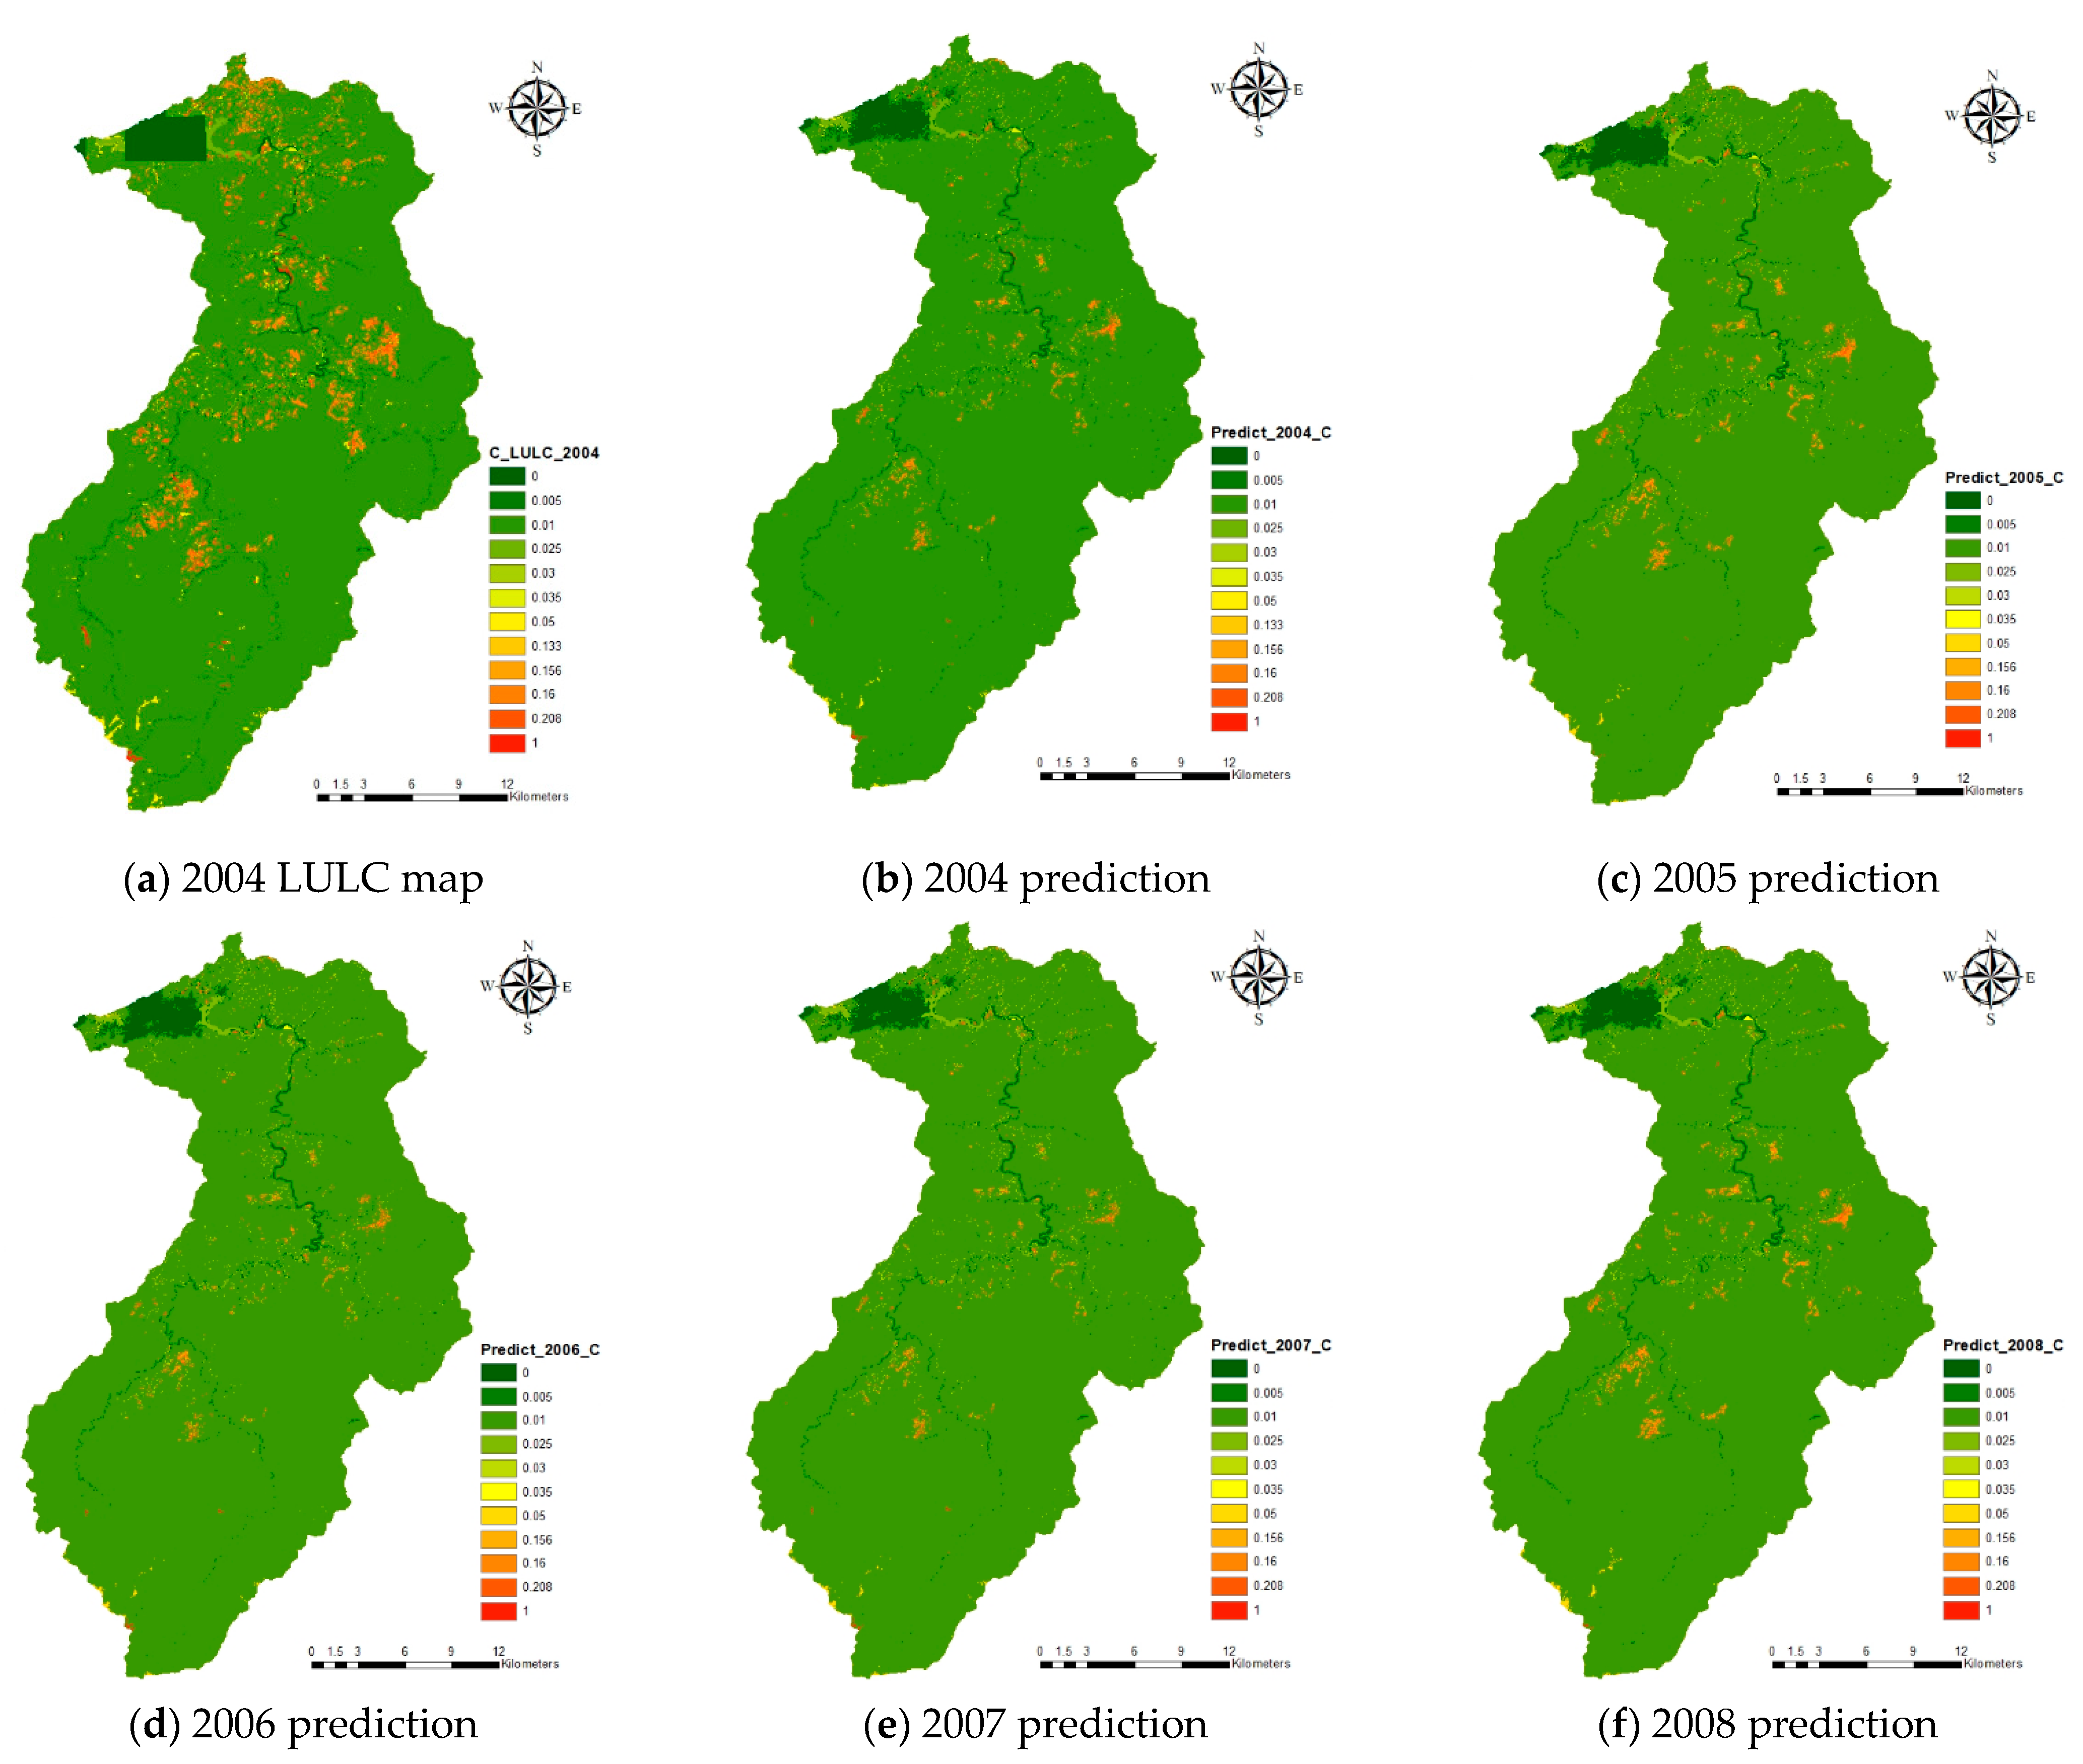
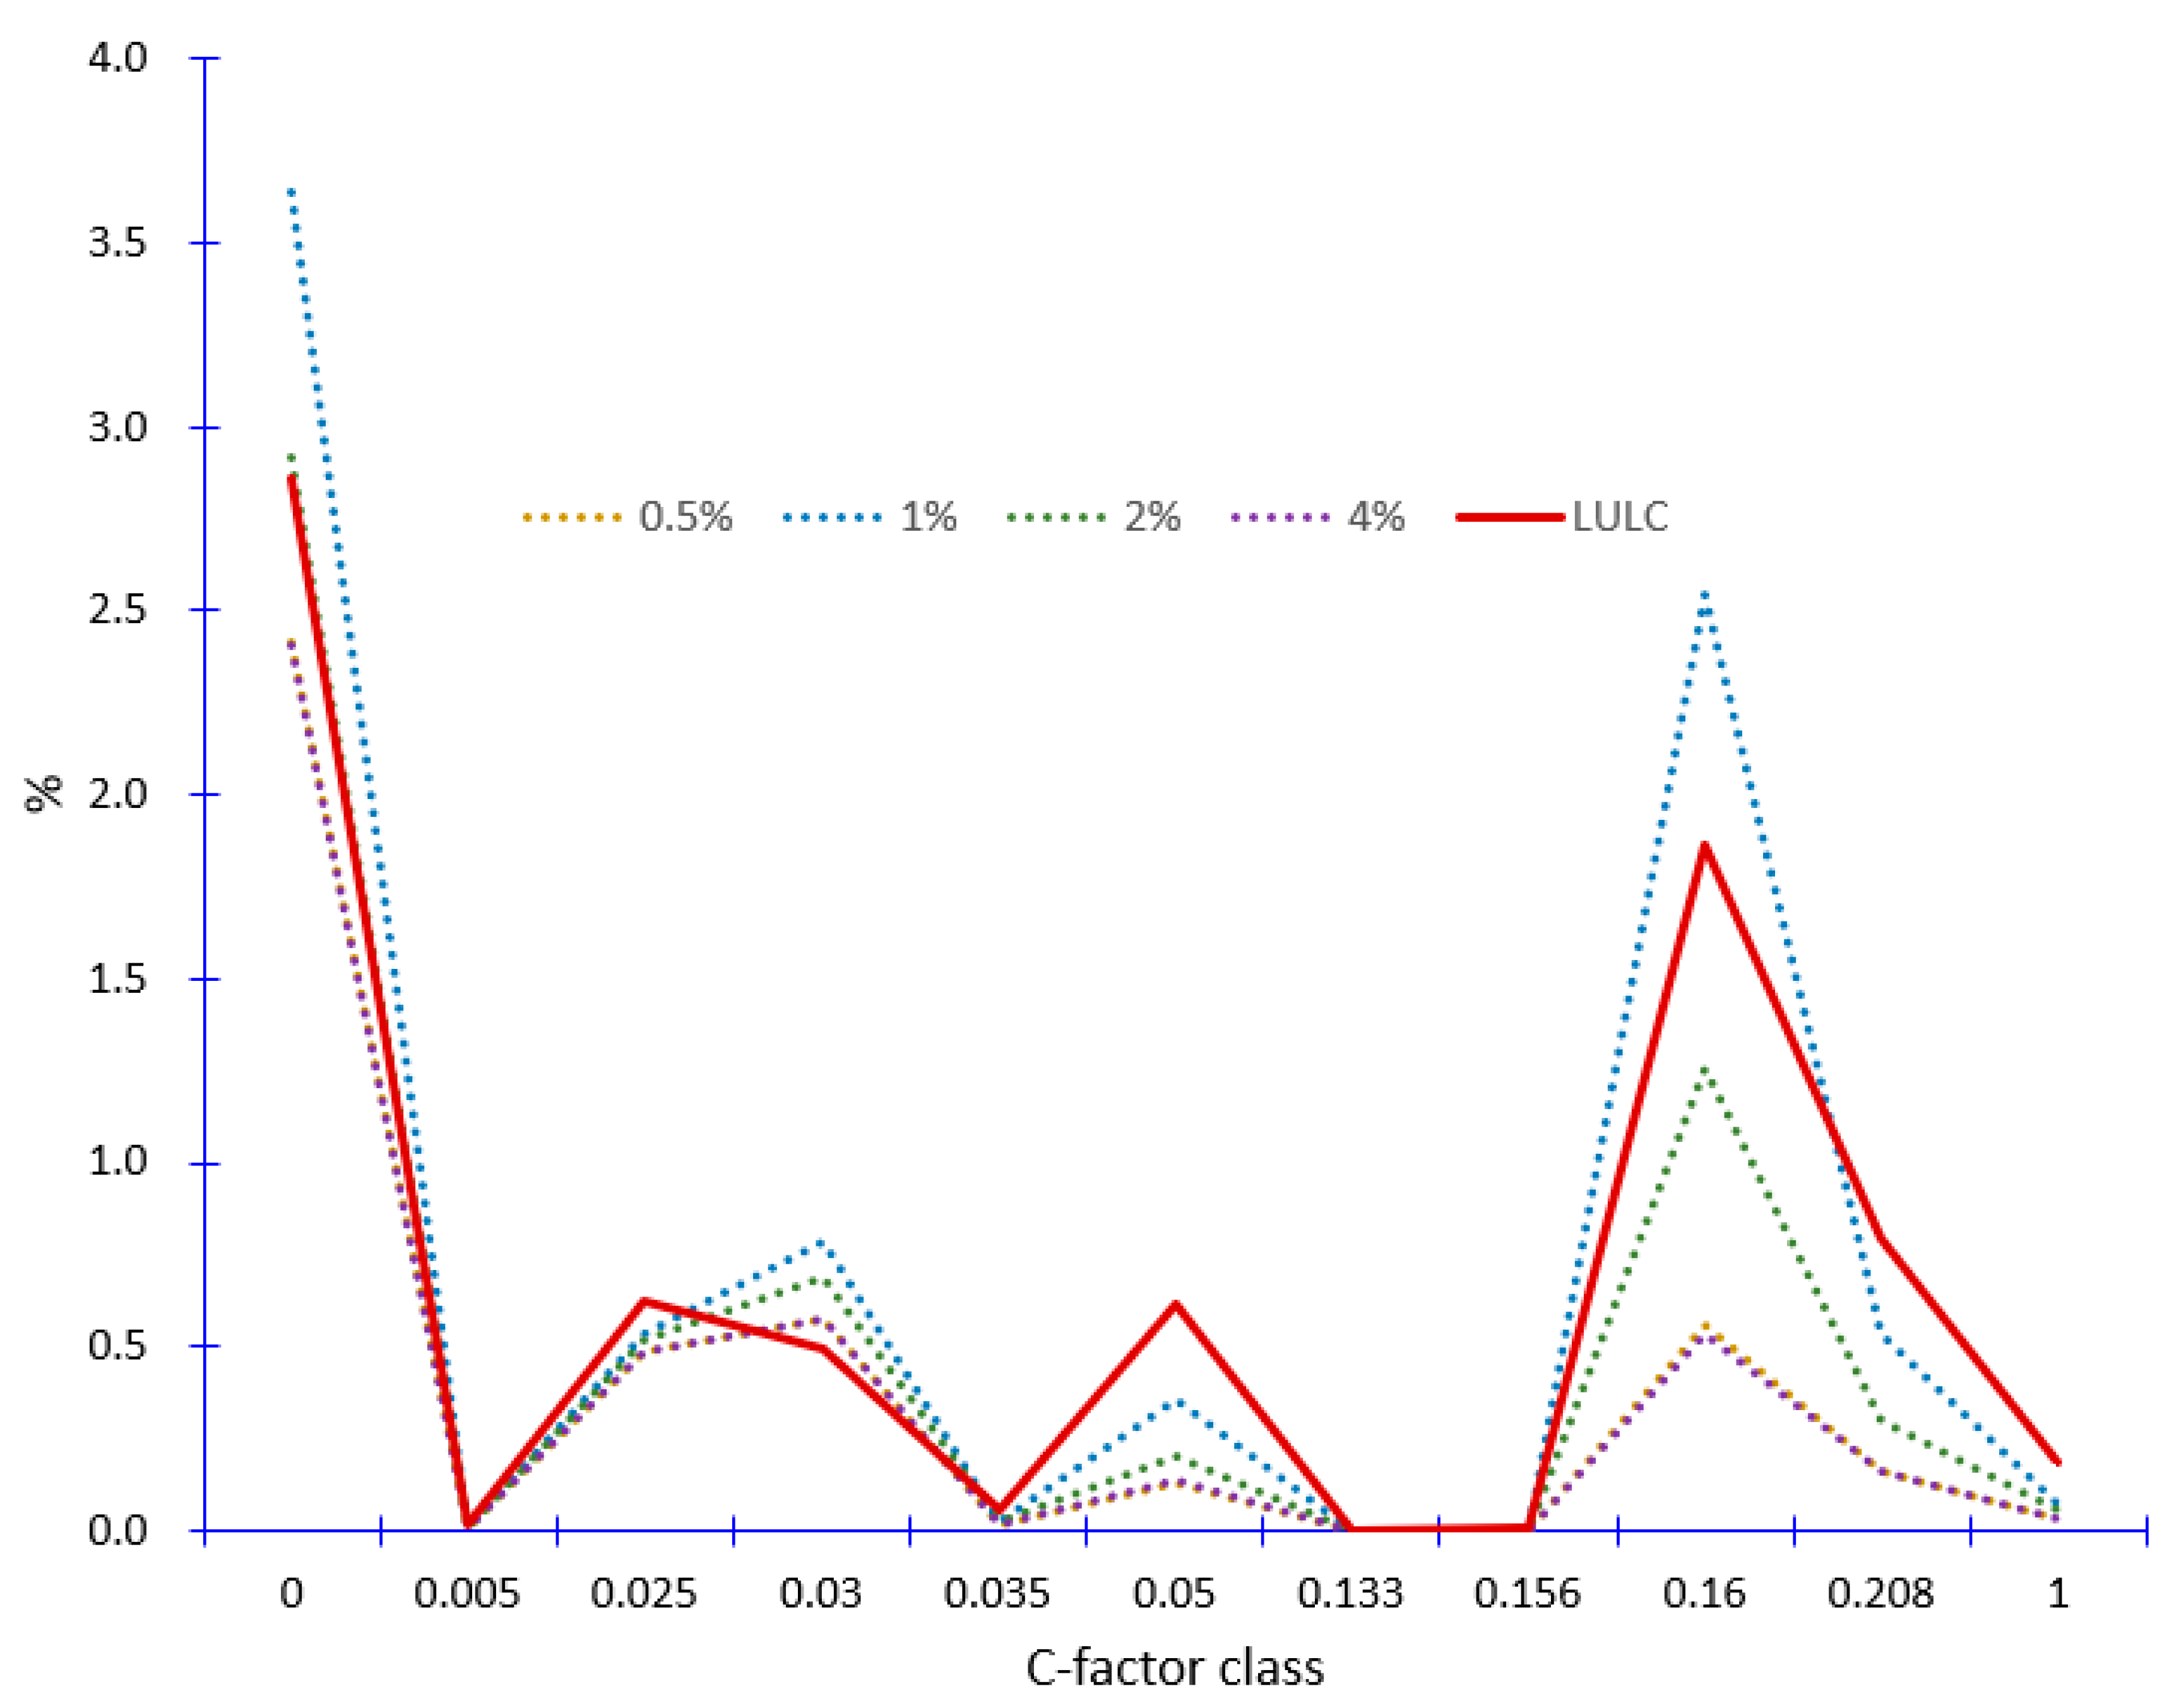
3.1. Cover-Management Factor Modeling
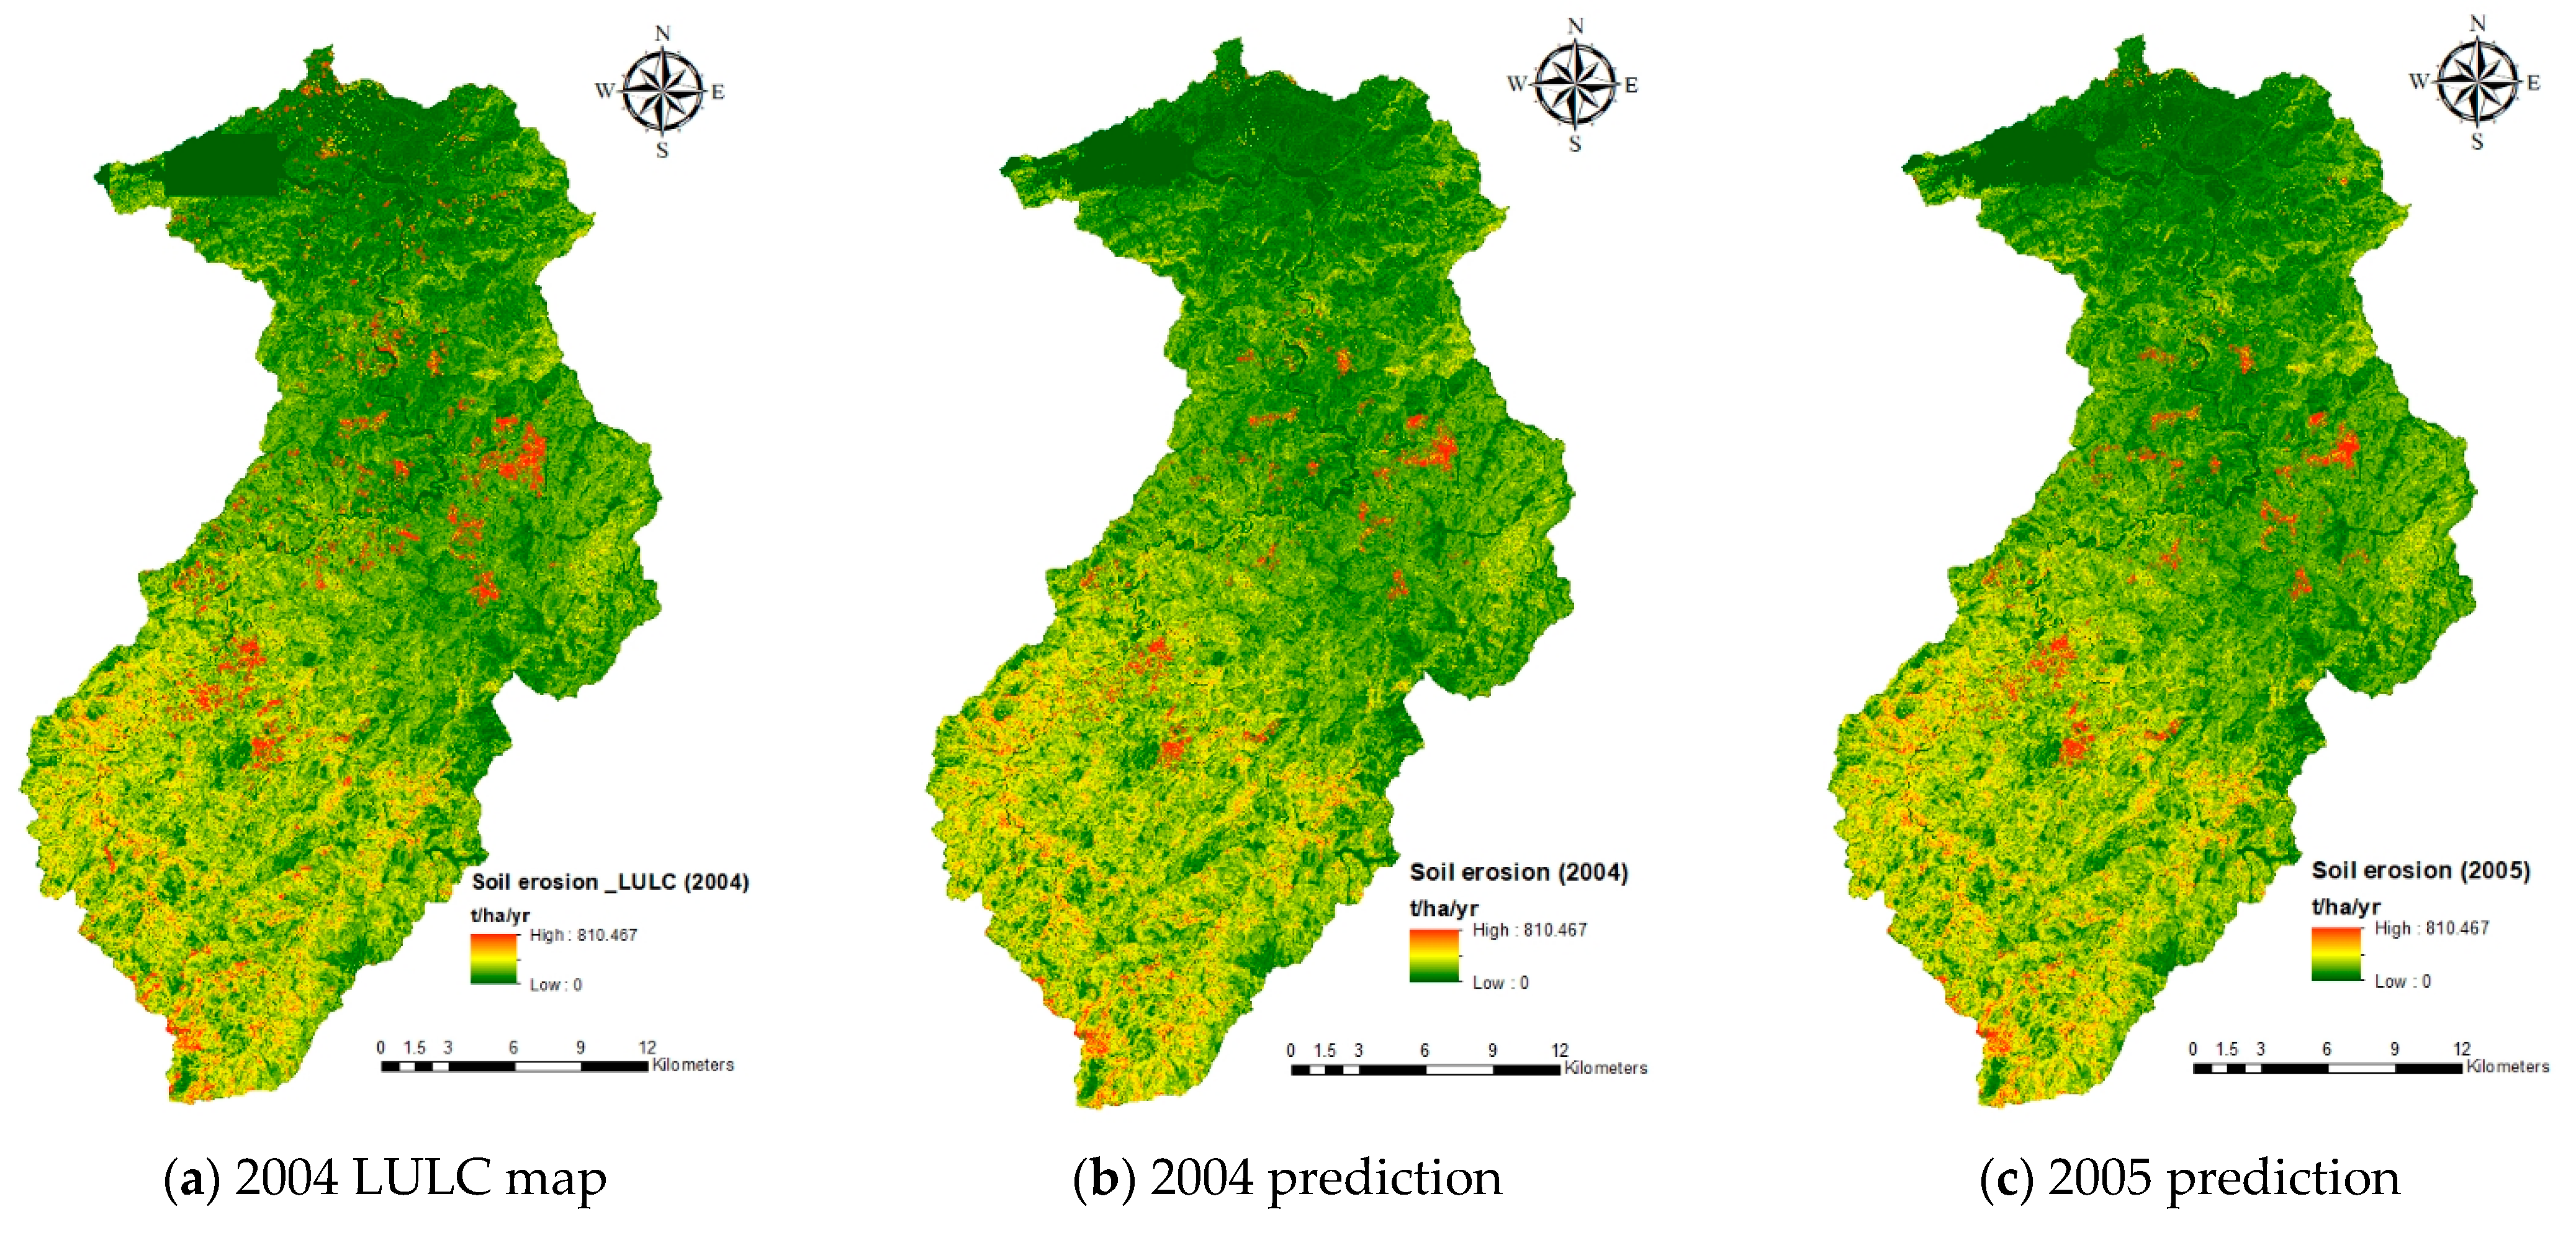
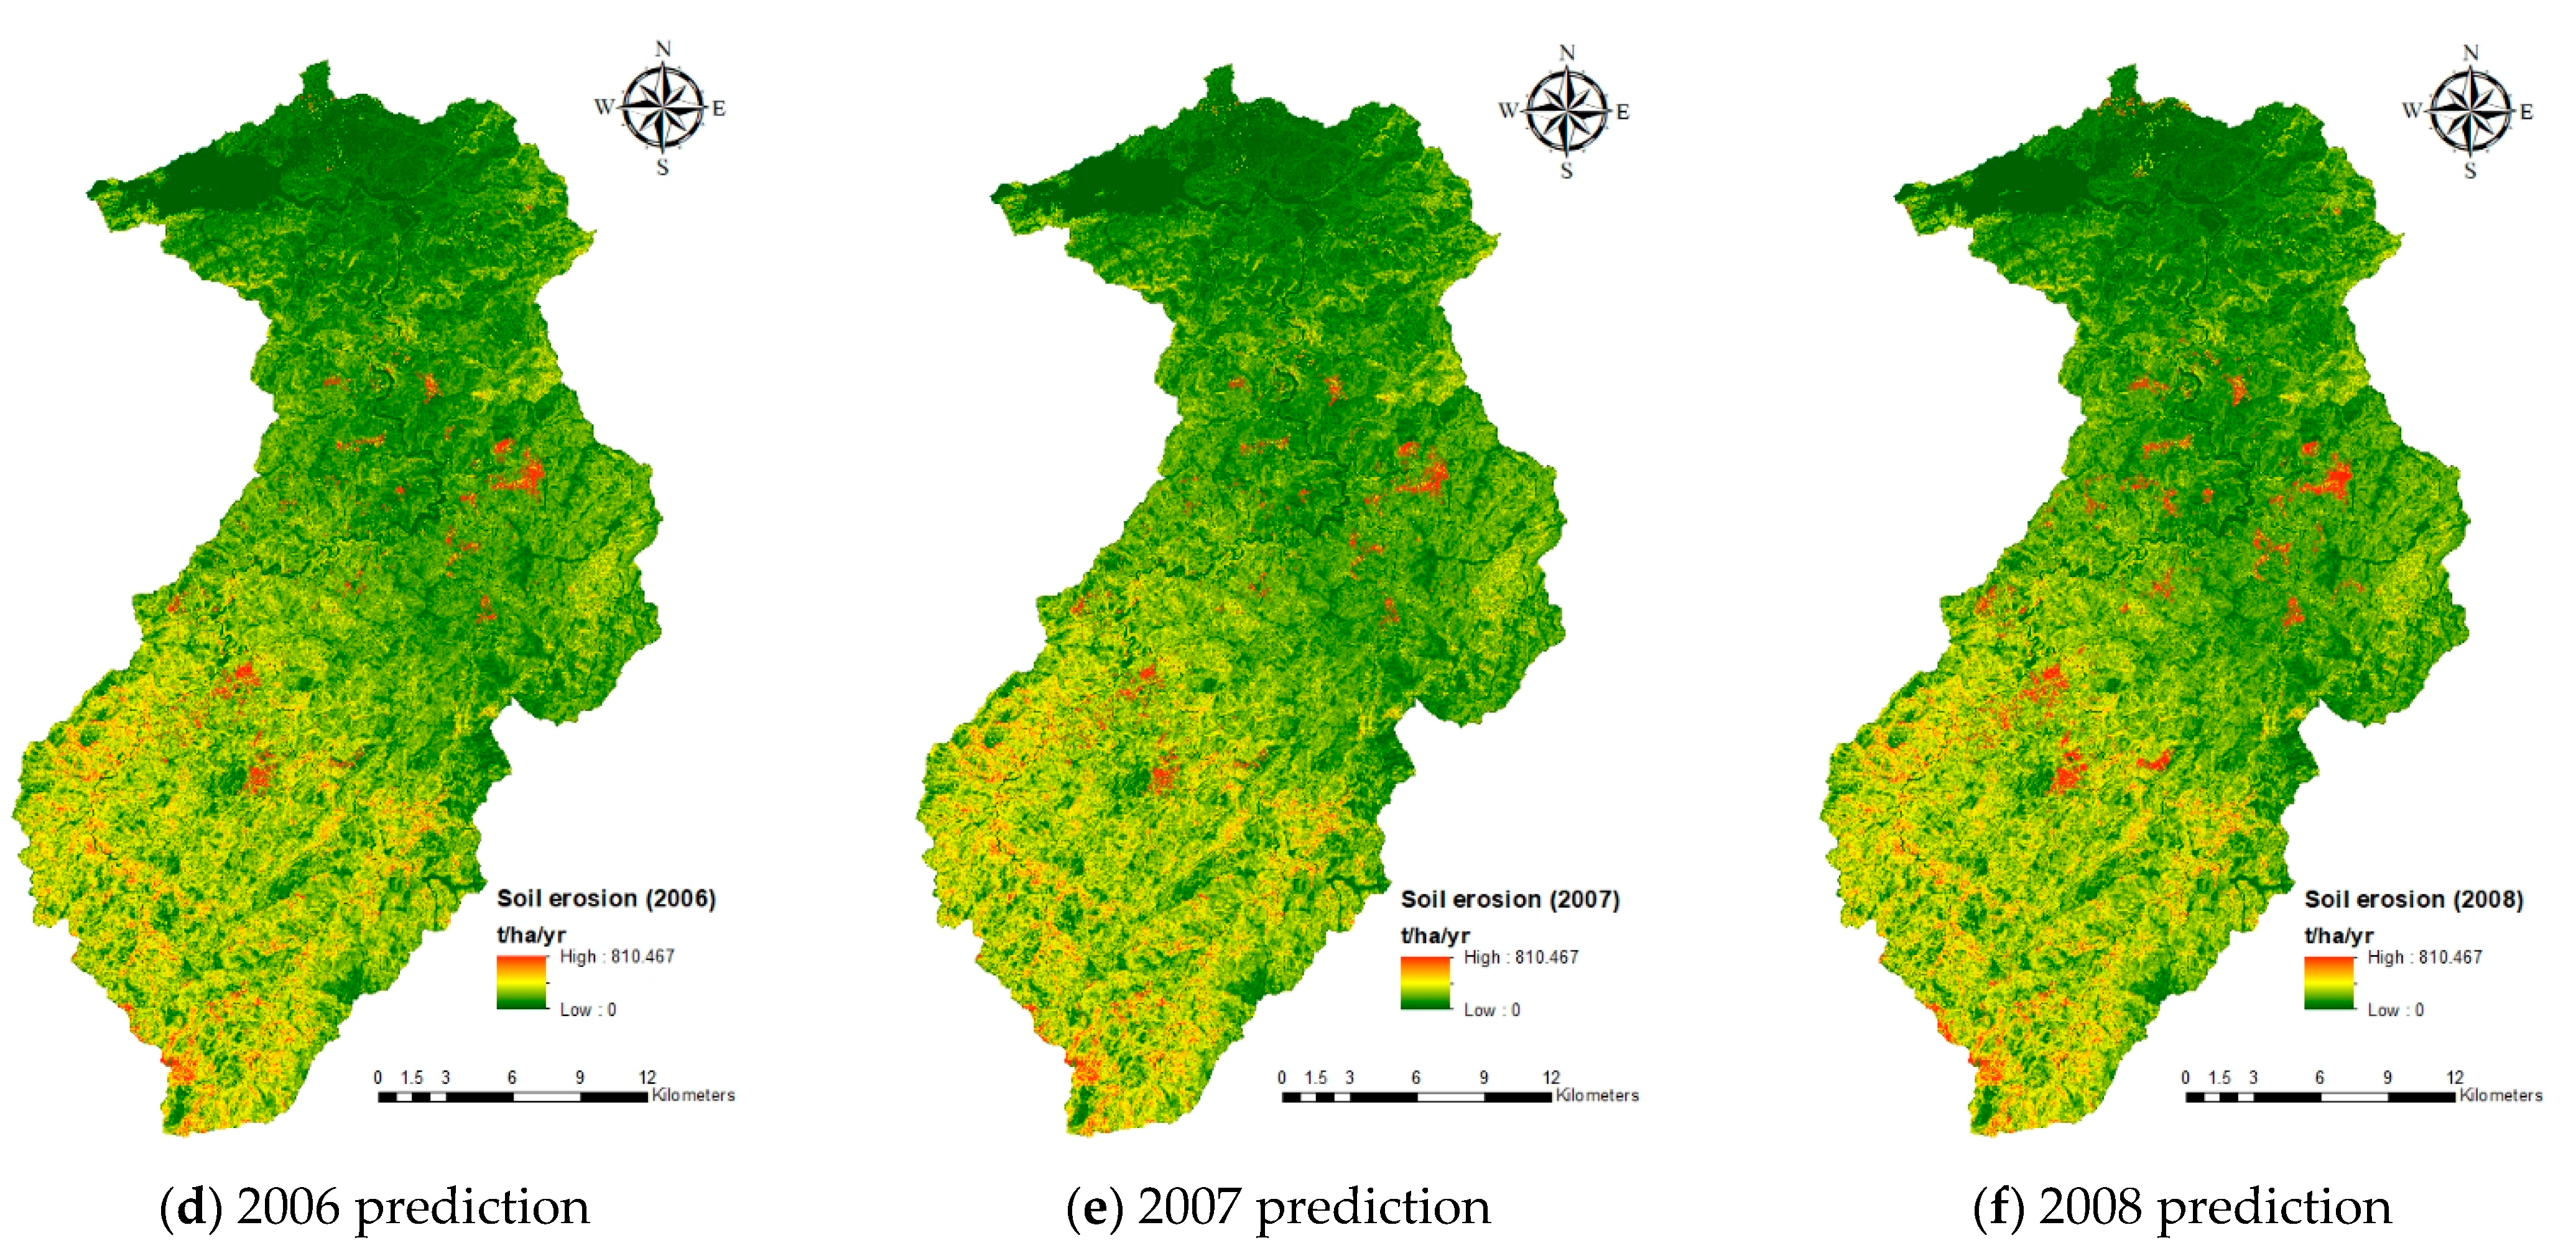
3.2. Soil Erosion Estimation
3.3. Discussion
4. Conclusions
- Overall accuracy and true positive rate of the majority class: 4%
- Kappa coefficient, AUC, and true positive rate of all minority classes combined: 0.5%
- Average C-factor: 1%
- Soil erosion rate: 2%
Author Contributions
Funding
Institutional Review Board Statement
Informed Consent Statement
Data Availability Statement
Conflicts of Interest
References
- National Research Council. Soil Conservation: Assessing the National Resources Inventory; National Academy Press: Washington, DC, USA, 1986. [Google Scholar]
- Laflen, J.M.; Moldenhauer, W.C. Pioneering Soil Erosion Prediction—The USLE Story; World Association of Soil and Water Conservation: Beijing, China, 2003. [Google Scholar]
- Young, R.A.; Onstad, C.A.; Bosch, D.D.; Anderson, W.P. Agricultural Non-Point Source Pollution Model, Version 4.03. AGNPS User’s Guide; North Central Soil Conservation Research Laboratory: Morris, MN, USA, 1994. [Google Scholar]
- Knisel, W.G. CREAMS: A Field Scale Model for Chemicals, Runoff, and Erosion from Agricultural Management Systems; U.S. Department of Agriculture, Science and Education Administration: Washington, DC, USA, 1980.
- Sharpley, A.N.; Williams, J.R. EPIC Erosion/Productivity Impact Calculator: 1. Model Documentation; U.S. Department of Agriculture, Technical Bulletin: Washington, DC, USA, 1990; Volume 1768, p. 235.
- Arnold, J.G.; Williams, J.R.; Nicks, A.D.; Sammons, N.B. SWRRB: A Basin Scale Simulation Model for Soil and Water Resources Management; Texas A&M University Press: College Station, TX, USA, 1990. [Google Scholar]
- Nearing, M.A.; Foster, G.R.; Lane, L.J.; Finkner, S.C. A process-based soil erosion model for USDA-Water Erosion Prediction Project technology. Trans. ASAE 1989, 32, 1587–1593. [Google Scholar] [CrossRef]
- Wischmeier, W.H.; Smith, D.D. Predicting Rainfall-Erosion Losses from Cropland East of the Rocky Mountains; U.S. Department of Agriculture, Agriculture Handbook: Washington, DC, USA, 1965; Volume 282, p. 49.
- Wischmeier, W.H.; Smith, D.D. Predicting Rainfall Erosion Losses—A Guide to Conservation Planning; U.S. Department of Agriculture, Agriculture Handbook: Washington, DC, USA, 1978; Volume 537, p. 67.
- Sillanpää, M. Micronutrient Assessment at the Country Level: An International Study; FAO Soils Bulletin: Rome, Italy, 1990; Volume 63, p. 214. [Google Scholar]
- Foster, G.R.; Wischmeier, W. Evaluating irregular slopes for soil loss prediction. Trans. ASAE 1974, 17, 305–309. [Google Scholar] [CrossRef]
- Griffin, M.L.; Beasley, D.B.; Fletcher, J.J.; Foster, G.R. Estimating soil loss on topographically non-uniform field and farm units. J. Soil Water Conserv. 1988, 43, 326–331. [Google Scholar]
- Renard, K.G.; Foster, G.R.; Weesies, G.A.; Porter, J.P. RUSLE: Revised Universal Soil Loss Equation. J. Soil Water Conserv. 1991, 46, 30–33. [Google Scholar]
- Chen, W.; Li, D.-H.; Yang, K.-J.; Tsai, F.; Seeboonruang, U. Identifying and comparing relatively high soil erosion sites with four DEMs. Ecol. Eng. 2018, 120, 449–463. [Google Scholar] [CrossRef]
- Li, J.-Y.; Yang, K.-J.; Chen, W. Approximation Equation of Erosion Calculation in GIS. In Proceedings of the 37th Asian Conference on Remote Sensing, Colombo, Sri Lanka, 17–21 October 2016; Volume 3, pp. 1837–1843. [Google Scholar]
- Gabriels, D.; Ghekiere, G.; Schiettecatte, W.; Rottiers, I. Assessment of USLE cover-management C-factors for 40 crop rotation systems on arable farms in the Kemmelbeek watershed, Belgium. Soil Tillage Res. 2003, 74, 47–53. [Google Scholar] [CrossRef]
- Renard, K.G.; Foster, G.R.; Weesies, G.A.; McCool, D.K.; Yoder, D.C. Predicting Soil Erosion by Water: A Guide to Conservation Planning with the Revised Universal Soil Loss Equation (RUSLE); U.S. Department of Agriculture, Agriculture Handbook: Washington, DC, USA, 1997; Volume 703, p. 404.
- Borrelli, P.; Märker, M.; Panagos, P.; Schütt, B. Modeling soil erosion and river sediment yield for an intermountain drainage basin of the Central Apennines, Italy. Catena 2014, 114, 45–58. [Google Scholar] [CrossRef]
- Dabral, P.P.; Baithuri, N.; Pandey, A. Soil erosion assessment in a hilly catchment of north eastern India using USLE, GIS and Remote Sensing. Water Resour. Manag. 2008, 22, 1783–1798. [Google Scholar] [CrossRef]
- Pandey, A.; Chowdary, V.M.; Mal, B.C. Identification of critical erosion prone areas in the small agricultural watershed using USLE, GIS and remote sensing. Water Resour. Manag. 2007, 21, 729–746. [Google Scholar] [CrossRef]
- Alexandridis, T.K.; Sotiropoulou, A.M.; Bilas, G.; Karapetsas, N.; Silleos, N.G. The effects of seasonality in estimating the C-factor of soil erosion studies. Land Degrad. Dev. 2015, 26, 596–603. [Google Scholar] [CrossRef]
- Van der Knijff, J.M.; Jones, R.J.A.; Montanarella, L. Soil Erosion Risk Assessment in Italy; European Soil Bureau: Brussels, Belgium, 1999; p. 58. [Google Scholar]
- Ayalew, D.A.; Deumlich, D.; Šarapatka, B.; Doktor, D. Quantifying the Sensitivity of NDVI-Based C Factor Estimation and Potential Soil Erosion Prediction using Spaceborne Earth Observation Data. Remote Sens. 2020, 12, 1136. [Google Scholar] [CrossRef]
- Tsai, F.; Lai, J.-S.; Chen, W.W.; Lin, T.-H. Analysis of topographic and vegetative factors with data mining for landslide verification. Ecol. Eng. 2013, 61, 669–677. [Google Scholar] [CrossRef]
- Tsai, F.; Chen, L.C. Long-term landcover monitoring and disaster assessment in the Shihmen reservoir watershed using satellite images. In Proceedings of the 13th CeRES International Symposium on Remote Sensing, Chiba, Japan, 29 October 2007. [Google Scholar]
- Lai, J.-S.; Tsai, F.; Lin, T.-Y.; Chen, W. Verification and susceptibility assessment for landslides using data mining techniques. J. Photogramm. Remote Sens. 2013, 17, 149–160, (In Chinese with English Abstract). [Google Scholar]
- Huete, A.R. A soil-adjusted vegetation index (SAVI). Remote Sens. Environ. 1988, 25, 295–309. [Google Scholar] [CrossRef]
- Minnaert, M. The reciprocity principle in lunar photometry. Astrophys. J. 1941, 93, 403–410. [Google Scholar] [CrossRef]
- Jhan, Y.K. Analysis of Soil Erosion of Shihmen Reservoir Watershed. Master’s Thesis, National Taipei University of Technology, Taipei, Taiwan, 2014. (In Chinese with English Abstract). [Google Scholar]
- Lin, T.-C. Establishment of Relationship between USLE Cover Management Factor and Spatial Data. Master’s Thesis, National Central University, Zhongli City, Taoyuan, Taiwan, 2016. (In Chinese with English Abstract). [Google Scholar]
- Ouyang, Y.; Luo, S.M.; Cui, L.H.; Wang, Q.; Zhang, J.E. Estimation of real-time N load in surface water using dynamic data-driven application system. Ecol. Eng. 2011, 37, 616–621. [Google Scholar] [CrossRef]
- Witten, I.H.; Frank, E.; Hall, M.A. Data Mining: Practical Machine Learning Tools and Techniques, 3rd ed.; Morgan Kaufmann: San Francisco, CA, USA, 2011. [Google Scholar]
- Breiman, L. Random forests. Mach. Learn. 2001, 45, 5–32. [Google Scholar] [CrossRef]
- Belgiu, M.; Dragut, L. Random forest in remote sensing: A review of applications and future directions. ISPRS J. Photogramm. Remote Sens. 2016, 114, 24–31. [Google Scholar] [CrossRef]
- Stumpf, A.; Kerle, N. Object-oriented mapping of landslides using Random Forests. Remote Sens. Environ. 2011, 115, 2564–2577. [Google Scholar] [CrossRef]
- Tsai, F.; Lai, J.-S.; Lu, Y.-H. Full-waveform LiDAR point cloud land cover classification with volumetric texture measures. Terr. Atmos. Ocean. Sci. 2016, 27, 549–563. [Google Scholar] [CrossRef]
- Nguyen, K.A.; Chen, W.; Lin, B.-S.; Seeboonruang, U.; Thomas, K. Predicting sheet and rill erosion of Shihmen reservoir watershed in Taiwan using machine learning. Sustainability 2019, 11, 3615. [Google Scholar] [CrossRef]
- Ismail, R.; Mutanga, O.; Kumar, L. Modeling the potential distribution of pine forests susceptible to Sirex Noctilio infestations in Mpumalang, South African. Trans. GIS 2010, 14, 709–726. [Google Scholar] [CrossRef]
- Guo, L.; Chehata, N.; Mallet, C.; Boukir, S. Relevance of airborne LiDAR and multispectral image data for urban scene classification using random forests. ISPRS J. Photogramm. Remote Sens. 2011, 66, 56–66. [Google Scholar] [CrossRef]
- Zhang, F.; Yang, X. Improving land cover classification in an urbanized coastal area by random forests: The role of variable selection. Remote Sens. Environ. 2020, 251, 112105. [Google Scholar] [CrossRef]
- Han, J.; Kamber, M.; Pei, J. Data Mining, Concepts and Techniques, 3rd ed.; Morgan Kaufmann: Waltham, MA, USA, 2012. [Google Scholar]
- Liu, Y.-H.; Li, D.-H.; Chen, W.; Lin, B.-S.; Seeboonruang, U.; Tsai, F. Soil erosion modeling and comparison using slope units and grid cells in Shihmen reservoir watershed in Northern Taiwan. Water 2018, 10, 1387. [Google Scholar] [CrossRef]
- Lin, W.Y.; Lin, L.L. Application and discussion of soil erosion prediction model. J. Soil Water Conserv. 2008, 40, 357–368, (In Chinese with English Abstract). [Google Scholar]
- Lin, B.S.; Thomas, K.; Chen, C.K.; Ho, H.C. Evaluation of soil erosion risk for watershed management in Shenmu watershed, central Taiwan using USLE model parameters. Paddy Water Environ. 2008, 14, 19–43. [Google Scholar] [CrossRef]
- Li, D.-H. Analyzing Soil Erosion of Shihmen Reservoir Watershed Using Slope Units. Master’s Thesis, National Taipei University of Technology, Taipei, Taiwan, 2017. (In Chinese with English Abstract). [Google Scholar]


| Approach | Method | Advantage | Challenge | |
|---|---|---|---|---|
| 1 | LULC map by field survey |
| Most accurate LULC data | Time-consuming with a lengthy update period |
| 2 | LULC map by remote sensing |
| Multi-temporal evaluation | Ground truthing needed to ensure accuracy |
| 3 | Empirical NDVI equation |
| Simple and multi-temporal evaluation | Sensitive to vegetation phenology and soil conditions |
| 4 | This study |
| More accurate model and multi-temporal evaluation | More complicated |
| Original Data | Derived Data | Note |
|---|---|---|
| DEM | Elevation (numeric) | Cell size: 10 m |
| Slope (numeric) | ||
| SPOT satellite images | NDVI (numeric) | See Table 3 for details |
| SAVI (numeric) | ||
| Road map | Distance to road (numeric) | Measurement unit: meter |
| Stream map | Distance to river (numeric) | |
| Geology map | Geological formation (categorical) |
|
| Soil map | Soil type (categorical) |
|
| Sensor | Date | Spatial Resolution (m) | Spectral Bandwidth (um) | Radiometric Resolution (bits) |
|---|---|---|---|---|
| SPOT 5 | 2004/10/12 | 10 | Green: 0.50–0.59 Red: 0.61–0.68 NIR: 0.79–0.89 | 8 |
| 2006/07/19 | ||||
| 2008/09/21 | ||||
| SPOT 4 | 2005/07/25 | 20 | ||
| 2007/07/19 |
| C-Factor Class | Land Use/Land Cover Class |
|---|---|
| 0 | Waterbody, reef |
| 0.005 | Railway related facility, weir, dam, cultural facility |
| 0.01 | Natural forest, artificial forest, residential area |
| 0.025 | Dike, ditch, aqueduct, shoal, beach, wetland |
| 0.03 | Provincial road, road |
| 0.035 | Unused land, land being converted |
| 0.05 | Pastureland, logging land, grassland, shrubland |
| 0.133 | Livestock house |
| 0.156 | Abandoned farmland |
| 0.16 | Orchard |
| 0.208 | Dry-farming land |
| 1 | Fire break, bare land |
| No. | C-factor Class | Total no. of Points (Population) | 4% of the Majority Class | 2% of the Majority Class | 1% of the Majority Class | 0.5% of the Majority Class |
|---|---|---|---|---|---|---|
| % of the Total Sample (Input Dataset) | ||||||
| 1 | 0 | 216,970 | 8679 (2.9%) | 8679 (5.3%) | 8679 (9.3%) | 8679 (15.0%) |
| 2 | 0.005 | 1110 | 44 (0.0%) | 44 (0.0%) | 44 (0.0%) | 44 (0.1%) |
| 3 | 0.01 | 7,021,560 | 280,862 (92.5%) | 140,431 (86.0%) | 70,216 (75.5%) | 35,108 (60.6%) |
| 4 | 0.025 | 47,629 | 1905 (0.6%) | 1905 (1.2%) | 1905 (2.0%) | 1905 (3.3%) |
| 5 | 0.03 | 37,714 | 1509 (0.5%) | 1509 (0.9%) | 1509 (1.6%) | 1509 (2.6%) |
| 6 | 0.035 | 4235 | 169 (0.1%) | 169 (0.1%) | 169 (0.2%) | 169 (0.3%) |
| 7 | 0.05 | 46,598 | 1864 (0.6%) | 1864 (1.1%) | 1864 (2.0%) | 1864 (3.2%) |
| 8 | 0.133 | 73 | 3 (0.0%) | 3 (0.0%) | 3 (0.0%) | 3 (0.0%) |
| 9 | 0.156 | 342 | 14 (0.0%) | 14 (0.0%) | 14 (0.0%) | 14 (0.0%) |
| 10 | 0.16 | 141,672 | 5667 (1.9%) | 5667 (3.5%) | 5667 (6.1%) | 5667 (9.8%) |
| 11 | 0.208 | 60,060 | 2402 (0.8%) | 2402 (1.5%) | 2402 (2.6%) | 2402 (4.1%) |
| 12 | 1 | 14,099 | 564 (0.2%) | 564 (0.3%) | 564 (0.6%) | 564 (1.0%) |
| Total | 7,592,062 | 100.0% | 100.0% | 100.0% | 100.0% | |
| Symbol | Definition | Unit |
|---|---|---|
| Am | Average annual soil loss | t/ha-year |
| Rm | Rainfall erosivity factor | MJ-mm/ha-hour-year |
| Km | Soil erodibility factor | t-hour/MJ-mm |
| L | Slope length factor | -- |
| S | Slope steepness factor | -- |
| C | Cover management factor | -- |
| P | Support practice factor | -- |
| Actual | Predicted | |||||||||||
|---|---|---|---|---|---|---|---|---|---|---|---|---|
| 0 | 0.005 | 0.01 | 0.025 | 0.03 | 0.035 | 0.05 | 0.133 | 0.156 | 0.16 | 0.208 | 1 | |
| 0 | 1792 | 0 | 732 | 75 | 1 | 0 | 1 | 0 | 0 | 3 | 0 | 0 |
| 0.005 | 0 | 3 | 8 | 0 | 0 | 0 | 2 | 0 | 0 | 0 | 0 | 0 |
| 0.01 | 249 | 0 | 83,729 | 7 | 130 | 1 | 19 | 0 | 0 | 101 | 19 | 4 |
| 0.025 | 109 | 0 | 89 | 372 | 0 | 0 | 1 | 0 | 0 | 0 | 0 | 0 |
| 0.03 | 2 | 0 | 99 | 0 | 349 | 0 | 0 | 0 | 0 | 2 | 1 | 0 |
| 0.035 | 2 | 0 | 32 | 3 | 3 | 8 | 0 | 0 | 0 | 2 | 1 | 0 |
| 0.05 | 13 | 0 | 441 | 4 | 8 | 0 | 85 | 0 | 0 | 7 | 1 | 0 |
| 0.133 | 0 | 0 | 1 | 0 | 0 | 0 | 0 | 0 | 0 | 0 | 0 | 0 |
| 0.156 | 0 | 0 | 4 | 0 | 0 | 0 | 0 | 0 | 0 | 0 | 0 | 0 |
| 0.16 | 6 | 0 | 1400 | 0 | 24 | 0 | 0 | 0 | 0 | 251 | 19 | 0 |
| 0.208 | 5 | 0 | 559 | 0 | 17 | 1 | 0 | 0 | 0 | 58 | 81 | 0 |
| 1 | 1 | 0 | 133 | 7 | 2 | 0 | 0 | 0 | 0 | 1 | 0 | 25 |
| Overall statistics | OA = 0.952 | Kappa = 0.574 | AUC = 0.780 | |||||||||
| Official LULC Map (Mean) | RF Model Prediction (Mean) | |||||
|---|---|---|---|---|---|---|
| 2004 | 2004 | 2005 | 2006 | 2007 | 2008 | |
| 4% | 0.0164 | 0.0115 | 0.0114 | 0.0110 | 0.0110 | 0.0115 |
| 2% | 0.0130 | 0.0132 | 0.0125 | 0.0124 | 0.0133 | |
| 1% | 0.0156 | 0.0164 | 0.0149 | 0.0146 | 0.0169 | |
| 0.5% | 0.0115 | 0.0114 | 0.0110 | 0.0109 | 0.0115 | |
| Actual | Predicted | |||||||||||
|---|---|---|---|---|---|---|---|---|---|---|---|---|
| 0 | 0.005 | 0.01 | 0.025 | 0.03 | 0.035 | 0.05 | 0.133 | 0.156 | 0.16 | 0.208 | 1 | |
| 0 | 2034 | 0 | 494 | 62 | 0 | 0 | 3 | 0 | 0 | 4 | 6 | 1 |
| 0.005 | 0 | 6 | 5 | 0 | 0 | 0 | 2 | 0 | 0 | 0 | 0 | 0 |
| 0.01 | 234 | 0 | 41,551 | 4 | 83 | 1 | 21 | 0 | 0 | 188 | 41 | 6 |
| 0.025 | 113 | 0 | 85 | 371 | 1 | 0 | 1 | 0 | 0 | 0 | 0 | 0 |
| 0.03 | 1 | 0 | 37 | 0 | 401 | 4 | 0 | 0 | 0 | 9 | 1 | 0 |
| 0.035 | 1 | 0 | 20 | 1 | 1 | 15 | 0 | 0 | 0 | 8 | 5 | 0 |
| 0.05 | 10 | 1 | 402 | 5 | 2 | 0 | 124 | 0 | 0 | 11 | 4 | 0 |
| 0.133 | 0 | 0 | 1 | 0 | 0 | 0 | 0 | 0 | 0 | 0 | 0 | 0 |
| 0.156 | 0 | 0 | 4 | 0 | 0 | 0 | 0 | 0 | 0 | 0 | 0 | 0 |
| 0.16 | 7 | 0 | 1095 | 0 | 24 | 0 | 0 | 0 | 0 | 540 | 34 | 0 |
| 0.208 | 9 | 0 | 440 | 0 | 19 | 0 | 0 | 0 | 0 | 123 | 130 | 0 |
| 1 | 2 | 0 | 130 | 2 | 0 | 0 | 0 | 0 | 0 | 2 | 1 | 32 |
| Overall statistics | OA = 0.923 | Kappa = 0.648 | AUC = 0.781 | |||||||||
| Official LULC Map (2004) | RF Model Prediction | Erosion Pins (2008–2011) | ||||||
|---|---|---|---|---|---|---|---|---|
| 2004 | 2005 | 2006 | 2007 | 2008 | ||||
| Am (t/ha-year) | 116.3 | 88.2 | 85.6 | 84.7 | 84.0 | 84.5 | (4% of C = 0.01) | 90.6 |
| 95.1 | 94.4 | 92.4 | 91.6 | 93.2 | (2% of C = 0.01) | |||
| Sampling Rate of the Majority Class | OA | Kappa | AUC | True Positive Rate of All Minority Classes Combined | True Positive Rate of the Majority Class | Average C-Factor of LULC Map | Average C-Factor (2004) | Soil Erosion of 2004 (t/ha-Year) | Soil Erosion of 2008 (t/ha-Year) | Erosion Pins (2008–2011) |
|---|---|---|---|---|---|---|---|---|---|---|
| 4% | 0.952 | 0.574 | 0.780 | 0.43 | 0.99 | 0.0164 | 0.0115 | 88.2 | 84.5 | 90.6 |
| 2% | 0.923 | 0.648 | 0.781 | 0.53 | 0.99 | 0.0130 | 95.1 | 93.2 | ||
| 1% | 0.880 | 0.687 | 0.845 | 0.61 | 0.97 | 0.0156 | 104.3 | 108.0 | ||
| 0.5% | 0.846 | 0.732 | 0.891 | 0.70 | 0.94 | 0.0115 | 88.2 | 84.5 |
Publisher’s Note: MDPI stays neutral with regard to jurisdictional claims in published maps and institutional affiliations. |
© 2021 by the authors. Licensee MDPI, Basel, Switzerland. This article is an open access article distributed under the terms and conditions of the Creative Commons Attribution (CC BY) license (http://creativecommons.org/licenses/by/4.0/).
Share and Cite
Tsai, F.; Lai, J.-S.; Nguyen, K.A.; Chen, W. Determining Cover Management Factor with Remote Sensing and Spatial Analysis for Improving Long-Term Soil Loss Estimation in Watersheds. ISPRS Int. J. Geo-Inf. 2021, 10, 19. https://doi.org/10.3390/ijgi10010019
Tsai F, Lai J-S, Nguyen KA, Chen W. Determining Cover Management Factor with Remote Sensing and Spatial Analysis for Improving Long-Term Soil Loss Estimation in Watersheds. ISPRS International Journal of Geo-Information. 2021; 10(1):19. https://doi.org/10.3390/ijgi10010019
Chicago/Turabian StyleTsai, Fuan, Jhe-Syuan Lai, Kieu Anh Nguyen, and Walter Chen. 2021. "Determining Cover Management Factor with Remote Sensing and Spatial Analysis for Improving Long-Term Soil Loss Estimation in Watersheds" ISPRS International Journal of Geo-Information 10, no. 1: 19. https://doi.org/10.3390/ijgi10010019
APA StyleTsai, F., Lai, J.-S., Nguyen, K. A., & Chen, W. (2021). Determining Cover Management Factor with Remote Sensing and Spatial Analysis for Improving Long-Term Soil Loss Estimation in Watersheds. ISPRS International Journal of Geo-Information, 10(1), 19. https://doi.org/10.3390/ijgi10010019