Article

GeoFairy2: A Cross-Institution Mobile Gateway to Location-Linked Data for In-Situ Decision Making

Center for Spatial Information Science and Systems, Department of Geography and Geoinformation Science, George Mason University, Fairfax, VA 22030, USA
*
Author to whom correspondence should be addressed.
ISPRS Int. J. Geo-Inf. 2021, 10(1), 1; https://doi.org/10.3390/ijgi10010001
Submission received: 8 November 2020 / Revised: 15 December 2020 / Accepted: 21 December 2020 / Published: 22 December 2020

Abstract

:
To effectively disseminate location-linked information despite the existence of digital walls across institutions, this study developed a cross-institution mobile App, named GeoFairy2, to overcome the virtual gaps among multi-source datasets and aid the general users to make thorough accurate in-situ decisions. The app provides a one-stop service with relevant information to assist with instant decision making. It was tested and proven to be capable of on-demand coupling and delivering location-based information from multiple sources. The app can help general users to crack down the digital walls among information pools and serve as a one-stop retrieval place for all information. GeoFairy2 was experimented with to gather real-time and historical information about crops, soil, water, and climate. Instead of a one-way data portal, GeoFairy2 allows general users to submit photos and observations to support citizen science projects and derive new insights, and further refine the future service. The two-directional mechanism makes GeoFairy2 a useful mobile gateway to access and contribute to the rapidly growing, heterogeneous, multisource, and location-linked datasets, and pave a way to drive us into a new mobile web with more links and less digital walls across data providers and institutions.

1. Introduction

Earth observation (EO) data have been increasing exponentially in the past decades, and have become a valuable data source in many important scientific and application domains. Many useful insights and applications can be achieved once EO data are coupled with other public data, like OpenStreetMap [1] and GeoNames [2] (as shown in Figure 1). However, the data are stored in distributed institutions and governed by a different set of regulations, policies, and standards [3]. Virtual walls exist among datasets and can be strongly felt when trying to retrieve and carry out combined analyses. The heterogeneity in formats, projections, metadata, structure, content, properties, protocols, and licenses, exposes serious challenges for fusing the information from multiple providers to get a comprehensive understanding of a specific location. In satellite datasets, digital walls are very common. For example, NOAA (National Oceanic and Atmospheric Administration) data centers mostly use NetCDF (Network Common Data Form) as a default form. NASA (National Aeronautics and Space Administration) and DAAC (Distributed Active Archive Center) data centers often use HDF (Hierarchical Data Format), and USGS uses GeoTIFF for its satellite imagery. In industrial companies, e.g., social media, the data providers normally serve datasets via some unique interfaces to maintain a relatively isolated ecosystem to protect business interests. Although tremendous efforts were made to unify the metadata and enroll datasets into one catalog or one abstract parent form [4], it is a complicated task to retrieve all information across datasets about one location. For effective decision making, it is a critical need to put together all information collected from various platforms into one report. As an important topic in the research of spatial data infrastructure (SDI), cracking down these digital walls and one-stop retrieve multisource geospatial information is still an unsolved issue.
Mobile apps can facilitate a lot of location-based services (LBS) like reporting environment status, disseminating climate forecasts, monitoring particular regions, and warning potential disasters. The popularity of LBS is creating a growing interest in many stakeholder communities. app developers normally own datasets of points of interest (POIs) [5,6]. Typical examples are Google Maps, Yelp, Twitter, Facebook, TripAdvisor, FourSquare, OpenStreetMap, GRAB, etc. The availability of spatial data and the techniques to manage and analyze those data allow researchers to study important environmental, social, economic, and public health issues [7]. The spatial links within data offer new ways of thinking, structuring, publishing, discovering, accessing, and integrating information. Geospatial information is digested by mobile apps and inferred via their spatiotemporal connections to deliver value-added information and services. However, most apps only have a single data source and focus on one thing or one aspect. It is hard to retrieve a full thorough report about real-time location, which is essential in making solid and correct decisions on-site, by collecting multisource data and delivering them in a one-stop manner.
To address the challenge, this study developed a mobile app called GeoFairy2, which is the new version of the award-winning app GeoFairy [8], by integrating the application-level strategies to collect, couple, and deliver multi-source geospatial information from distributed data centers in real-time. The one-stop app helps field workers such as farmers, surveyors, geologists, travelers, to access and be notified about the environment and socioeconomic dynamics. The app was tested in randomly selected places worldwide and works as expected by successfully deliver historical, present, and forecasting information on weather, soil, crops, and air quality. Meanwhile, the system can turn the mobile device into a sensor by citizen scientists, to take photos, fill in questionnaires, and submit their observations or feedback to refine the accuracy and resolution of the future information. GeoFairy2 could provide a platform for nonprofessionals who might not possess any or have only limited background knowledge of the studied subjects, but are willing to contribute by collecting data. In the foreseeable future, mobile Apps would become dominant data gateways and Apps like GeoFairy2 would see high demands. This work paves a new way to drive us into a new mobile web with more links and fewer walls across data providers and institutions [9].

2. Related Work

Location-linked data come from various sources and are explicitly interconnected via some descriptive properties, e.g., coordinates, spatial extents, materials, events, observation time, etc. [10,11,12,13]. Those links could navigate from one dataset to the related datasets [11]. It has enormous benefits to link information across perspectives, dimensions, platforms, and communities [14]. It will take much fewer costs and efforts to search for actionable information. Instead of going through tens of thousands of records, location-linked data allow efficient data discovery at a low cost. Data links to other data also increase their value [15]. Its initial goal was to enable the query of all Web data as a single database [16], due to the direct links among the data entities, which leads to the transition from data islands to the global data web. There are some proposed linked data principles by Tim Berners-Lee [17]. Many domains could be benefited by location-linked data, ranging from geological field surveys, forest surveys, natural disaster management, agricultural practice, and public health surveillance. Government agencies are looking for the scientific intellect to challenge the common threat of big environmental issues, such as climate change, pollution, food security, biodiversity [18], and location-linked data, which could provide big help.
Smartphones that have an Internet connection and a touchscreen are now widely owned and used all over the world. It is estimated that over 3.5 billion people own smartphones [19]. As owners carry these devices around constantly, they are also ready to access mobile apps in app stores, without the need for special preparations and equipment. Apps for data retrieval and citizen sciences increased dramatically in recent years [20]. Most smartphones have built-in GPS receivers, cameras, and microphones [21].
The role of volunteered geographic information (VGI) in citizen science was explored in recent studies [22]. Mobile phone data was accepted and have become a good platform for data collection. The mobile map SDKs (Software Development Kit) like Google Maps and Apple Maps and many other open-source sets of tools, have made it convenient to implement a series of low-cost mobile apps to collect and disseminate geospatial data for various communities. Normally, a mobile app does one or more of the following three functions—data dissemination, data validation, and data collection. Smartphones’ locating capability enables the geospatial data servers to serve location-specific information to the users. Photographs can be taken and used to validate model-simulated data derived from satellite data, such as land cover and soil maps. Electronic forms can be collected and used as ground truths for analysis and aggregation. The use of mobile apps not only increases efficiency but also allows the public to contribute as citizen scientists [23].
Apps such as Google Maps and OpenStreetMap were embraced by both scientists and non-expert user communities [24]. Lutz et al. used a smartphone-based system to intuitively retrieve the exact geometry of smaller objects, making it suitable to assess agricultural entities like fields or ponds, with their exact extent and location [25]. They used it to monitor agricultural development. Suporn et al. did a systematic review on smartphone applications in the research literature that utilized smartphone built-in sensors to provide agricultural solutions [26]. They overviewed 12 farming applications, 6 farm management applications, 3 information system applications, and 4 extension service applications. GPS and cameras are the most popular sensors in those apps. Compared to traditional agriculture that was usually done within a family or a village, and accumulative farming expertise and knowledge that were passed down to their future generations, smartphone apps play an important role in disseminating knowledge and information on agriculture today. In the foreseeable future, humans will no longer be the main observer of the field conditions and the sole solution provider as problems arise. As the disruptive climate and crop disease outbreaks could seriously damage farming productivity, more profound and powerful farming management and practice technologies need to be invented and adopted, to battle these issues. Precision agriculture is one of the most popular methods that was invented. The use of field sensors, remote sensing, and smartphone-based apps is one of the key ideas in precision agriculture. All employed system will monitor the fields constantly and help farmers to make informed decisions [26].
There are many mobile apps to deliver location-linked data. Agrofarm [27] is an Android-based app that appeals to farmers, breeders, and people who like growing crops and rearing animals. It helps farmers and breeders to track the time of every lubrication or pesticide application, the quantity and cost, cultivation, the revenues, and expenses of all farming activities by category or period, store the information for application of drugs in animals as well as the full program of food, and record the fuel cost and the maintenance program for all agricultural machineries. AgriApp [28] is another Android app that provides complete information on crop protection, smart farming with agriculture, and associated services. It is also an online marketplace bringing in farmers, retailers, workforce hiring services into one common digital platform. Another App, Agrobase [29], includes an agronomic knowledge database with pests, weeds, and disease catalog, and all registered pesticides, insecticides, herbicides, in a chosen country. It could potentially identify diseases, insects, or pests in fields, and find a solution to reach higher productivity.
Many Apps are developed to disseminate air quality data. An app called Air Visual [30] can deliver historical, real-time, and forecasted air pollution data based on real-time location. It could provide data about key pollutants for more than 10,000 cities in 80+ countries. EPA (Environmental Protection Agency) AIRNow [31] can provide real-time air quality. Their reports include ozone and fine particle pollution (PM2.5), and the actions people can take at different air quality level. Other similar apps include PlumeLabs, BreezoMeter, etc.
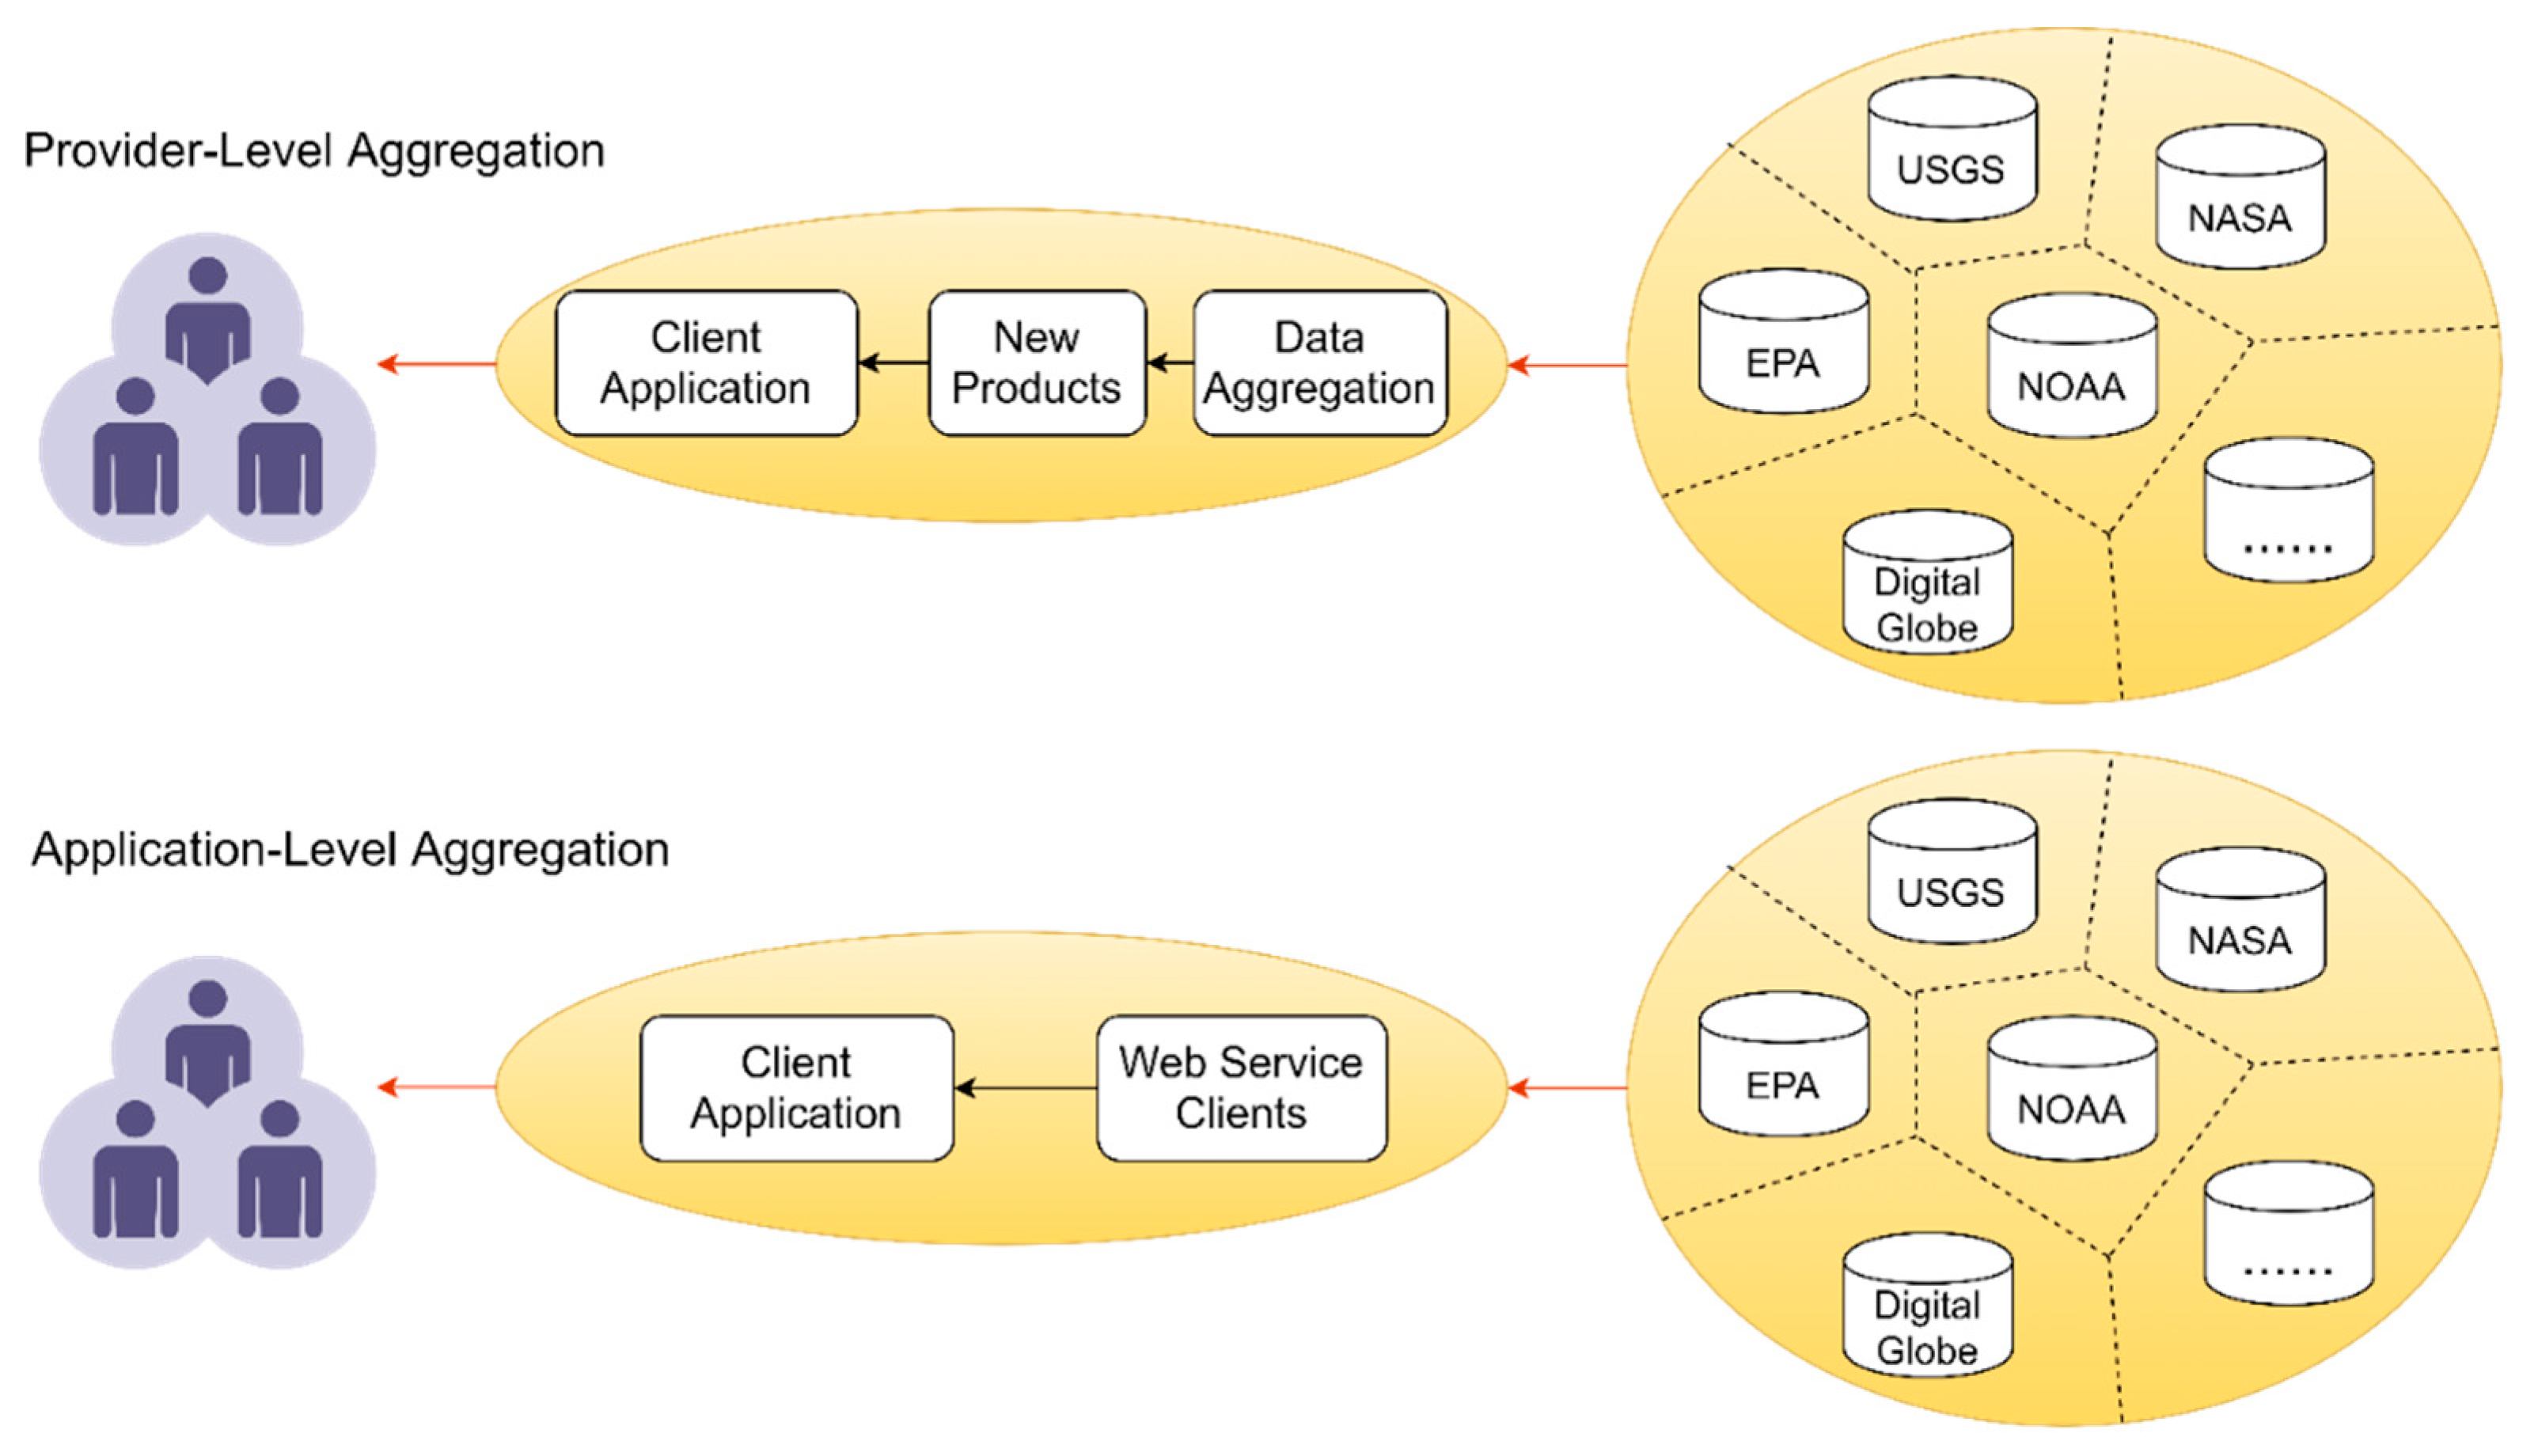
One common practice of the existing data applications is that all information is aggregated at the provider level (as shown in Figure 2). For example, Google collected all data and fused them into new products, and published them into Google Maps. Google is playing the role of middleman to collect the datasets and merge them. As a result, all users are over-confidently depending on Google and have less flexibility in customizing, subscribing, and identifying information from the raw data, especially the temporal trends.
The first version of GeoFairy was an innovative system that won the GEO Appthon competition in 2014 [8]. It was proposed as a one-stop location-based service for retrieving various kinds of geospatial information by integrating the state-of-art techniques in geospatial web services and mobile applications. However, it was a relatively low-efficient app and has hit bottleneck problems to serve many users all over the world concurrently. The service quality over relies on the data aggregation services that are deployed on a small server in GMU (the provider-level aggregation in Figure 2). The design of old GeoFairy caused issues on response time, system stability, and sustainability, according to its past performance on operational running. Meanwhile, the GeoFairy1 is a one-way service that only transfers the information from official data providers to users. After six years of research on how to improve the service, GeoFairy2 addressed these problems by adopting the application-level aggregation (Figure 2) and successfully meeting the growing requirements of intelligent data discovery and two-direction interaction to assist data collection.

3. Framework

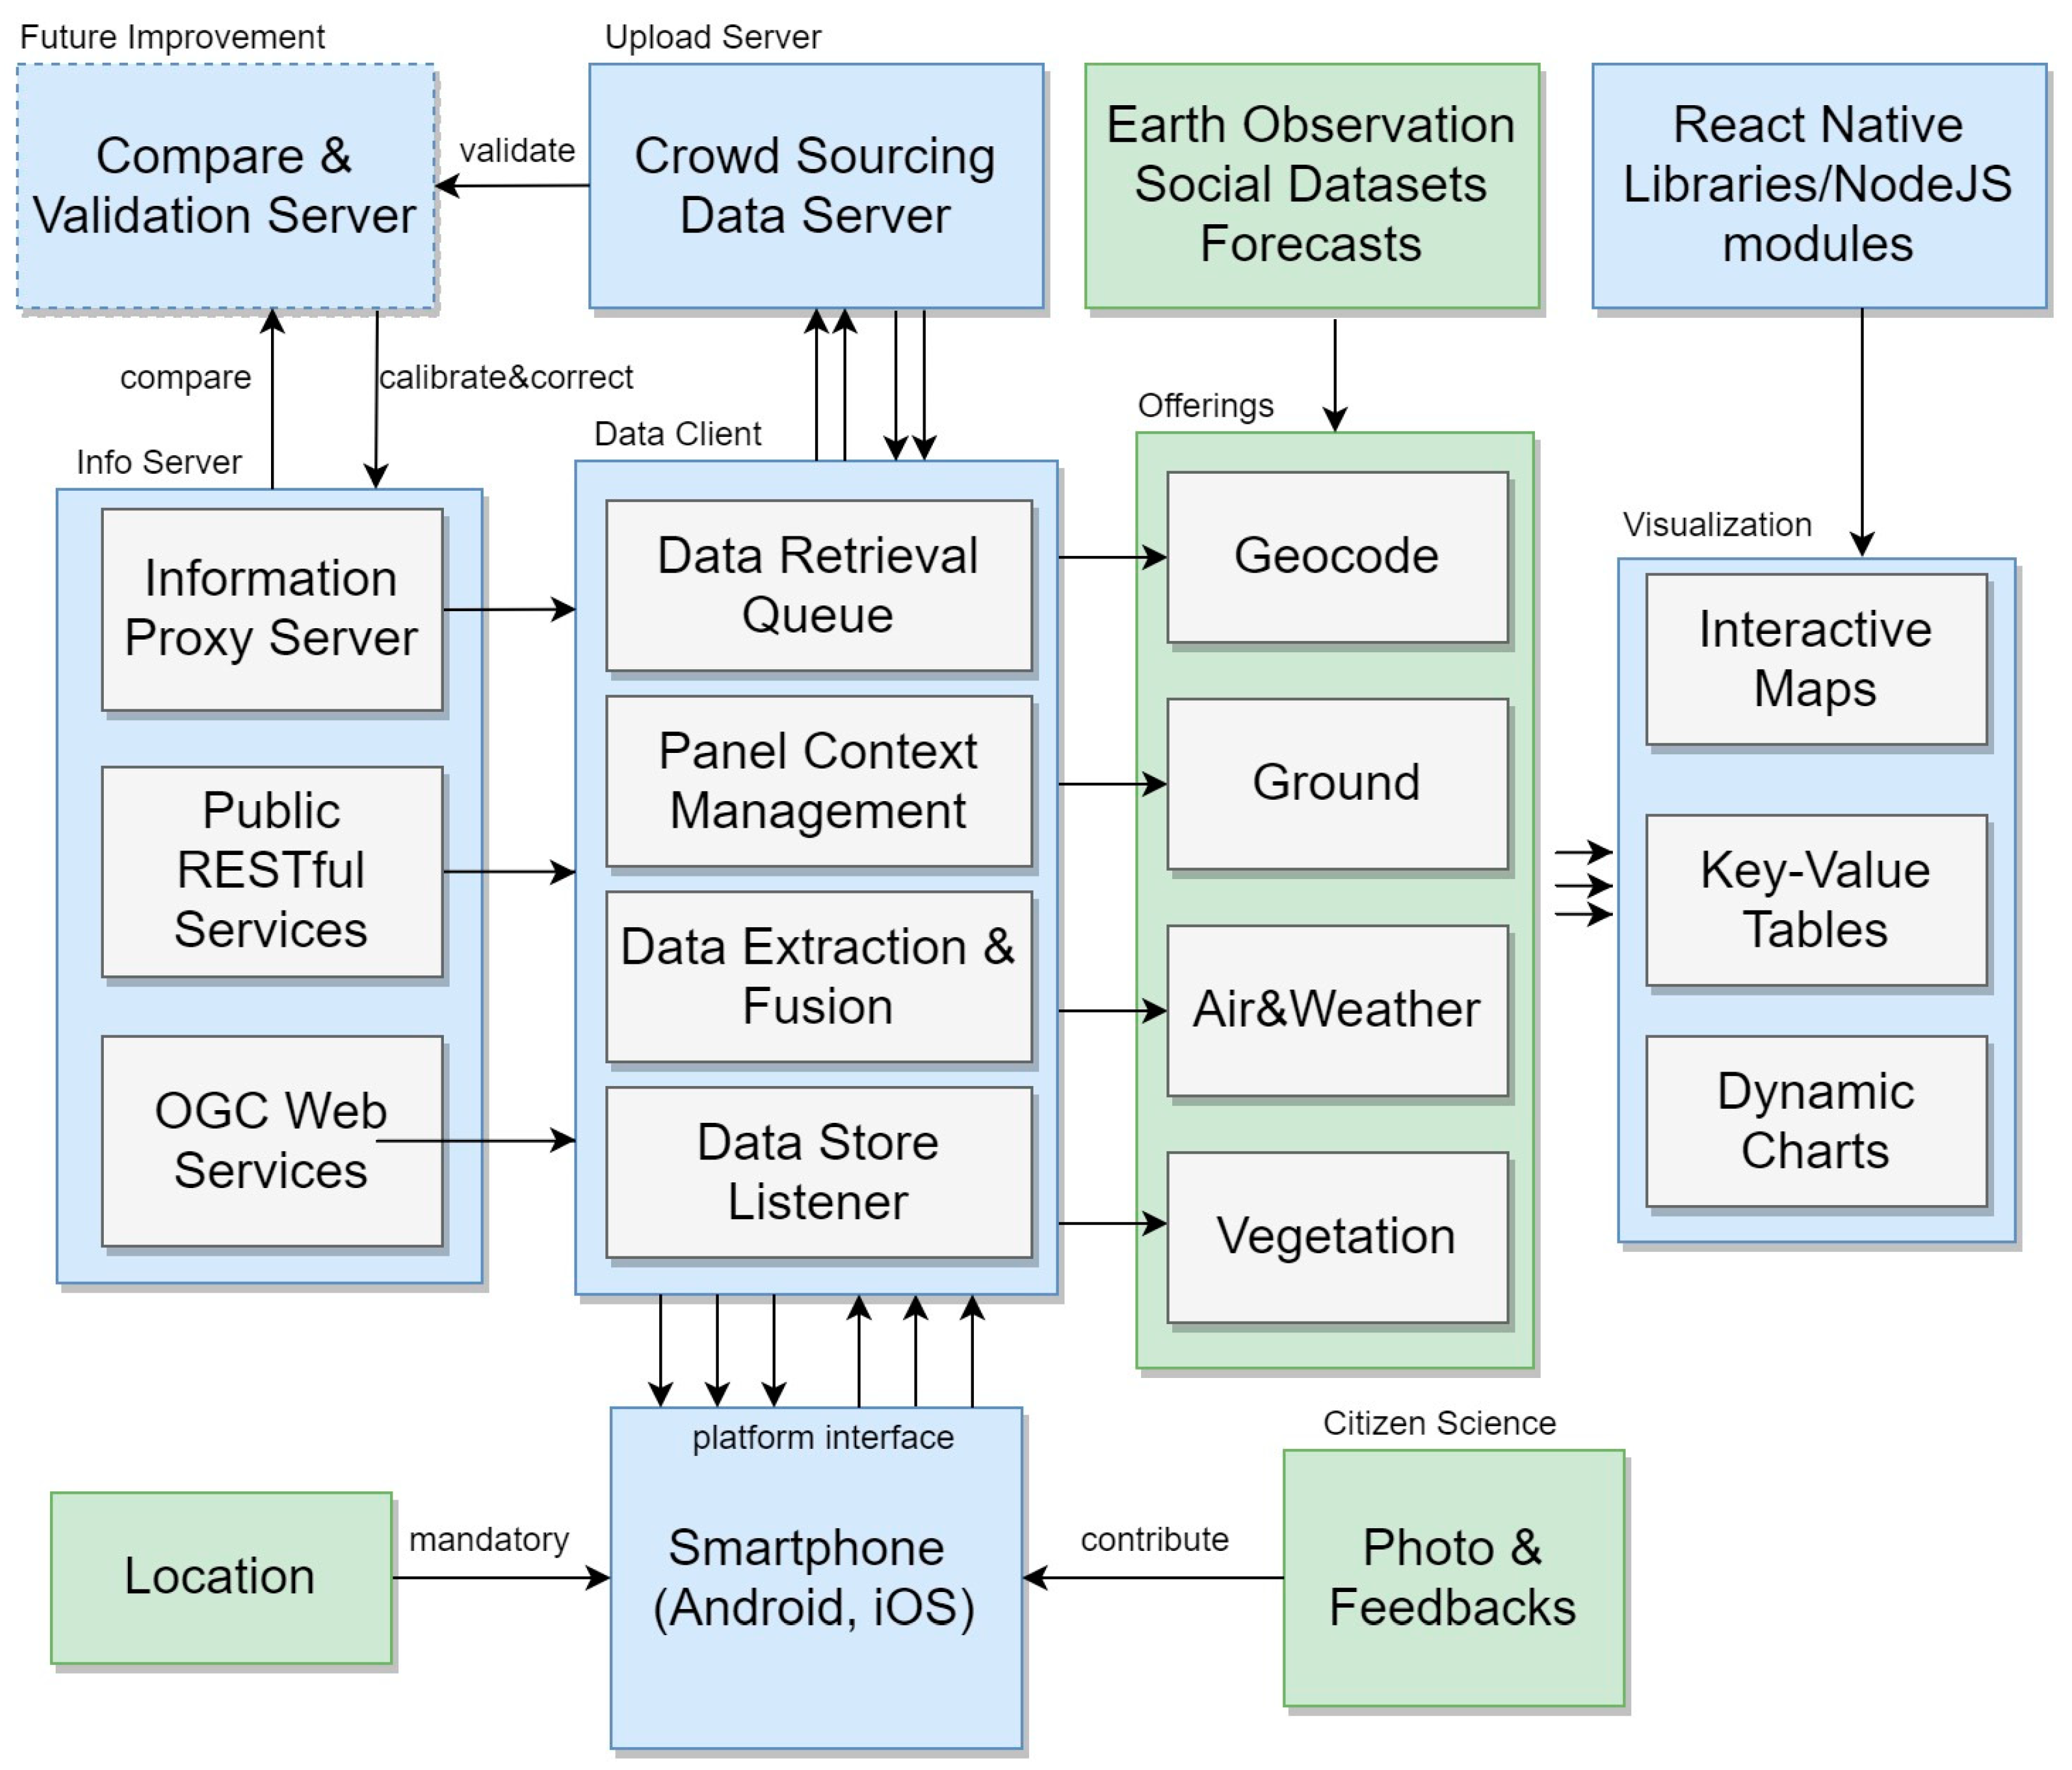
To address the legacy problems and incorporate new capabilities, a new design is proposed (illustrated in Figure 3). It is a composition of multiple sub-module components and the connections among them, which are introduced in detail below.

3.1. Geospatial Web Service Module

This module refers to the Info Server block in Figure 3 and contains all information services that are used to process data requests from GeoFairy2 and send back actual information. To realize the application-level data aggregation, the architecture reuses the existing geospatial web services to fill in this module. There are thousands of web services offering tens of thousands of terabytes of geospatial data that are still growing [32,33,34,35,36,37]. However, selecting underlying web services for mobile Apps need extra attention to quality [38]. The web services need to meet several criteria to become qualified as an information source.

3.1.1. High Sustainability

GeoFairy2 architecture heavily rely on backend web services. The used web services should have stable long-term availability. The services are better maintained if attended by a specialized person. In that case, only the web services that are backed by well-reputed businesses or reliable government agencies are appropriate to be relied on. Otherwise, the solution code should be prepared for an unexpected situation, such as service offline, interface altering, data gaps, internal errors if those prototype web services from research projects are involved. It is questionable whether the service would persist after the funding is over. Therefore, a modular design is highly recommended to avoid software collapse when exceptions occur during the operation period.

3.1.2. High Throughput & Low Latency

A single server has limited capability in serving user requests. A reliable web service needs solid gateway routers and robust hardware to deal with a large number of concurrent requests. The network interface card (NIC) should have a very high throughput and spare NICs are preferable. If the requests are at an overwhelming level, a load balancer would be recommended and the requests on a single node should not exceed a threshold to provide a low latent response. Memory leaking is a common issue that might cause the entire system to collapse. High memory volume is important to ensure service stability. The volume of Earth observations, especially remote sensing imagery datasets, is tremendous, and processing them need a lot more computational power than normal datasets. Powerful hardware and robust software is the prerequisite to enable low latency and high throughput. These details need to be thoroughly investigated before adopting them [39].

3.1.3. Interoperable Interface

To address the data heterogeneity challenges, the interface of the candidate web services should be easily interoperable [40]. There should be explicit manuals on calling the services (e.g., Swagger). Standard interfaces such as OGC WMS (Web Map Service) [41], WFS (Web Feature Service), WCS (Web Coverage Service) are preferred. RESTful web services with detailed documentation are also recommended. OpenAPI Specification v3 [42] was released as a milestone for the API developer community, to adopt as a common standard service interface. More standard web services are forthcoming and could be easily integrated via these standards.

3.2. Communication Module

This module refers to all arrows and their associated interfaces in Figure 3. All displayed information in GeoFairy2 is real-time collected from the Internet. It has no built-in data upon the installation. A valid Internet connection is required. For remote sites where the signals might be weak, solutions like offline data storage are discussed. The current design is based on the assumption that there are at least occasional Internet connections to the smartphones.
The communication between client and server follows the standard protocols: HTTP (Hypertext Transfer Protocol). Other lower-level network protocols such as TCP (Transmission Control Protocol) or UDP (User Datagram Protocol) can also be directly used. Today most smartphones are equipped with hardware to support multiple protocols like Wi-Fi (IEEE 802.11), 4G LTE (IMT-2000), and Bluetooth, to transmit data wirelessly. To communicate with the higher-level standard service interfaces, such as REST API, OGC web services, the client and server need to use the same set of protocols for communication between them. This requires a detailed specification of parameters, structures, encodings, algorithms, etc. For geospatial information, further specifications and standards on projections, resolution, timestamp, data format, and metadata are mandatory for the other-side program to correctly decode the information.
Fortunately, OGC, ISO, W3C, OpenAPI, and many other standardization organizations already considered these issues and made a whole set of interoperability standards accordingly. Those web service standards fill in the vacuum of regulating geospatial information communication from the bottom to the top. The interoperability standards cover almost every aspect of the workflow to transmit geospatial information among individual remote devices. The conventional OGC web services offer two types of protocols—plain XML and SOAP (Simple Object Access Protocol). Recent development shows that RESTful web services have become popular and JSON is now a routine format for information exchange [43]. The popularity of RESTful web services is largely pinned on its simplicity and generality, and is limited to several unified conclusive verbs: GET, POST, PUT, PATCH, and DELETE, which cover almost all transaction requirements. In this architecture, the communication between client and server is in multiple formats and should remain flexible, according to real-world situations.

3.3. Mobile Gateway Endpoint Module

The internal design of the app includes four major data-centric submodules (the DataClient block in Figure 3). Each submodule deals with one specific kind of requirement.

3.3.1. Data Retrieval Queue Submodule

This architecture allows the client to talk to multiple web services simultaneously. The data retrieval graph becomes complicated accordingly because of the network uncertainty, hardware/software capacity, and variety of transferred data volume. Generally speaking, the data retrieval speed is determined by the status of the loads on the client and the server, and the network, which could be simply represented using the following equation:
T r = a × L c × L s × O d C c × C s × Q n + e
where T r is the time cost of retrieving data from server to client; L c and L s are the workload on client and server; O d is the complexity of the transmitted data, which is a combined score measuring the volume, dimension, structure, format, encoding, etc.; Q n denotes the quality of the network between the client and the server; C c and C s are the system capacity of the client and the server and could be measured by the maximum data the system can process every second. The coefficient a is a constant number transforming the ratio to a time unit, and e is the uncertain error.
According to the equation, when the two endpoints and networks in between are settled, the time cost is mostly decided by the real-time workload and data complexity. To reduce the latency of the system, the average requests on each server node should be balanced and remain under certain thresholds, the transmitted geospatial information should be simple and low dimensional. However, in the proposed architecture, even though the requests are simple, the client would struggle to handle the parallel requests to various web services. To achieve a smooth use of the client, a queuing system should be placed to avoid long-time freezing. The first step is to send all requests out via asynchronous channels. A queued receiver will start to listen to the response. As more traffic is conducted on the HTTP protocol, the requests would use the AJAX technique. However, WebSocket [44] and other mutual communication protocols would be better for those tasks. For every response received, the queue would assign a receiver to redirect the information to the corresponding data processor (discussed in Section 3.3.3). The receiver queue is loosely coupled with the interface module and would not crash or delay the user interface when some service requests are jammed or failed.
Another important design principle of this module is to reduce the complexity of the transmitted data. A high degree of complexity is one of the significant features distinguishing EO datasets from the others. The organization and storage of EO datasets on the server side could add a big-time cost to the query and computing performances. To avoid the intensive processing burden relocating to the client-side, the data to be transmitted need to be in very fine grain. The data tree structure should be no more than three levels and the information should be divided into the finest grain pieces. Information should be fragmented and the dimension should be lowered. For example, some satellite image products have hundreds of bands and the coordinate system is three or more dimensional (time and height). The best scale of the transmitted data in one transaction is one band value at one location (three values—latitude, longitude, band value). It would not only relieve the burden on the network and shorten the waiting time for the users, but would also improve the system robustness by simplifying the data processing workflow on the client-side.

3.3.2. Data Extraction & Fusion Submodule

The heterogeneity of multisource data makes it difficult to directly use the received data, especially when there are more than two sources for the same data category. For example, the Land Cover category has NASA NLCD (National Land Cover Database) [45], NASA MODIS Land Cover products [46], USDA (United States Department of Agriculture), CDL (cropland data layer) [47], GLC (global land cover), FROM-GLC, etc. The NLCD, CDL, and FROM-GLC are in GeoTiff format, and the MODIS Land Cover products are in HDF (Hierarchical Data Format). A large portion of the costs in reusing existing services is charged by this step. The common processes to unify the datasets include reprojection, resampling, regridding, reformatting, mosaic, merging, getting location reports, etc [48,49]. Most web services do all the preprocessing work. GeoFairy2 only needs to retrieve the data via standard interfaces like WMS GetFeatureInfo without worrying about the data processing method. After retrieving the location-based information, GeoFairy2 needs to do data harmonization, by integrating multi-source data into a co-registered dataset, with the same or compatible spatial resolution and projection. As it is a point-based data processing, the amount of information to be processed by GeoFairy2 is tiny and can be rapidly accomplished by mobile devices.

3.3.3. Data Store Listener Submodule

The results from the extraction module is pushed into the data store module. The data store is a dedicated block in the smartphone’s memory. Each information category has a separate data store. The data store and the user interface are synchronized. Any change in the data store is instantly reflected in the interface. For example, the data store has new weather forecasting information, the interface refresh is triggered instantly and the new information is directly displayed. A listener is responsible for constantly monitoring the data stores and triggering the rendering of the corresponding interface region. The listener maintains a set of preinstalled rendering functions for various categories of information. Besides the data from the retrieval module, the data store also saves the data about user preference, e.g., users usually turn off some data categories that they are not interested in to keep the interface concise. Unlike the other in-memory data stores that are cleaned after the app is closed, the client data store would persist in a file database on the smartphone’s external memory. Data persistence is also the responsibility of the data store listener.

3.3.4. Panel Context Management Submodule

As a general-purpose app, it covers multi-thematic information and the interface design should contain multiple tab panels to keep the information organized. Each tab panel is thematic and domain-specific. All panels must be about the same location and this module is built to ensure that. Panel context is important to allow each tab panel to manage their data, while keeping consistent on the target location. Every time users switch to other locations (via clicking on the map or entering city names), the tab panels can always quickly turn around and refresh their information to reflect the situation of the last selected location. The context management also serves as a coordinator to link the datasets via their properties. Sometimes the observations and data products do not agree with each other. Context management is responsible to detect the inconsistency and warn about it or discard the believed corrupted information based on quality control results.

3.3.5. Visualization

The visualization of location-linked data are implemented in three major forms—map, charts, and tables (as shown in the Visualization block in Figure 3). The details are introduced in [8]. In this new design, the improvements are mostly done on adjusting the composite and transitioning among the three forms. Notebook-style rendering has become popular, along with the wide adoption of Jupyter Notebook [50], within both science and industry. Users only need to swipe on the smartphone screen with all information just under their fingertips. The tables, maps, and charts are aligned and fit into a one-column document. Reading geospatial information should feel no different from reading a newspaper.

3.4. Citizen Science Module

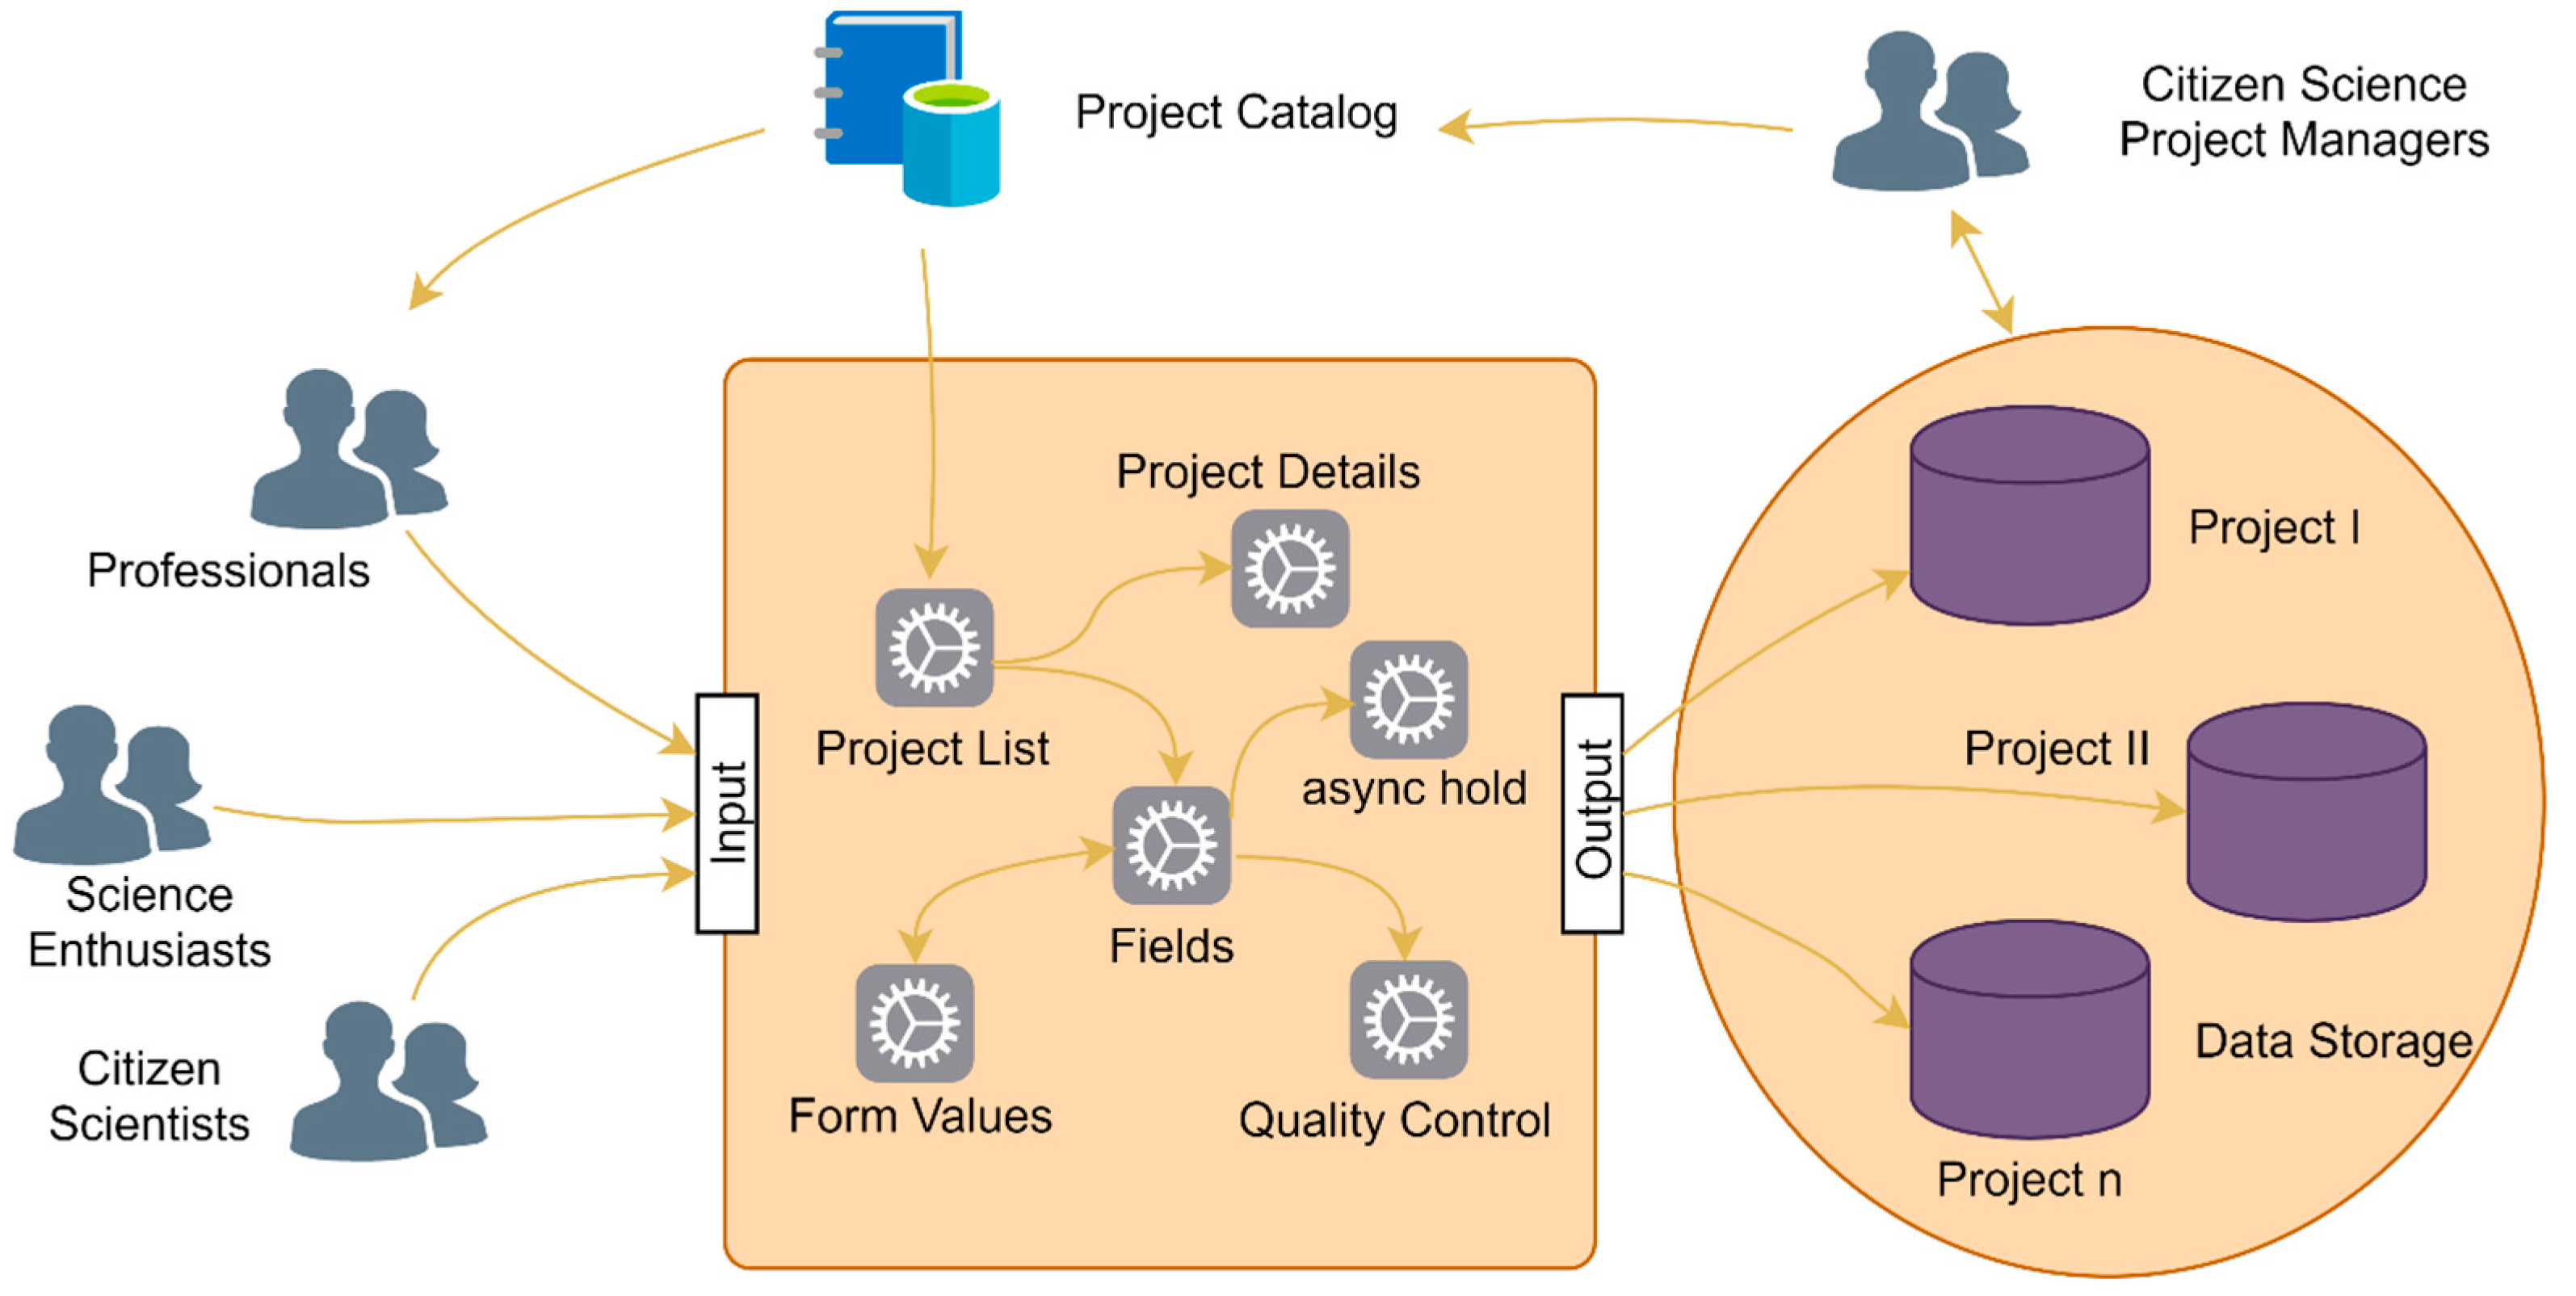
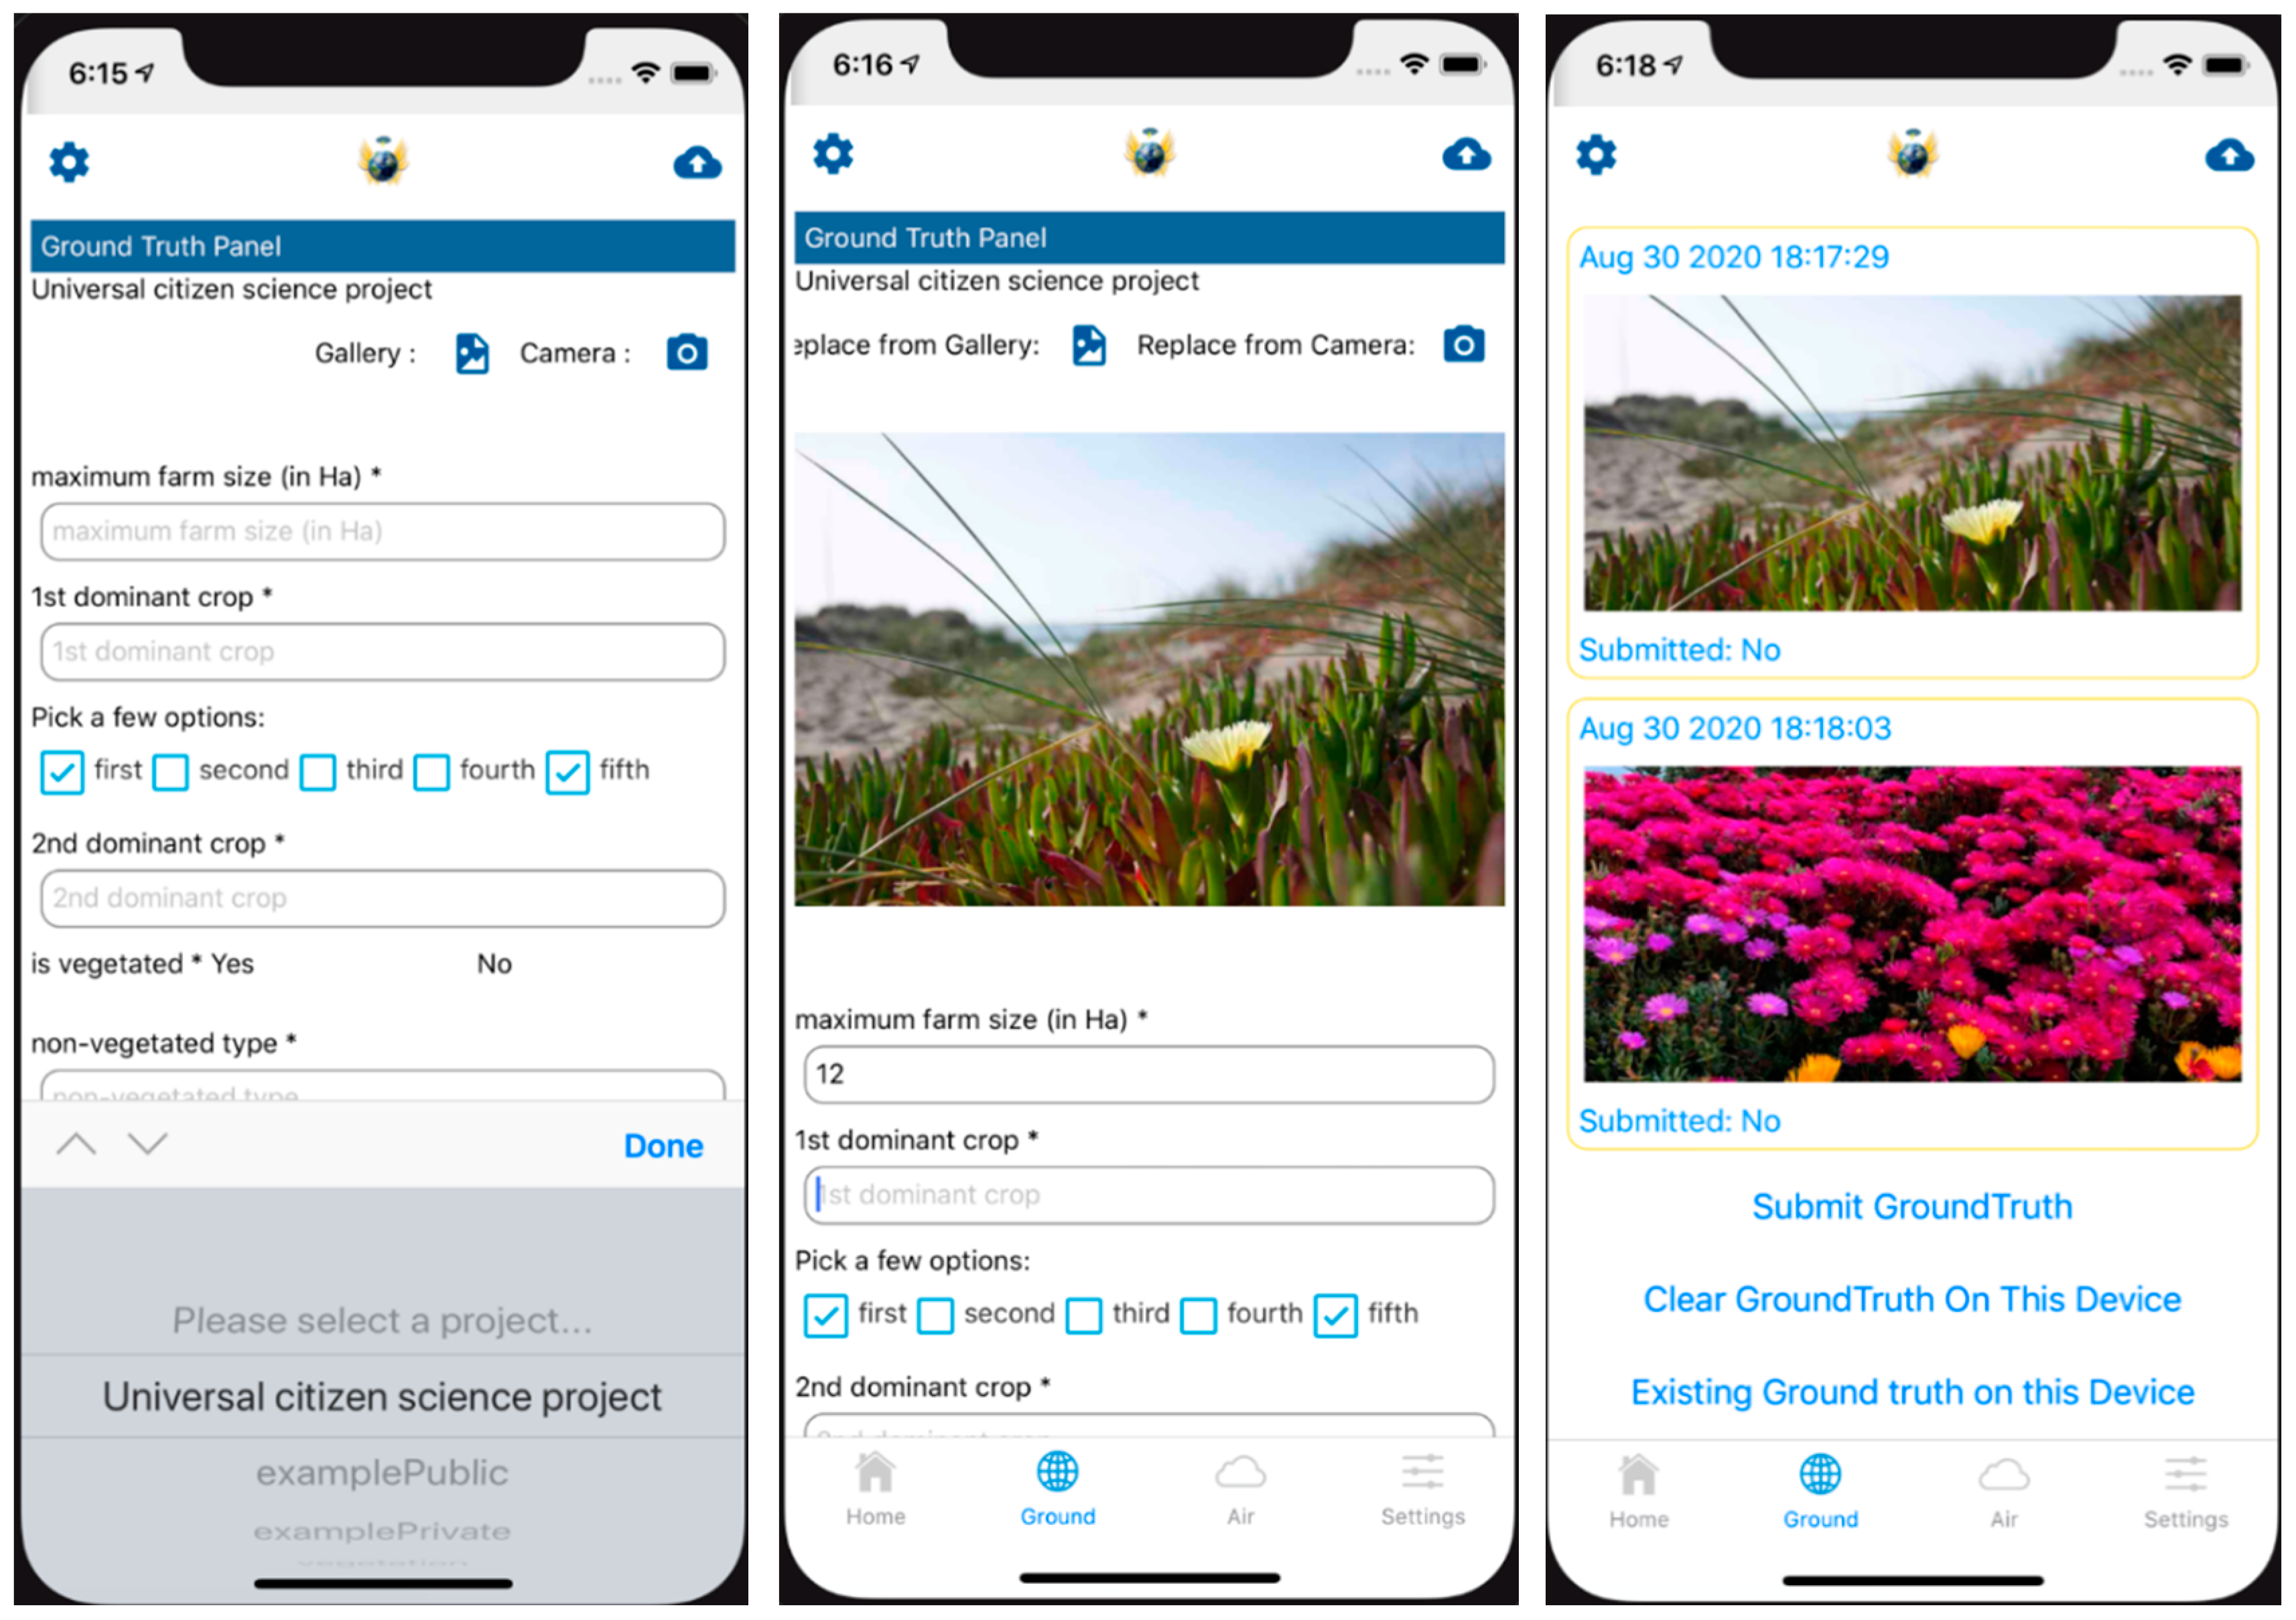
One of the major goals of GeoFaiyV2 is to engage the public to interact with geospatial information, rather than just receiving the information. It means the data consumers could also become data providers. There are many citizen science Apps out there, and most of them follow a similar design. The sensors on the client devices are connected with the software via system driver libraries and platform interfaces. For example, both Android and iOS have API for a high-resolution digital camera, global positioning system (GPS) sensor, accelerometer, gyroscope, magnetometer, ambient light sensor, and microphone. The data collection function is developed and equipped within the client software or web pages (Figure 4). When users browse around the client, they find it smooth to transit from the role of users to providers. One or multiple customized data servers are set up to receive the data collected by citizen scientists. In this architecture, a similar design is added on top of the previous modules. The client prepares a few submission forms and embed navigating buttons into the data forms. In the submission forms, users could enter their observations associated with photos, location, and other sensed data. Two server-side programs are deployed to receive the data submitted from the clients (the Crowdsourcing Data Server in Figure 3). One program is a data server responsible for storing and querying the data. People can select their interested citizen science project and the form is dynamically changed for people to contribute observations.
Another component is a validation service (the top left blue box in Figure 3) that is responsible for validating the EO products by comparing them with the collected ground truth observations or VGI. If the two disagree, a marker is labeled and the disagreement is recorded for further investigation. If more than three separate individual clients feedback the same disagreements, the validation server places a change request to the EO data server for improvements. The VGI is attached as the new ground truth. If less than three separated feedbacks or the disagreement feedbacks are inconsistent, the request is withheld until enough consistent observations are retrieved. Every client is able to browse its submitted VGI and might also have access to the VGI submitted by other people. All stored VGI is processed to remove personal information about the submitter on behalf of user security. The collected VGI is open and freely accessible via the crowd data server and could benefit tens of thousands of researchers in many disciplines.

4. Results

4.1. System Development

We implemented the proposed architecture into a smartphone App, GeoFairy2, which is available on both the Google Play Store [51] and the Apple Appstore [52]. The app is developed using cutting-edge techniques, such as React Native, Node.js, Expo, D3 chart, Mobx JS data store, OpenLayers, Proj4, Bootstrap.js, Hyperflow, etc. The advantage of React Native is that it can automatically generate installable Apps for Google Play and Appstore, by only writing the JSX code once. It saves a huge amount of time to attract both Android users and iOS users. The programming language of the app is JSX (JavaScript XML), and the server-side programs in Java. The information server, crowd data server, and validation server are deployed on a private cloud, GeoBrainCloud, powered by Apache CloudStack and backed by the resources located in the Aquatic data center of GMU. The services on GMU servers use many open source GIS libraries, such as GDAL, to preprocess, extract, clip, reproject, resample the data residing on GMU servers, such as CDL, Crop Calendar layer, etc. For the datasets not hosted in GMU, GeoFairy2 would directly query third-party web services without going through the GMU server to avoid potential bottlenecks on performance, relieve the burden on the proxy server, accelerate the information loading, and eventually address the data heterogeneity challenges. Table 1 lists most of the datasets displayed in GeoFairy2. Comparing to GeoFairy1, we removed a few datasets that do not have high-quality web services available to ensure good performance. As shown in Table 1, the GMU server only provides crop-related information via WMS. Other web services are backed by renowned federal research institutes or commercial companies. In addition to WMS, GeoFairy2 also uses REST APIs. The retrieved information is filtered and fused on GeoFairy2 by pre-defined rules to only display information with high quality, resolution, accuracy, and value. Both the GMU server and GeoFairy2 app are operationally maintained and new versions are released regularly, with additional functionality and bug fixings.

4.2. Demonstration

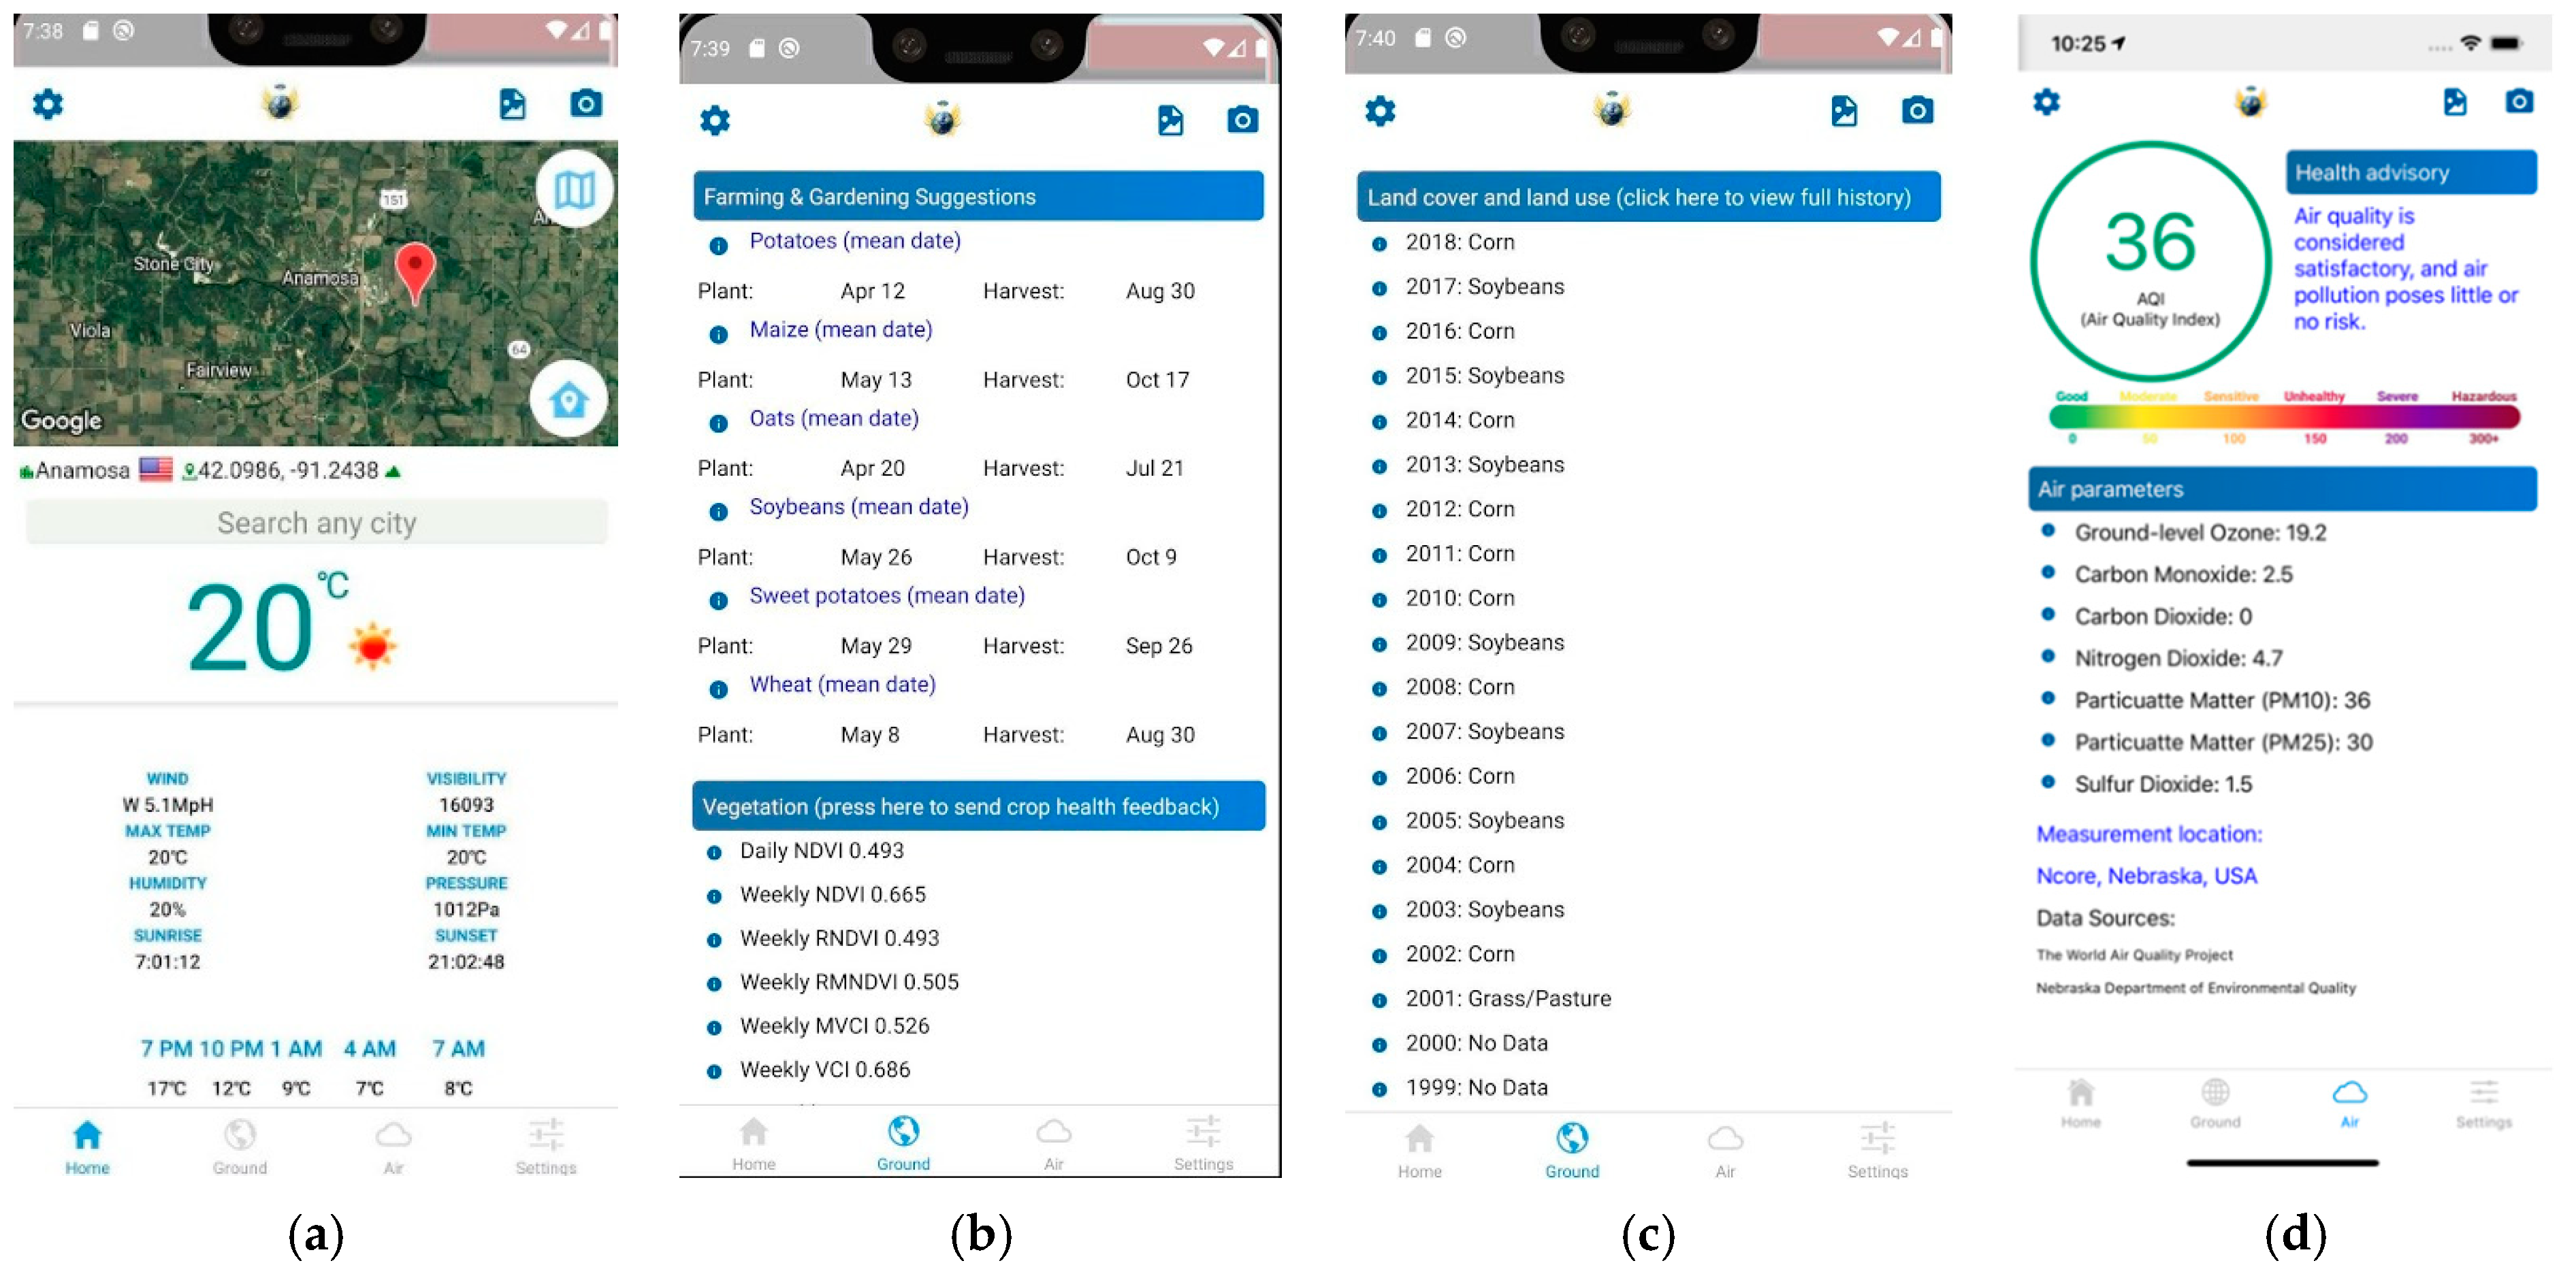
We tested Geofairy2 on real phones that have average 117 milliseconds on Ping, 0.48 Mbps on downloading speed, and 1.55 Mbps on uploading speed. As shown in Figure 5, there are four tabs on the bottom navigation bar: Home, Ground, Air, and Settings. The first screenshot in Figure 5 is the Home panel that shows up when the app is opened. It consists of a top menu, a map component, a geolocation row, a search field, and a weather box. The satellite imagery portion is an interactive map component. If people click on the map button on the top right, it switches to the street map view. GeoFairy2 used the system-built-in map combo that provides a whole set of map functions like zooming in/out, panning, switching view, and labeling locations with markers. The button on the top left allows people to adjust system configuration, such as selecting or unselecting the information categories. The two buttons on the right are for selecting from the gallery or taking a new photo. Permissions are required to access the local photos and use the camera. The map component is movable, zoomable, and clickable. Users can click on any location of their interests. Upon every click, the target location changes and all information panels refresh to load new information. The circle button on the top right can switch the base map between street map tiles and satellite imagery. The button on the bottom right can re-center the map to the device’s current location. The weather module is similar to popular weather widgets, containing temperature, wind, humidity, visibility, sunrise, and sunset time, and the forecasting table lists the model predictions for the next 12 h.
Figure 5b,c are taken from the Ground panel. The farming suggestion section gives empirical knowledge on the mean dates of planting and harvesting, based on the historical calendars. The original data comes from the Wisconsin Crop Calendar dataset [60]. We downloaded and published it as an OGC WMS to support GeoFairy2. It can be seen that the section advises on potato, maize, oats, soybean, wheat, sweet potato, which are very common food crops in America. The vegetation section lists the index products calculated from satellite remote sensing data. The original data products come from USDA VegScape [61]. One of the major indices is NDVI (Normalized Difference Vegetation Index), whose values range from –1 to 1. It measures the greenness of the vegetation and the higher values mean the vegetation is greener. Greenness is highly correlated to vegetation health so many health indices are created based on NDVI, such as VCI (Vegetation Condition Index) [62,63,64] and VHI (Vegetation Health Index) [65]. As the indices are calculated based on remote sensing images that have serious gaps caused by clouds and shadows, there are big blank regions in the images. To avoid cloud problems and make the products more continuous and readable, maximum composites over some time, such as weekly, biweekly, and monthly, are generated. GeoFairy2 searches and displays the index values in the Vegetation section, and meanwhile, provides users a chart to check the history of each index. In the third screenshot, the Land Cover section gives the history of the land cover change of the location. The data come from various sources. In the United States, GeoFairy2 uses CDL (Cropland Data Layer, annual products) provided by USDA NASS; in Africa, it uses GLC30 (Global Land Cover 30 meter); in Asia, South America, and Europe, it uses FROM-GLC (Finer Resolution Observation and Monitoring Global Land Cover) [66]; and in India, Bangladesh, and Nepal, it uses the products generated by CSISS (Center for Spatial Information Science and Systems). For the CDL product, GeoFairy2 reuses web services in CropScape [67]. The other land cover products are served on the information proxy server in GeoBrainCloud [49,64]. The CDL has more classes than other land cover products and gives more detailed records on crops. As CDL is not available in some states and historical years, we used the machine learning (ML) technique to fill in the gaps [68,69,70]. The ML-derived data is labeled to differentiate from the original CDL. From the screenshot, the cropland has a very obvious crop rotation in the past decade, which can keep the soil productive.
Figure 6 shows the form of collecting and submitting ground truth samples to the crowdsourcing server. The form started with a project dropdown selector. People can choose the project they want to contribute to. Once a project is selected, the main body of the screen is filled with empty fields such as dropdowns, radio groups, checkboxes, labels, or questions that are predefined by the citizen science project managers. GeoFairy2 meets the requirement by implementing the “Submit Ground Truth”, which would automatically upload all saved ground truths on the mobile device to the remote server managed by the corresponding project managers. The ground truth servers could use different servers, as project managers might deploy their instances on some trusted facilities. GeoFairy2 just serves as a gateway for citizen scientists to find the project, and channel their collected data to the right places. The loose coupling among citizen scientists, GeoFairy2, and project managers would form a decentralized network and grant a lot of flexibility to all parties.
If users find the displayed information incorrect or inaccurate, they can easily send feedbacks by entering some text, selecting metadata, and taking a real-time photo. The tags contain a hierarchy of keywords. If users cannot find suitable words to label the photo, they can type text in the field below. Once the submit button is hit, the photo, tags, labels, together with all displayed information is sent to the crowdsourcing data server. Attaching the original information to the citizen science dataset would greatly help the validation server to compare and verify the disagreements between user observations and the standard Earth observation products.

4.3. Testing

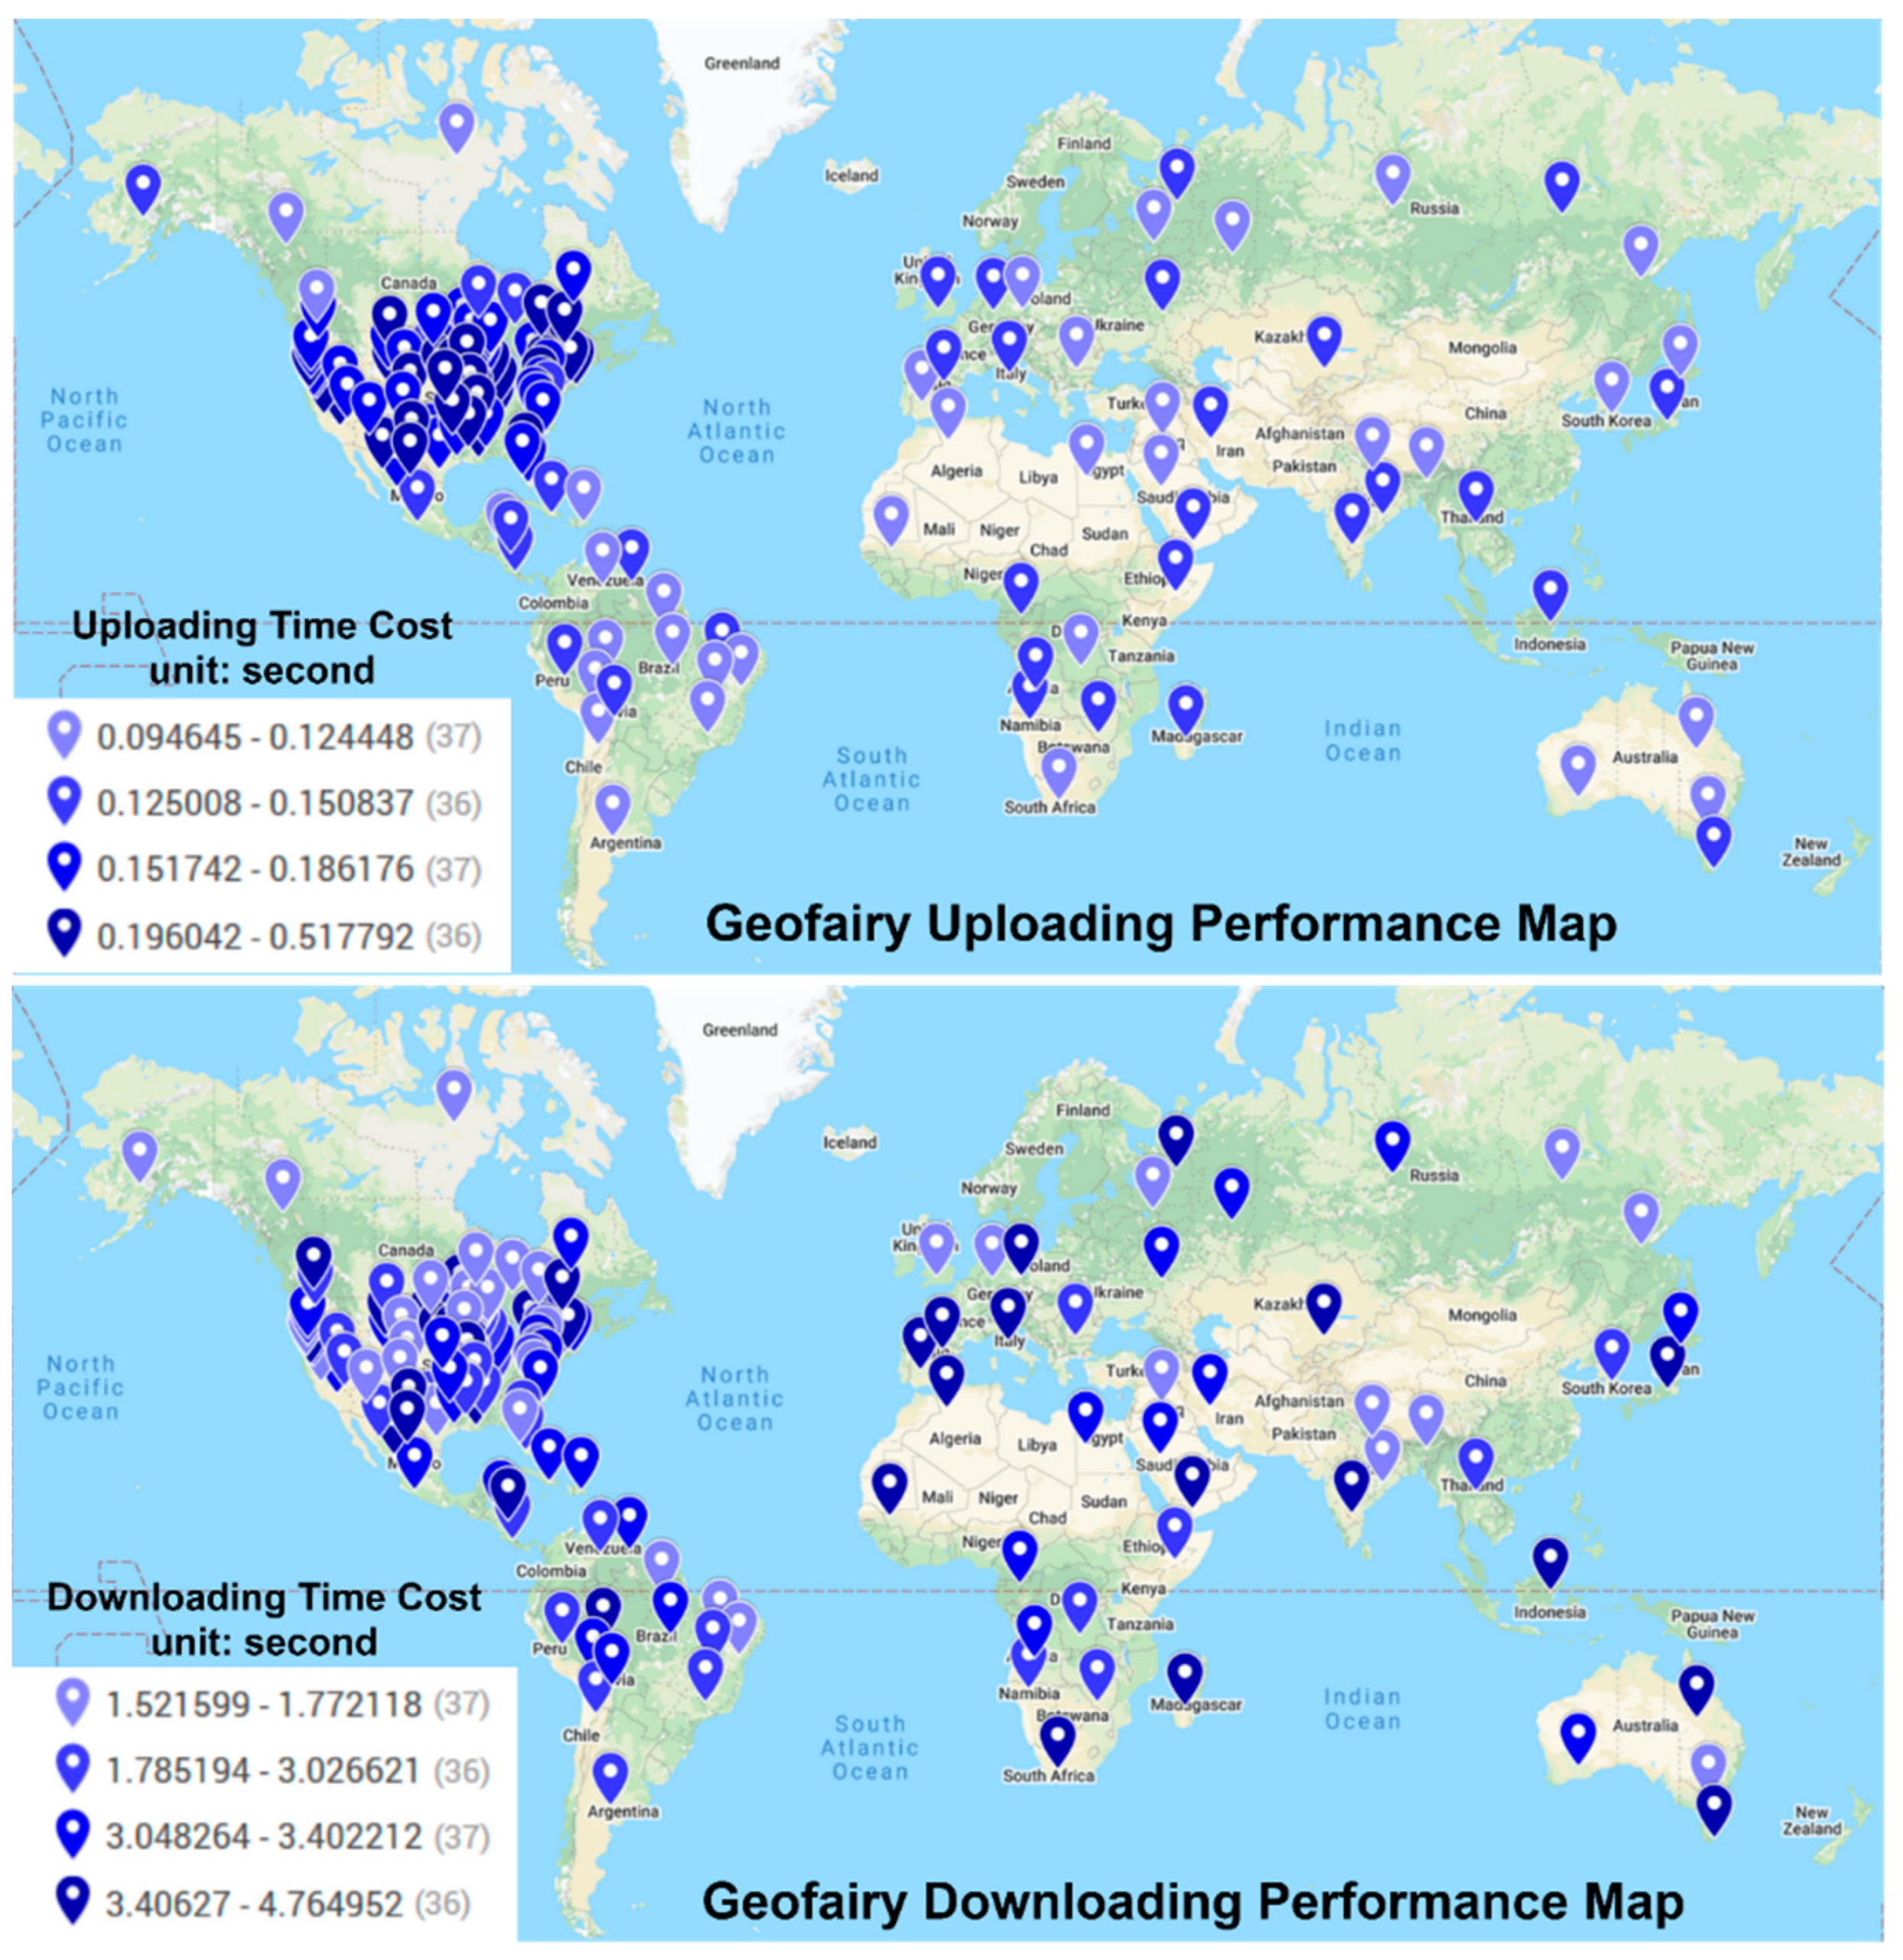
We tested GeoFairy2 in randomly selected locations worldwide (Figure 7), on several testing devices located in Fairfax, Virginia of the USA. The loading time was less than 2 seconds for most information categories. The slowest sections were vegetation and land cover, which normally required 3~4 seconds to complete the data retrieval. However, the first piece of data (e.g., the land cover of 2019) arrived and was in sight within less than 1 second. The app runs smoothly in most places and might experience no data gaps in the coastal regions, where some data products are clipped using inconsistent boundaries. A typical example is in the San Francisco bay area. If clicking on the beaches, the planting suggestion section disappears because of missing data. The total time cost of GeoFairy could be tested from two aspects—download and upload. Downloading traffic includes the transmission of information mainly from the server-side to users’ phones. Uploading traffic means that users submit their data to the ground truth server. The equation of the overall time cost is:
T g e o f a i r y = i n t c i + t s i + t n i
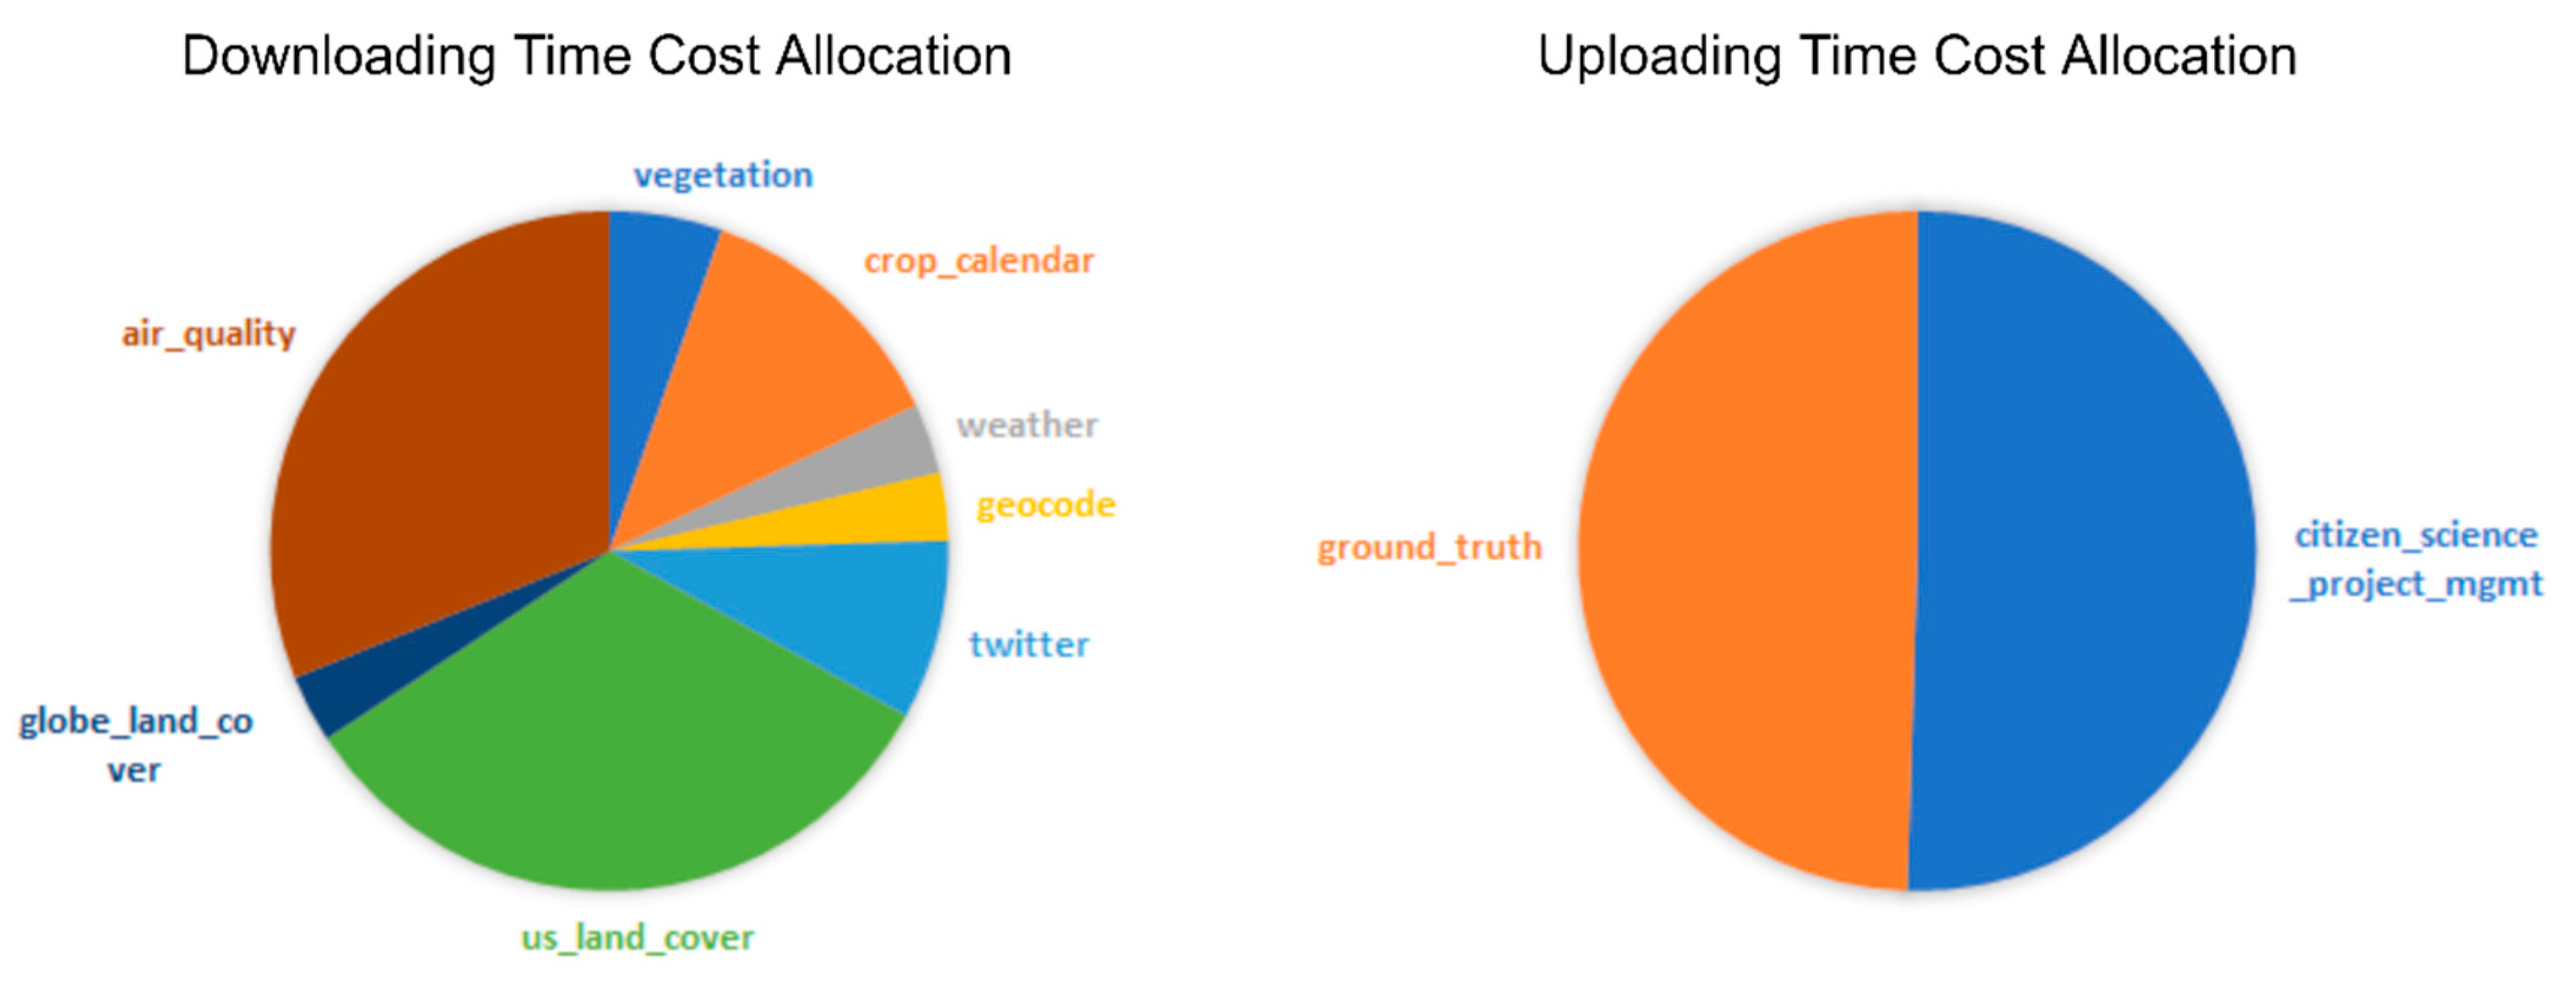
where n is the number of information types, t c i is the time the mobile phone takes to send/receive the data i , t s i is the time cost of server response to requests on i , t n i is the time cost of network transmission of the data i . This equation tells that instead of depending on one single data source, the overall GeoFairy’s performance relies on the communication quality with multiple data providers. The more information categories, the longer the loading takes. As shown in Figure 7, the uploading cost generally ranges from 0.09 to 0.51 s (without image attachment), and the retrieval cost ranges from 1.52 to 4.77 s. As the requests are sent asynchronously, and the information is displayed upon receipt, the actual waiting time for users is less. The results are very impressive as it is the overall cost of fetching data from ten different servers distributed in the United States. Regionally, the Midwest, Northeastern, and western coasts of the United States are a little slower on uploading, and on the contrary, are faster on downloading data. Europe, northern Africa, South Arica, Midwest Asia, India, Indonesia, Japan, and Australia are experiencing slower retrieval experiences, while being relatively faster on submitting ground truths. Figure 8 shows the decomposition of the overall time cost. In the downloading cost, the land cover of the United States (Cropland Data Layer) and the air quality take the biggest portion, while the global land cover (GMU), weather (OpenWeatherMap), and geocoding (Google) are the fastest services. In the uploading time cost, the ground truth submission (without images) and the citizen science project management almost take an equal share. This test demonstrates that GeoFairy can efficiently bring together heterogeneous information and provide a robust mobile gateway for global users, as both an information dissemination portal and a citizen science platform, to support crowdsourcing data collection and sharing.
Additionally, GeoFairy2 can adapt to various types of devices and platforms due to the employed framework. Most source code is developed based on Node.js and Expo React Native, which provides a streamlined workflow to automatically generate installation packages for various mobile operating systems. For different smartphone models, the flexibility of the React-based user interface can ensure that it can correctly display and function on various screens, processors, and sensors. The tested phone models so far include iPhone 6/7/8/X/11/12, Samsung Galaxy S8/S9/S10/S20, Pixel 3a/4a/5 (XL)/C, iPad (7th), and iPad Mini (5th).

5. Discussion

The proposed architecture and GeoFairy2 could play an important role in the current and future society. One of the target application domains is precision agriculture. For example, farmers need to make decisions on the amount of water to be irrigated. The decision depends on various parameters—crop types, season, weather, phenological stages of crops, soil moisture, and soil type. Soil loses water mainly through evapotranspiration (ET) and replenish water through precipitation and irrigation. Crop water needs are analyzed so that an adequate amount of water is added to the soil through irrigation, to ensure that the soil moisture content is adequate to support the healthy growth of crops. GeoFairy2 provides farmers with ET information derived from modeling and EO so that they can schedule a better irrigation calendar rather than solely depending on manual observations. A recent survey within farmers found that the potential of citizen science projects is very promising, since the ownership and use rate of smartphones and farming-specific management apps, and the percentage of farmers interested in and willing to participate in agricultural citizen science projects are all very high.
Currently, it is used in the NSF WaterSmart project to help farmers in Nebraska estimate the crop status and necessity of irrigation, and help people from Nepal ICIMOD to collect rice samples in their fieldwork. Meanwhile, many datasets in GeoFairy2 are not domain-specific and have a broad application scope. Soil properties [71] and lithospheric data [72] are upcoming and will soon be available to help geologists and soil surveyors. The current version can help them with its ground truth collection capabilities. They can use GeoFairy to take field photos, label, and upload them to the GeoFairy ground truth sever. If the Internet is not available on the site, they can save them on the phone and submit them afterward. GeoFairy2 facilitates the labeling of the location and time of the samples of rocks, faults, thrusts, ridges, etc. All submitted samples are accessible and downloadable via the GeoFairy2 ground truth web application.
The framework of GeoFairy2 is designed to be flexible and prepared to plugin either structured, semi-structured, or unstructured data at any time. VGI data like geo-tagged tweets or even COVID risk reports [73] can be easily plugged into GeoFairy via the Data Retrieval and Data Extraction and Fusion module, which is not hardcoded to specific data structures. In fact, besides delivering the standard well-structured data, GeoFairy already integrated Twitter RESTful API to show the related tweets from official accounts, based on the users’ current location. The framework is well poised for integrating less structured data. In the future, more informative VGI would be integrated to benefits more users.

6. Conclusions

This study proposed a mobile framework and developed a mobile app, GeoFairy2. The app is capable of disseminating location-linked information from distributed data centers in a real-time and one-stop manner, and effectively address the heterogeneity challenges in both datasets and mobile devices. The app can help field workers, such as farmers, crop/soil surveyors, geologists, construction workers, travelers, to get a comprehensive location-specific report, by cracking down the digital walls among institutions and retrieving information from various providers. The system was tested in random places worldwide and works as expected, to deliver historical, present, and forecasted information about weather, soil, crops, and air quality. Meanwhile, the system can turn smartphones into sensors for citizen scientists to take photos, fill in questionnaires, and submit their observations as ground truth, to validate and refine the service. GeoFairy2 provides a general platform for nonprofessionals who might not possess any or possess only limited background knowledge of the studied subjects, but is willing to contribute by collecting data. In the foreseeable future, mobile apps would become dominant data gateways and apps like GeoFairy2 would see high needs. This work paves a new way to drive us into a new mobile web with more links and fewer digital walls across data providers and institutions.

Author Contributions

Conceptualization, Ziheng Sun and Liping Di; Methodology, Ziheng Sun; Software, Sreten Cvetojevic, Ziheng Sun, Zhiqi Yu; Validation, Ziheng Sun, Sreten Cvetojevic, and Zhiqi Yu; Formal Analysis, Ziheng Sun, Sreten Cvetojevic, and Zhiqi Yu; Resources, Liping Di and Ziheng Sun; Data Curation, Ziheng Sun; Writing-Original Draft Preparation, Ziheng Sun; Writing-Review and Editing, Liping Di; Visualization, Ziheng Sun, and Sreten Cvetojevic; Supervision, Liping Di, andZiheng Sun; Project Administration, Liping Di and Ziheng Sun; Funding Acquisition, Liping Di and Ziheng Sun. All authors have read and agreed to the published version of the manuscript.

Funding

This research is partly funded by grants from the NASA SERVIR program (#80NSSC20K0161), NSF INFEWS program (CNS-1739705), NSF EarthCube program (AGS-1740693), NSF Geoinformatics program (EAR-1947893), NASA Air Quality Health project (#17-HAQ17-0044), and NASA ACCESS program (#80NSSC21M0028).

Conflicts of Interest

The authors declare no conflict of interest.

References

  1. Haklay, M.; Weber, P. Openstreetmap: User-generated street maps. Pervasive Comput. IEEE 2008, 7, 12–18. [Google Scholar] [CrossRef] [Green Version]
  2. Wick, M.; Boutreux, C. GeoNames. Available online: https://www.geonames.org (accessed on 20 December 2020).
  3. Kyzirakos, K.; Karpathiotakis, M.; Garbis, G.; Nikolaou, C.; Bereta, K.; Papoutsis, I.; Herekakis, T.; Michail, D.; Koubarakis, M.; Kontoes, C. Wildfire monitoring using satellite images, ontologies and linked geospatial data. J. Web Semant. 2014, 24, 18–26. [Google Scholar] [CrossRef] [Green Version]
  4. Bai, Y.; Di, L.; Wei, Y. A taxonomy of geospatial services for global service discovery and interoperability. Comput. Geosci. 2009, 35, 783–790. [Google Scholar] [CrossRef]
  5. Tsou, M.-H. Integrated mobile GIS and wireless internet map servers for environmental monitoring and management. Cartogr. Geogr. Inf. Sci. 2004, 31, 153–165. [Google Scholar] [CrossRef] [Green Version]
  6. Komar, C.; Ersoy, C. Location tracking and location based service using IEEE 802.11 WLAN infrastructure. In Proceedings of the European Wireless Workshop, Barcelona, Spain, 24–27 February 2004; pp. 24–27. [Google Scholar]
  7. Council, N.R. Putting People on the Map: Protecting Confidentiality with Linked Social-Spatial Data; National Academies Press: Washington DC, USA, 2007. [Google Scholar]
  8. Sun, Z.; Di, L.; Heo, G.; Zhang, C.; Fang, H.; Yue, P.; Jiang, L.; Tan, X.; Guo, L.; Lin, L. GeoFairy: Towards a one-stop and location based Service for Geospatial Information Retrieval. Comput. Environ. Urban Syst. 2017, 62, 156–167. [Google Scholar] [CrossRef] [Green Version]
  9. Dehnen-Schmutz, K.; Foster, G.L.; Owen, L.; Persello, S. Exploring the role of smartphone technology for citizen science in agriculture. Agron. Sustain. Dev. 2016, 36, 1–8. [Google Scholar] [CrossRef] [Green Version]
  10. Hitzler, P.; Janowicz, K. Linked Data, Big Data, and the 4th Paradigm. Semant. Web 2013, 4, 233–235. [Google Scholar] [CrossRef] [Green Version]
  11. Roth, M.; Bröring, A. Linked open data in spatial data infrastructures. Available online: https://wiki.52north.org/pub/Projects/GLUES/2012-09-10_LoD_SDI_White_Paper_MR_AB.pdf (accessed on 20 December 2020).
  12. Janowicz, K.; Scheider, S.; Pehle, T.; Hart, G. Geospatial semantics and linked spatiotemporal data—Past, present, and future. Semant. Web 2012, 3, 321–332. [Google Scholar] [CrossRef] [Green Version]
  13. Yue, P.; Guo, X.; Zhang, M.; Jiang, L.; Zhai, X. Linked Data and SDI: The case on Web geoprocessing workflows. ISPRS J. Photogramm. Remote Sens. 2016, 114, 245–257. [Google Scholar] [CrossRef]
  14. Becker, C.; Bizer, C. Exploring the Geospatial Semantic Web with DBpedia Mobile. Web Semant. Sci. Serv. Agents World Wide Web 2009, 7, 278–286. [Google Scholar] [CrossRef]
  15. Stadler, C.; Lehmann, J.; Höffner, K.; Auer, S. Linkedgeodata: A core for a web of spatial open data. Semant. Web 2012, 3, 333–354. [Google Scholar] [CrossRef]
  16. Bakillah, M.; Mostafavi, M.A.; Liang, S.H. Enriching SQWRL queries in support of geospatial data retrieval from multiple and complementary sources. In Proceedings of the International Conference on Conceptual Modeling, Florence, Italy, 15 October 2012; pp. 241–250. [Google Scholar]
  17. Bizer, C.; Heath, T.; Berners-Lee, T. Linked data: The story so far. In Semantic Services, Interoperability and Web Applications: Emerging Concepts; IGI Global: Hershey, PA, USA, 2011; pp. 205–227. [Google Scholar]
  18. Tulloch, A.I.; Possingham, H.P.; Joseph, L.N.; Szabo, J.; Martin, T.G. Realising the full potential of citizen science monitoring programs. Biol. Conserv. 2013, 165, 128–138. [Google Scholar] [CrossRef] [Green Version]
  19. Statista. Number of Smartphone Users Worldwide from 2016 to 2021. Available online: https://www.statista.com/statistics/330695/number-of-smartphone-users-worldwide (accessed on 13 December 2020).
  20. Sousa, L.B.; Fricker, S.R.; Doherty, S.S.; Webb, C.E.; Baldock, K.L.; Williams, C.R. Citizen science and smartphone e-entomology enables low-cost upscaling of mosquito surveillance. Sci. Total Environ. 2020, 704, 135349. [Google Scholar] [CrossRef] [PubMed]
  21. Michels, M.; Fecke, W.; Feil, J.-H.; Musshoff, O.; Pigisch, J.; Krone, S. Smartphone adoption and use in agriculture: Empirical evidence from Germany. Precis. Agric. 2020, 21, 403–425. [Google Scholar] [CrossRef]
  22. Uyeda, K.A.; Stow, D.A.; Richart, C.H. Assessment of volunteered geographic information for vegetation mapping. Environ. Monit. Assess. 2020, 192, 1–14. [Google Scholar] [CrossRef] [PubMed]
  23. Wang, C.; Gimona, A.; Jiang, Y. Geovisualization of Forest Dynamics via Mobile GIS. In Proceedings of the 21st EGU General Assembly (EGU 2019), Vienna, Austria, 7–12 April 2019. [Google Scholar]
  24. Connors, J.P.; Lei, S.; Kelly, M. Citizen science in the age of neogeography: Utilizing volunteered geographic information for environmental monitoring. Ann. Assoc. Am. Geogr. 2012, 102, 1267–1289. [Google Scholar] [CrossRef]
  25. Frommberger, L.; Schmid, F.; Cai, C. Micro-mapping with smartphones for monitoring agricultural development. In Proceedings of the 3rd ACM Symposium on Computing for Development, Bangalore, India, 11–12 January 2013; p. 46. [Google Scholar]
  26. Pongnumkul, S.; Chaovalit, P.; Surasvadi, N. Applications of smartphone-based sensors in agriculture: A systematic review of research. J. Sens. 2015, 2015. [Google Scholar] [CrossRef] [Green Version]
  27. Lamprou, I. Farmuino. Available online: https://play.google.com/store/apps/details?id=com.javapapers.android.agrofarmlitetrial (accessed on 12 August 2020).
  28. AgriApp. AgriApp: Smart Farming App for Indian Agriculture. Available online: https://play.google.com/store/apps/details?id=com.criyagen (accessed on 13 December 2020).
  29. Farmis. Agrobase—Weed, Disease, Insect. Available online: https://play.google.com/store/apps/details?id=lt.farmis.apps.farmiscatalog (accessed on 13 December 2020).
  30. IQAir. AirVisual. Available online: https://play.google.com/store/apps/details?id=com.airvisual (accessed on 12 August 2020).
  31. EPA. EPA’s AIRNow. Available online: https://play.google.com/store/apps/details?id=com.saic.airnow (accessed on 12 August 2020).
  32. Sun, Z.; Yue, P. The use of Web 2.0 and geoprocessing services to support geoscientific workflows. In Proceedings of the 2010 18th International Conference on Geoinformatics, Beijing, China, 18–20 June 2010; pp. 1–5. [Google Scholar]
  33. Gaigalas, J.; Di, L.; Sun, Z. Advanced Cyberinfrastructure to Enable Search of Big Climate Datasets in THREDDS. ISPRS Int. J. Geo-Inf. 2019, 8, 494. [Google Scholar] [CrossRef] [Green Version]
  34. Sun, Z.; Di, L.; Zhang, C.; Fang, H.; Yu, E.; Lin, L.; Tang, J.; Tan, X.; Liu, Z.; Jiang, L. Building robust geospatial web services for agricultural information extraction and sharing. In Proceedings of the 2017 6th International Conference on Agro-Geoinformatics (Agro-Geoinformatics), Fairfax, VA, USA, 7–10 August 2017; pp. 1–4. [Google Scholar]
  35. Sun, Z.; Di, L.; Zhang, C.; Lin, L.; Fang, H.; Tan, X.; Yue, P. Combining OGC WCS with SOAP to faciliate the retrieval of remote sensing imagery about agricultural fields. In Proceedings of the 2016 5th International Conference on Agro-Geoinformatics (Agro-Geoinformatics), Tianjin, China, 18–20 July 2016; pp. 1–4. [Google Scholar]
  36. Tan, X.; Guo, S.; Di, L.; Deng, M.; Huang, F.; Ye, X.; Sun, Z.; Gong, W.; Sha, Z.; Pan, S. Parallel Agent-as-a-Service (P-AaaS) Based Geospatial Service in the Cloud. Remote Sens. 2017, 9, 382. [Google Scholar] [CrossRef] [Green Version]
  37. Yue, P.; Gong, J.; Di, L.; Yuan, J.; Sun, L.; Sun, Z.; Wang, Q. GeoPW: Laying Blocks for the Geospatial Processing Web. Trans. GIS 2010, 14, 755–772. [Google Scholar] [CrossRef]
  38. Gao, S.; Mioc, D.; Yi, X. The measurement of geospatial Web service quality in SDIs. In Proceedings of the 2009 17th International Conference on Geoinformatics, Fairfax, VA, USA, 12–14 August 2009; pp. 1–6. [Google Scholar]
  39. Killelea, P. Web Performance Tuning: Speeding Up the Web; O’Reilly Media Inc.: Sebastopol, CA, USA, 2002. [Google Scholar]
  40. Sun, Z.; Di, L.; Huang, H.; Wu, X.; Tong, D.Q.; Zhang, C.; Virgei, C.; Fang, H.; Yu, E.; Tan, X. CyberConnector: A service-oriented system for automatically tailoring multisource Earth observation data to feed Earth science models. Earth Sci. Inform. 2017, 11, 1–17. [Google Scholar] [CrossRef]
  41. OGC. Web Map Service. Version: 2006. Available online: portal.opengeospatial.org/files/?artifact_id=14416 (accessed on 20 December 2020).
  42. Initiative, O. OpenAPI Specification 3.0.3. Available online: https://github.com/OAI/OpenAPI-Specification/blob/master/versions/3.0.3.md (accessed on 13 December 2020).
  43. Rodrigues, C.; Afonso, J.; Tomé, P. Mobile application webservice performance analysis: Restful services with json and xml. In Proceedings of the International Conference on ENTERprise Information Systems, Vilamoura, Portugal, 5–7 October 2011; pp. 162–169. [Google Scholar]
  44. Fette, I.; Melnikov, A. The websocket protocol. RFC 6455, December: 2011. Available online: https://tools.ietf.org/html/rfc6455 (accessed on 20 December 2020).
  45. Homer, C.; Dewitz, J.; Yang, L.; Jin, S.; Danielson, P.; Xian, G.; Coulston, J.; Herold, N.; Wickham, J.; Megown, K. Completion of the 2011 National Land Cover Database for the conterminous United States—Representing a decade of land cover change information. Photogramm. Eng. Remote Sens. 2015, 81, 345–354. [Google Scholar]
  46. NASA. MODIS Data Products Table. Available online: https://lpdaac.usgs.gov/dataset_discovery/modis/modis_products_table (accessed on 1 December 2015).
  47. Boryan, C.; Yang, Z.; Mueller, R.; Craig, M. Monitoring US agriculture: The US department of agriculture, national agricultural statistics service, cropland data layer program. Geocarto Int. 2011, 26, 341–358. [Google Scholar] [CrossRef]
  48. Sun, Z.; Di, L.; Burgess, A.; Tullis, J.A.; Magill, A.B. Geoweaver: Advanced Cyberinfrastructure for Managing Hybrid Geoscientific AI Workflows. ISPRS Int. J. Geo-Inf. 2020, 9, 119. [Google Scholar] [CrossRef] [Green Version]
  49. Sun, Z.; Di, L.; Cash, B.; Gaigalas, J. Advanced cyberinfrastructure for intercomparison and validation of climate models. Environ. Model. Softw. 2019, 104559. [Google Scholar] [CrossRef]
  50. Kluyver, T.; Ragan-Kelley, B.; Pérez, F.; Granger, B.E.; Bussonnier, M.; Frederic, J.; Kelley, K.; Hamrick, J.B.; Grout, J.; Corlay, S.; et al. Jupyter Notebooks—A publishing format for reproducible computational workflows. In Proceedings of the ELPUB, Göttingen, Germany, 7–9 June 2016; pp. 87–90. [Google Scholar]
  51. Cvetojevic, S.; Sun, Z. Geofairy. Available online: https://play.google.com/store/apps/details?id=edu.gmu.csiss.geofairy (accessed on 12 August 2020).
  52. Sun, Z. Geofairy2. Available online: https://apps.apple.com/us/app/GeoFairy2/id1511068881 (accessed on 12 August 2020).
  53. NOAA. National Weather Service—Service API. Available online: https://www.weather.gov/documentation/services-web-api (accessed on 13 December 2020).
  54. OpenWeather. Open Weather Map. Available online: https://openweathermap.org/ (accessed on 13 December 2020).
  55. Makice, K. Twitter API: Up and Running: Learn How to Build Applications with the Twitter API; O’Reilly Media Inc.: Sebastopol, CA, USA, 2009. [Google Scholar]
  56. Team, W.A.Q.I. World Air Quality Index Project. Available online: https://waqi.info (accessed on 13 December 2020).
  57. NASA. NASA GSFS Web Map Service. Available online: https://neo.sci.gsfc.nasa.gov/about/wms.php (accessed on 13 December 2020).
  58. Mayaux, P.; Eva, H.; Gallego, J.; Strahler, A.H.; Herold, M.; Agrawal, S.; Naumov, S.; De Miranda, E.E.; Di Bella, C.M.; Ordoyne, C. Validation of the global land cover 2000 map. IEEE Trans. Geosci. Remote Sens. 2006, 44, 1728–1739. [Google Scholar] [CrossRef] [Green Version]
  59. Daly, C.; Widrlechner, M.P.; Halbleib, M.D.; Smith, J.I.; Gibson, W.P. Development of a new USDA plant hardiness zone map for the United States. J. Appl. Meteorol. Climatol. 2012, 51, 242–264. [Google Scholar] [CrossRef] [Green Version]
  60. Sacks, W.J.; Deryng, D.; Foley, J.A.; Ramankutty, N. Crop planting dates: An analysis of global patterns. Glob. Ecol. Biogeogr. 2010, 19, 607–620. [Google Scholar] [CrossRef]
  61. Mueller, R. VegScape: A NASS Web Service-based US Crop Condition Monitoring System. In Proceedings of the USDA’s 2013 Agricultural Outlook Forum, Arlington, Virginia, 21–22 February 2013. [Google Scholar]
  62. Sun, Z.; Peng, C.; Deng, M.; Chen, A.; Yue, P.; Fang, H.; Di, L. Automation of Customized and Near-Real-Time Vegetation Condition Index Generation Through Cyberinfrastructure-Based Geoprocessing Workflows. IEEE J. Sel. Top. Appl. Earth Obs. Remote Sens. 2014, 7, 4512–4522. [Google Scholar] [CrossRef]
  63. Zhong, S.; Xu, Z.; Sun, Z.; Yu, E.; Guo, L.; Di, L. Global vegetative drought trend and variability analysis from long-term remotely sensed data. In Proceedings of the 2019 8th International Conference on Agro-Geoinformatics (Agro-Geoinformatics), Istanbul, Turkey, 16–19 July 2019; pp. 1–6. [Google Scholar]
  64. Sun, Z.; Di, L.; Fang, H.; Guo, L.; Yu, E.; Tang, J.; Zhao, H.; Gaigalas, J.; Zhang, C.; Lin, L. Advanced Cyberinfrastructure for Agricultural Drought Monitoring. In Proceedings of the 2019 8th International Conference on Agro-Geoinformatics (Agro-Geoinformatics), Istanbul, Turkey, 16–19 July 2019; pp. 1–5. [Google Scholar]
  65. Karnieli, A.; Bayasgalan, M.; Bayarjargal, Y.; Agam, N.; Khudulmur, S.; Tucker, C. Comments on the use of the vegetation health index over Mongolia. Int. J. Remote Sens. 2006, 27, 2017–2024. [Google Scholar] [CrossRef]
  66. Chen, B.; Xu, B.; Zhu, Z.; Yuan, C.; Suen, H.P.; Guo, J.; Xu, N.; Li, W.; Zhao, Y.; Yang, J. Stable classification with limited sample: Transferring a 30 m resolution sample set collected in 2015 to mapping 10 m resolution global land cover in 2017. Sci. Bull. 2019, 64, 370–373. [Google Scholar]
  67. Han, W.; Yang, Z.; Di, L.; Mueller, R. CropScape: A Web service based application for exploring and disseminating US conterminous geospatial cropland data products for decision support. Comput. Electron. Agric. 2012, 84, 111–123. [Google Scholar] [CrossRef]
  68. Sun, Z.; Di, L.; Fang, H.; Burgess, A. Deep Learning Classification for Crop Types in North Dakota. IEEE J. Sel. Top. Appl. Earth Obs. Remote Sens. 2020, 13, 2200–2213. [Google Scholar] [CrossRef]
  69. Sun, Z.; Fang, H.; Di, L.; Yue, P. Realizing parameterless automatic classification of remote sensing imagery using ontology engineering and cyberinfrastructure techniques. Comput. Geosci. 2016, 94, 56–67. [Google Scholar] [CrossRef] [Green Version]
  70. Sun, Z.; Di, L.; Fang, H. Using long short-term memory recurrent neural network in land cover classification on Landsat and Cropland data layer time series. Int. J. Remote Sens. 2018, 40, 593–614. [Google Scholar] [CrossRef]
  71. CSRL. Soil Properties Web Application. Available online: https://casoilresource.lawr.ucdavis.edu/soil-properties (accessed on 13 December 2020).
  72. Müller, R.D.; Cannon, J.; Qin, X.; Watson, R.J.; Gurnis, M.; Williams, S.; Pfaffelmoser, T.; Seton, M.; Russell, S.H.; Zahirovic, S. GPlates: Building a virtual Earth through deep time. Geochem. Geophys. Geosystems 2018, 19, 2243–2261. [Google Scholar] [CrossRef]
  73. Sun, Z.; Di, L.; Sprigg, W.; Tong, D.; Casal, M. Community venue exposure risk estimator for the COVID-19 pandemic. Health Place 2020, 66, 102450. [Google Scholar] [CrossRef]
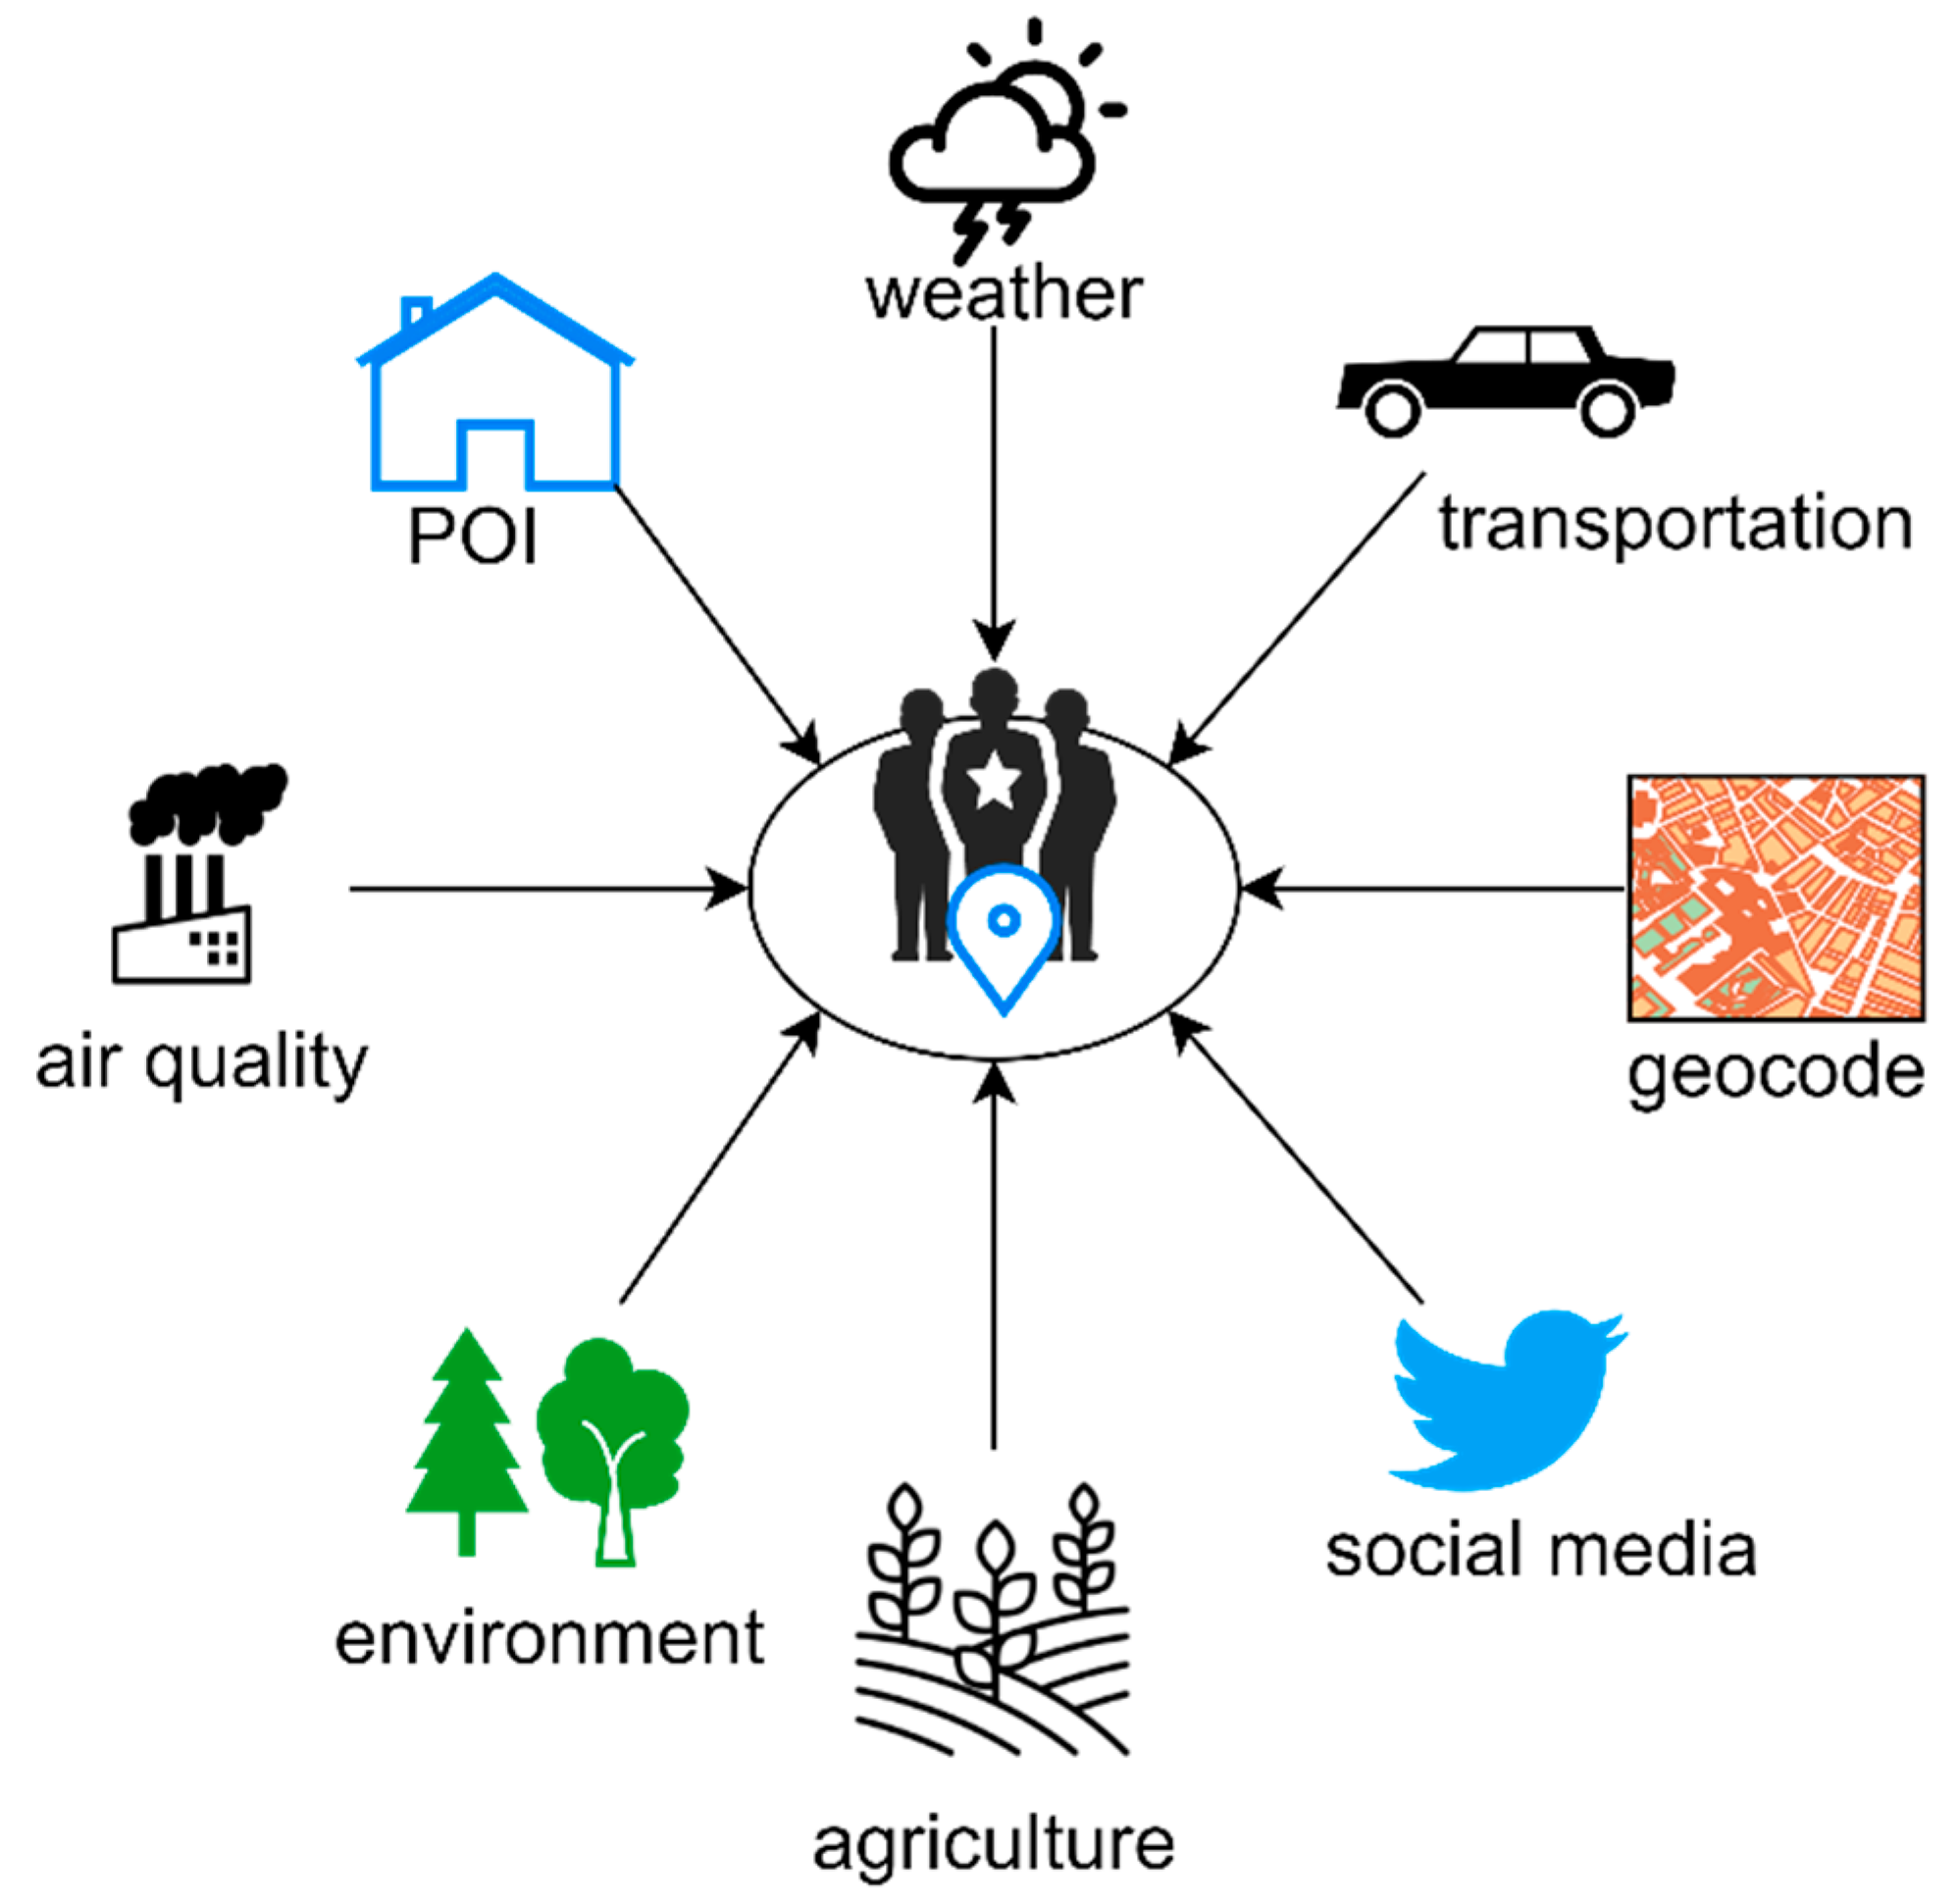
Figure 1. Location-linked data.
Ijgi 10 00001 g001
Figure 2. Provider-level and application-level data aggregation.
Ijgi 10 00001 g002
Figure 3. System architecture (blue boxes—software components; green boxes—data).
Ijgi 10 00001 g003
Figure 4. Citizen Science Module Design.
Ijgi 10 00001 g004
Figure 5. Screenshots of GeoFairy2 (a) home panel; (b) farming advice and vegetation status; (c) land cover history, and (d) air quality.
Ijgi 10 00001 g005
Figure 6. Flexible Citizen Science Module Demonstration.
Ijgi 10 00001 g006
Figure 7. GeoFairy2 Global Performance Maps.
Ijgi 10 00001 g007
Figure 8. GeoFairy2 Time Cost Pies.
Ijgi 10 00001 g008
Table 1. Data list and web service sources used in GeoFairy2.
Dataset NameWeb Service ProviderInteroperability Protocol
Satellite Imagery LayerGoogle & AppleGoogle Tile/Apple Tile API
Street Map LayerGoogle & AppleGoogle Tile/Apple Tile API
Weather & ForecastingNOAA [53] & OpenWeather [54]NWS API/Weather API
Cropland Data LayerGMUWMS
Crop Calendar LayerGMUWMS
Twitter FeedsTwitterTwitter API [55]
Vegetation StatusGMU & NASAWMS
Air QualityWorld Air Quality Index [56]WAQI API
GeocodingGoogleGoogle API
ElevationUSGSWMS
AtmosphereNASA [57]WMS
Global Land Cover 2000JRC-IES [58]WMS
Agricultural HardinessUSDA [59]GIS REST API
Publisher’s Note: MDPI stays neutral with regard to jurisdictional claims in published maps and institutional affiliations.