Comparison of Three Off-the-Shelf Visual Odometry Systems

 ,
,
Abstract
1. Introduction
2. Materials and Methods
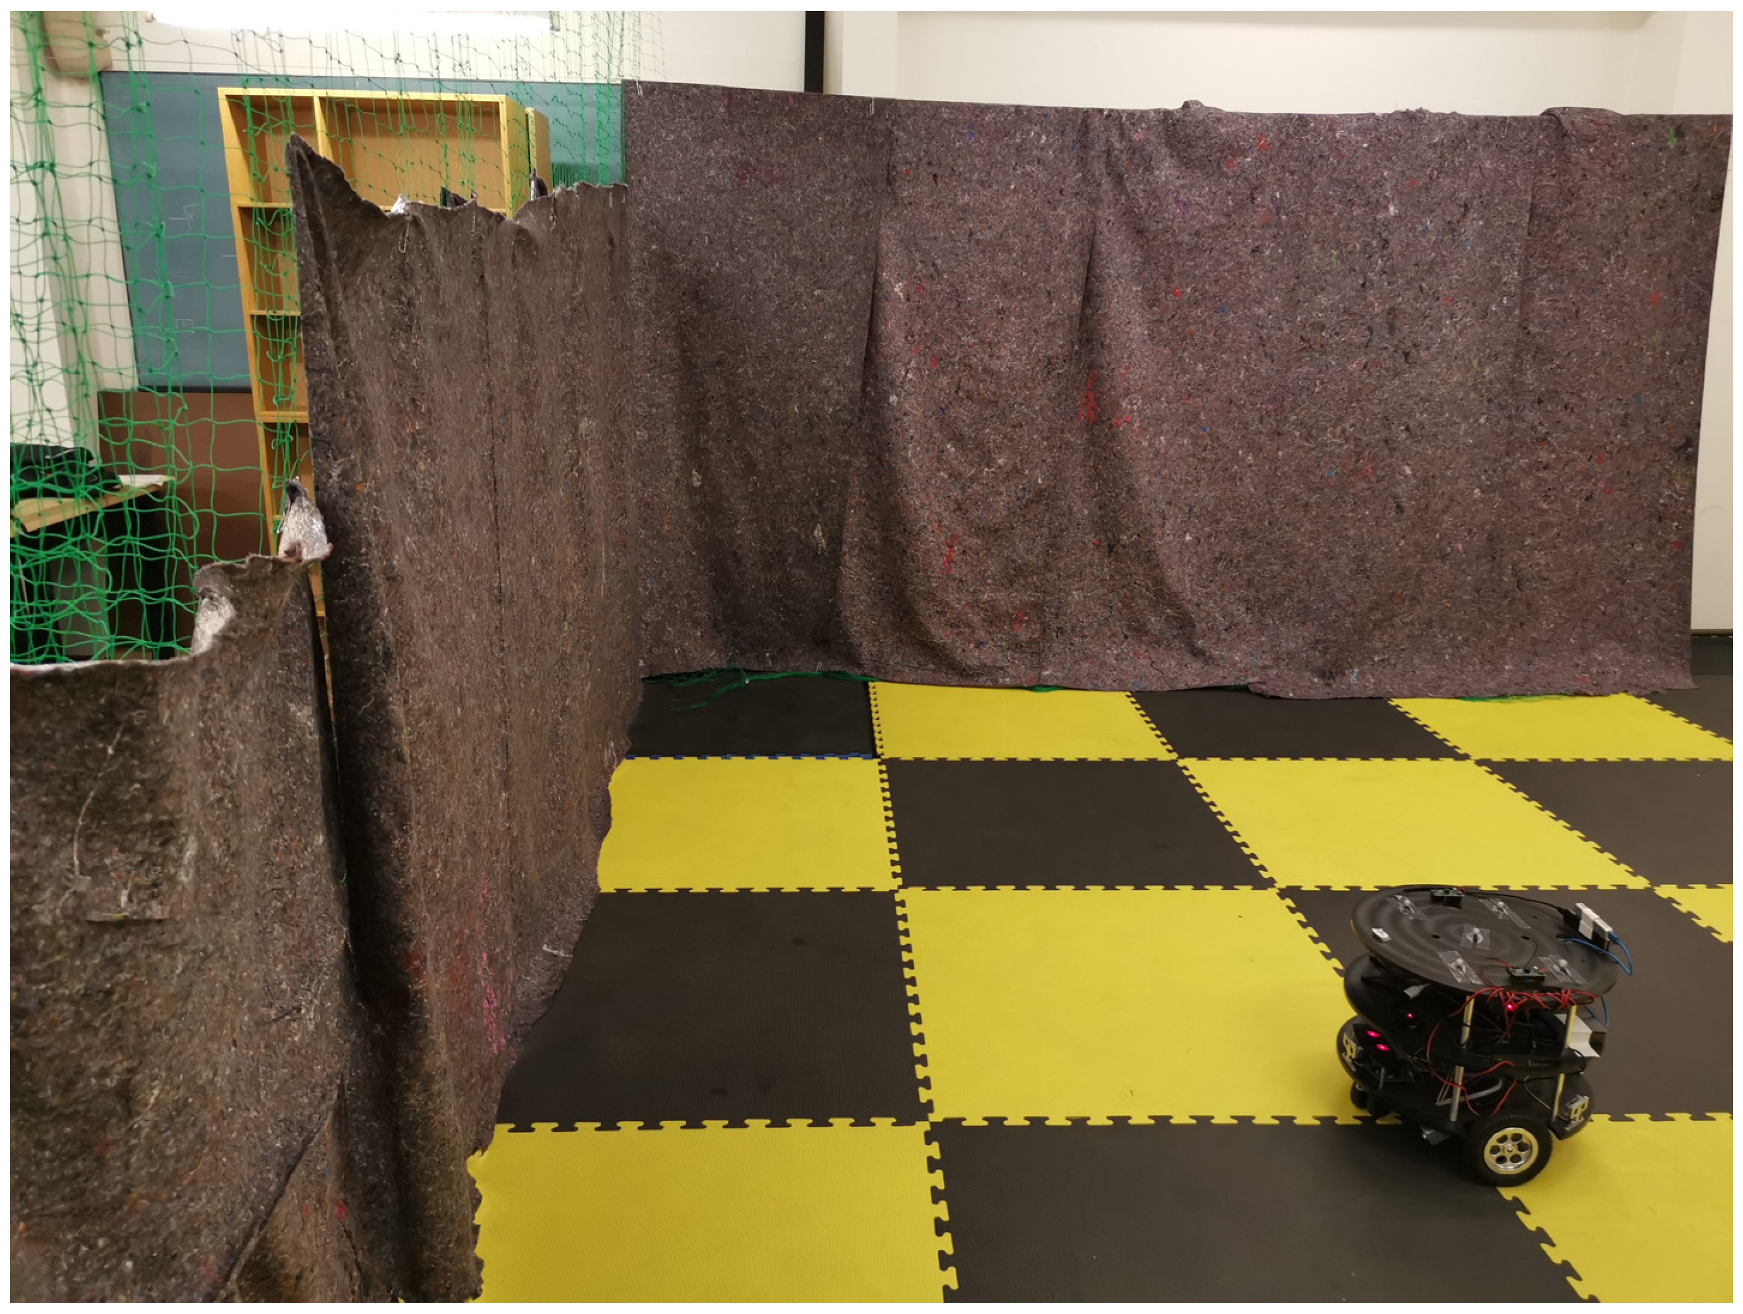
2.1. Test Environment
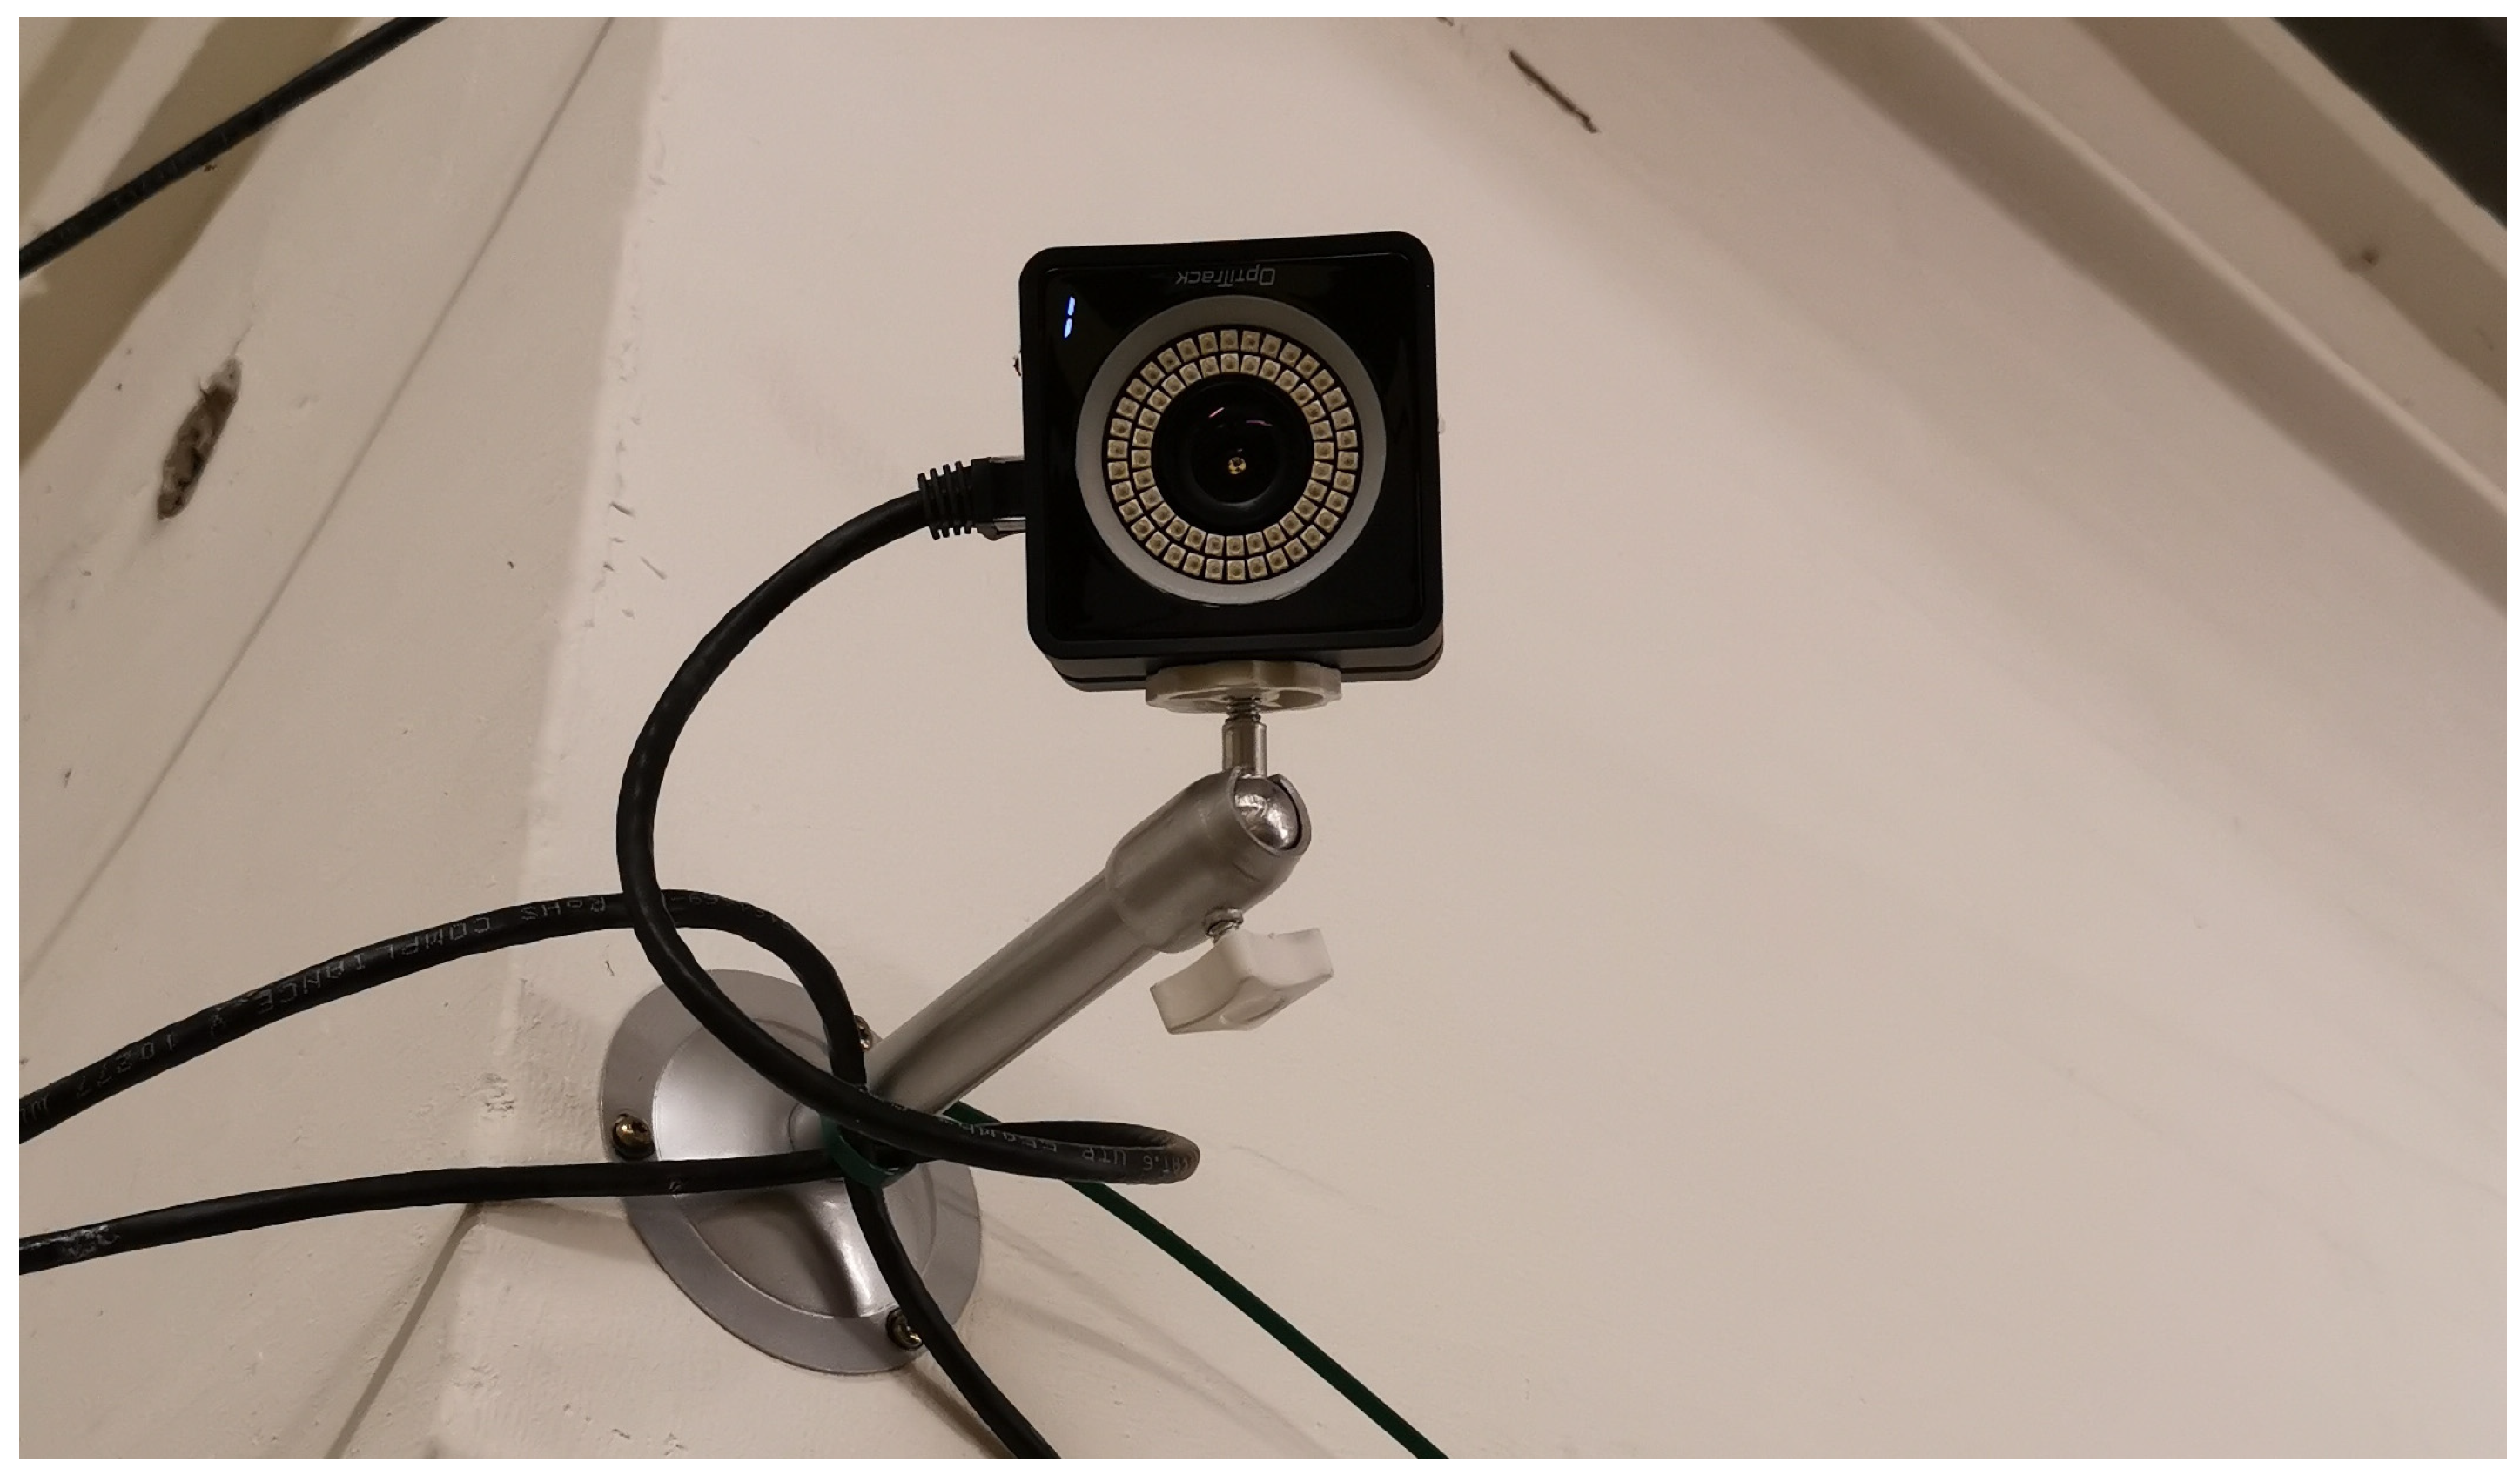
2.2. Ground Truth
2.3. Robot Setup
2.4. Software Setup
2.5. Intel RealSense Tracking Camera T265
2.6. ZED Mini
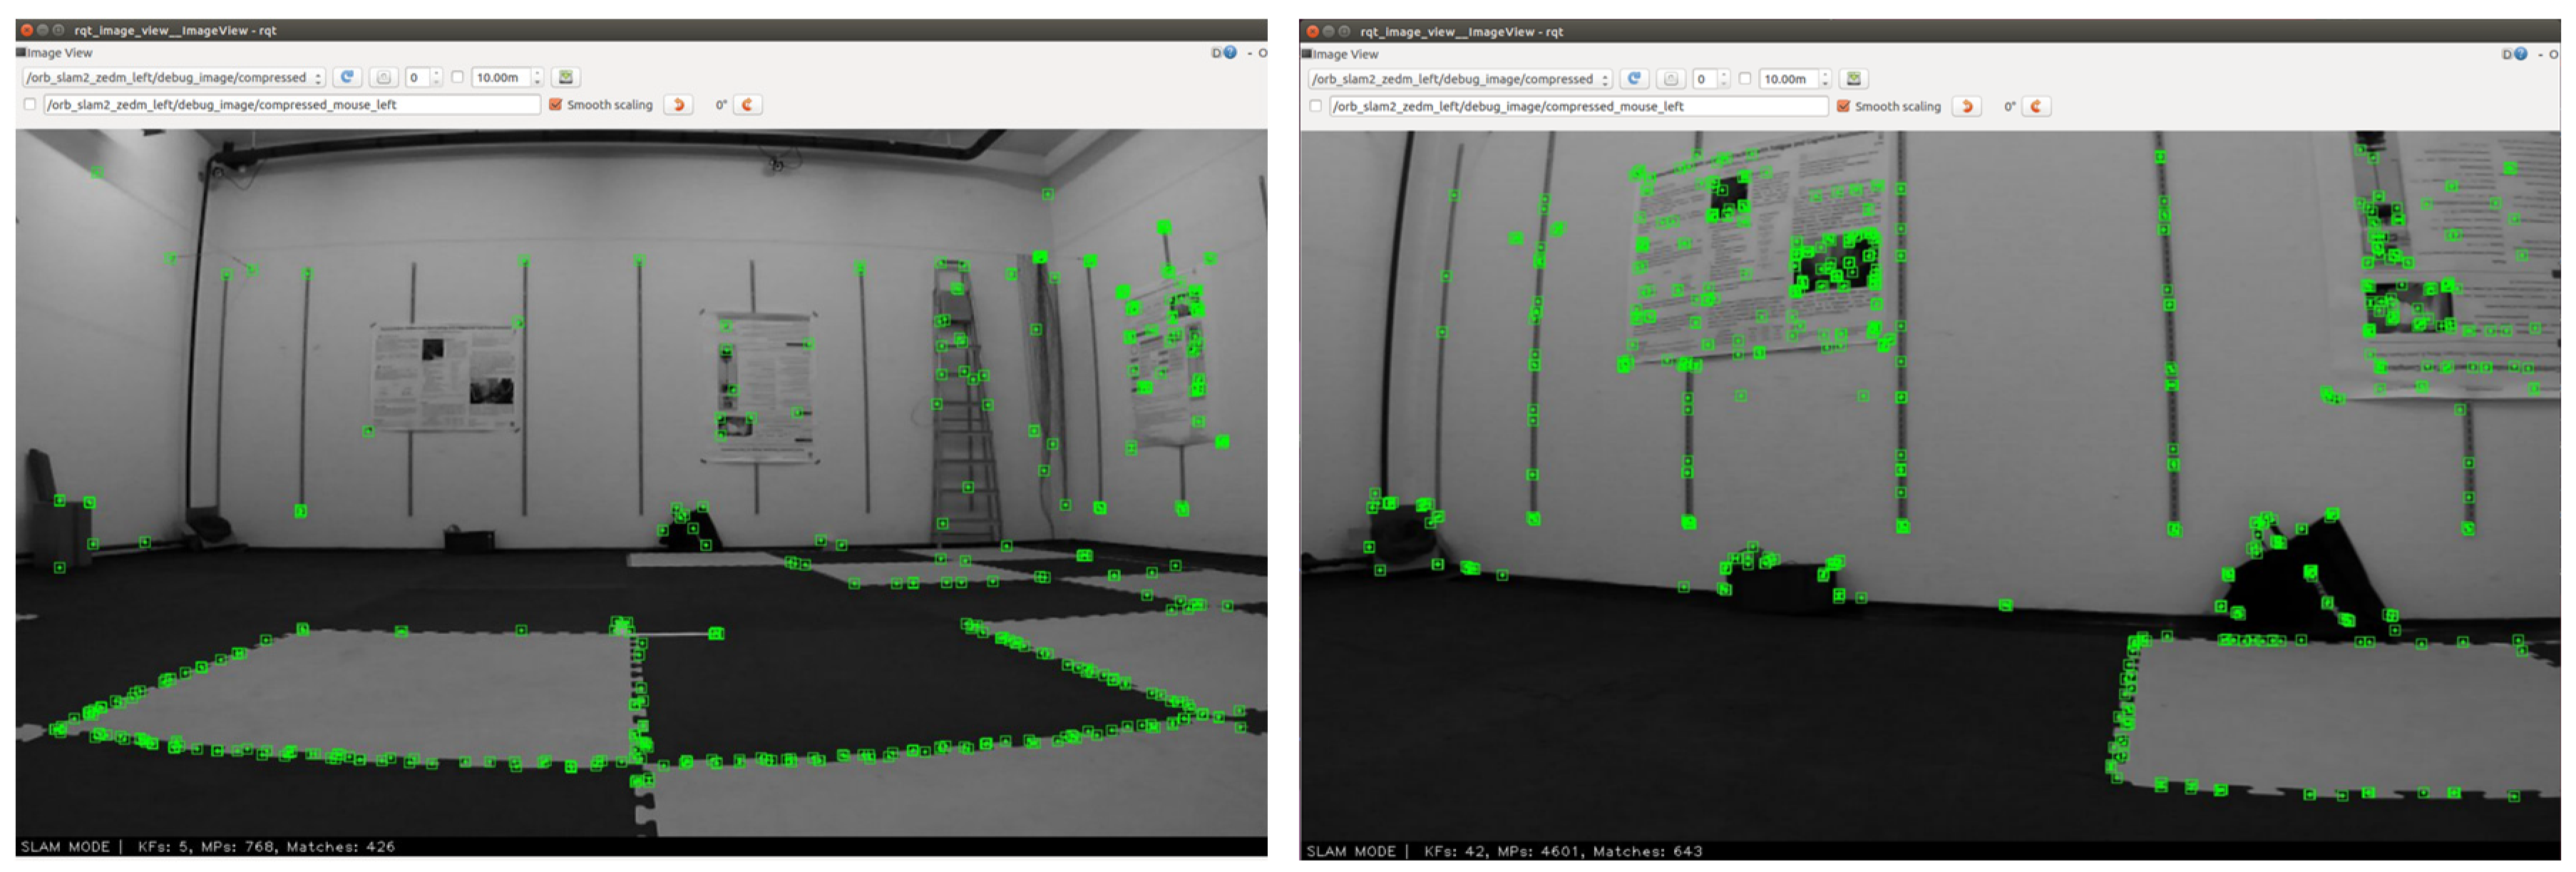
2.7. ORB-SLAM2
2.8. Scenarios
- Quantity of visual features: We changed the number of visual features in the field of view: either “many” with several paper posters on the walls to increase the number of visual clues, or “few” with mostly grey walls. The floor is unchanged between conditions.
- Robot speed: We made the robot drive at two different reference speeds: either “fast” with 1.07 m/s linear speed for ~2.52 rad/s angular speed (when the robot turns), or “slow” with 0.36 m/s linear (i.e., ~3 times slower) speed for ~0.35 rad/s angular speed (i.e., ~7 times slower).
- Moving visual elements: We made the visual environment more, or less stable: either “static” with nothing moving, or “dynamic” with some persons constantly walking along the walls around the room.
3. Data Analysis
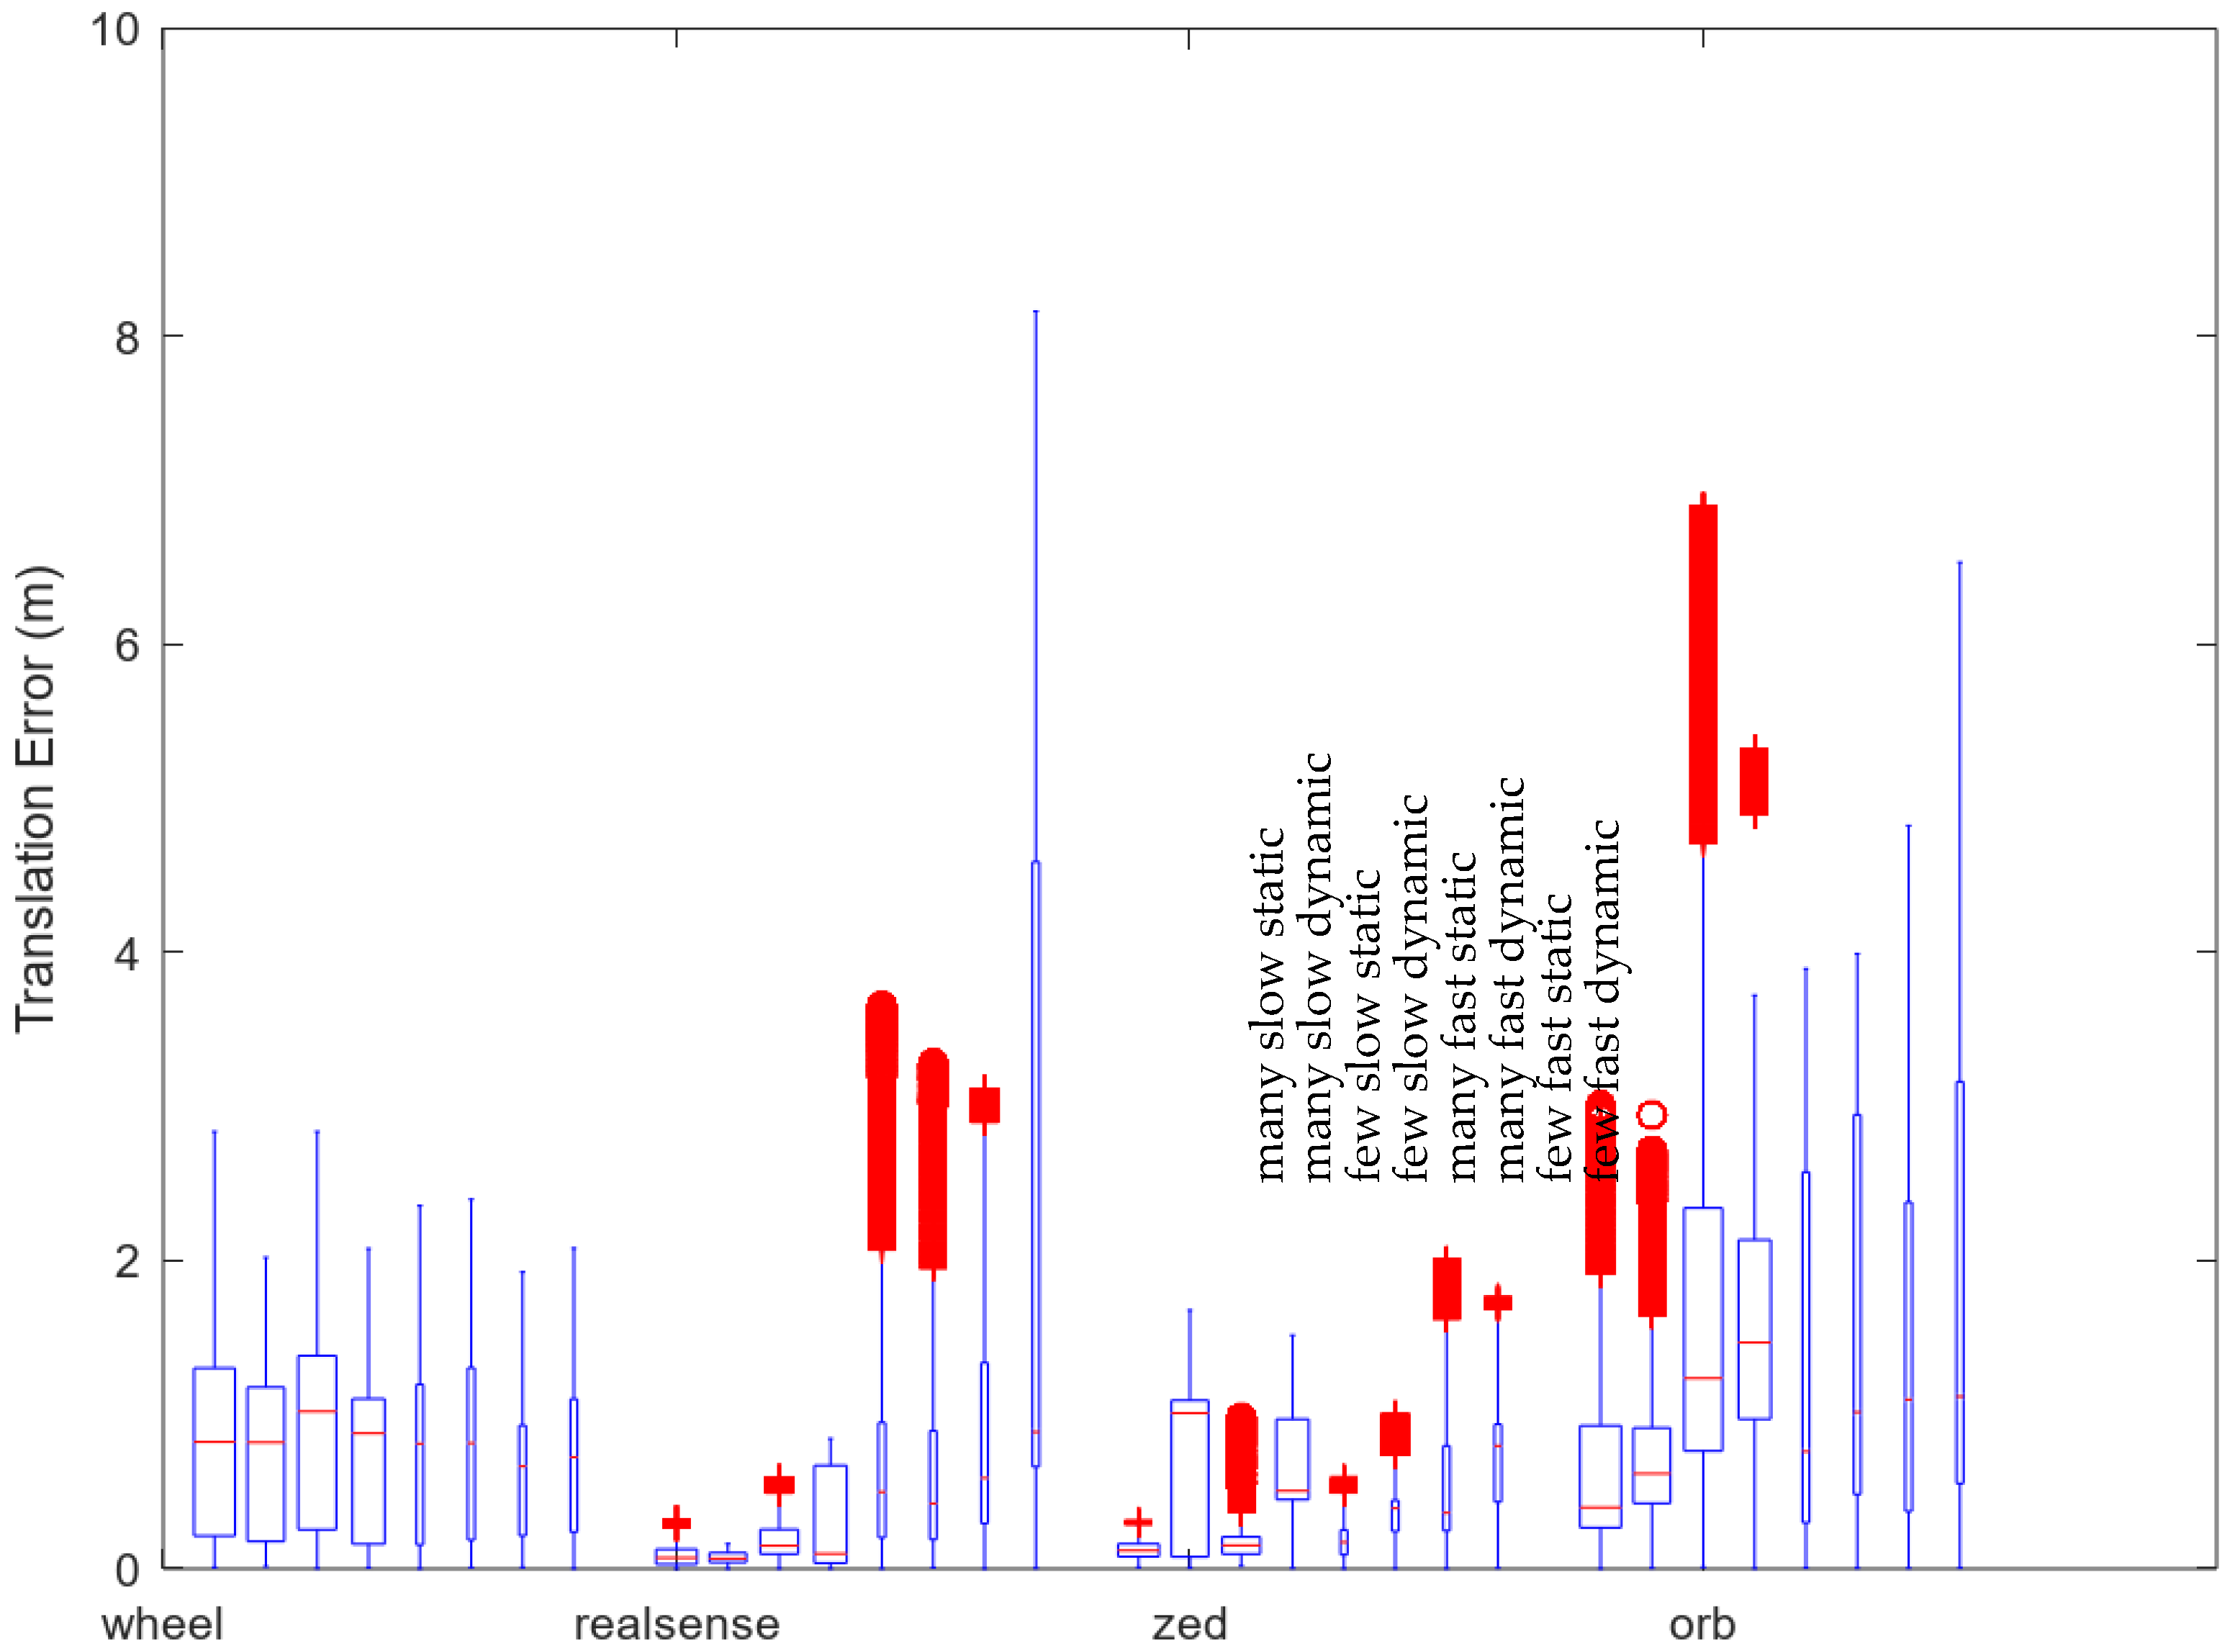
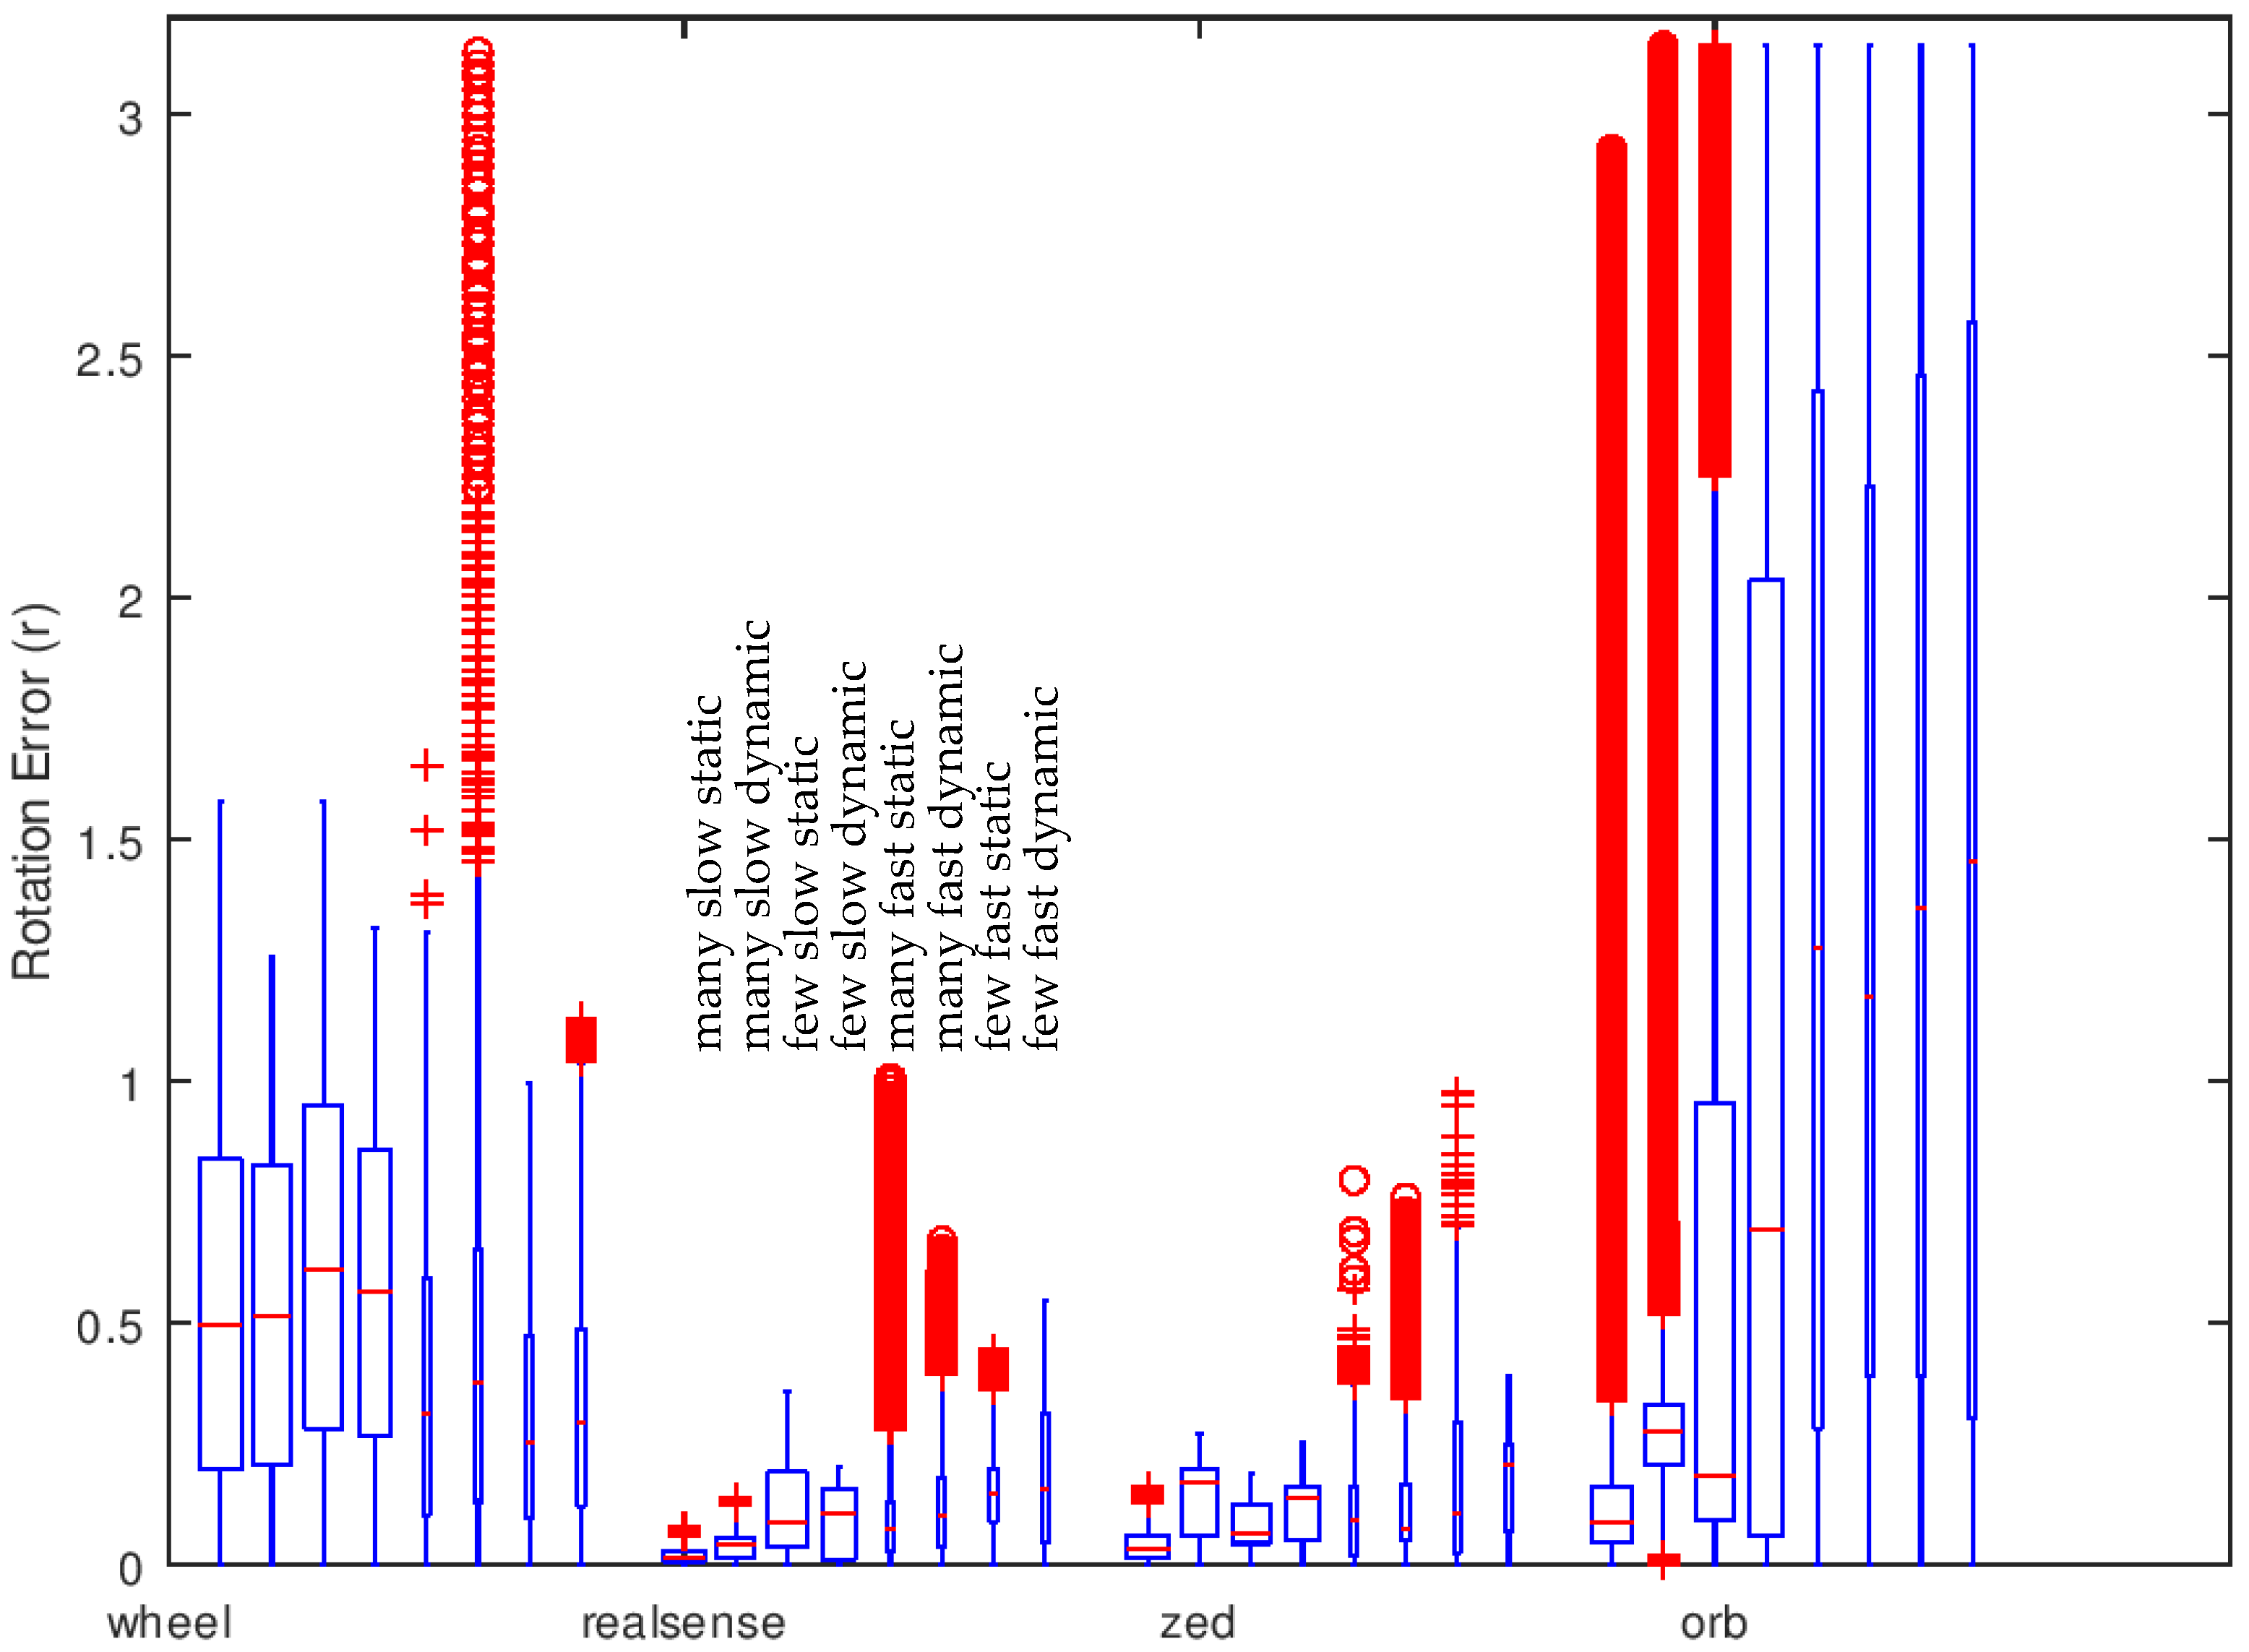
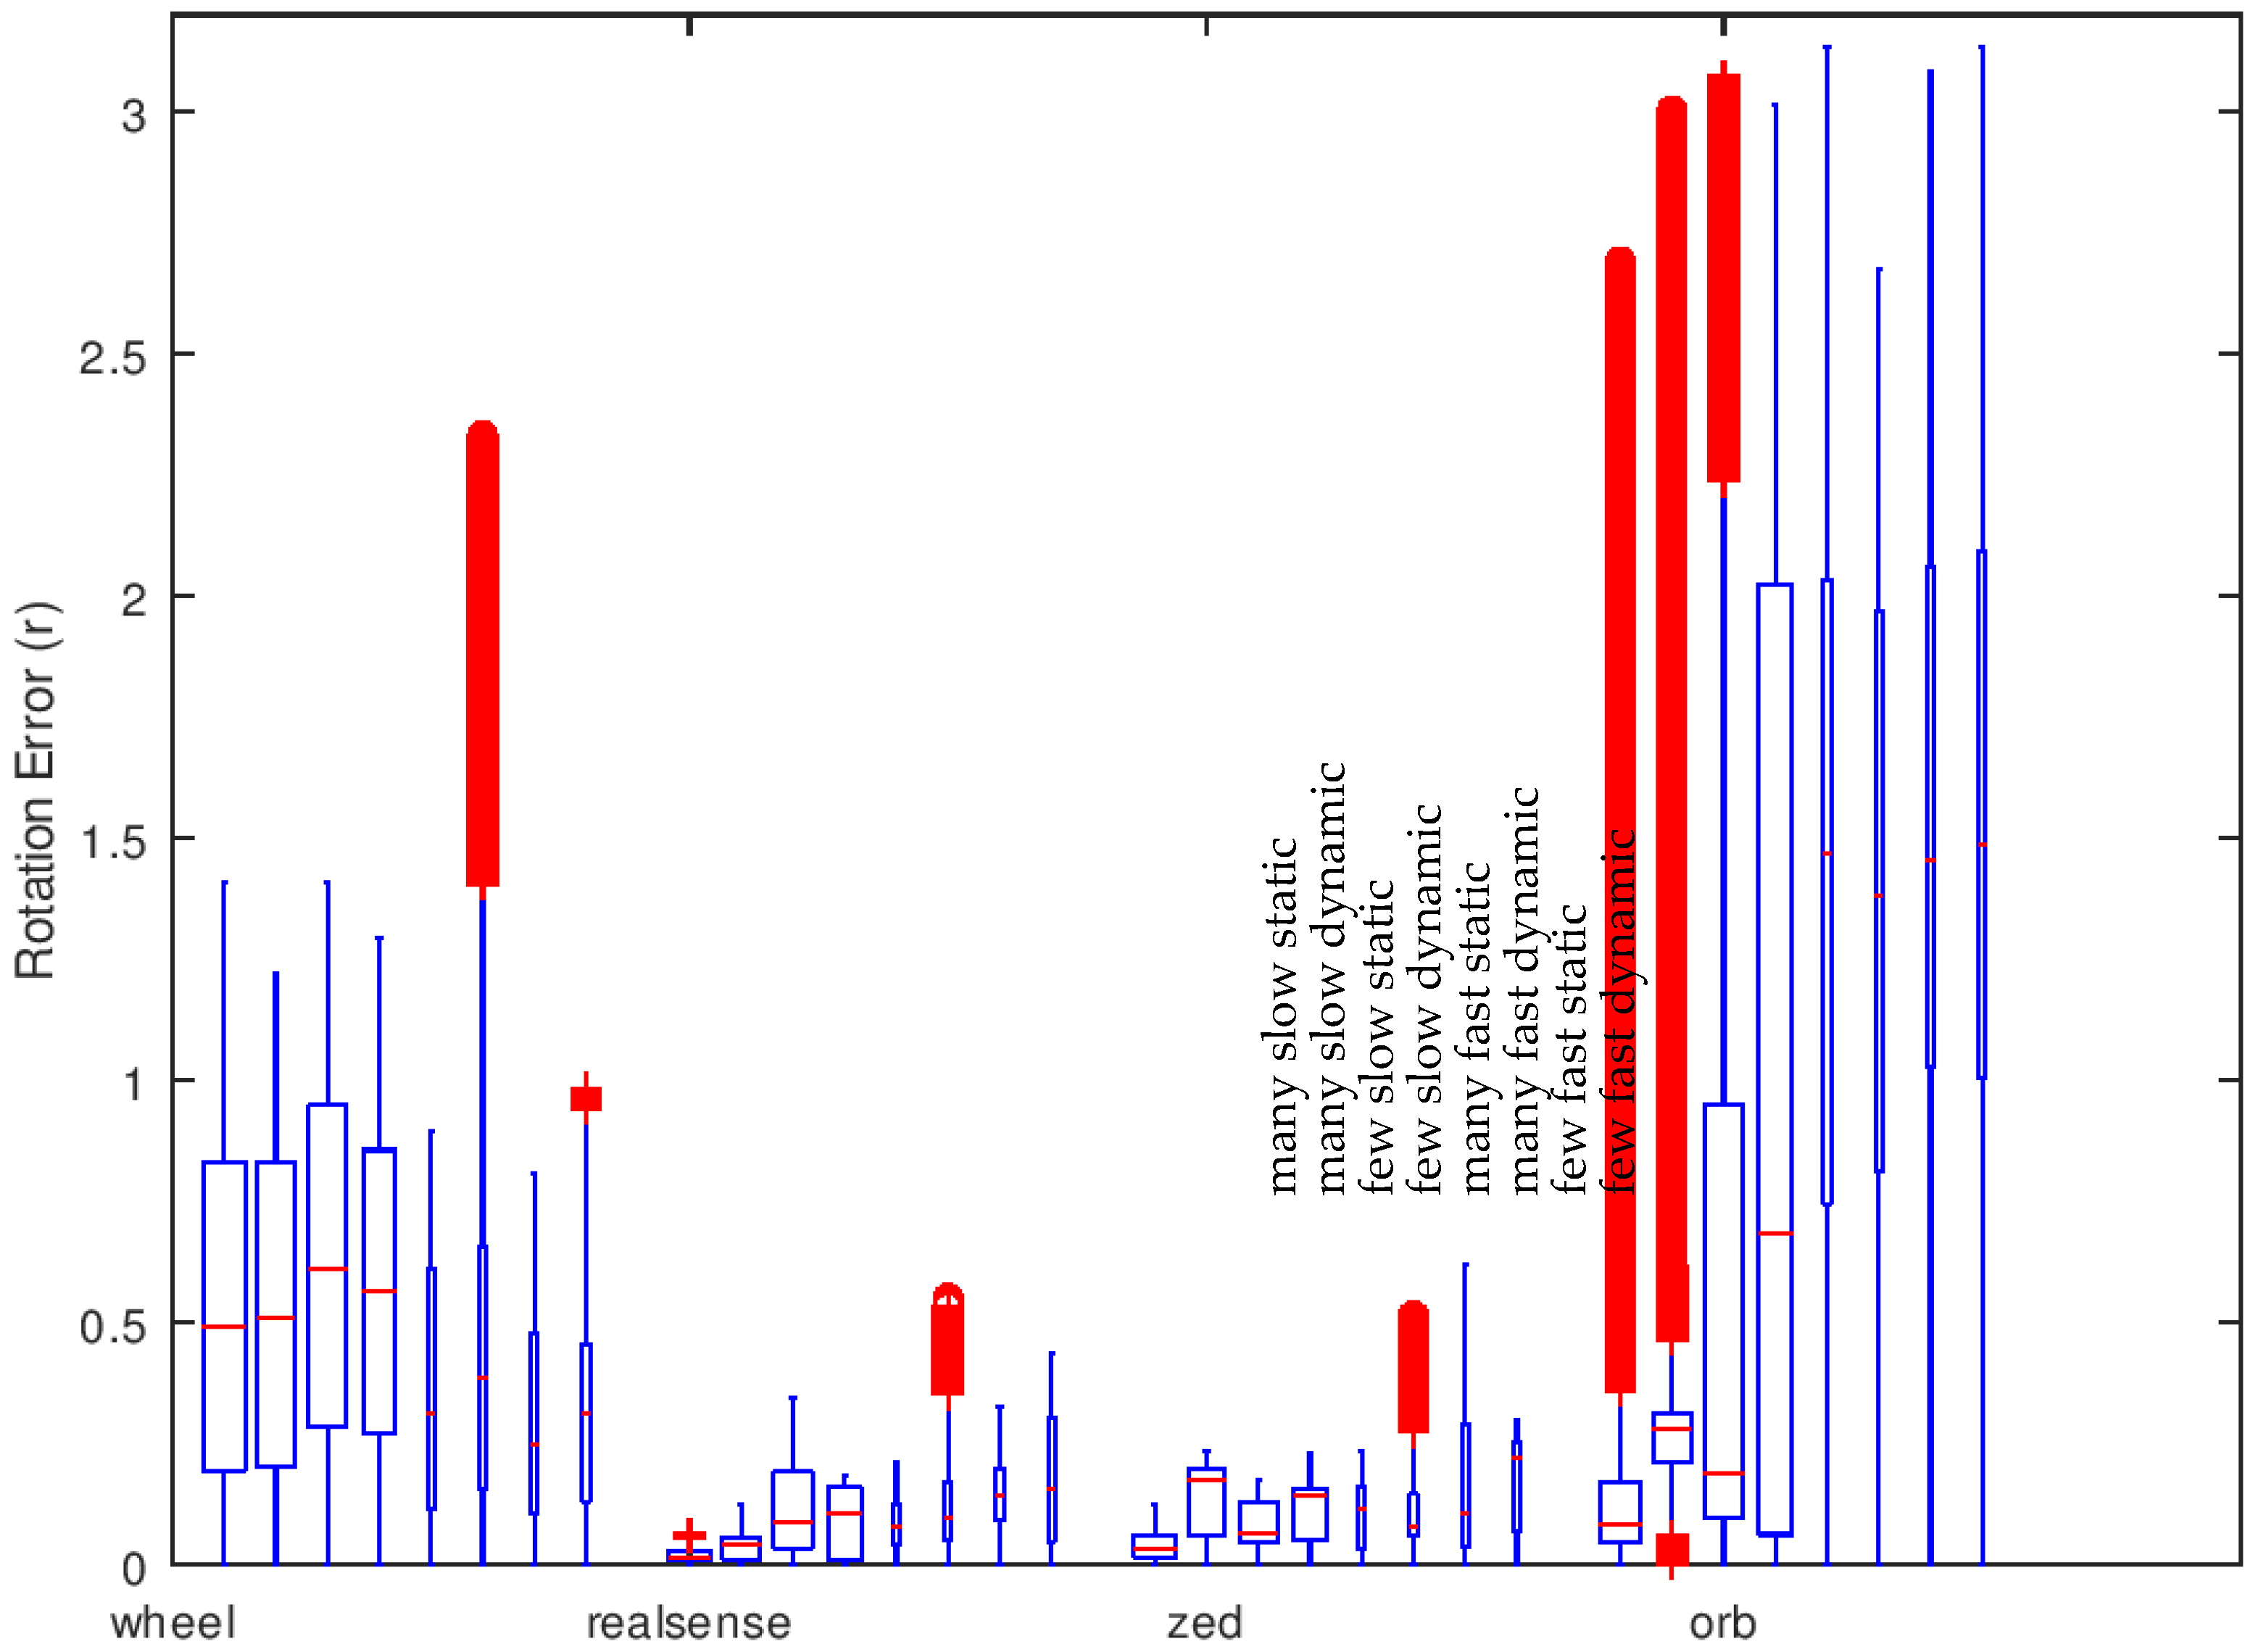
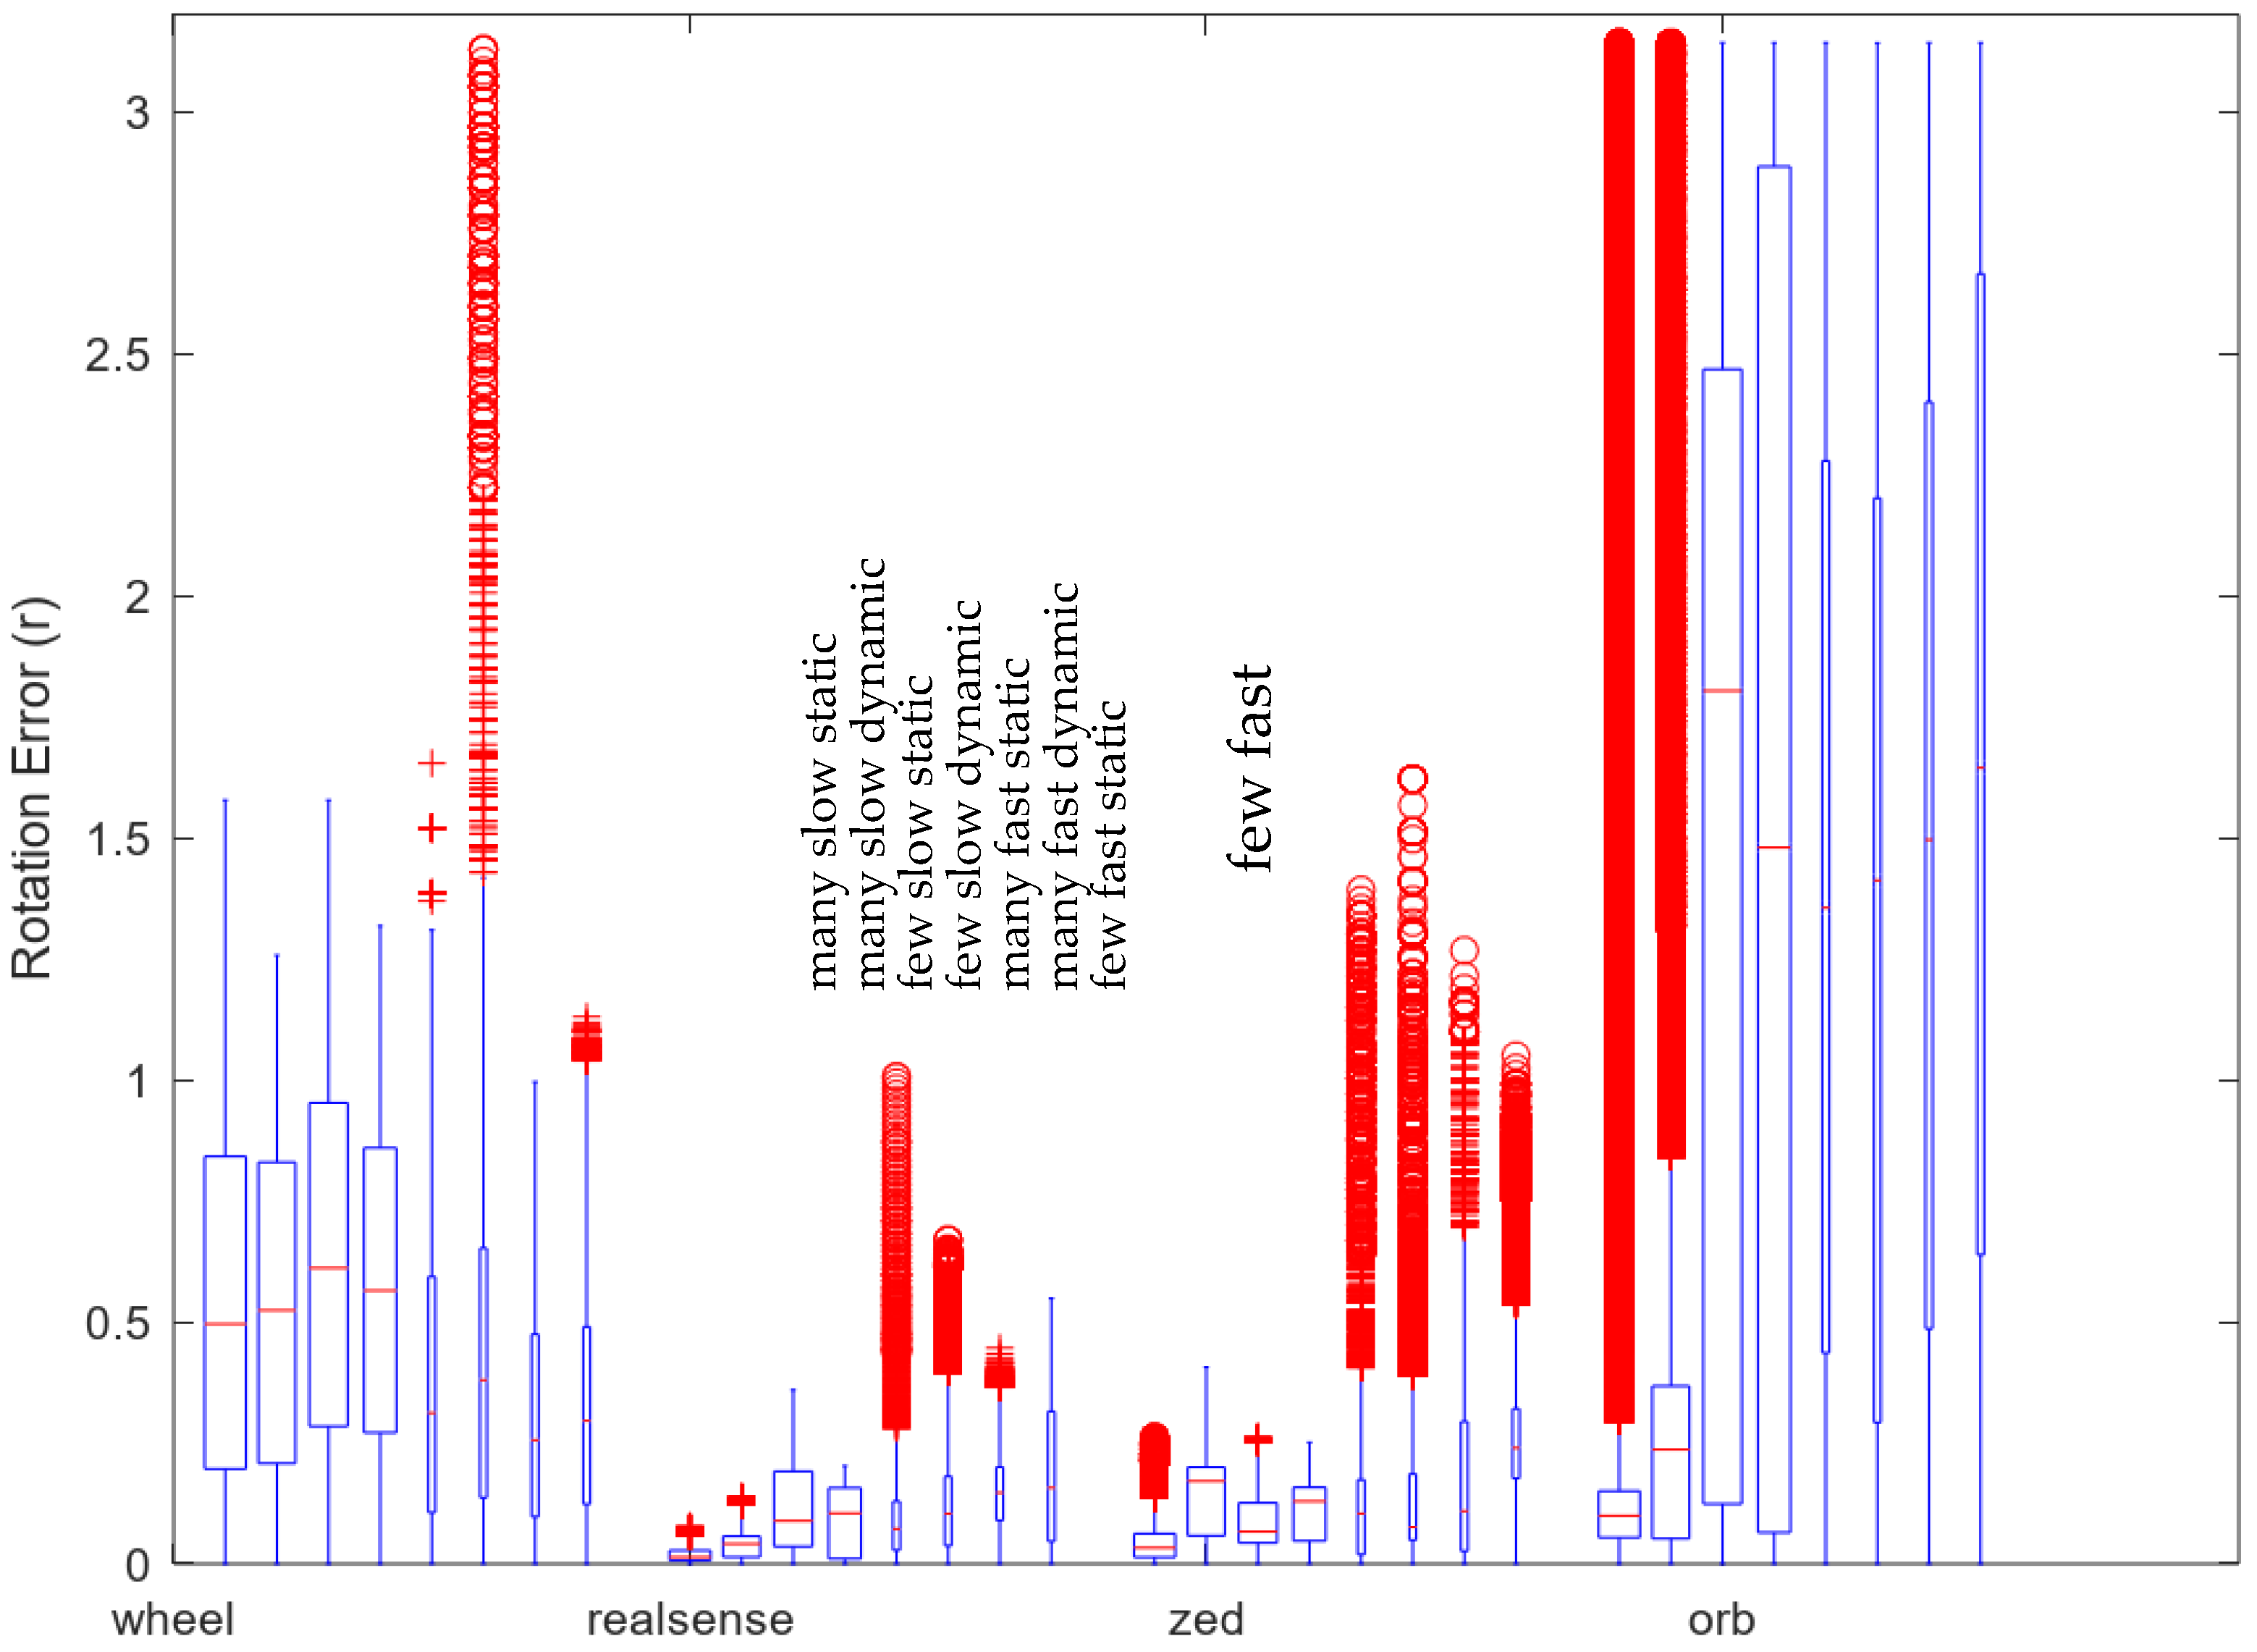
4. Results
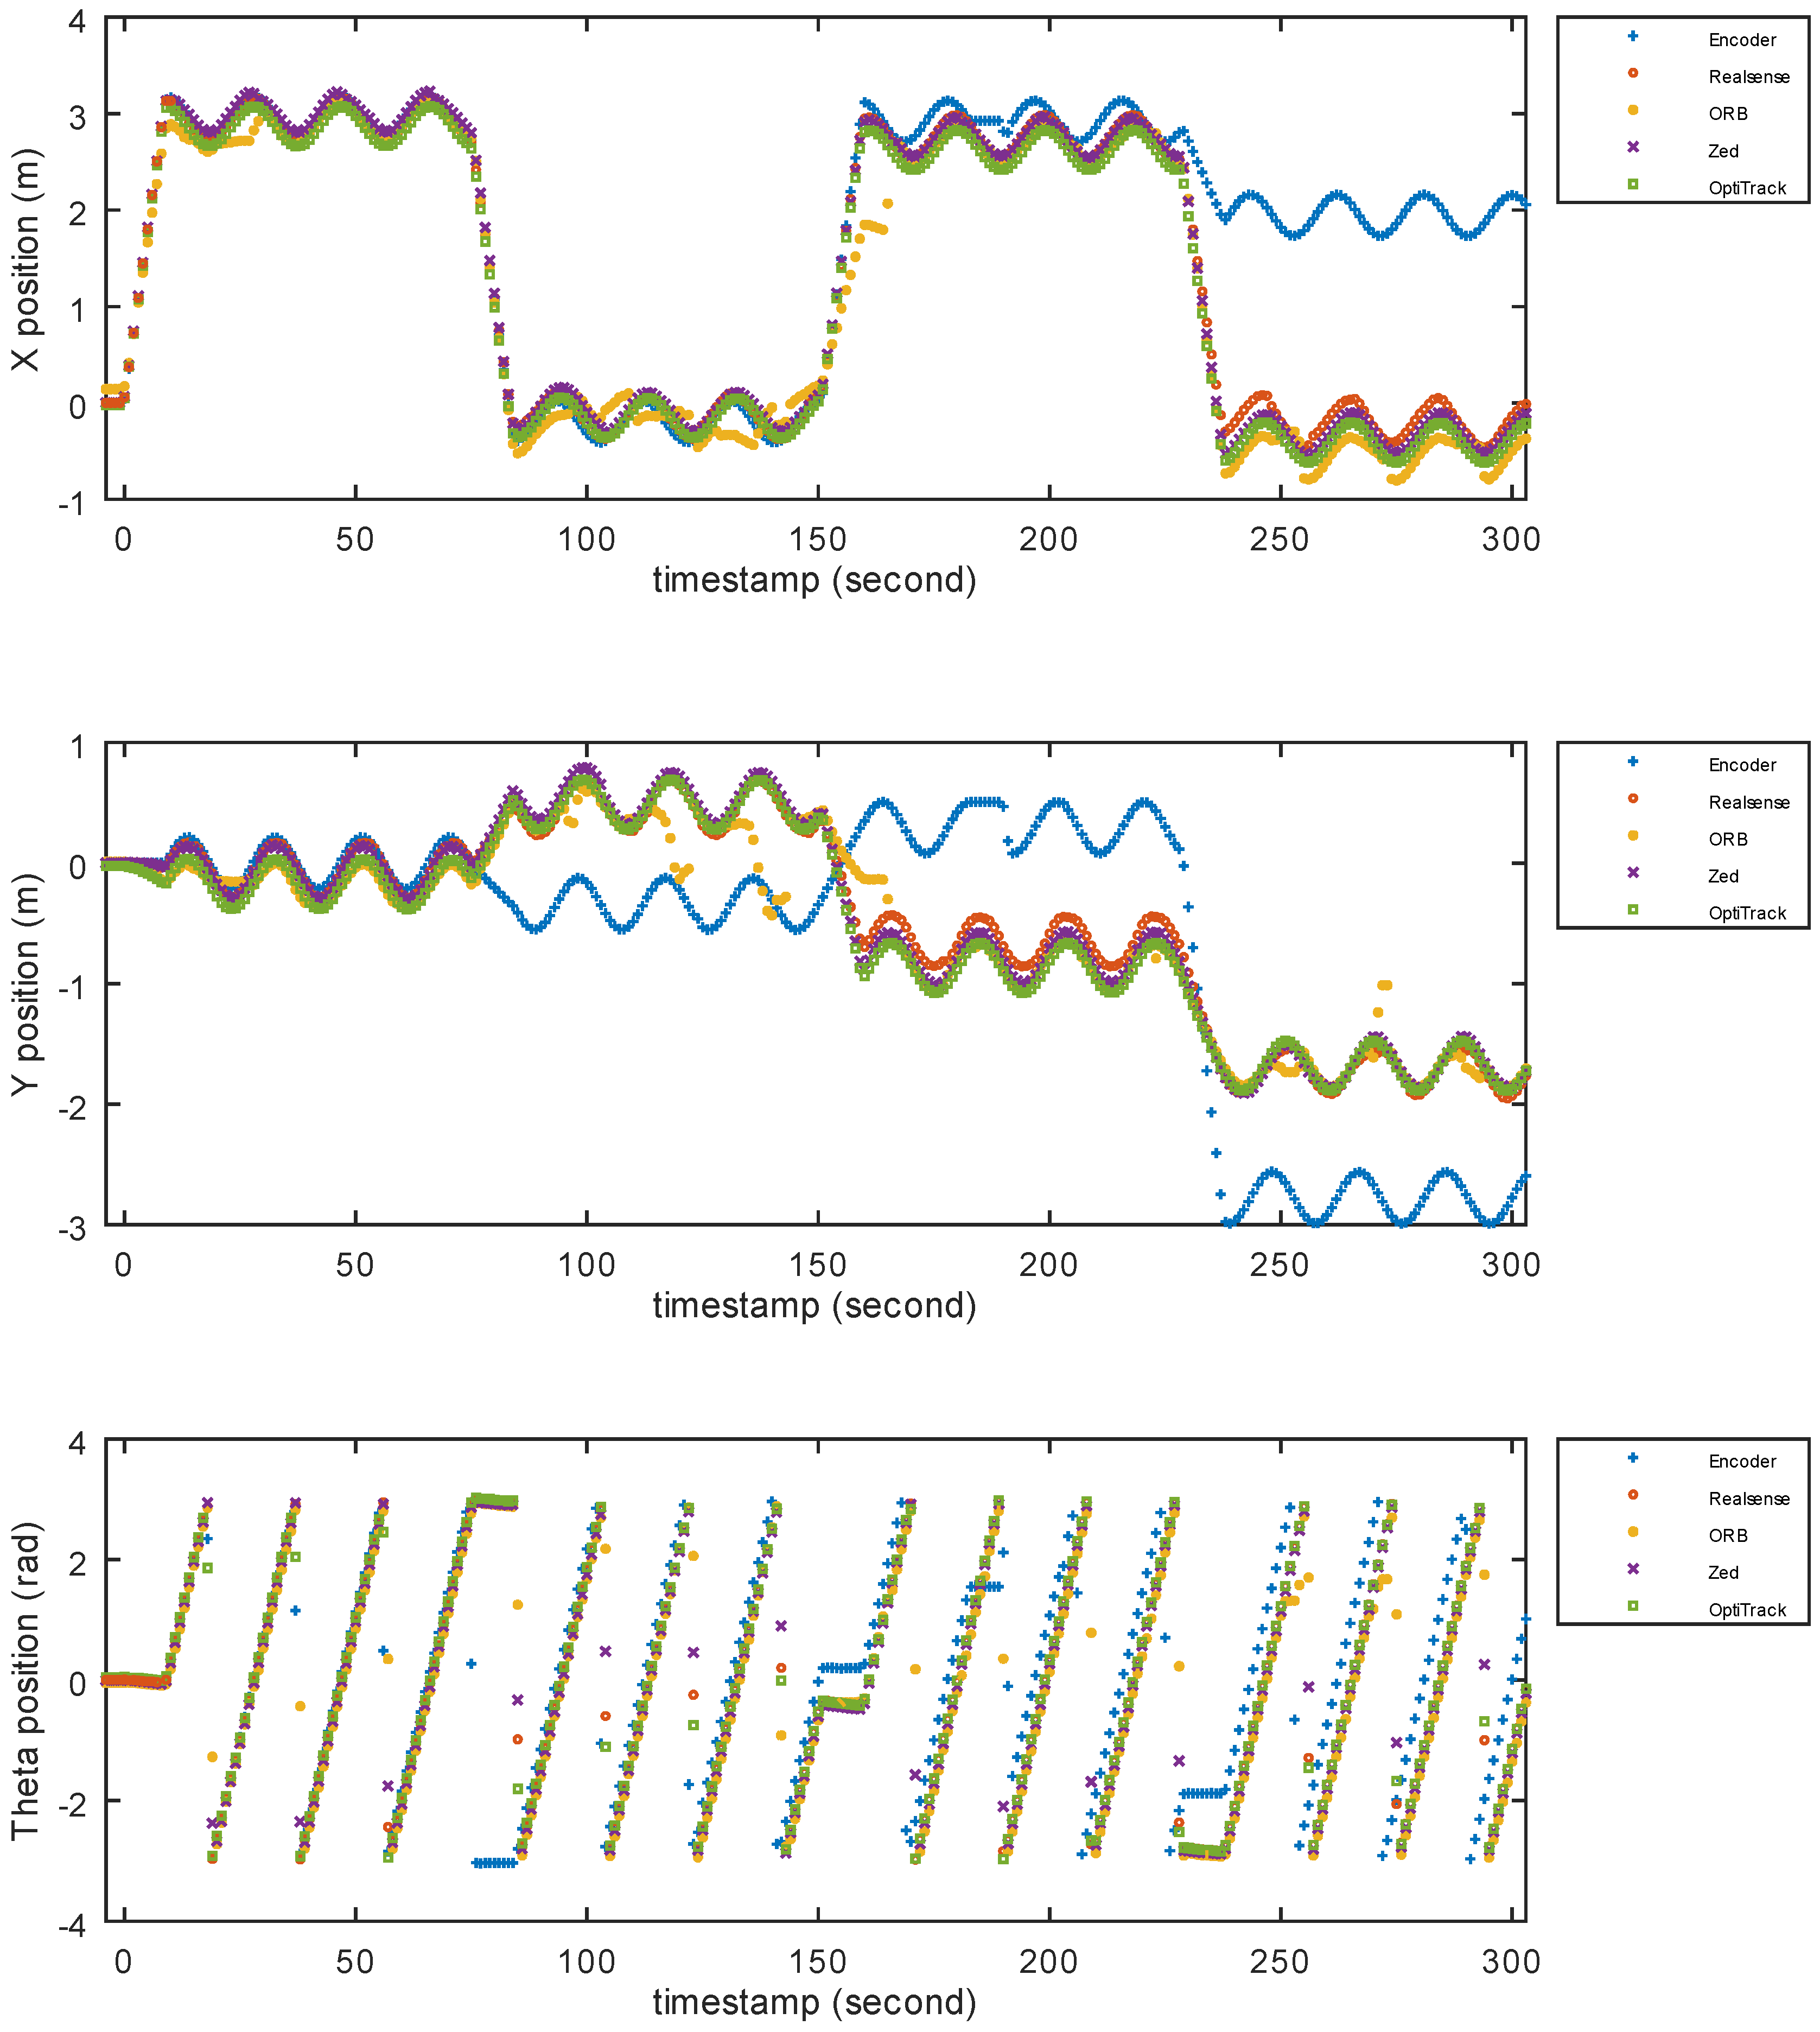
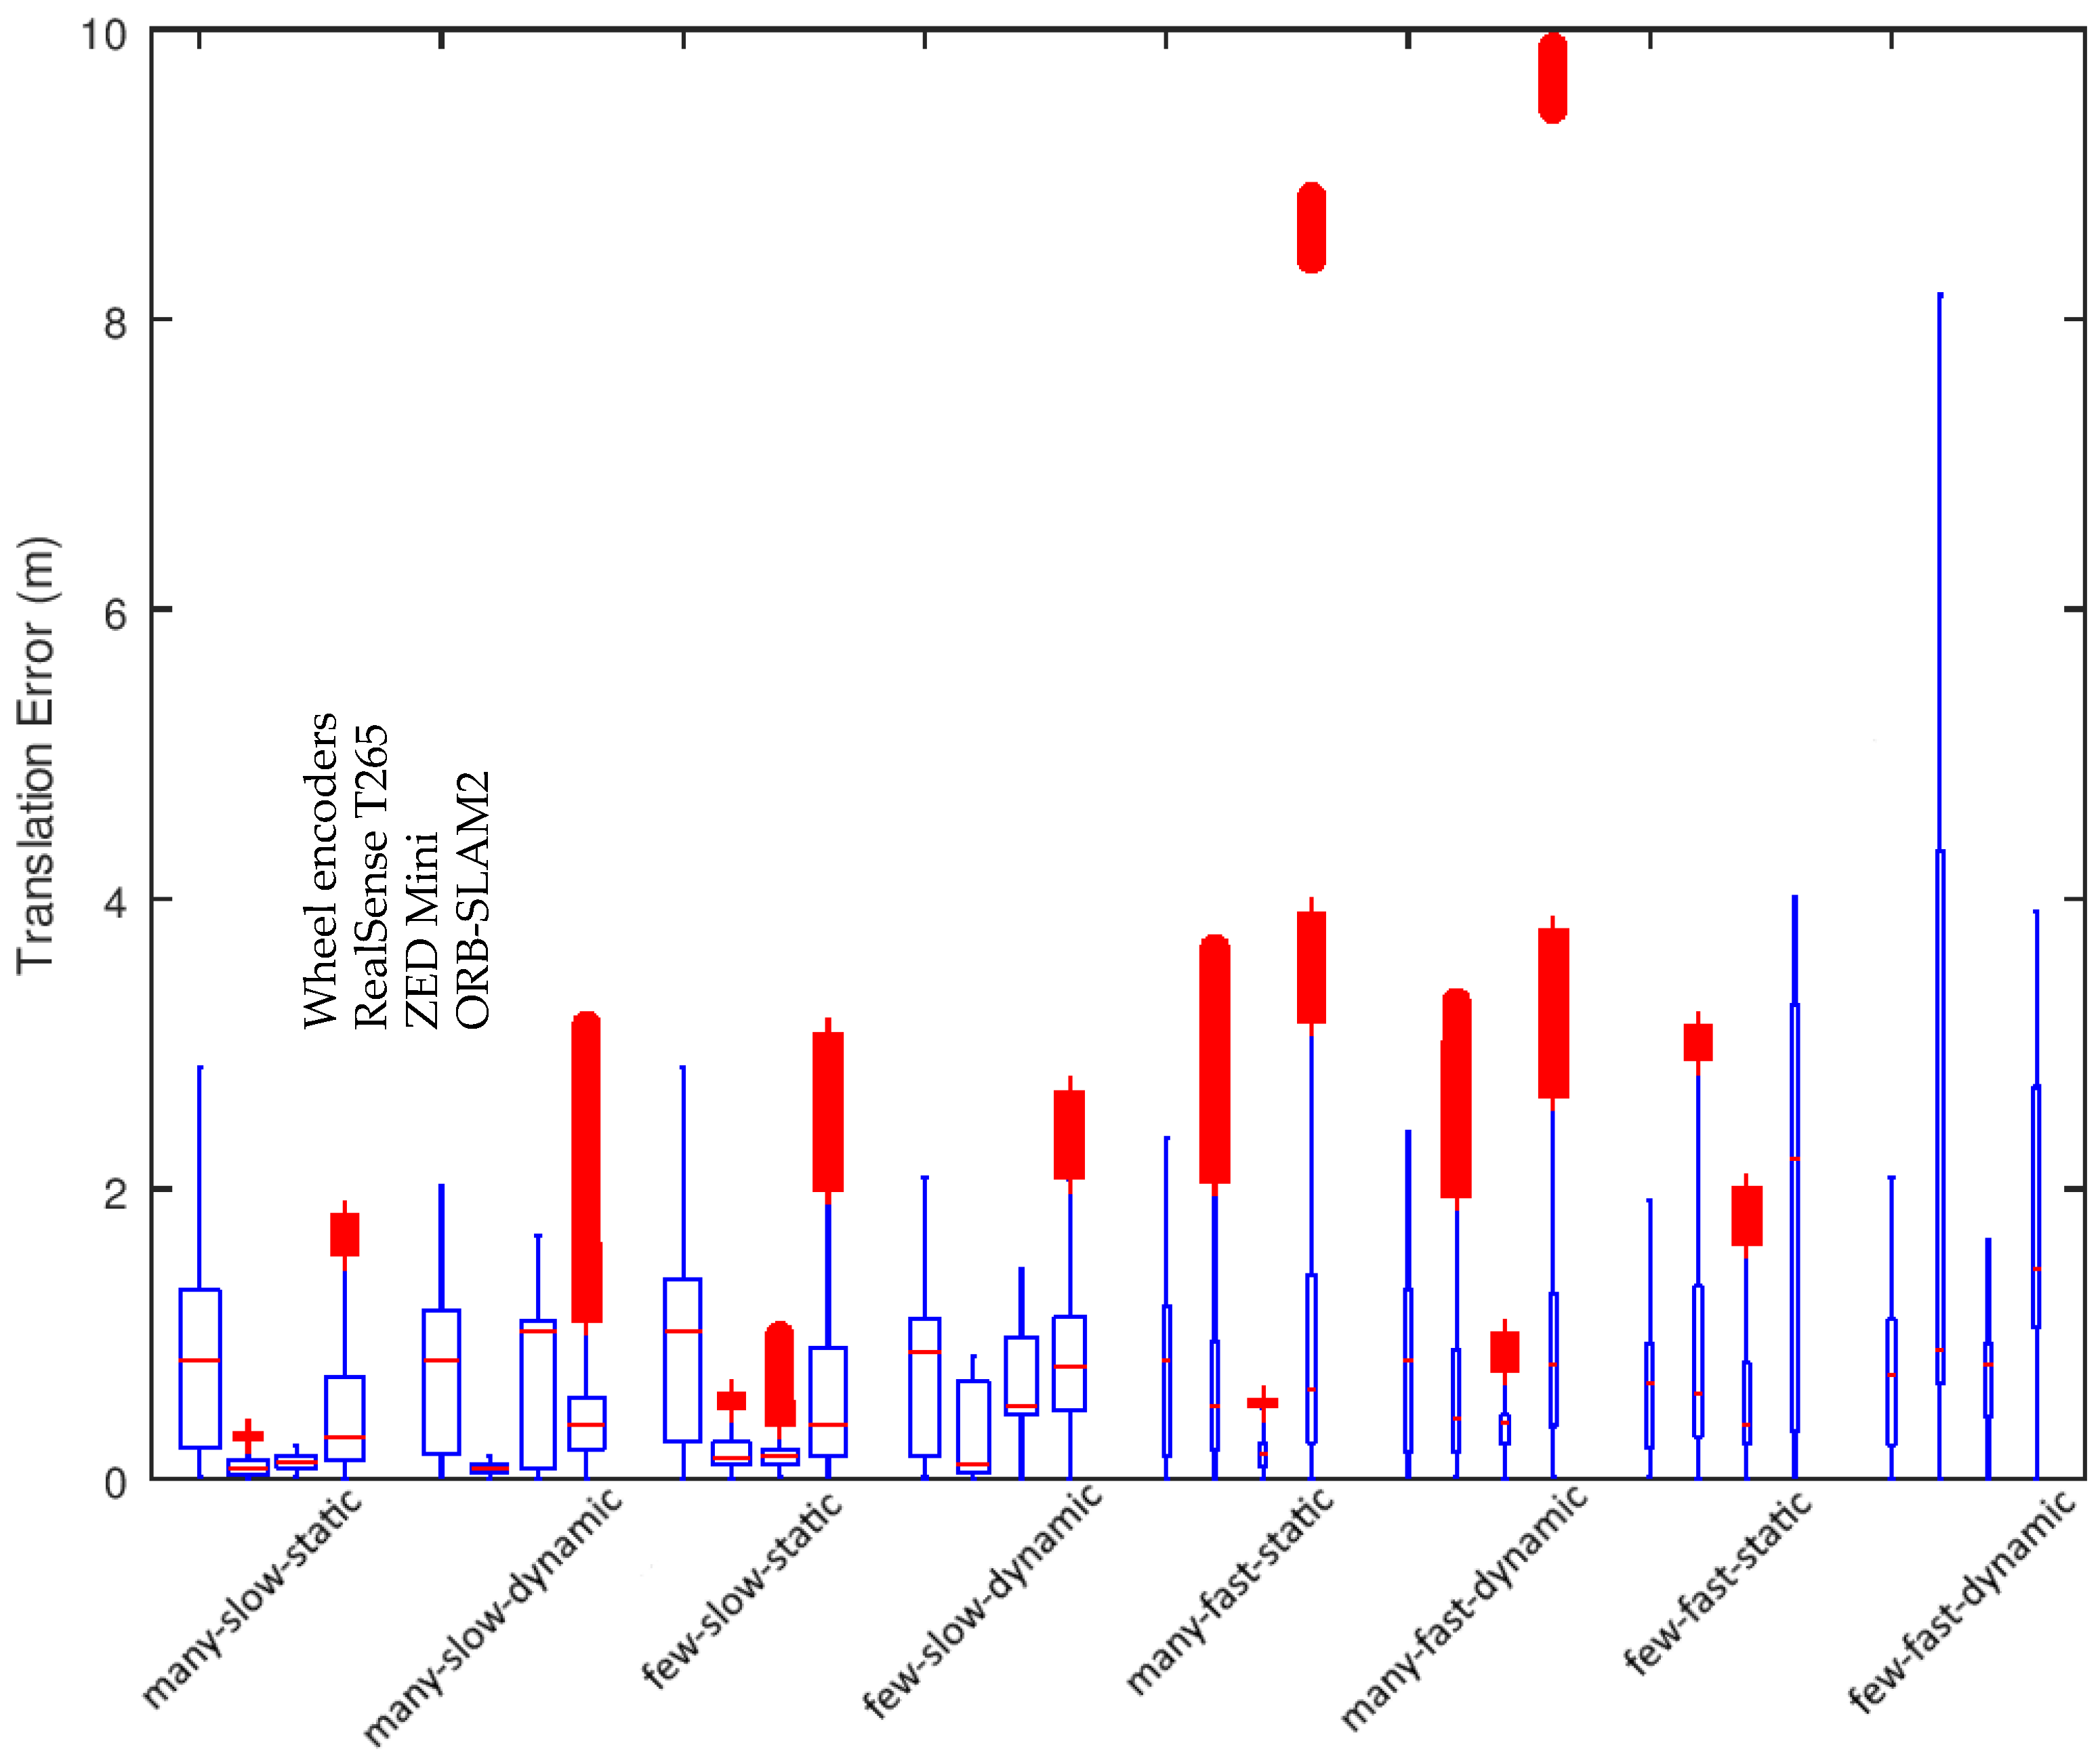
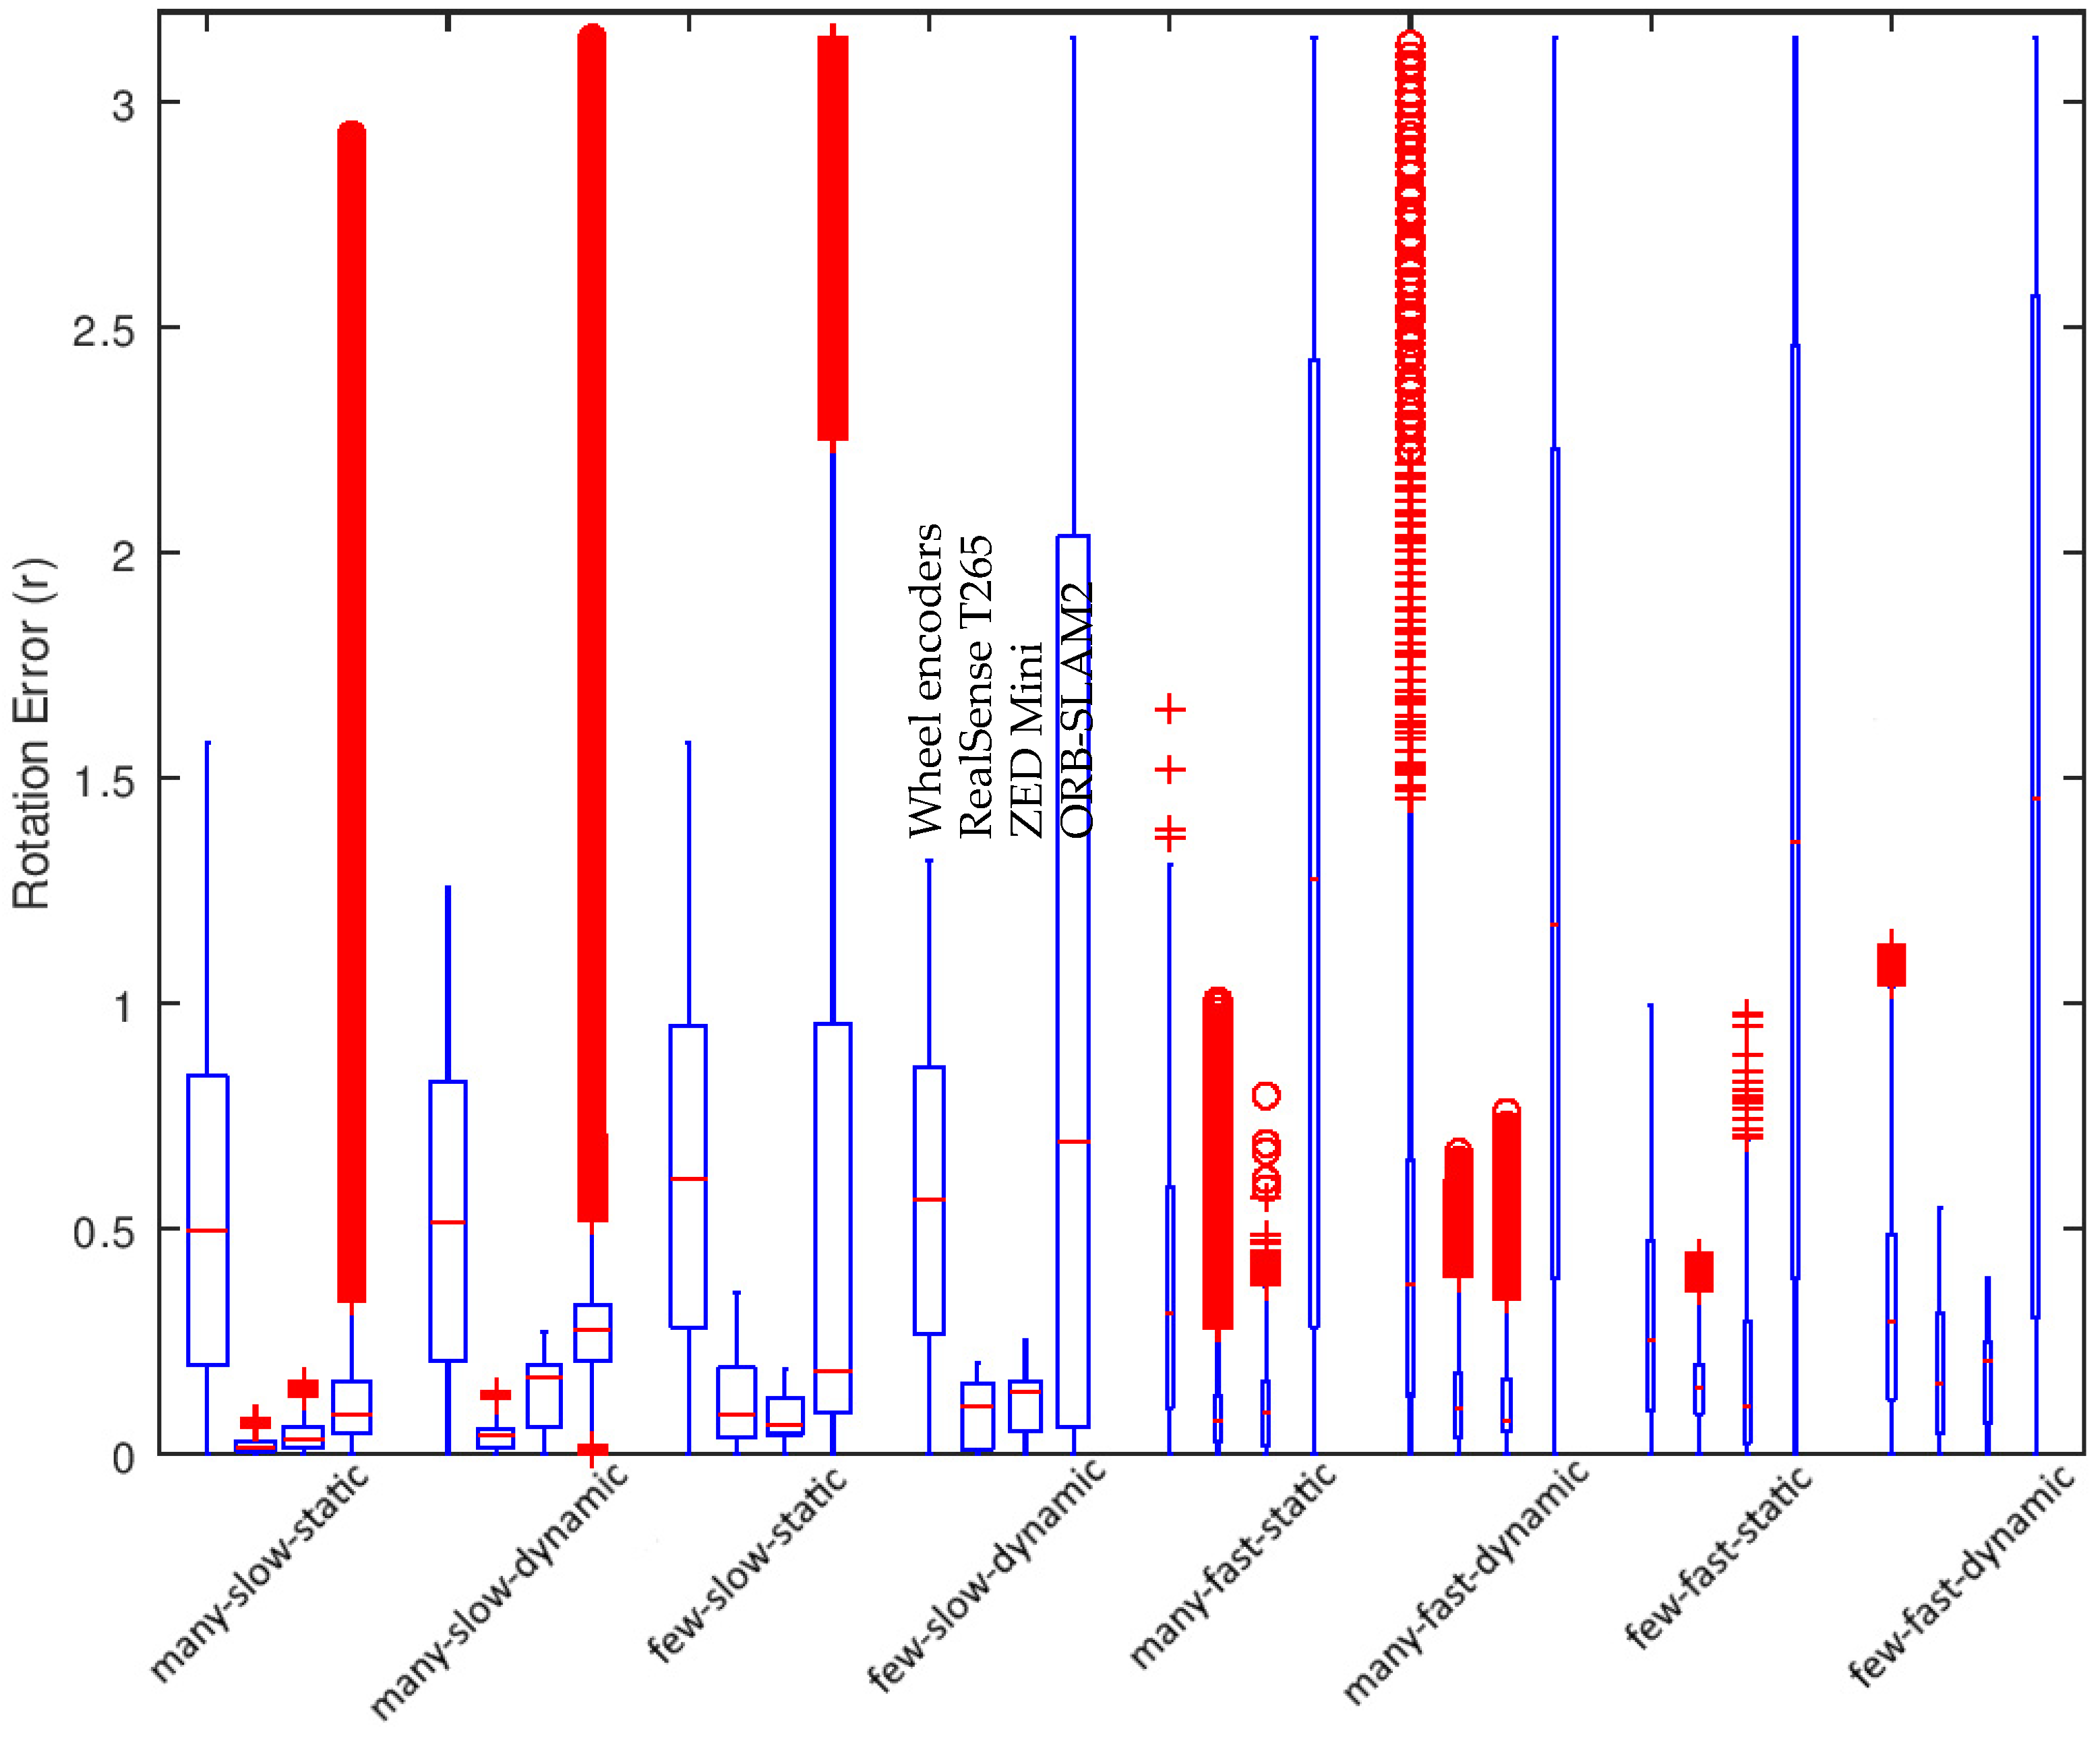
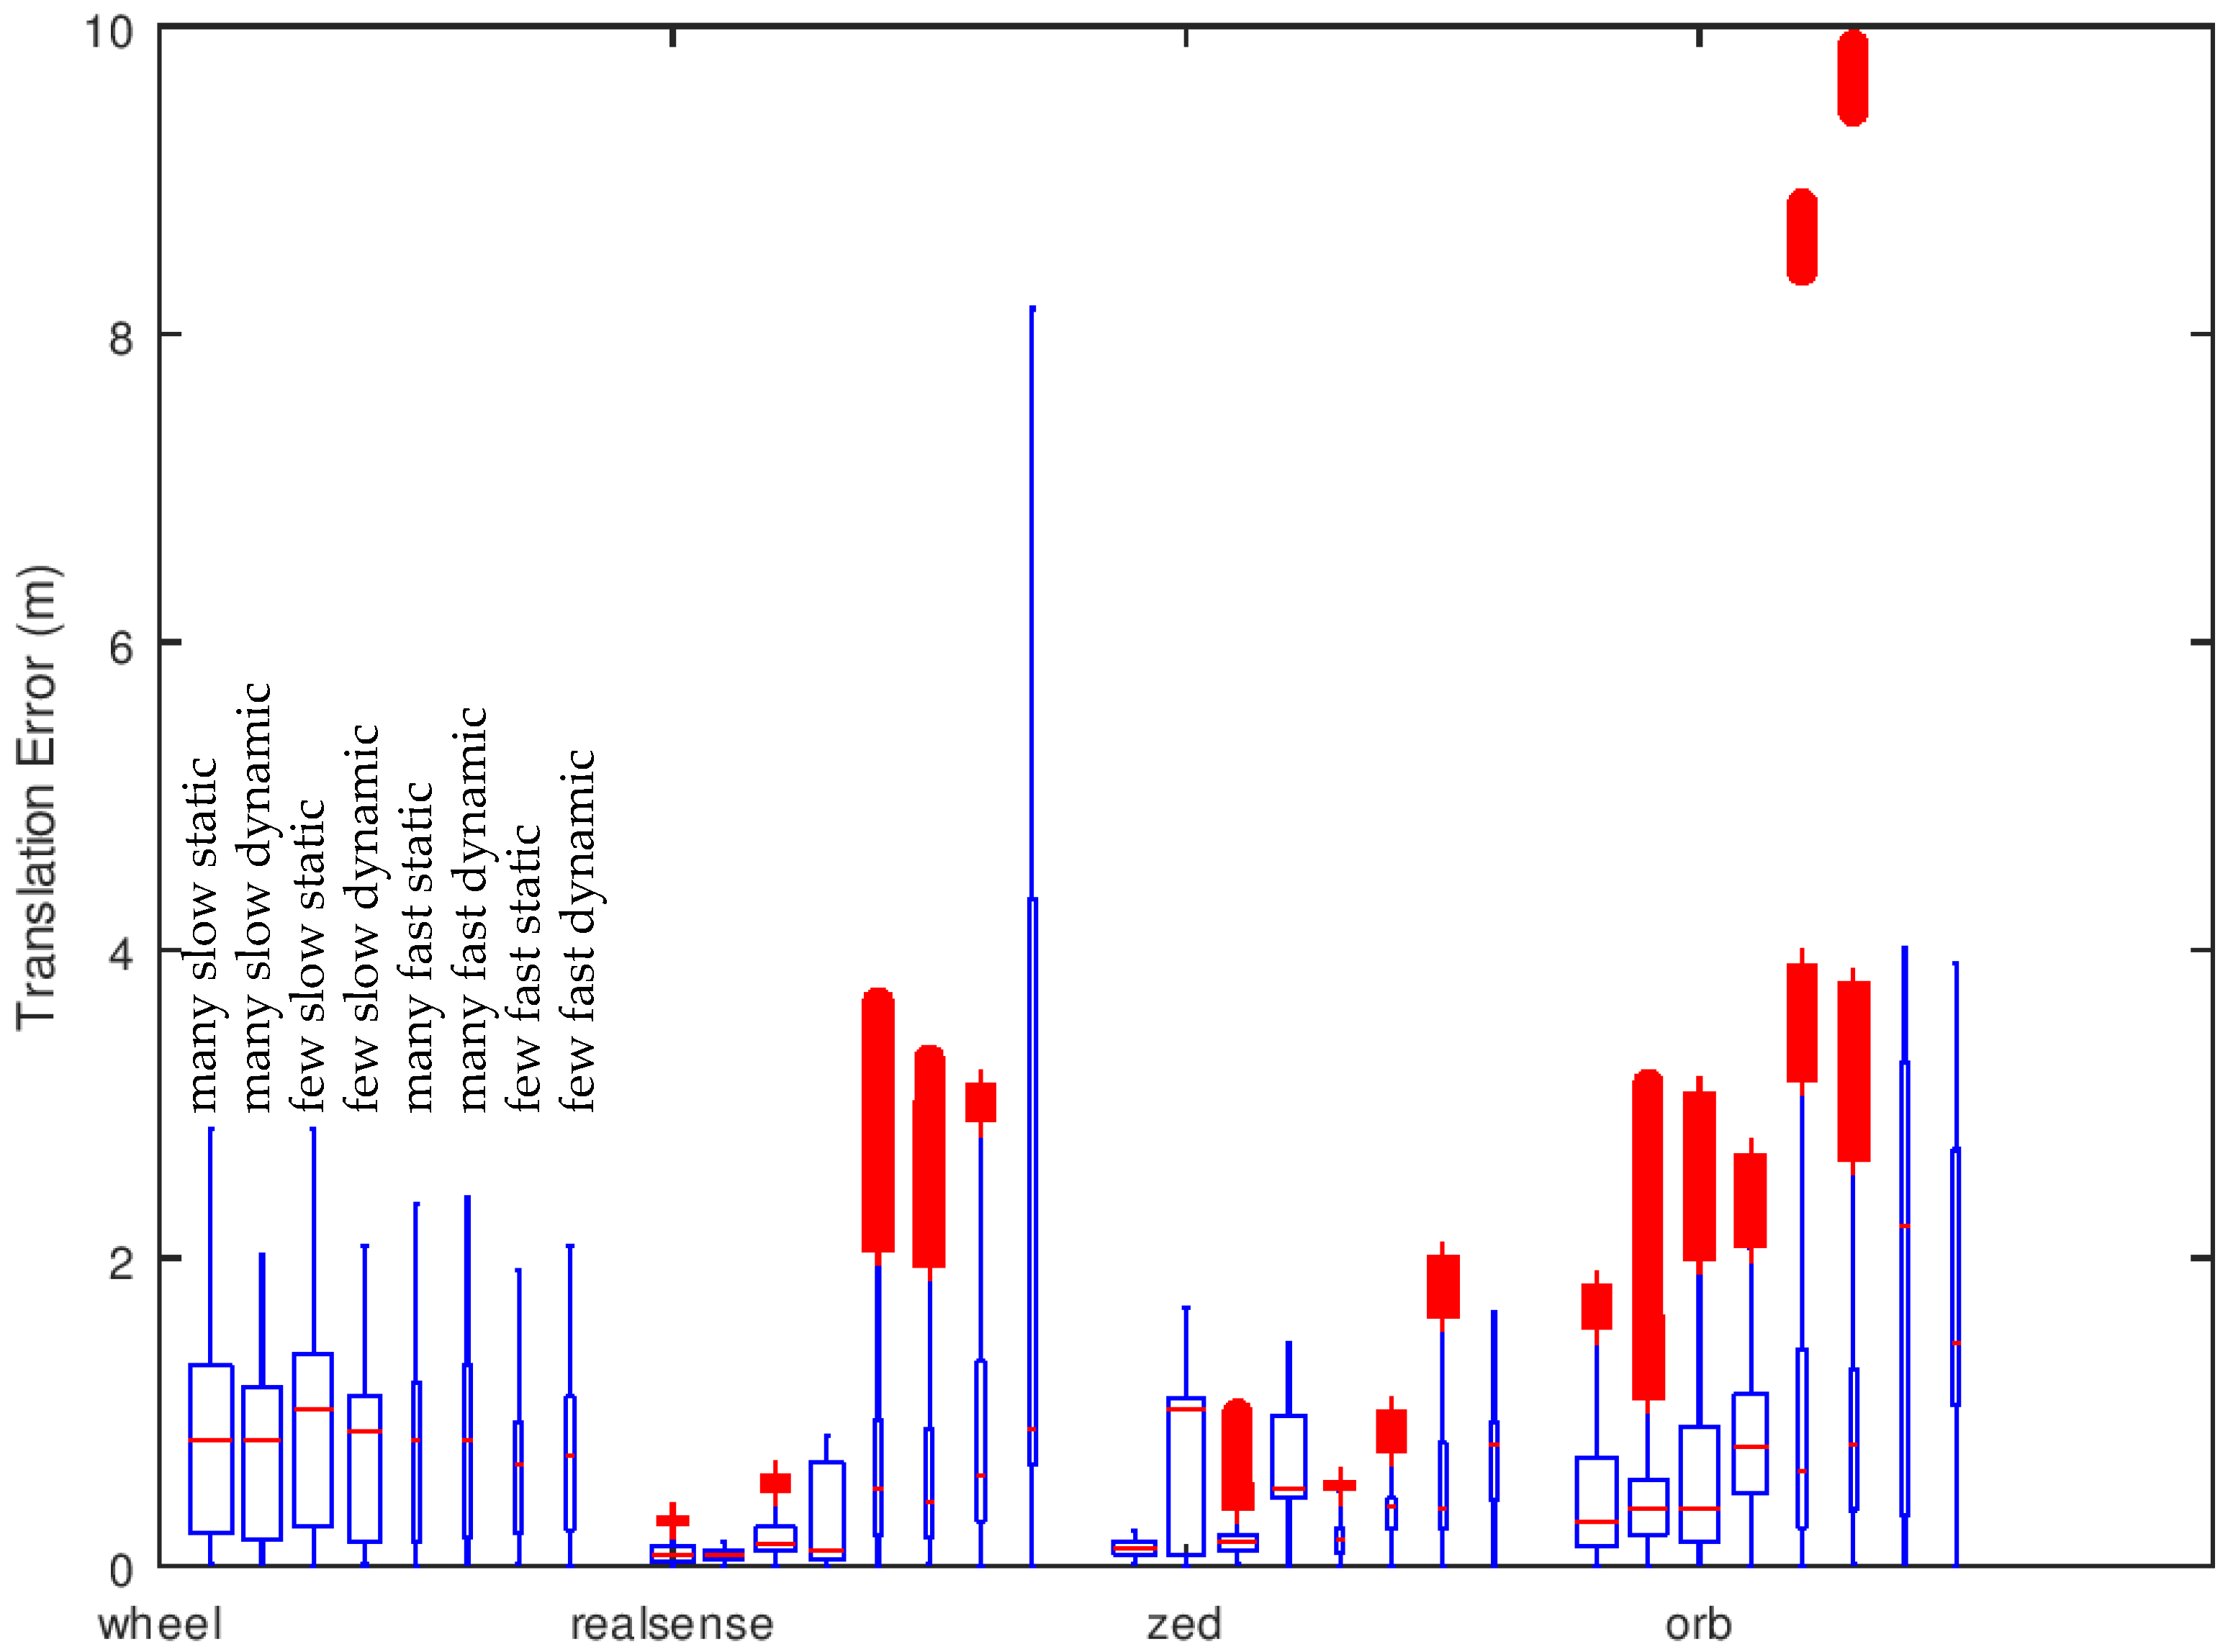
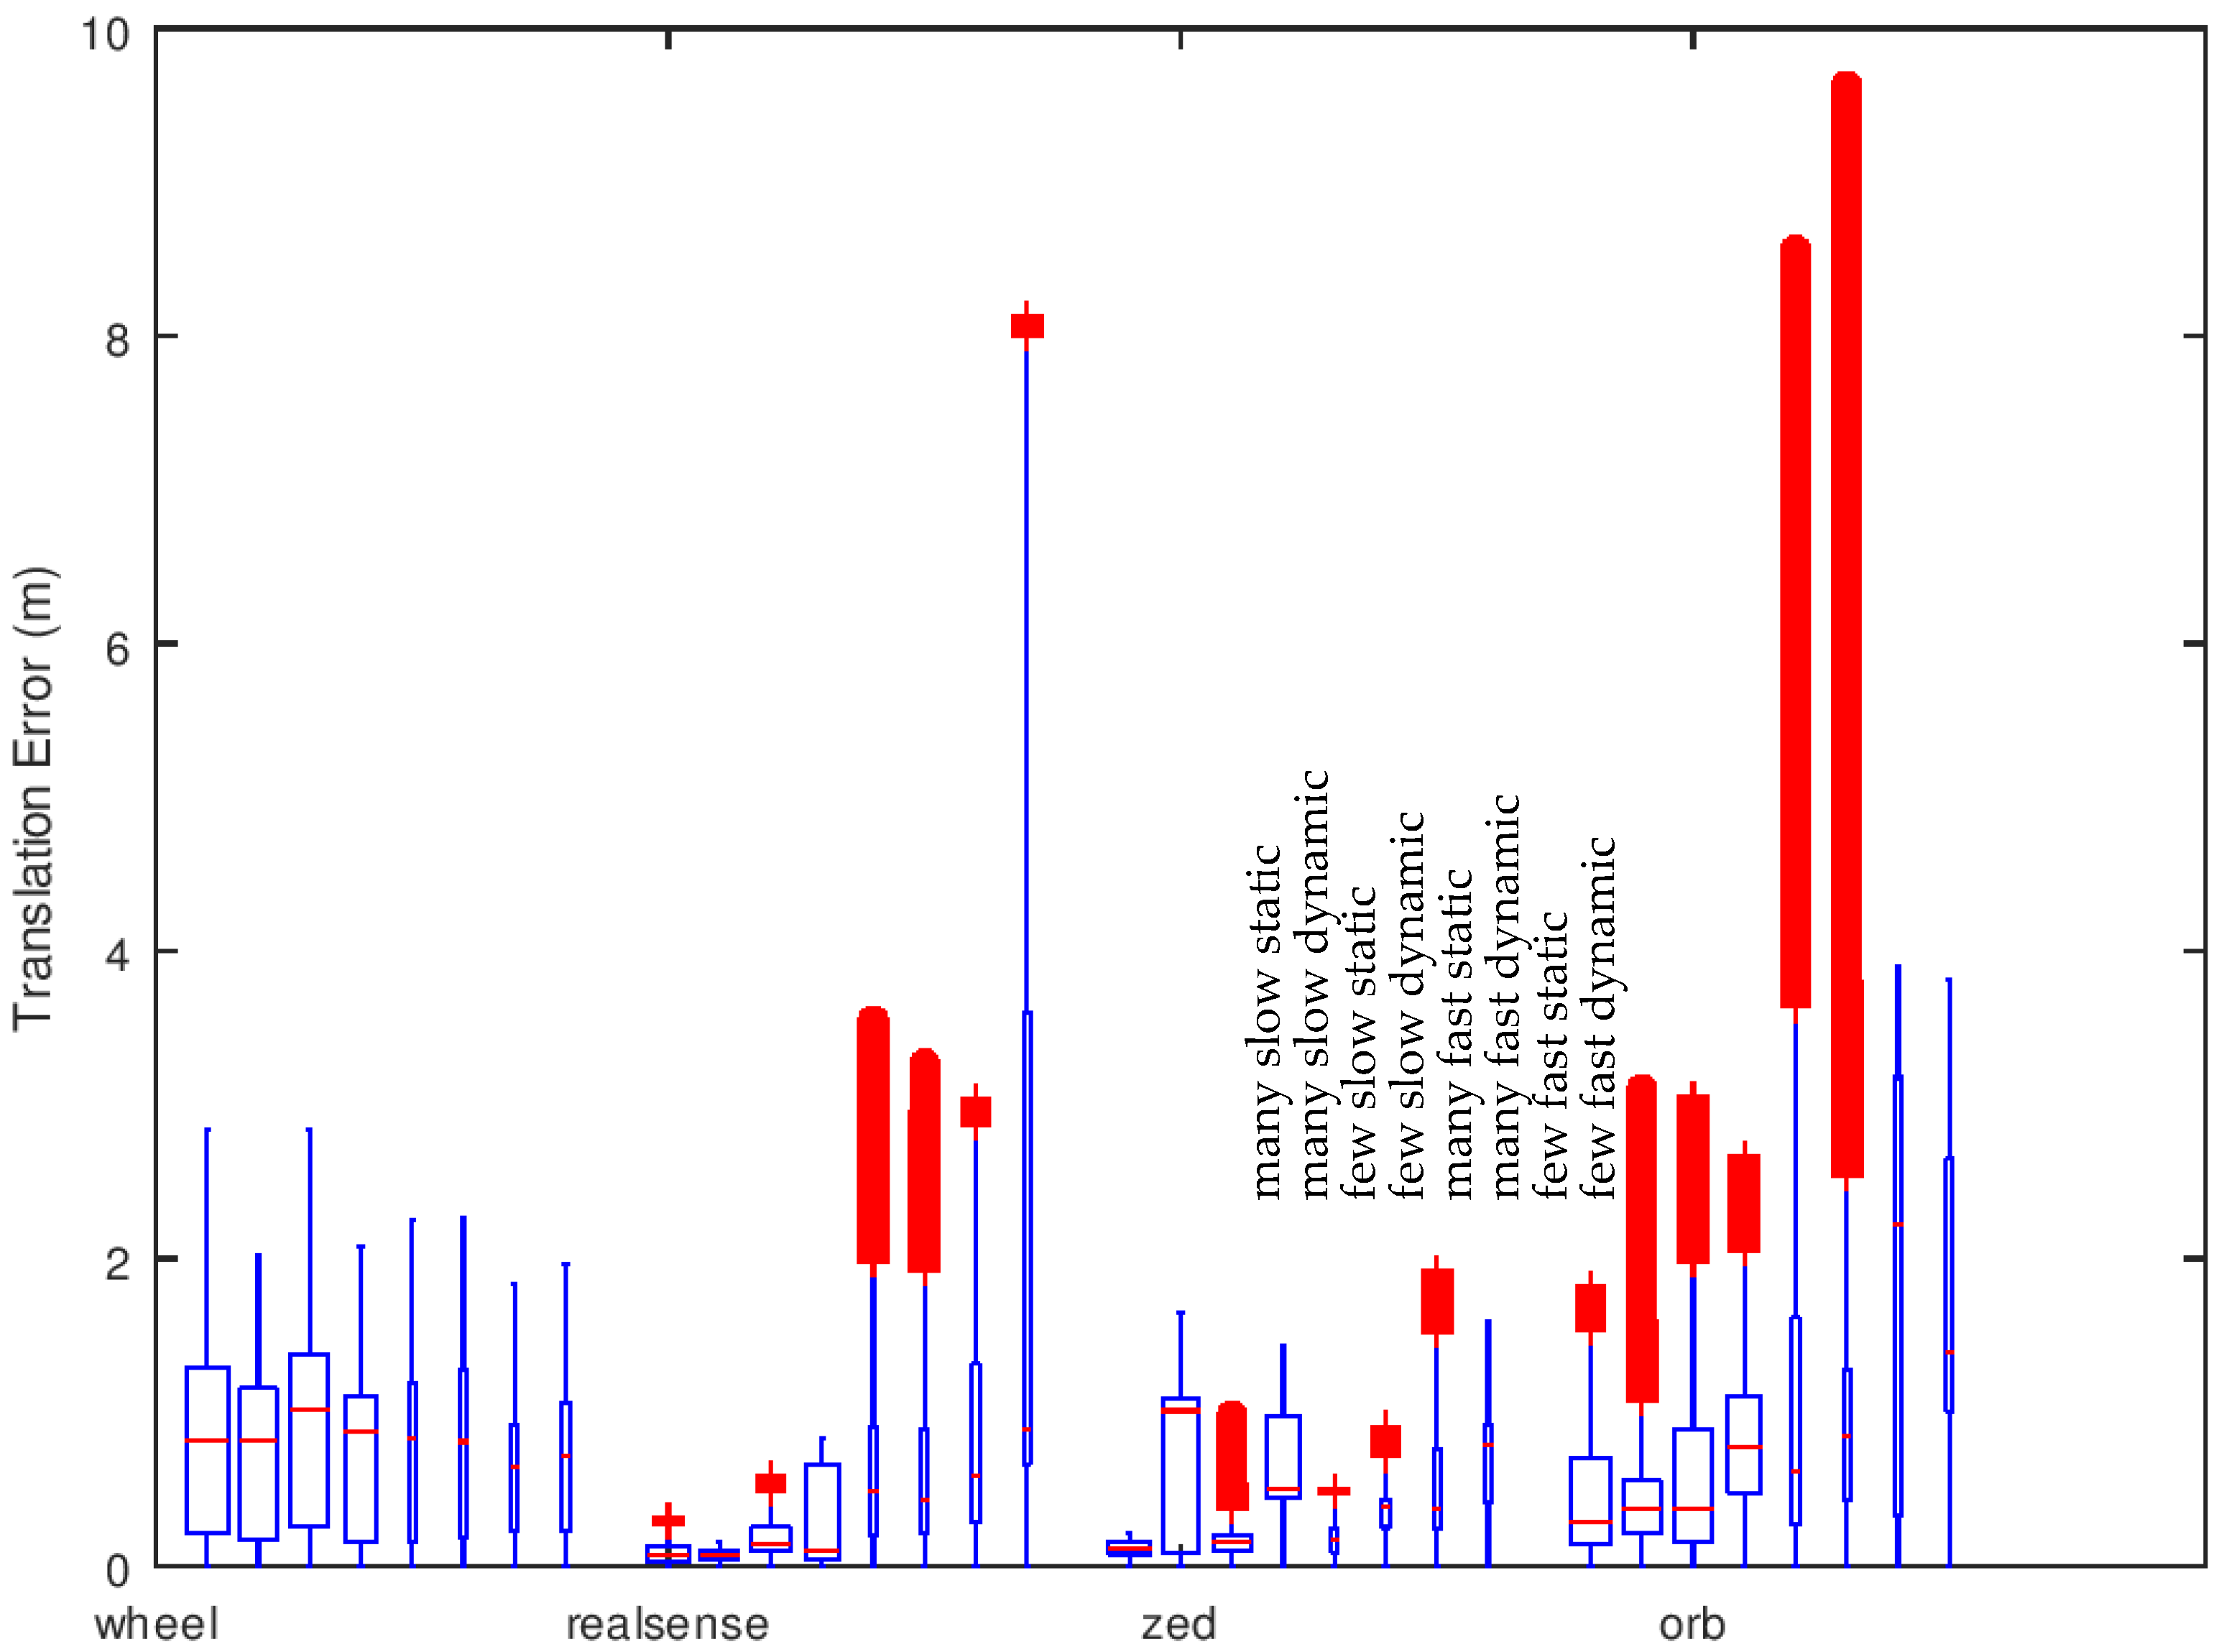
4.1. Descriptive Statistics
4.2. Statistical Analysis
4.3. Main Findings
5. Discussion
5.1. Camera Lens Types
5.2. Processing Power
5.3. Multiple Sensors & Sensor Fusion
5.4. Limitations of Black-Box Systems
5.5. Limitations of the Experimental Design
6. Conclusions
Supplementary Materials
Author Contributions
Funding
Conflicts of Interest
Appendix A


References
- Mohamed, S.A.S.; Haghbayan, M.; Westerlund, T.; Heikkonen, J.; Tenhunen, H.; Plosila, J. A Survey on Odometry for Autonomous Navigation Systems. IEEE Access 2019, 7, 97466–97486. [Google Scholar] [CrossRef]
- Aqel, M.O.A.; Marhaban, M.H.; Saripan, M.I.; Ismail, N.B. Review of visual odometry: Types, approaches, challenges, and applications. SpringerPlus 2016, 5, 1897. [Google Scholar] [CrossRef] [PubMed]
- Qin, T.; Li, P.L.; Shen, S.J. VINS-Mono: A Robust and Versatile Monocular Visual-Inertial State Estimator. IEEE Trans. Robot. 2018, 34, 1004–1020. [Google Scholar] [CrossRef]
- Mur-Artal, R.; Tardós, J.D. Visual-Inertial Monocular SLAM With Map Reuse. IEEE Robot. Autom. Lett. 2017, 2, 796–803. [Google Scholar] [CrossRef]
- Usenko, V.; Engel, J.; Stückler, J.; Cremers, D. Direct visual-inertial odometry with stereo cameras. In Proceedings of the 2016 IEEE International Conference on Robotics and Automation (ICRA), Stockholm, Sweden, 16–21 May 2016; pp. 1885–1892. [Google Scholar] [CrossRef]
- Whelan, T.; Johannsson, H.; Kaess, M.; Leonard, J.; McDonald, J. Robust real-time visual odometry for dense RGB-D mapping. In Proceedings of the IEEE International Conference on Robotics and Automation, Karlsruhe, Germany, 6–10 May 2013. [Google Scholar] [CrossRef]
- Steinbrücker, F.; Sturm, J.; Cremers, D. Real-time visual odometry from dense RGB-D images. In Proceedings of the IEEE International Conference on Computer Vision Workshops (ICCV Workshops), Barcelona, Spain, 6–13 November 2011; pp. 719–722. [Google Scholar] [CrossRef]
- Graeter, J.; Wilczynski, A.; Lauer, M. Limo: Lidar-monocular visual odometry. In Proceedings of the IEEE/RSJ International Conference on Intelligent Robots and Systems (IROS), Madrid, Spain, 1–5 October 2018. [Google Scholar] [CrossRef]
- Shin, Y.; Park, Y.S.; Kim, A. Direct Visual SLAM Using Sparse Depth for Camera-LiDAR System. In Proceedings of the IEEE International Conference on Robotics and Automation (ICRA), Brisbane, Australia, 21–25 May 2018; pp. 5144–5151. [Google Scholar] [CrossRef]
- Durrant-Whyte, H.; Bailey, T. Simultaneous localization and mapping: Part I. IEEE Robot. Autom. Mag. 2006, 13, 99–110. [Google Scholar] [CrossRef]
- Gutmann, J.S.; Konolige, K. Incremental mapping of large cyclic environments. In Proceedings of the IEEE International Symposium on Computational Intelligence in Robotics and Automation, 8–9 November 1999; pp. 318–325. [Google Scholar] [CrossRef]
- Delmerico, J.; Scaramuzza, D. A benchmark comparison of monocular visual-inertial odometry algorithms for flying robots. In Proceedings of the IEEE International Conference on Robotics and Automation (ICRA), Brisbane, Australia, 21–25 May 2018; pp. 2502–2509. [Google Scholar] [CrossRef]
- Angladon, V.; Gasparini, S.; Charvillat, V.; Pribanić, T.; Petković, T.; Ðonlić, M.; Ahsan, B.; Bruel, F. An evaluation of real-time RGB-D visual odometry algorithms on mobile devices. J. Real-Time Image Proc. 2019, 16, 1643–1660. [Google Scholar] [CrossRef]
- Joshi, B.; Rahman, S.; Kalaitzakis, M.; Cain, B.; Johnson, J.; Xanthidis, M.; Karapetyan, N.; Hernandez, A.; Li, A.Q.; Vitzilaios, N.; et al. Experimental Comparison of Open Source Visual-Inertial-Based State Estimation Algorithms in the Underwater Domain. In Proceedings of the IEEE/RSJ International Conference on Intelligent Robots and Systems (IROS), Macau, China, 3–8 November 2019. [Google Scholar] [CrossRef]
- Geiger, A.; Lenz, P.; Stiller, C.; Urtasun, R. Vision meets robotics: The KITTI dataset. Int. J. Robot. Res. 2013, 32, 1231–1237. [Google Scholar] [CrossRef]
- Chen, C.; Zhu, H.; Li, M.; You, S. A Review of Visual-Inertial Simultaneous Localization and Mapping from Filtering-Based and Optimization-Based Perspectives. Robotics 2018, 7, 45. [Google Scholar] [CrossRef]
- Ouerghi, S.; Ragot, N.; Boutteau, R.; Savatier, X. Comparative Study of a commercial tracking camera and ORB-SLAM2 for person localization. In Proceedings of the 15th International Joint Conference on Computer Vision, Imaging and Computer Graphics Theory and Applications, Valletta, Malta, 27–29 February 2020; pp. 357–364. [Google Scholar] [CrossRef]
- Cortés, S.; Solin, A.; Rahtu, E.; Kannala, J. ADVIO: An Authentic Dataset for Visual-Inertial Odometry. In Proceedings of the European Conference on Computer Vision (ECCV), Munich, Germany, 8–14 September 2018; pp. 419–434. [Google Scholar] [CrossRef]
- OptiTrack for robotics. Available online: https://optitrack.com/motion-capture-robotics/ (accessed on 15 July 2020).
- OptiTrack Prime 13. Available online: https://optitrack.com/products/prime-13/ (accessed on 15 July 2020).
- Arlo Complete Robot System. Parallax Inc. Available online: https://www.parallax.com/product/28966 (accessed on 15 July 2020).
- Arlo Robotic Platform System. Parallax Inc. Available online: https://www.parallax.com/product/arlo-robotic-platform-system (accessed on 15 July 2020).
- ROS. Available online: https://www.ros.org (accessed on 15 July 2020).
- Propeller Activity Board, WX. Parallax Inc. Available online: https://www.parallax.com/product/32912 (accessed on 15 July 2020).
- Introducing ZED Mini. Stereolabs. Available online: https://www.stereolabs.com/blog/introducing-zed-mini/ (accessed on 15 July 2020).
- Mur-Artal, R.; Tardós, J.D. Orb-slam2: An open-source slam system for monocular, stereo, and rgb-d cameras. IEEE Trans. Robot. 2017, 33, 1255–1262. [Google Scholar] [CrossRef]
- Gálvez-López, D.; Tardos, J.D. Bags of binary words for fast place recognition in image sequences. IEEE Trans. Robot. 2012, 28, 1188–1197. [Google Scholar] [CrossRef]
- Feigl, T.; Porada, A.; Steiner, S.; Löf-fler, C.; Mutschler, C.; Philippsen, M. Localization Limitations of ARCore, ARKit, and Hololens in Dynamic Large-Scale Industry Environments. In Proceedings of the 15th International Joint Conference on Computer Vision, Imaging and Computer Graphics Theory and Applications, Valletta, Malta, 27–29 February 2020; pp. 307–318. [Google Scholar]
- Zhang, X.; Yao, X.; Zhu, Y.; Hu, F. An ARCore Based User Centric Assistive Navigation System for Visually Impaired People. Appl. Sci. 2019, 9, 989. [Google Scholar] [CrossRef]
- Kästner, L.; Lambrecht, J. Augmented-Reality-Based Visualization of Navigation Data of Mobile Robots on the Microsoft Hololens-Possibilities and Limitations. In Proceedings of the IEEE International Conference on Cybernetics and Intelligent Systems (CIS) and IEEE Conference on Robotics, Automation and Mechatronics (RAM), Bangkok, Thailand, 18–20 November 2019; pp. 344–349. [Google Scholar] [CrossRef]


| Quantity of Visual Features | Robot Speed | With Moving Visual Elements (Dynamic) or without (Static) |
|---|---|---|
| Many | Slow | Static |
| Many | Slow | Dynamic |
| Few | Slow | Static |
| Few | Slow | Dynamic |
| Many | Fast | Static |
| Many | Fast | Dynamic |
| Few | Fast | Static |
| Few | Fast | Dynamic |
| Wheel Encoders | RealSense T265 | ZED Mini | ORB-SLAM2 | ||
|---|---|---|---|---|---|
| Mean | 0.8432 m | 0.6706 m | 0.4249 m | 1.1710 m | |
| Variance | 0.0144 | 1.3356 | 0.1120 | 0.3683 | |
| Observations | 24 | 24 | 24 | 24 | |
| p-value | Wheel encoders | 2.37 × 10⁻¹ | 1.54 × 10⁻⁶ ** | 7.79 × 10⁻³ ** | |
| RealSense T265 | 1.63 × 10⁻¹ | 3.44 × 10⁻² * | |||
| ZED Mini | 3.25 × 10⁻⁶ ** |
| Wheel Encoders | RealSense T265 | ZED Mini | ORB-SLAM2 | ||
|---|---|---|---|---|---|
| Mean | 0.4682 rad | 0.1057 rad | 0.1061 rad | 1.0409 rad | |
| Variance | 0.0167 | 0.0092 | 0.0060 | 0.3314 | |
| Observations | 24 | 24 | 24 | 24 | |
| p-value | Wheel encoders | 2.80 × 10⁻¹⁴ ** | 1.63 ×10⁻¹⁴ ** | 3.52 × 10⁻⁵ ** | |
| RealSense T265 | 4.93 × 10⁻¹ | 2.21 × 10⁻⁸ ** | |||
| ZED Mini | 2.05 × 10⁻⁸ ** |
© 2020 by the authors. Licensee MDPI, Basel, Switzerland. This article is an open access article distributed under the terms and conditions of the Creative Commons Attribution (CC BY) license (http://creativecommons.org/licenses/by/4.0/).
Share and Cite
Alapetite, A.; Wang, Z.; Hansen, J.P.; Zajączkowski, M.; Patalan, M. Comparison of Three Off-the-Shelf Visual Odometry Systems. Robotics 2020, 9, 56. https://doi.org/10.3390/robotics9030056
Alapetite A, Wang Z, Hansen JP, Zajączkowski M, Patalan M. Comparison of Three Off-the-Shelf Visual Odometry Systems. Robotics. 2020; 9(3):56. https://doi.org/10.3390/robotics9030056
Chicago/Turabian StyleAlapetite, Alexandre, Zhongyu Wang, John Paulin Hansen, Marcin Zajączkowski, and Mikołaj Patalan. 2020. "Comparison of Three Off-the-Shelf Visual Odometry Systems" Robotics 9, no. 3: 56. https://doi.org/10.3390/robotics9030056
APA StyleAlapetite, A., Wang, Z., Hansen, J. P., Zajączkowski, M., & Patalan, M. (2020). Comparison of Three Off-the-Shelf Visual Odometry Systems. Robotics, 9(3), 56. https://doi.org/10.3390/robotics9030056