1. Introduction
Vibration serviceability governs the design of contemporary civil engineering structures, such as footbridges and floors [
1]. This is because modern structures tend to be increasingly slender and lighter, thus responding more easily to various dynamic excitation. Active people, such as pedestrians and joggers, are the most commonly reported source of structural vibrations; this is not surprising considering that majority of civil structures are by their very purpose occupied, and dynamically excited by people. Yet, to date, the relevant design guidelines have all failed to provide a quality model of human-induced forces that can be used to reliably predict vibrations at design stage. The lack of quality models is mainly due to the lack of adequate experimental force records, which in turn is due to the lack of adequate data acquisition technology.
Walking, jogging, running and jumping forces in sport and clinical biomechanics are traditionally measured directly using force plates and instrumented treadmills [
2]. The common laboratory setup is a single measuring unit mounted on a rigid floor (as commonly required by manufacturers) which can process a single individual at a time. Apart from high costs and constrained laboratory environment, that excludes more or less vibrating surfaces, the lack of interaction with the surrounding individuals and monitoring crowds of people labelled direct force measurements very limited for civil engineering purposes [
3].
The source of human-induced loading on a structure is in the body motion. There have been notable attempts to reproduce the forces from the measured body kinematics [
2]. The range of data acquisition technologies include video-based motion tracking systems ([
4,
5,
6]) and inertial wireless sensors ([
7,
8,
9]). The video-based technologies often interact with daily light and have problems with image processing of video frames yielding false body detection and occlusion of motion trajectories. On the other hand, wireless networks can synchronize a very limited number of inertial sensors ([
8]). As motion tracking each individual needs at least one sensor, simultaneous monitoring of large groups and crowds is virtually impossible ([
3]). Furthermore, both direct and indirect force measuring technologies require instrumentation of test subjects which makes people aware of being observed and measured. All this can influence human behavior yielding biased data records [
3].
Another key reason for the lack of reliable guidance in vibration serviceability assessment is the missing link between design calculations and the actual vibration performance of as built structures. Unlike mechanical engineering structures, such as cars and airplanes, civil structures are tested to vibrations only in case issues are reported upon completion of construction. This is partly the matter of the ethos of ever conservative construction industry, and mainly because vibration testing of civil structures is expensive and time consuming. There is a very little opportunity to study and understand which aspects of vibration serviceability assessment at design stage are characterized with the greatest uncertainty, so that future similar design could be carried out with more confidence and less errors.
Some of these limitations might, however, change thanks to the widespread availability of smartphones. Smartphones are integrated part of modern life. People use them routinely in various situations, from mobile banking to navigation. Each new generation of smartphones brings an increasing spectrum of embedded sensors, such as cameras, global positioning system (GPS) receivers, accelerometers, gyroscopes and pedometers [
10]. Recent studies (e.g., [
11,
12,
13,
14]) on shaking table have shown that typical accelerometers inside high-end smartphones are capable of recording motions in a frequency range of interest for many civil structures (0.2–20 Hz), with an acceleration amplitude range (10–2000 mg) [
14] sufficient for practical applications in the field of vibration monitoring and modal testing. Successful utilization of such sensors in structural health monitoring of large civil structures has been indeed confirmed in a few studies (e.g., in [
6,
10,
15,
16,
17,
18]). All this can make vibration survey cheap from both time and cost perspective.
The potential advantages of smartphones are that there is no cabling, they are readily available, contain data storage and allow easy data transfer for post-processing. Some even come with software that can process data locally. In conjunction with the accompanying apps they have the great potential to revolutionize structural dynamics, especially to reduce the cost and labor of data acquisition [
15]. However, studies on the capability and implementation of smartphones and, in particular, of embedded accelerometers in the measurements of pedestrian’s loads are still scarce and limited. Several aspects are involved in using smartphones for the definition of pedestrians’ loads, the main ones are the accuracy of the sensors (dealt with in, e.g., [
19,
20]), the performance of the operating system in collecting the sensor data (e.g., [
21,
22]), the accuracy of the actual application ran to collect the measurements (dealt with in [
23]), the model used to reconstruct the loading form the measurements (dealt with in, e.g., [
7,
8,
24,
25,
26] sometimes using a biomechanical model). The first aspect and the last one have collected more attention; the first since it is not limited to the definition of pedestrians loads while the last one since is not limited to use of smartphones data to reconstruct the load. Among the few directly related to the use of smartphones there are, e.g., [
24,
27,
28,
29,
30].
This work presents a study designed to investigate first the possibility, and the accuracy, of using smartphones to identify the modal properties of a civil structure, and, secondly, to indirectly measure the forces exerted by pedestrians walking on the same, using non specialized hardware and software and a simple loading model. The proposed loading model is compared to the forces generated by popular models featured in the technical literature, and it is proven to be superior. The smartphones used in this study, which feature accelerometers of different capabilities, were selected to have a range of possible price points. The base-line accelerometers, against which they are compared, are routinely used in commercial practice for investigation of the vibrational properties of civil structures. The intent is to tests whether accelerometers installed on smartphones can reach the accuracy of professional accelerometers created for vibration monitoring of civil engineering structures, and how they can be useful to structural engineers. Should a serious vibration problem be picked up with smartphones, a costlier and more time-consuming survey, using full professional modal testing equipment, could then be subsequently carried out.
2. Evolution of Phone Used Sensors for Acceleration Measurement and Issues Related to Their Practical Use
Contemporary smartphones contain about half a dozen sensors, such as accelerometer, gyroscope, magnetometer, GPS, etc. Several of them can identify and record vibrations. Earlier models contained just a single MEMS (Micro Electro-Mechanical Systems) accelerometer sensor able to measure acceleration along three orthogonal axes. More recent models add a triaxial gyroscope, that also measures angular velocity along three orthogonal axes, as well as a magnetometer. In this work, as a first step, only accelerometers will be considered.
Shaking table tests with accelerometers inside smartphones ([
11,
12,
13,
14]) showed that acceleration as low as 10 mg (
g = 9.81 m/s
2) can be detected and recorded with acceptable errors within a 0.2–20 Hz frequency band, which is of interest for most vibrations of civil structures. In a study by Ozer ([
18]) a small scale shaking table test gave an error 17.5% for amplitude of peak horizontal acceleration (using iPhone 3GS), while the error 3.10% was reported for iPhone 5. The error for the dominant frequency of the signal was about 0.96% for the last smartphone, whereas the older generation had significantly larger errors, ranging between 4% and 5%. The shaking table was driven from 1 Hz (Peak Acceleration 0.04 g) to 20 Hz (Peak Acceleration 0.29 g). In a shaker test of low frequency vibrations (about 1.4 Hz) of the Millikan Library building on the Caltech campus, Kong et al. [
14] proposed to place several phones at the same location. The aim was to improve the signal-to-noise ratio by averaging the recordings at post-processing time. This assumes that noise recorded by different phones is truly random, and averaging through different phones will cancel the noise but not the coherent signal. However, because the phones were not synchronized with each other (each phone had its own network time), they had to use cross correlation to find the best alignment of the recordings from different phones. They concluded that seven phones gave optimal results.
An idea of what can be expected from accelerometer sensors integrated in state-of-the-art smartphones can be obtained by looking
Table 1, compiled from data reported in several works of the literature.
Table 2 reports the properties of the accelerometers in the smartphones used in this work. On average, a mid-range smartphone is likely to be equipped with an accelerometer sensor capable to resolve accelerations as low as 1 mg up to 400 Hz, at least.
4. Models of Walking Loading
Generally speaking, the most widely used models of pedestrian loading (also known as “ground reaction force” or GRF) fall into two broad categories: time domain and frequency domain representations. Models in time domain can be further subdivided into deterministic models and stochastic (e.g., probabilistic) models.
Time domain deterministic models are used in the present study since this representation traditionally features popular codes and guidelines. Such models will be compared with a very simple reproduction of the pedestrian loading derived from body accelerations recorded by smartphones attached to walking persons, hence to highlight how easily smartphones can enhance the vibrations assessment.
For LFFs, the loading model found in codes is typically concerned only with the vertically exerted component of the interaction force
Fp(
t), and is mathematically described via the Fourier series using a limited number
N of harmonics (typically less than 5):
where
G is the person weight,
n is the order of a harmonic (
n = 1, 2, 3, ...),
αn is the Fourier amplitude for the n-
th harmonic normalized to G (also known as the Dynamic Load Factor—DLF),
fp is the pacing frequency (in Hz), Φ
n is the phase angle for the n-
th harmonic. The number
N of harmonics that should to be considered in vibration analysis is specific to each code. A summary of models has been collected in [
1].
For HFFs the forcing function is approximated as a series of successive impulses, each representing a footfall. In such cases an effective impulse
Ieff [Ns] is used to represent the loading. In European practice (e.g., [
31]) so called “effective impulse”
Ieff takes the following form:
where
a is constant related to the weight of the person (values in the range from 42 to 60 can be found in the literature),
f is the footfall rate in Hz,
f0 is the natural frequency of the structure in Hz and
Q is the static force exerted by an average person (normally taken as 746 N) [
31].
None of the force models described by Equations (1) and (2) provides reliable predictions of vibration response for floors with the first vertical natural frequency in the narrow range around the cut-off frequency [
26]. Such floors usually show vibration response that cannot be clearly classified as steady-state or transient, but rather something in between. Moreover, in this case all relevant design guideline and codes commonly fail to provide adequate model of pedestrian loading. Having force records made on actual structures and coupled with vibration data are needed for future improvements. This is exactly what the present study aims to achieve.
A further possibility, for LFFs and HFFs alike, is by giving a time-history approximation representing the GRF of each footfall (e.g., the polynomial model in the HiVoss [
36] research program, or the older model suggested by Baumann and Bachmann [
37] in a form analogous to Equation (1)). The advantage is that the force can be applied at (or close to) the locations where the footfalls happen, accounting for spatial variability of the loading. This is one of the models from the literature adopted in the numerical simulations presented in the following.
The GRF of a footfall can be measured directly ([
2]), using e.g., force plates, treadmills, insole sensors, or it can be obtained indirectly, based on reproduction from measured body kinematics. Indirect computation provides more freedom and force measurements in natural environments, on real structures rather than in laboratories. All these methods have disadvantages, and data collection is not always easy while the specialized technology required (e.g., [
8,
25,
38,
39]) might not be readily available, so this study aims to test if accelerometers in smartphones can be used to this purpose.
To this end, the acceleration at the fifth lumbar vertebra, position LB in
Figure 2, is used in this work. The underlying assumption is that the recorded motion represents the motion of the center of mass (CoM) of the whole body, so that the pedestrian force can be computed by applying Newton’s second law of motion [
2]:
where
mp is the pedestrian mass, and
aM is the measured acceleration (including the gravity
g). As studies by Bocian et al. [
8], Shahabpoor and Pavic [
40], Van Nimmen et al. [
25] showed that a single point inertial measurement of the sacrum (i.e., the lower back) can be used to reproduce the vertical force of a pedestrian with enough detail to simulate reliably structural vibrations.
6. Testing Campaign
To measure the modal properties and vibrations under human excitation, the structure described in
Section 4 was instrumented with 4 reference accelerometers (Wilcoxon Research, Model 731A) arranged in two different configurations (see
Figure 5). Three smartphones, positioned close to the reference accelerometers complemented the instrumentation for some tests. For others the smartphones were attached to the pedestrian walking to record his acceleration. Locations A1-A4 in
Figure 5 mark the position of accelerometers. Locations A1–A3 also mark the position of the smartphones when used to record the acceleration of the structure. The arrangement in
Figure 5a has all the accelerometers on the same girder. They are distributed over one half of it to better capture the modal shapes. The arrangement in
Figure 5b has one accelerometer per girder, and was meant to investigate the redistribution capacity of the floor system. In both arrangements, the walking excitation is applied only on one girder. A partial list of tests performed is reported in
Table 3. The results analyzed in the following refer to the layout shown in
Figure 5a.
The testing sequence reported in
Table 3 lists two different types of tests: heel drop tests and walking tests. In heel drop tests the testing person raised high on his toes, then hit the structure with his heels, to induce an impulsive excitation having a spectrum wide enough to excite the largest possible number of structural modes. From these tests is relatively easy to derive reliable estimates of the structural modal properties, as described in the following section.
Walking tests enable measurements of the actual structural response and a direct comparison with vibration limits reported in design codes, as it will be elaborated in
Section 7.
7. Heel Drop Tests
The frequency of the first vibration mode of the floor system is important to classify the floor either as a LFF or a HFF. Moreover, the modal damping is important as discussed in
Section 3. The natural frequencies and the damping ratios for the first mode shapes were estimated from the experimental results of the heel drop tests. As an example of the data recorded,
Figure 6a depicts the time-history trace recorded at position A1 (see
Figure 5) during Test 7 using the reference accelerometer (Wilcoxon Research Model 731A, sensitivity 10V/g) and smartphone Phone 2 (Huawey P20 Pro, equipped with an accelerometer sensor ST LSM6DSM ver:1, with resolution of 18 bit, range: ±2 g, noise density 75 μg/√Hz).
Figure 7 depicts similar data for position A2 using the reference accelerometer (Wilcoxon Research Model 731A, sensitivity 10V/g) and smartphone Phone 1 (Xiaomi Redmi Note 4 2016, equipped with an accelerometer sensor BOSCH BMI160, with resolution of 16 bit, range: ±2 g, noise density 180 μg/√Hz). Smartphones and the reference accelerometers were simply positioned beside each other on the floor, following the test grid (
Figure 5).
The acceleration signals recorded simultaneously by the two types of sensors closely match in time domain (
Figure 6a and
Figure 7a). The corresponding Fourier amplitude spectra shown in
Figure 6b and
Figure 7b, show the same in frequency domain for Phone 2. However, for Phone 1 it can be observed that the Fourier amplitudes are slightly offset to the right as the frequency increases. This phenomenon is due to the jitter in sampling frequency typical of android devices (see e.g., [
21,
22]). Although the sampling frequency was set to 200 Hz for Phone 1, in reality it was varying slightly during the data collection around this frequency, yielding the slight shift in the FFT.
A detail analysis of the actual sampling time derived from the time stamp of each data point of Phone 1 and Phone 2, gave the results depicted in
Figure 8 in terms of jitter of the sampling time interval. For Phone 1 the average
dt in Test 7 was
dt = 0.005042 s, corresponding to the average sampling frequency
fs = 198.3339944 Hz versus the nominal 200 Hz used in computing the Fourier amplitude spectrum in
Figure 7. Phone2 showed better quality both from the point of view of the sampling frequency, which was higher, and of its stability. The average
dt in Test 7 was
dt = 0.0019985 s, which corresponds to the average sampling frequency of 500.3753 Hz versus nominal 500 Hz used to derive the Fourier amplitude spectrum in
Figure 6.
Nevertheless, despite apparent noise present in the smartphone Phone 1 signals, once corrected (see
Figure 9) the data from this smartphone identified reliably the dominant vibration modes of the structure. Using the baseline sensors, the estimated natural frequencies of the first four modes are
f1 = 8.296 Hz;
f2 = 10.695 Hz;
f3 = 14.692 Hz;
f4 = 19.390 Hz.
The damping ratios were estimated using the logarithmic decay technique from the tail of the Heel Drop tests recordings, filtering the recorded signal with a 0.5 Hz band pass filter centered at the resonance frequency. The identified damping ratios are: ζ = 1.10%, 1.04%, 0.90%, and 0.80% for the first four modes, respectively.
Based on the results obtained in the heel drop tests, the floor can be classified at the transition from LFF to HFF, but it is still a LFF according to the standards. This is an odd region for a numerical simulation of the floor vertical acceleration, as already mentioned above.
8. Walking Tests Test 3 and Test 4 and Numerical Modelling
In
Section 6, the capability of smartphone acceleration records to identify modal parameters was assessed. They can also be very useful to obtain a better representation of the actual loading due to walking by placing the phone on the walking person to record its vertical acceleration. This will be presented in relation to Tests 3 and 4.
During Test 3 and 4, simultaneously with the structural response the acceleration of the walking person also was recorded using a smartphone. The phone was securely fixed to the lower back of the person (the LB position in
Figure 2) using a tight belt. This is a position where during the motion the smartphone stays fairly vertical and aligned with the spinal cord, so no particular post-processing of the recorded acceleration was required [
2,
8].
Among the test performed, Test 3 and Test 4 are of special interest for assessing the vibrations of the floor system under human-induced excitation, since these tests reproduce more closely the actual loading on a floor in normal use.
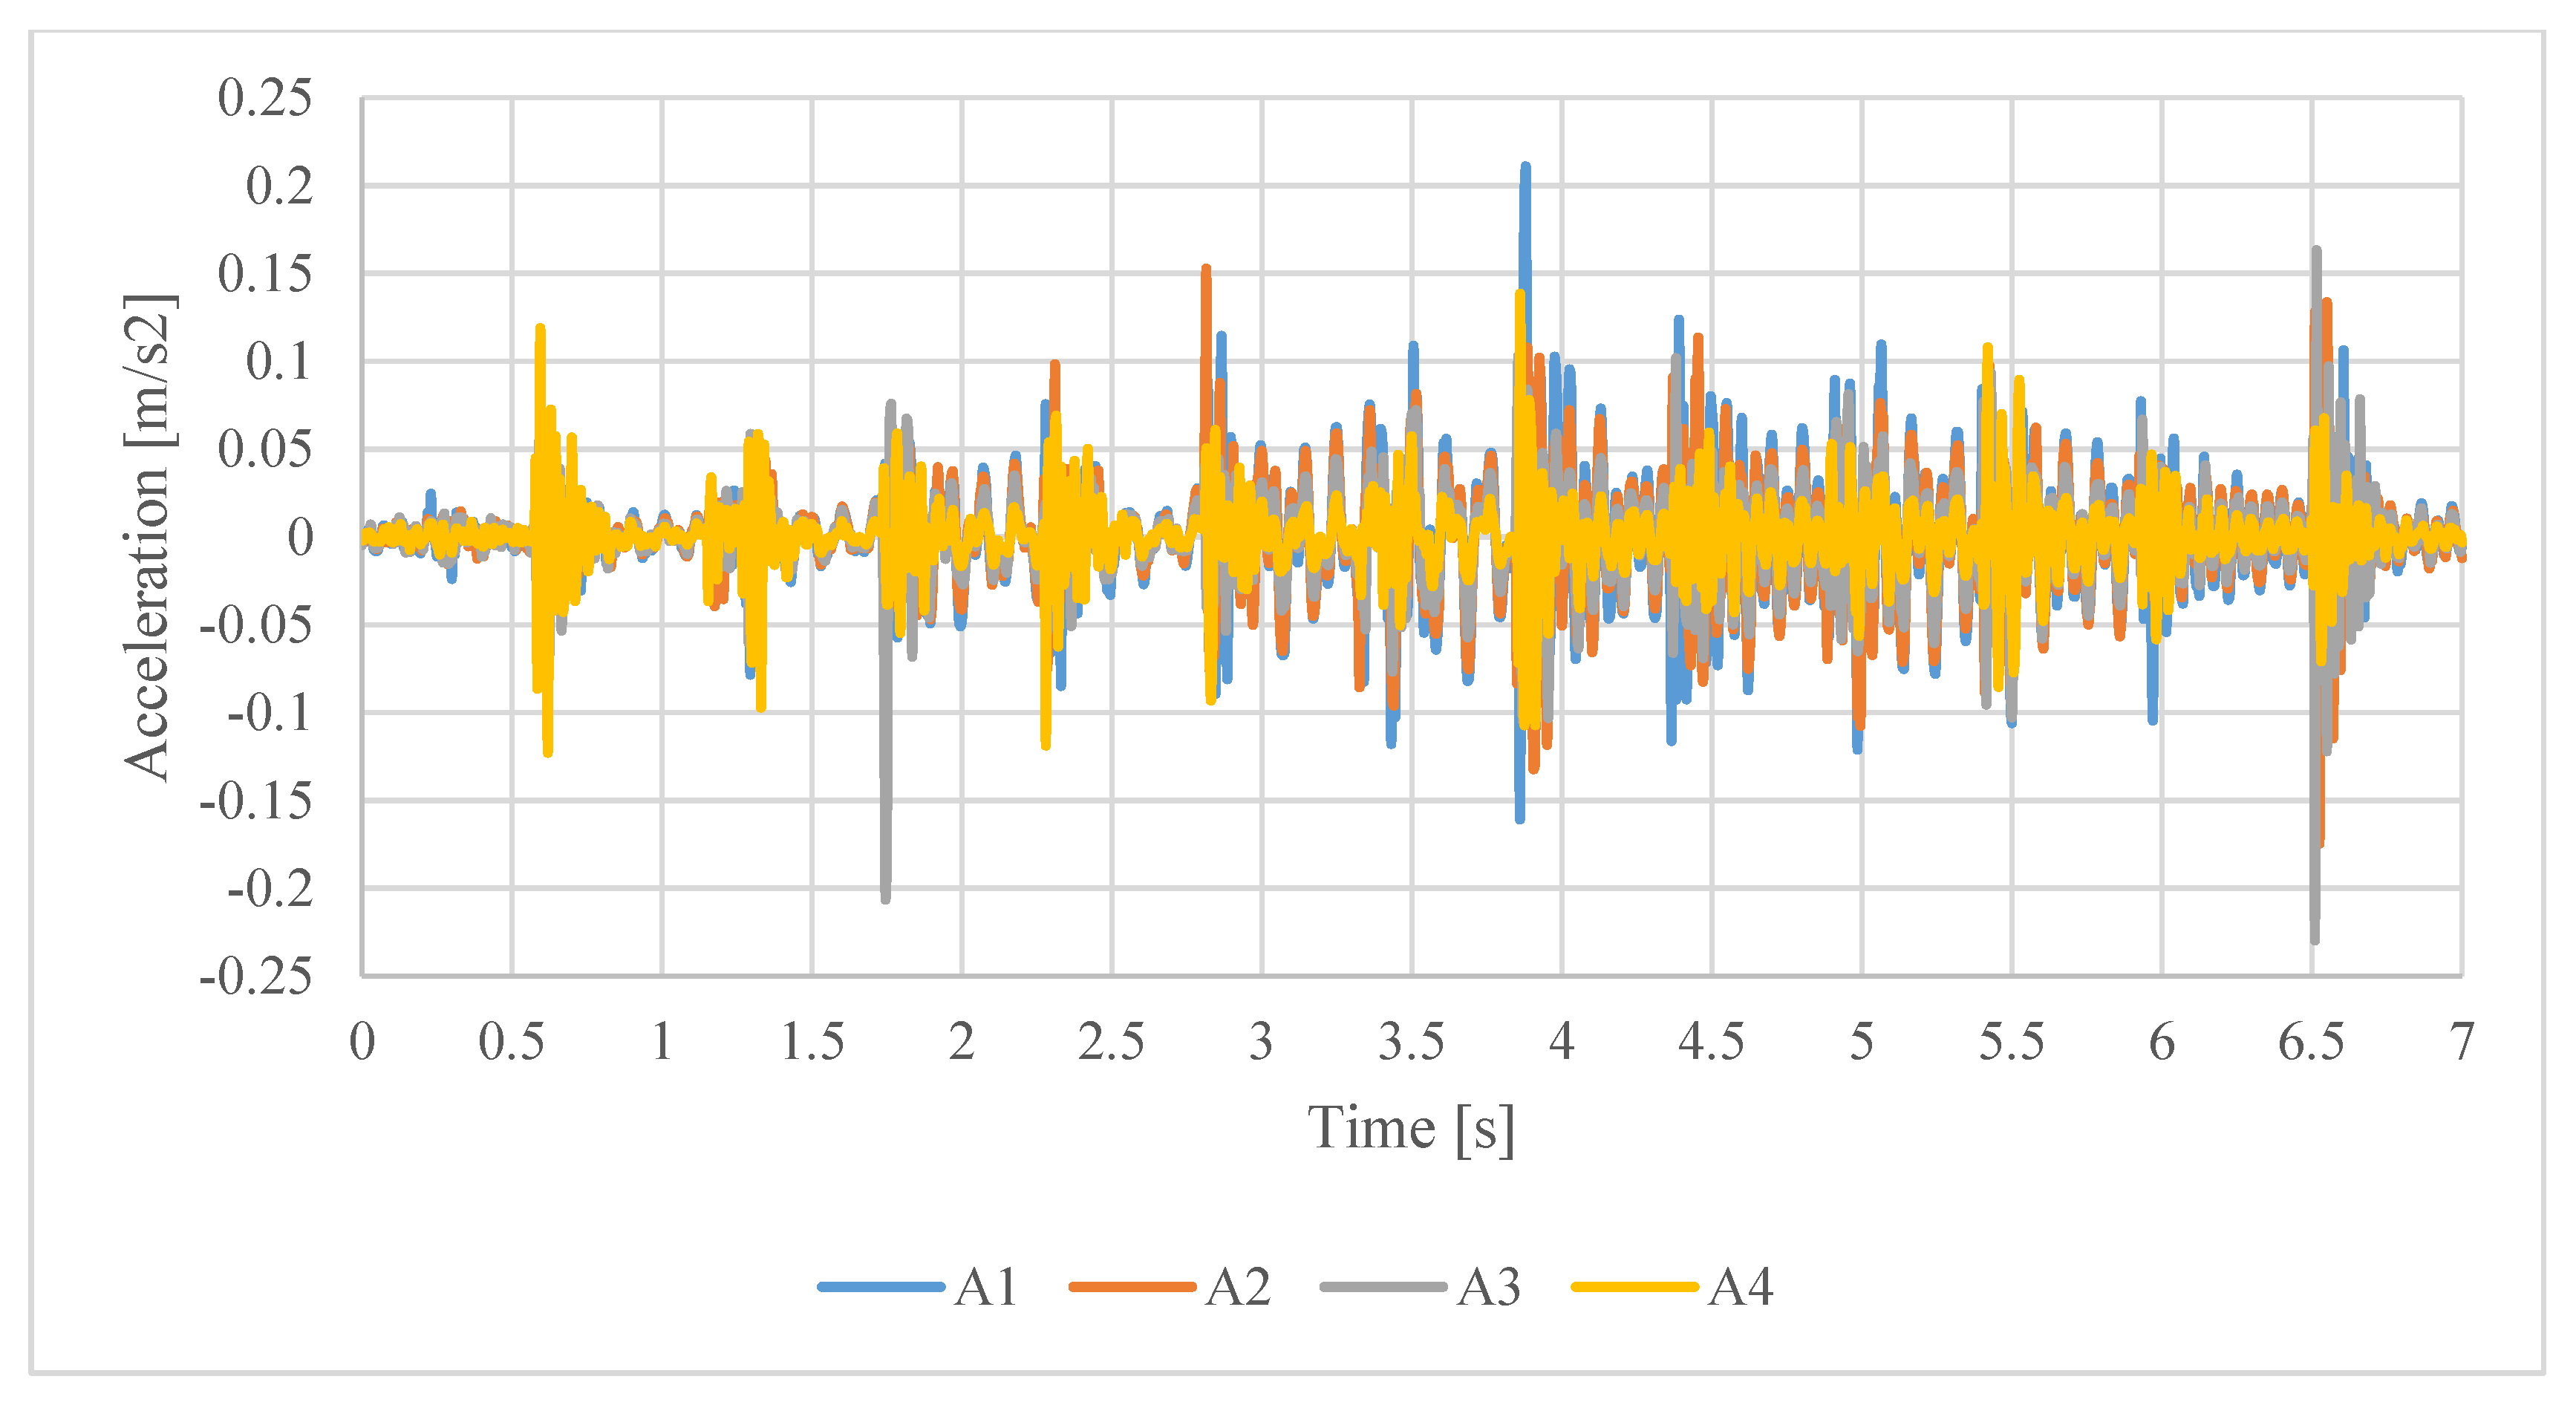
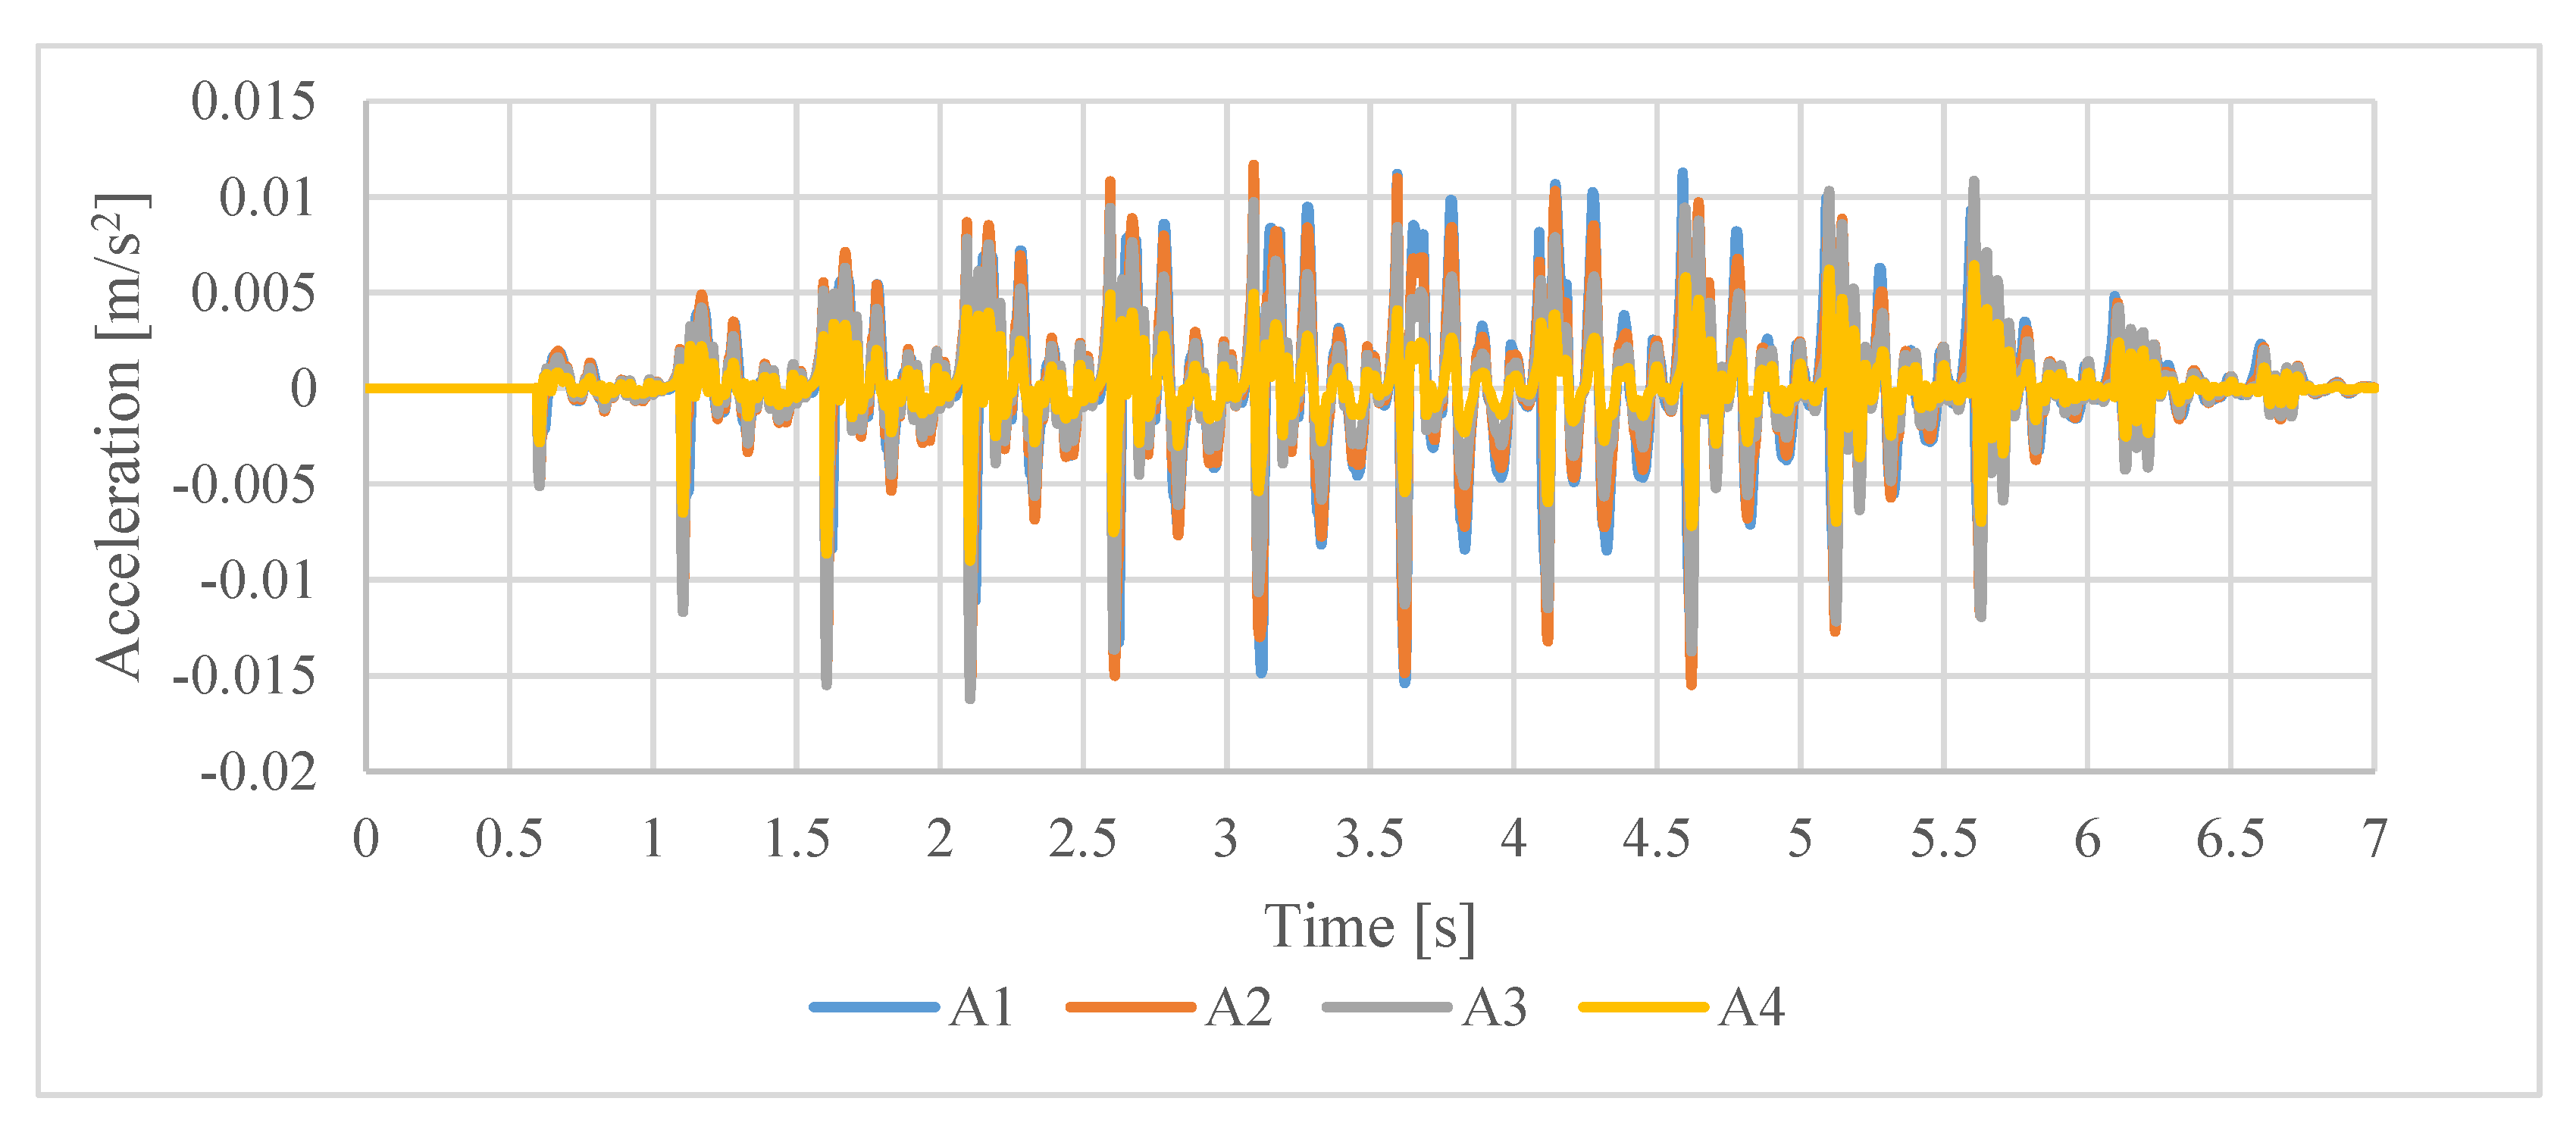
Figure 10 and
Figure 11 depict the time history of the vertical component of the acceleration recorded, respectively, during Test 3 and Test 4 at stations from A1 to A4 with the baseline accelerometers. The transition situation from LFF to HFF of the floor system under study can be clearly seen in these figures, which depict traces more resembling the one in
Figure 1b, rather than
Figure 1a. A detailed analysis of the recorded values will be postponed until after the presentation of the numerical simulations of these two tests and of the structural model.
A validated structural model is essential should a mitigation of excessive vibrations would be required. In such a case a numerical model of the floor would be needed, along with an appropriate description of the loading. A representative numerical model of the floor system was developed using a well-known finite element (FE) software (Midas Gen). The nominal dimensions and material properties are read from the design drawings of the prototype structure.
Figure 12 reports a view of the developed numerical model.
The dynamic properties of the numerical model strongly depend on the boundary conditions. For the purposes of checking the structural safety of the structure, the ground floor would be considered as an assembly of girders, simply supported at the ends. However, for a vibration analysis under human induced vibrations, considering the boundary conditions as simple supports may lead to an insufficiently rigid structure. The small displacements at the restraints are in this case not sufficient to overcome the static adhesion between the girders and its supports. For this reason, the deck girders are assumed at each end as fully restrained at the nodal position shown in
Figure 13. With this assumption of the boundary conditions the frequencies associated to the first mode shapes reported in
Table 4 were obtained from a modal analysis. In
Table 4, the modal frequencies identified from the heel drop tests are reported as a validation.
The strategies used for the numerical reproduction of the continuous walking tests. Test 3 and Test 4 of
Table 3, change according to the loading model used. These models are:
- -
L1: Discontinuous forcing load (Baumann and Bachmann step loading [
37]).
- -
L2: Continuous periodic forcing load (Ammann and Bachmann trigonometric representation [
43]).
- -
L3: Continuous forcing load derived from measurements by a smartphone device located at the LB of the waking person.
The response parameters used in the comparison with the experimental measurements are the positive and negative peak values of the vertical acceleration and the root mean square (RMS) value of the same, calculated on a reference time window. This statistic is commonly adopted in codes and guidelines to assess if a vibration level is perceptible to humans.
Model L1 and L2 are adopted since they have become well accepted, and are included into several FE analysis codes. Model L3, which is at the base of this work, is innovative for this type of structure.
In model L1 the load is due to a series of independent consecutive steps. The loading consists in the GRFs depicted in
Figure 14. These were computed inside the Midas Gen FE code on the base of the weight of the person walking and on its pace frequency
fp. The GRF computed for the test was then applied at a set of discrete positions along the path by shifting it in time. The procedure to define the application points of the GRFs is the same for Test 3 and Test 4. First, the peaks corresponding to the impulses generated by the steps of the pedestrian were identified in the recorded time history, and the average pace frequency
fp for the test was calculated. Then, the number of steps performed to cover the length of the instrumented girder was established. Finally, from the length of the girder and the number of steps, the average length of each step was estimated, and the position of each footfall determined. Positions similar to those marked by the arrows in
Figure 15a results from the procedure. The parameters related to the two tests analyzed are reported in
Table 5.
The loading models L2 and L3 are more approximate in this respect, since assume that the pedestrian is continuously walking on the same spot. The load, which varies in time, is applied at a single position in space, as marked by the arrow in
Figure 15b.
Loading L2 is computed as per Equation (1), with
,
,
, and
G and
fp are as previously reported in
Table 5 for model L1.
Loading L3 is computed as per Equation (3), with
mp =
G/g and
G as previously reported for model L1. In this loading
aM(
t) is not the true vertical acceleration but the vertical, with respect to the smartphone orientation, acceleration recoded on the lower back (position LB in
Figure 2) of the walking person with the smartphone. The nominal sampling rate was 200 Hz. The corresponding GRFs are depicted in
Figure 16 for both tests Test 3 and Test 4.
Table 6 reports the experimental values of the peak vertical acceleration measured on the structure with the reference accelerometers during Test 3 and Test 4. In the same table also the RMS value is reported. These values would set the floor in between what acceptable for office buildings and for workshops.
Figure 17 and
Figure 18 and
Table 7 report the numerically predicted vertical accelerations of the floor system at locations A1 to A4 for load model L1. From the qualitative point of view, the acceleration trend follows the experimental one. However, from a quantitative point of view (compare
Table 6 and
Table 7), the model is not adequate to represent the walking tests. It significantly underestimates both peak acceleration and RMS values of the actual vibration response. The latter differs from the numerical response by about an order of magnitude.
Table 8 reports the vertical accelerations of the floor system for load model L2. In this case, the forcing load was applied at the midspan of the girder. Being also the point with the maximum recorded acceleration response (see
Figure 10 and
Figure 11 for response at A1), one could expect a greater response from the numerical model than that actually measured. However, as in the case of load model L1, the accelerations are far lower than measured, both in terms of extreme values (maximum and minimum peaks) and in terms of RMS value. Furthermore, they are even less than those obtained with loading model L1.
Finally,
Figure 19 and
Figure 20 and
Table 9 depict the vertical accelerations of the floor system for loading model L3. From a qualitative point of view, it can be observed that the overall trend of the response is closer to the measured than in case of models L1 and L2. From a quantitative point of view (see
Table 6), it can be observed that the values of the acceleration at the positive and negative peaks and RMS value are, among the considered loading models, the one most in agreement with the measured results. The error depends on the person walking and on the station. For station A1, which is the one of most interest since it has the largest vibration amplitude, the numerical simulation underestimates the experimental response of about 30%, on average.
9. Conclusions
This paper studies performance of accelerometers integrated in state-of-the-art smartphones in vibration serviceability assessment of a slender prefabricated prestressed concrete slab. The focus of this work is on investigating the capacity of using smartphones as sensors to carry out modal testing of the structure, extract meaningful modal parameters useful for validating numerical models, and estimate pedestrian loading.
The advantage of smartphones over traditionally used accelerometers designed for vibration testing of civil structure is that they are readily available, require no cabling, contain data storage and allow easy data transfer to a personal computer for further data post processing. All these make vibration survey cheap from both time and cost perspective.
Although they still cannot reach the accuracy and precision of specialized accelerometers, the results presented in this study show sufficient level of reliability.
Analysis and comparison of experimental recordings performed with two smartphones with baseline professional accelerometers yielded the following specific findings:
The accuracy of smartphone accelerometers largely depends on the specific smartphone model, particularly with respect to jitter of the sampling interval.
The accuracy of the measurements is satisfactory for preliminary modal testing of a structure, at the very least.
Accelerations measured with a smartphone located at the lower back of a walking pedestrian can be used reliably to indirectly measure pedestrian walking loads.
Using a smartphone might not be the best solution, but it is good enough to identify the problem of excessive vibrations and can assist in preliminary vibration serviceability assessment, at the very least.


