Abstract
The integration of new technologies in Industry 4.0 has modernised agriculture, fostering the concept of smart agriculture (Agriculture 4.0). Higher education institutions are incorporating digital technologies into agricultural curricula, equipping students in agriculture, agronomy, and engineering with essential skills. The implementation of targeted STEM activities has the potential to enhance the teaching of Agriculture 4.0 through the utilisation of practical applications that stimulate student interest, thereby facilitating more accessible and effective teaching. In this context, this study presents a system comprising retrofitted real-scale components that facilitate the understanding of digital technologies and automations in agriculture. The specific system utilises a typical centrifugal electric pump and a water tank and adds logic to it, so that its flow follows various user-defined setpoints, given and monitored via a smartphone application, despite the in-purpose disturbances invoked via intermediating valves. This setup aims for students to gain familiarity with concepts such as closed-loop systems and PID controllers. Going further, fertile ground is provided for experimentation on the efficiency of the PID controller via testing different algorithmic variants incorporating non-linear methods as well. Feedback collected from the participating students via a corresponding survey highlights the importance of integrating similar hands-on interdisciplinary activities into university curricula to foster engineering education.
1. Introduction
The rapid growth of the global population is generating an increasing demand for food and, thus, for natural resources. It is imperative that the agricultural sector becomes more productive and operates with a reduced environmental impact, exploiting the wide range of emerging technologies of the fourth industrial revolution, or Industry 4.0. The utilisation of these technologies facilitates the transition from conventional to smart agriculture, otherwise known as Agriculture 4.0 [1], which aims to enhance production, guarantee efficient resource management, adapt to the climate crisis, and reduce food and energy losses [2,3,4,5,6,7]. The successful adoption of smart agriculture hinges on the availability of skilled people to design smart solutions, install them, and train end-users to utilise and maintain them. Consequently, all stakeholders in the agricultural sector, including students, educators, farmers, and their advisors, must possess the required knowledge to comprehend and utilise the technological advancements that have emerged in the field. In order to achieve this, the curricula and teaching methods in universities should be transformed and modernised, fostering a new generation of farmers, agronomists/consultants, and engineers.
Experiences in the last decade have indicated that, by engaging in STEM (Science, Technology, Engineering, and Mathematics) activities, students become more effectively acquainted with technologies of key importance (like automation, networking, and robotics) and drastically improve their capacity for collaboration. The use of small and affordable systems is becoming increasingly popular in STEM educational settings and, unsurprisingly, a plethora of innovative solutions are readily available to facilitate laboratory-based activities, typically involving microcontrollers and accompanying components, which are widely available and of relatively low cost [8]. These systems are often employed through project-based learning (PBL) approaches [9], particularly at the primary and secondary education levels [10,11]. However, their integration into university curricula is still relatively limited [12], despite the potential benefits they could offer [13,14].
Concerning university-level education in the field of smart agriculture, more emphasis is frequently put on the utilisation of information and communication technologies (ICTs) for general purposes rather than on their application in agricultural contexts [15]. In parallel, the adaptation of STEM applications in this area is heavily based on the incorporation of miniature electromechanical components that are more closely aligned with the context of a secondary-level school laboratory. Consequently, this may often result in comparatively poor learning experiences for university students [16]. Indeed, as students’ expertise in their specialty increases, their expectations for a more sophisticated and realistic STEM application paradigm are also evolving. It is, therefore, essential to develop projects that utilise full-scale systems and scenarios, reflecting real-world challenges and applications [16,17]. This practice can also assist in bridging the gap between university approaches and commercial/industrial demands [16]. In most cases, however, such projects typically require the use of expensive equipment. To reduce the corresponding financial burden of developing an application, it is imperative to carefully select the accompanying tools and subsystems, often reusing and upgrading pre-existing equipment and planning the educational setup so that it minimises potential component damage due to inappropriate handling by students.
Furthermore, the teaching of technology at the university level tends to prioritise demonstrating the necessity of technological principles over their communication/teaching through effective pedagogical methods [18]. On the other hand, it has been shown that students prefer pedagogical approaches that emphasise learning by doing, as they foster critical thinking, innovation, and creativity skills [15,19]. In addition, another challenge that must be addressed in the field of education in precision agriculture is the necessity for students and teachers to possess interdisciplinary knowledge. Due to the multiperspective nature of smart agriculture (which encompasses many different disciplines, such as agriculture/agronomy, engineering, automation, mathematics, programming, networks, and more [18]), the practical applications in which students are involved should facilitate the acquisition and integration of knowledge covering a wide range of diverse subject areas.
The proposed work, seeking to address the abovementioned challenges, has a twofold objective, as follows: firstly, to demonstrate the design and implementation of a low-cost, real-scale control system using accessible digital technologies (sensors, actuators, controllers, mobile interfaces, and pairing software); and secondly, to evaluate its effectiveness as an educational tool for familiarising students in agricultural engineering with the key principles of automation, closed-loop control, and interdisciplinary system integration. In this context, the technical content supports the pedagogical goal, offering a reference for educators and learners who seek both theoretical understanding and practical insight. Willing to involve students in practical activities and acquaint them with full-scale systems applicable in real-world scenarios, the proposed experimental system employs interaction and optimisation methods for the fluent operation of a centrifugal alternating current (AC) pump which is connected with a water tank through a system of pipes and valves. In particular, the incorporation of a set of sensors and actuators, coupled with a central computing unit equipped with built-in Wi-Fi, endows the pump with smart functionality, enabling remote operation via a network. In this regard, a Proportional–Integral–Derivative (PID) controller is incorporated into the overall system to facilitate precise regulation of the pump output flow. The PID controller’s operation is further optimised through the incorporation of non-linear methods, exploiting the ease of testing different algorithmic variants by the underlying firmware being selected.
Apart from this introduction, Section 2 provides the motives behind the speed regulation applied in the AC water pump, as well as a general description of the smart pump functionality. Section 3, aiming to provide guidance for the development of similar multiperspective systems, highlights various implementation steps, challenges, and design details. Section 4 is devoted to an evaluation of the results of the proposed system, both from a technical and educational point of view, while Section 5 and Section 6 address the findings of the system and present a summary of the conclusions.
2. Motives and General Description
2.1. Rationale and Methods for Variable Pump Operation
The agricultural sector relies heavily on pumps for irrigation systems in conventional and alternative methods of cultivation, such as hydroponics, aquaculture, and symbiotic crops [20], which have seen significant growth in recent years. Due to the requirement for large amounts of water in agricultural installations, paired with the need to preserve water resources, efficient usage is of paramount importance. Agricultural pumps have diverse applications, including at fixed locations and for use in autonomous robotic spraying systems [21]. Pump systems often have to contend with disturbances caused by sludge, membranes, and filters, which affect fluid flow. As sediment narrows pipes or nozzles during spraying or irrigation, flow disruptions occur. This leads to an increased pressure that exceeds the desired operational limits of the pumps. Moreover, under standard conditions, the water supply may be compromised due to damaged, bent pipes (e.g., caused by tractors or animals), wells containing meagre water volumes, or inadequate power supply to the pumps.
Maintaining uninterrupted water pump operation can be challenging, and addressing any potential malfunctions should be a top priority [17]. Consequently, an automatic control system was designed to ensure a constant flow of water from an electrical centrifugal pump to the piping system. The efficient regulation of pump flow is essential for achieving energy efficiency and effective water management in critical sectors such as agriculture, which is responsible for the highest consumption of fresh water on the planet.
The speed control of pumps provides a beneficial alternative to traditional methods of managing flow rates, such as the throttle control method (a limitation valve in series with the pump outlet) and the bypass control method (a limitation valve in parallel). The primary advantage of implementing speed control in pumps is the subsequent decrease in energy consumption, as the pumps exclusively employ the energy necessary for fulfilling a specific pumping task [22]. This ensures that the pumps are not permanently operating at their maximum capacity. Additionally, the speed control method prolongs their life and contributes to the long-term cost-effectiveness of systems. Speed-regulated pumps can also minimise the need for start-up components and control valves in the system, thus further reducing the overall cost of the system. Therefore, by using the variable speed method in pump systems, it is feasible to decrease the total energy consumption by up to 50% when compared to fixed-speed pumps [23]. Furthermore, this provides less electromechanical stress, as speed regulation contributes to automatic pressure control, smooth pump starting, and less operating noise.
In summary, the reasoning for studying and improving variable speed control includes and is not limited to variable generic motor speed operation, variable pump operation, aquaponics, desalination, variable spraying techniques, malfunction avoidance, and energy waste prevention. The critical regulation of the rotational speed of pumps and AC motors is accomplished through specialised devices or control systems that vary according to the motor type. Common approaches to controlling the rotational speed of AC motors are as follows:
- Voltage Control: Modifying the voltage given to a motor can influence its rotational speed. This method has a limited effectiveness in most AC motors, as it only allows control over a small range of voltage values. In particular, voltage sags are more likely to be seen as a disturbance to the operation of the motor rather than a deliberate control technique.
- Phase Control: The phase control technique is based on changing the phase of the voltage supplied to the motor, thus affecting its rotation speed. Semiconductor switches like Silicon Controlled Rectifiers (SCRs) allow for controlling the phase of AC voltage. During the sinusoidal waveform of the current, the SCR opens, allowing current to pass for only part of the waveform. This results in a decrease in the applied voltage to the motor, which, in turn, limits the supplied power and reduces the rotational speed of the motor.
- Conversion of Operating Frequency: A frequency converter (inverter) assumes control over the rotational speed of AC motors by adjusting the supplied voltage frequency. Frequency converters provide higher levels of accuracy and flexibility in speed regulation, frequently utilised in industrial applications [24]. This technique is often referred as Variable Frequency Drive.
2.2. Description of the Experimental Centrifugal Pump System
The construction described in [17], which was used to develop a fault detection system for agricultural equipment, is also utilised and upgraded to support the automatic control mechanism of this application and demonstrate its capabilities. Briefly, this experimental setup includes a single-phase AC induction motor centrifugal pump, a 50 L tank, ¾ inch diameter plastic pipes for linking the tank and the pump, and three valves to reduce the cross-section of the pipes. The tank is responsible for both supplying water to the pump and collecting water from its outlet. In this way, the water in the system is recycled and no external supply is required. Flow limitation valves are strategically placed along the pipes to emulate exogenous disturbances during the pump’s operation, with the first one specifically narrowing the pump suction pipe, thus making it difficult to let in water. The second valve opens to let air penetrate into the pump’s suction part, while the third valve closes to narrow its outlet discharge.
Before the integration of the automatic control system, the centrifugal pump had only the following two operating modes: closed and fully open. The incorporation of the automation system optimises the operation of the pump, as intermediate pump operating states are achieved, proving various flow rates between zero and the maximum viable limit. This prevents the system from overload and from unnecessary energy consumption. Additionally, in order to limit disturbances that can deviate the pump output from the desired level, the incorporated automatic control system also includes a mechanism to maintain the pump’s output flow rate at user-defined levels. This is achieved by adjusting the pump rotation speed appropriately, depending on the error between the actual and desired flow. The user can set the desired pump output flow rate via the developed Android phone application and can also remotely monitor the system operation.
As a standard automatic control system with a feedback loop, the pump optimisation system consists of a control unit, sensors, and actuators. The system’s primary control unit, namely an ESP8266 microcontroller, can track the water’s flow setpoints, as established by a remote operator’s mobile device. The unit also regulates the pump’s rotation speed, based on the setpoint values and the actual measured pump output flow. The microcontroller board used is selected for its cost-effectiveness, its ease of use, and its integrated Wi-Fi module functionality.
This feature enables wireless data and information exchange with other local devices via TCP/IP sockets (preferably UDP ones for simplicity purposes), with the main components (i.e., the microcontroller and the smart phone of the user) interconnected via a typical Wi-Fi Access Point. Figure 1 provides a design overview of the components comprising the smart water pump system. Similarly, Figure 2 depicts the corresponding structure and its integrated automatic control circuit components.

Figure 1.
Overview of the main components used to develop the smart water pump system.
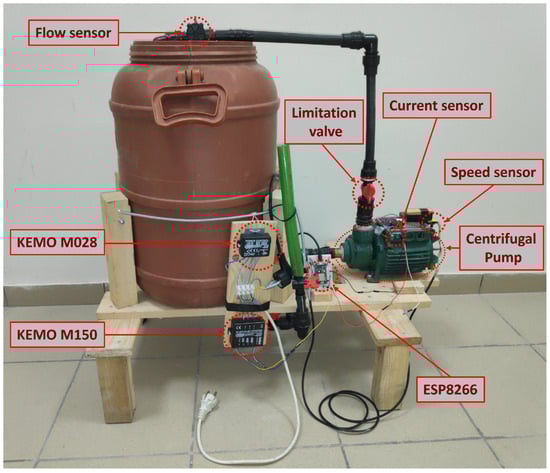
Figure 2.
The structure supporting the educational automatic control system of the pump.
To determine the precise flow rate of the pump, the system includes an inexpensive yet reliable water flow sensor. The system also includes another circuitry defining the KEMO M028 [25] and KEMO M150 [26] accessories, responsible for regulating the pump speed. In fact, the function of this circuitry is similar to that of an AC motor driver, as it acts as a speed converter for the pump. It translates a pulse-width modulation (PWM) signal into a suitably modified sinusoidal waveform output feeding the motor (phase control process) [23], thus altering the speed of the water pump. In this manner, automatic control of the pump operation is attained.
2.3. Educational Objectives
The whole approach highlights the way that well-known technologies can be used to form an educational paradigm facilitating the understanding of key scientific areas at a university level, especially with students (and potential readers) that do not have a satisfactory (electric/electronic) engineering background, bridging the gap between small-sized educational constructions and real-sized systems. Providing both technical and educational setup details is a preferable and mutually beneficial option for participants. The experiments conducted have, on purpose, a very clear and detailed technological description so they can be easily reproduced by other researchers/educators. The overall approach can be seen as a useful source of inspiration and a paradigm for educators willing to keep pace with recent technological achievements, to proceed beyond the narrow limits of their specialty, and to better prepare their students for future job transformation necessities.
Given the importance of new technologies for the rational use of natural resources, from educational perspective, tackling irrigation challenges and becoming familiar with variable electric motor pump operation are good motives for students to improve the technical skills of their specialty, working for the common good. In educational projects, applying modern optimisation solutions to realistic scenarios, like the proposed smart water pump system case, is expected to facilitate the understanding of automatic control principles [27] and serve as a valuable tool for communication and networking skill acquisition, for problem-solving potential, for the integration of knowledge from diverse scientific domains, and for examining the dynamic interplay between different disciplines and systems.
In this context, the aforementioned smart pump system is designed to provide a more effective training ground for agricultural engineers in the field of automatic control, through the active involvement of students in its development and optimisation. Specifically, the principal objectives of the proposed approach, in regard to the acquisition of technical competencies, are to gain a deeper comprehension of the fundamental principles of automatic control, to develop a more nuanced understanding of the principles of network communication, to enhance proficiency in the assembly of electronic hardware, to refine expertise in the programming of embedded systems and smart devices, and to gain a more comprehensive grasp of the principles governing sensors and actuators.
Additionally, in order to more effectively evaluate the educational outcomes of the students’ training, the acquisition of soft skills is also identified as a key priority to monitor within this approach. These skills include the improvement of participants’ confidence in their ability to complete a project in accordance with the specified requirements and within the specified timeframe and the reinforcement of participants’ potential for communication and teamwork. The improvement of participants’ capacity to overcome occasional implementation difficulties and face them as valuable learning opportunities and the facilitation of their ability to effectively document and present their achievements are also given special attention. It can, thus, be concluded that the potential benefits for the participants are expected to be numerous and multiperspective.
Both undergraduate and postgraduate students of agricultural engineering were involved in the creation and evaluation of the smart water pump system being presented. Referring to the postgraduate students, they were mainly people following the master’s degree program entitled “Digital Technologies and Smart Infrastructure in Agriculture”, which is offered by the Dept. of Natural Resources Management and Agricultural Engineering at the Agricultural University of Athens (AUA) in Greece. The educational practices being applied on the abovementioned postgraduate program are closely related to the ongoing European Union (EU) digital skills project named “Digital agriculture for sustainable development”, with the acronym AGRITECH EU (grant agreement number: 101123258). Participating student opinions about the impact of the proposed system in the educational process were voluntarily collected and processed via a corresponding survey incorporating properly structured questions of closed form.
3. Implementation Details
3.1. Sensing Mechanism
The first step for properly adjusting the actual flow rate of the pump according to the desired (target) flow is the establishment of a sensing mechanism to provide data on the actual flow variable. For this reason, a water flow sensor was installed in the output of the pump after the third limitation valve, as depicted in Figure 1 and Figure 2, thus measuring the actual outlet flow. This sensor, using the Hall phenomenon [28], produced a digital signal at every rotation of its internal impeller, generating a pulse of 3.3 V. Based on the manufacturer’s instructions, 450 rotations correspond to one litre of water. However, the relation between flow and generated pulses was not absolutely linear and sensor calibration was required. The system’s microcontroller counted the digital signals (pulses) generated over a fixed time interval via its interrupt capturing module, thus allowing for the calculation of the water flow rate passing through the pump. To accurately capture the behaviour of the system, additional sensors were fitted to it.
More specifically, a speed sensor module, consisting of an infrared photo-interrupter, was externally attached to the axis of the pump to measure the impeller’s rotational speed. The method used for reading the measurements/pulses of the photo-interrupter was similar to that of the flow sensor, whereby each rotation of the pump axis (impeller) interrupted the IR beam of the sensor, generating a pulse. The microcontroller calculated the rotational speed of the pump in revolutions per minute (RPM) by measuring the number of pulses generated by the speed sensor during a given interval. In practice, both of the system’s sensors worked in the same way and were based on counting pulses over a period of time, as shown in the flowchart in Figure 3.
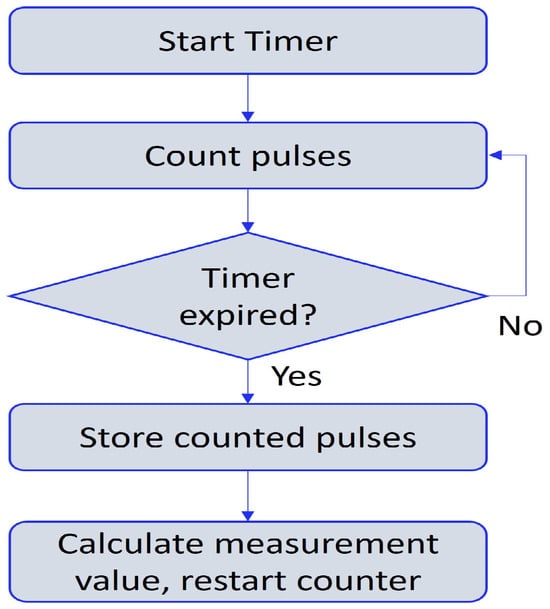
Figure 3.
The basic principle of the pulse-generating sensor.
Additionally, a Hall Effect Current Sensor [29] was utilised to measure the electric current consumed by the pump. This sensor produced an analogue signal that was proportional to the amperes passing through the motor to which it was connected. The sensor was connected in series with the motor of the pump, specifically to the phase wire of the AC power supply. The sensor used the ACS712ELCTR-05B-T Current Sensor Module, which required a supply voltage of 5 V and produced an analogue signal of 2.5 V for zero energy consumption. The output of the current sensor increased by 0.185 V for each ampere passed through it to the one direction (and decreased by 0.185 V for each ampere to the opposite direction) [30].
To accurately read the current sensor measurements with the ESP8266, which operates and accepts signals in the range between 0 V and 3.3 V scale, it was mandatory to first reduce the analogue signals to this range via a voltage divider. It is also important to note that the analogue output of the current sensor measured the instantaneous current, and to calculate the Root Mean Square (RMS) intensity, a large number of measurements had to be collected and their mean values had to be calculated, tasks that were fluently covered by the processing capabilities of the ESP8266 unit. This method is generic enough to cover from pure sinusoid power signals to heavily modified ones, i.e., coming out of the motor driver module.
3.2. Acting Mechanism
The main control unit of the system modified the operation of the actuators based on the sensor’s data to achieve the system’s desired state. The actuator, in this scenario, was the pump, with its operation altered via the KEMOs component circuitry. The circuitry consisted of KEMO M150 and KEMO M028, which were connected in series. The ESP8266 unit compared the current water flow values with the reference/target value and generated a digital PWM signal. This signal was received by the KEMO M150, which converted it into an analogue signal. The KEMO M028 regulated the phase of the pump supply voltage based on the value of this analogue signal. As a result of the regulation, the speed of the motor varied accordingly. Figure 4 below illustrates the intricate connections between the components of the circuit used to optimise pump’s flow rate and monitor its operation. The circuit was partially designed using version 0.9.3 beta of the open-source software Fritzing [31]. Taking into consideration that the participating students had a limited (electrical/electronic) engineering background (i.e., as they were from agricultural science origins), the choice to use Fritzing was due to it being the simplest and most user friendly software. Indeed, its ease of use makes it an excellent choice for the teaching practices, as students can generate and test circuits in a way that is fast, safe, interactive, and easy to reproduce.
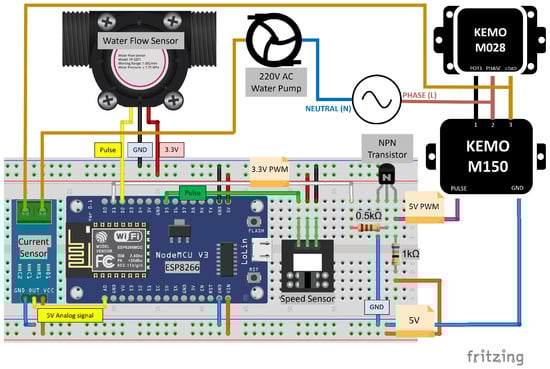
Figure 4.
Circuit diagram of the smart water pump control system.
3.3. Algorithmic Behaviour Details
3.3.1. Basic PID Functionality
The PID controller is one of the most frequently employed control techniques in industrial processes, largely due to its straightforward design and implementation [32,33,34,35]. It is simple to operate, and with a basic understanding of control engineering, any user can set it up successfully [33]. A PID controller is a type of controller employed in automation systems for the regulation and calibration of diverse parameters, including temperature, speed, pressure, and flow. Essentially, the controller considers the discrepancy between the actual and desired values of the parameter in order to ascertain the optimal response and maintain the controlled parameter at a value as close as possible to the desired one.
As illustrated in Figure 5, the fundamental principles of PID control were implemented in the firmware logic of the microcontroller unit (ESP8266) within the smart water pump system. The controller continuously calculated the error signal, e(t), as the difference between r(t) and y(t), where r(t) is the desired flow (setpoint) and y(t) is the actual or measured process variable (real flow). The PID controller processed this error using the proportional (P), integral (I), and derivative (D) components of the PID module, to produce the control variable u(t) for the main system. This control signal u(t), typically implemented via an analogue signal or a PWM, was sent to the physical system (KEMO circuitry and pump). The dynamic behaviour of the basic system can be described either by a differential equation in the time domain, or, more commonly in control theory, by a transfer function in the Laplace domain, as follows:
where G(s) is the system’s transfer function, representing the internal dynamics of the pump and KEMO circuit, and Y(s), U(s) are the Laplace transforms of y(t), u(t) respectively. Feedback from the output y(t) is used to continuously update the control action, ensuring that the output matches the desired setpoint as closely as possible.
Y(s) = G(s)⋅U(s)

Figure 5.
An overview of the operation of the PID controller modifying the operation of the smart pump and stabilising its flow.
In the context of the smart water pump system, the simplified PID mechanism took into account the target flow (setpoint) and the actual flow at the outlet pipe, enabling the adjustment of the pump’s rotational speed through the phase regulation process. An increase in rotational speed resulted in an increase in water flow, and vice versa. In order to regulate the phase, the microcontroller provided pulses (PWM) as output, which were then converted to phase (sinusoidal waveform) modifications, in accordance with the KEMO circuitry, as previously stated. The pulses, having a duty cycle pattern adjusted by the digital output of the microcontroller, were used to form the u(t) signal (i.e., the input to the primary system), as defined by the aforementioned terminology.
3.3.2. Algorithm Behaviour of Smart Pump System
The ESP8266 microcontroller was programmed using the Arduino IDE software, version 1.8.16. This software provides various tools for monitoring a microcontroller’s operation. ESP8266 received the target flow value and produced a PWM signal through one of its analogue pins. The PWM signal value increased with an increase in the target flow value. To maintain the pump output flow at the desired level, the PID controller library [36] integrated into the microcontroller compensated for any disruptions that may have occurred. The PID library is notable for its ability to facilitate satisfactory tuning adjustments, including the definition of the proportional, integral, and derivative gain behaviour (denoted by kP, kI, and kD, respectively), as well as the specification of output limits and the direction (increasing or decreasing) of corrections. The PID control system received feedback from the flow sensor data to determine any deviation between the actual and desired flow. Subsequently, a numeric output was produced by the PID controller that employed the ESP8266 to adjust the system output value for the PWM signal appropriately. The Arduino PID library is a tool for easily applying PID equations in the software of an embedded device. The controller gains can be adjusted to approximate an optimal behaviour. Through this library, students had the opportunity to test different gain combinations and, thus, to understand the basic principles of the PID controller, omitting in parallel distracting details (which were left for additional experimentation, using the available and simple source code of the PID library). Figure 6 illustrates the transition from a general PID mathematical formula to a specific C/C++ code implementation. It further demonstrates the ease with which the code can be utilised via the basic PID library, thereby exemplifying the transition from theoretical concepts to practical application, omitting destructing details.

Figure 6.
PID controller in the form of a mathematical equation in the time domain, equivalent C/C++ based code and utilisation of the corresponding Arduino library.
The application on the user’s mobile phone allowed for defining target flow values and monitoring the dynamic behaviour of the system. The microcontroller board, aided by the on-board Wi-Fi module, communicated with the mobile phone in the local network using UDP sockets. As also previously explained in Figure 1, the connection was not direct, but through an access point, forming a classic star topology. Data sent by the ESP8266 included the instantaneous current drawn by the pump, the rotational speed of its motor, the PWM signal output value by the microcontroller, and the actual flow value in mL/s. On the other hand, the information transmitted from the mobile device to the ESP8266 included the target flow rate for the pump, the PID controller’s gains, and the status of the PID controller (i.e., whether it would be enabled or disabled). Figure 7 visualises the data exchange between the two devices.
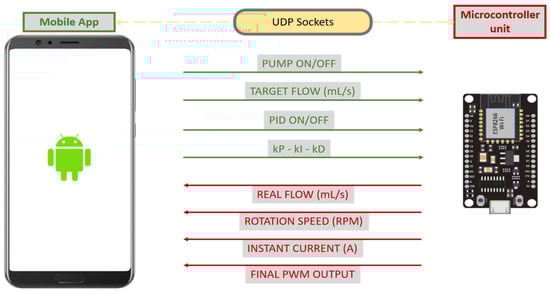
Figure 7.
The information exchanged between the mobile phone and the microcontroller unit through UDP socket communication.
The Android application, which was intended for remote system control, was developed via the MIT App Inventor environment [37] alongside specialised assistive extensions [38]. MIT App Inventor is a block-based Android app development platform and an important educational tool. It provides a user-friendly environment for fast and attractive application development [16]. By taking advantage of it, students can, among others, develop mechanisms for remote interaction with embedded devices via their mobile phones, even without any knowledge of programming languages. The layout of the deployed app for the remote operation and monitoring of the smart water pump system is shown in Figure 8.
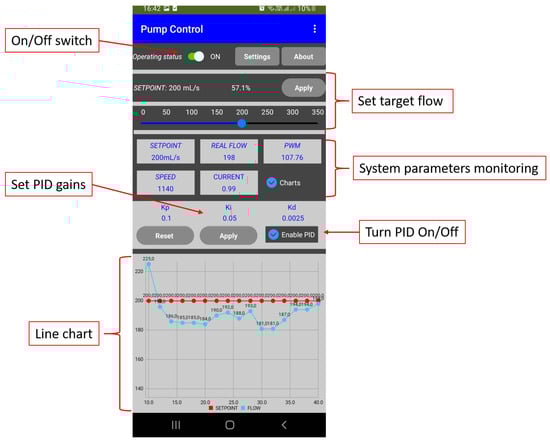
Figure 8.
The design of the app created for operating and monitoring the system remotely.
As there is no mathematic formula directly describing the relation between the PWM values altering the pump speed and the desired flow, as well as several sources of uncertainty, the application of stabilisation automatic control techniques is mandatory. These techniques can provide a better performance, like an even faster response, shorter oscillations, and less integral windup effects [39] by incorporating non-linear improvements.
For instance, the PID controller output can be partially complemented by predefined PWM values generating a specific flow near the target in order to reach each setpoint faster. Predefined PWM values can be a percentage of the PWM value required to achieve the target flow without disturbance restraint and without a PID controller. This percentage is calculated empirically and depends on the system and the desired response properties. Consequently, the microcontroller outputs a PWM value that comprises a predefined value based on the target flow and a dynamic output from the PID controller. The absence of this combination hindered the pace at which the system achieved the intended flow.
Delaying PID controller activation until the pump has reached a specified rotational speed, depending on the current setpoint, is another non-linear PID approach that optimises system operation. In these ways, a faster achievement of the desired flow is ensured both when the system is operating without interruption and in the presence of a disturbance.
Last but not least, another non-linear utilisation of the PID controller that optimises the system response is the “adaptive gains” approach [40]. According to this technique, the controller’s gains (kP, kI, and kD) are adjusted during the system’s response by using softer values as the actual flow value approaches the desired value. This reduces the system’s oscillations and helps to reach the target faster. Section 4.2 provides a detailed explanation of how these three non-linear PID methods were utilised. Figure 9 summarises the algorithmic behaviour of the control policy alternatives implemented using the system microcontroller, in the form of a flowchart.
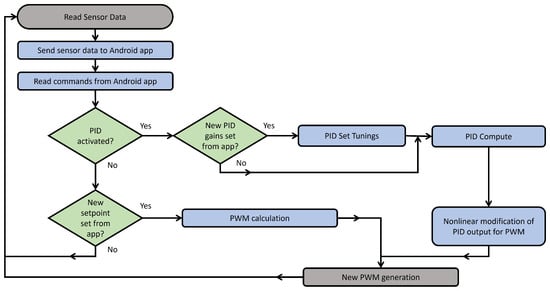
Figure 9.
The algorithmic behaviour of the of the control policy alternatives implemented using the system microcontroller, in the form of flowchart.
3.4. Basic Implementation Challenges
The most significant issue pertains to the use of components from different manufacturers with varying characteristics, which can often result in connectivity and cooperation issues between the individual parts of a system. Students are required to find solutions and address these problems using simple or more complex functional methods. During the development of this educational application, there was initially difficulty in the cooperation between the ESP8266 microcontroller and the KEMO circuitry for the phase control.
The KEMO M150 was receiving 5 V pulses but was unable to interpret the 3.3 V PWM signals from the microcontroller. To solve this issue, an NPN transistor capable of sensing the 1 kHz frequency PWM signals generated by the ESP8266 was used. An external 5 V power source, which can also be powered by the ESP8266 board, was utilised. The transistor acted as an inter-switch, closing and opening the connection between the collector and emitter for each pulse of the microcontroller, providing 5 V pulses to the KEMO M150. The frequent switching between Low and High generated a new 5-V PWM signal. However, this signal had reversed polarity, as supplying voltage to the base of the transistor interrupted the voltage supply to the emitter. Therefore, when programming the ESP8266, it is important to take into account that the PWM 3.3 V and the PWM 5 V are opposite. It is important to note that a logic level shifter module can be used as an alternative. Although it may be more expensive than a transistor, it does not reverse the polarity of the signal.
Figure 10 displays the PWM signals recorded by the oscilloscope. Specifically, Figure 10a illustrates the PWM of 3.3 V before it enters the transistor, while Figure 10b shows the PWM of 5 V that will eventually reach the KEMO M150. A comparison of the two images reveals the opposite polarity of the signals and the different overshoot voltage of each pulse.
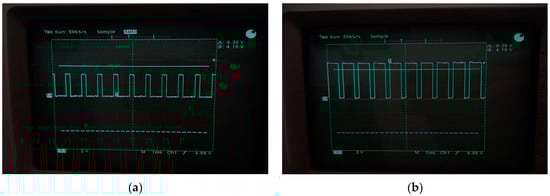
Figure 10.
The PWM signal generated by the microcontroller to control the rotational speed of the pump, as recorded by the oscilloscope (a) before its input to the NPN transistor and (b) after its input to the transistor.
3.5. Cost Issues
The educational application was developed using low-cost, easily accessible, and well-documented components. In this respect, to adjust the speed of the pump, the KEMO M028 and M150 modules were selected, which cost 18 Euros and 16.50 Euros, respectively. As the main control unit, the ESP8266 cost approximately 7 Euros, while the price of the pump’s flow meter cost was around 14 Euros. The current sensor and the speed sensor were available at a cost of 4 Euros and 2.2 Euros, respectively.
It should be noted that the pump, which is the main component of the system, was provided free of charge to the team after the greenhouse in which it was used was dismantled and abandoned. Similarly, the plastic tank and water pipes were obtained at no cost. Thus, the total cost of the equipment was significantly reduced. A pump with similar specifications, suitable for the same purpose, is estimated to cost around 110 Euros. A summary of the main components used in the development of the system and their respective costs is given in Table 1.

Table 1.
Main components and their costs.
4. Experimental Results and Evaluation
4.1. Experiment Setup Details
In order to facilitate the development of the system, its subsequent testing, and its evaluation, the microcontroller was programmed to visualise both the target and actual values for water flow through the Serial Monitor component of the Arduino IDE. The visualisation of additional data, including the rotation speed, the PWM value output by the microcontroller, and the instantaneous current consumed by the pump, was also made possible through the use of the other sensors integrated into the system. Diagrams depicting the behaviour of the system can also be produced, in a user-friendly manner and for educational purposes, using the Serial Plotter of the Arduino IDE or using Microsoft Excel by transferring data from the Serial Monitor. Alternatively, the input source from Excel may be connected to the microcontroller’s serial COM port by utilising the Data Streamer add-in [41]. The students were also able to utilise a smartphone application, which proved to be a highly efficacious tool for both the remote monitoring of the system’s operation and the expedient alteration of the PID controller’s gains. This approach obviated the necessity for the relatively time-consuming process of reprogramming the microcontroller. Moreover, the students had access to classical electronic measurement instruments, such as multimeters and oscilloscopes, which enabled them to monitor the operations of the different subsystems and validate the measurements of the microcontroller.
4.2. Performance of the Water Pump System and Improvements
The utilisation of an oscilloscope enabled an investigation of the impact of the phase control mechanism on the sinusoidal waveform generated by the AC power before its transmission to the electric motor of the pump. Figure 11 illustrates the output signal from the KEMO circuity prior to its entrance into the pump, which exhibits a rotational speed that is either faster or slower, depending on the degree of modification applied to the sinusoidal signal. In Figure 11a, a slight modification to the signal results in a faster rotation, while in Figure 11b, a more intense modification leads to a slower rotation. The figures also illustrate the pump rotation speeds and flow outputs for each case, as depicted in the mobile application.
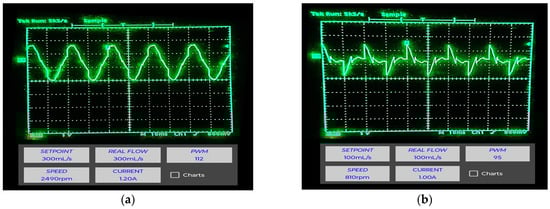
Figure 11.
The sinusoidal waveform of the phase of the AC current, slightly modified (a) and extensively modified (b) by KEMO’s component circuitry.
In the smart water pump system, it was observed that, initially, there was no perfectly linear correlation between the PWM values generated by the microcontroller and the pump output flow. Despite the fact that the digital pin output of the microcontroller produced a pulse with values ranging from 0 to 255 (16-bit), it was found that the pump flow response was only noticeable within the range from approximately 90 to 150 PWM. For PWM values below 90, the pump did not rotate or provided an insufficient flow for water to reach the flow meter and overcome the system’s inertia. PWM values above 150 resulted in the flow reaching its maximum value, which did not change thereafter. Figure 12 diagrammatically depicts the system’s non-linearity and the asymmetric correlation between PWM values and the actual change in the pump flow rate. This was considered in the programming of the microcontroller functions to ensure that its output performed optimally at the pump speeds.
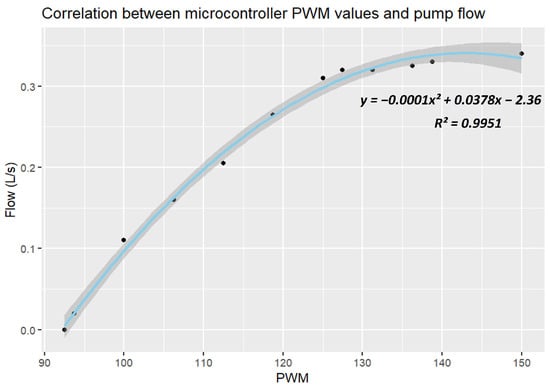
Figure 12.
The correlation between microcontroller output PWM values and the flow at the pump outlet.
Using the equation in Figure 12, a table was created to describe the correlation between PWM values and actual water flow. This table correlates the desired water flow (Setpoint) with the required PWM output of the microcontroller (corresepondingValue) to achieve the target during normal operation. Figure 13 depicts these corresponding values in the Arduino IDE programming environment used to develop the code for the ESP8266 microcontroller. This initial setup of the system was used unaltered to adjust the pump’s rotational speed based on the target flow, when no PID controller was used.
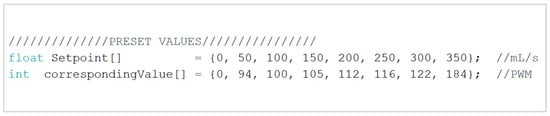
Figure 13.
The correspondence between the desired flow values and the PWM values (correspondingValues), which the microcontroller outputs to achieve each target.
The corresepondingValue is also utilised in cases of non-linear use of the PID controller, where the generated PWM of the microcontroller is not the pure PID output (RawPIDvalue). The output of the microcontroller when the PID controller is activated is the sum of RawPIDvalue and a predefined PWM value. This predefined PWM value is the corresepondingValue multiplied by an empirical factor a.
Another non-linear technique for managing the output of the PID controller is to delay the activation of the PID controller when a difference between the actual and desired water flow in the pump is detected. According to this, whether a disturbance occurs or the target flow changes, the PID controller will be activated a few seconds (X sec) after the PWM output of the microcontroller takes a startingValue. The startingValue is obtained by multiplying the corresepondingValue with an empirical factor b. This delay being introduced lets the system reach a precomputed stabilized flow value, comparatively close to the target one. This approach activates the PID correction starting from a smaller initial error, thus reducing the overall effort and potential oscillations, commonly intensified by inadequate sensor readings at low flow values.
The third non-linear technique employed in conjunction with the PID controller is the dynamic/adaptive gains approach. During system response, when the actual pump flow reaches or exceeds the target flow multiplied by the empirical factor c, the gains kP, kI, and kD are adjusted by multiplying them by the empirical factor d to obtain milder PID gains. This results in a reduction in the oscillation of the system around the target and a decrease in the wind-up effect [34], thereby altering the response behaviour. The flowchart in Figure 14 below provides a summary of the equations corresponding to each of the empirical factors (a, b, c, and d) in a scenario that includes all three non-linear PID approaches for the system microcontroller.
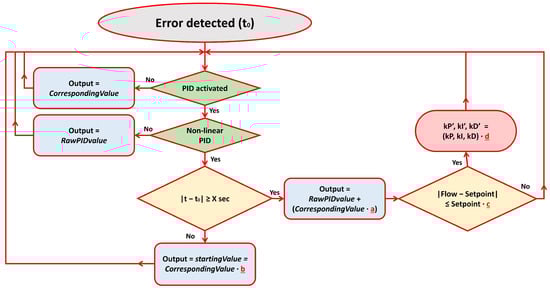
Figure 14.
A summary of the factors a, b, c, and d.
The diagrams below demonstrate the effectiveness of PID in the developed system, using non-linear PID methods with an empirical factor a of 0.75 and an empirical factor b of 0.9. The microcontroller’s output takes the startingValue for 2 s after a fault is detected, i.e., X = 2 s. The value of factor d is 0.2, meaning that the gains of the PID controller decrease by a factor of 5. As for factor c, a simpler approach is used. A transition from conventional to soft gains occurs when the difference between the actual and desired flow reaches 10 mL/s, regardless of the target value. These rates were selected after the participating students tested and experimented with many values and combinations, as they provided the most optimal results for the most setpoint values in this scenario. Similarly, through the process of testing, the student participants arrived at the conclusion that the values of 0.1, 0.05, and 0.0025 for kP, kI, and kD gains, respectively, were the most appropriate. In contrast with the initial student experimentation stage, classical methods for calculating PID gains, such as the Ziegler–Nichols approach [42], were not employed in this case, as the system was non-linear (see Figure 12) and this would have resulted in an unsatisfactory outcome.
The highest feasible flow rate of the pump in the system is recorded around 22 L per minute (366 mL per second), however, this is only applicable to the specific quantity of water contained within the entire experimental setup during the testing period. Alterations to the hydrostatic pressure in the system tank with which the system has been calibrated/programmed can cause significant disruptions. The higher the volume of water in the container, the greater the hydrostatic pressure at the pump’s inlet. This results in an increased flow rate for the pump. Figure 15a,b illustrate how the system responds to different target flow values while the water tank is fuller than during the system’s initial setup. The desired flow is displayed in red, while the variation in the actual flow with time in seconds is shown in blue. Figure 15a depicts the response without a PID controller and shows that the increased hydrostatic pressure caused by the excess water interferes with the ability of the system to achieve the desired target flow values. In contrast, Figure 15b demonstrates how the PID controller, using non-linear approaches, enables the system to attain the most target flows, underscoring the significance of PID in the system.
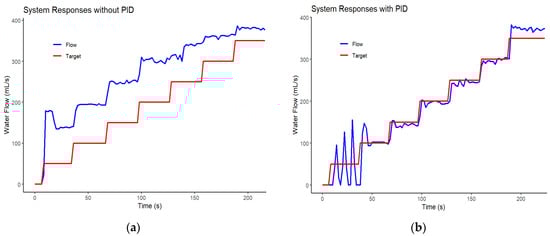
Figure 15.
The responses of the system to diverse target flow rates, in the presents of hydrostatic pressure disturbance, are compared for two cases: (a) without PID and (b) with non-linear PID.
As shown in Figure 15a, the pump experiences overperforming when the hydrostatic pressure at its inlet exceeds the pressure at which the system has been calibrated. Figure 15b indicates that, for most target flow rates, the PID controller can compensate for the disparity between the intended and actual water flow. Despite the disruption, the system manages to attain the target values successfully for most of the target flow values. The system also exhibits a quick response in spite of the constraint on the maximum overshoot limit, which can be attributed to implementation of the PID controller’s non-linear methods. However, when the target flow rate is set to 50 mL/s, the system cannot maintain a stable flow and falls into a divergent oscillation, probably due to inconsistent readings from the flow sensor that confuse the PID controller. It is likely that lower values of the empirical factors a, b, c, and d are preferable for the lower target values of the system. Also, in the case of higher target values, such as 350 mL/s, the necessity for lower empirical factors arises in order to afford the PID controller greater freedom of action.
The PID controller not only stabilises pump operation, but also minimises maximum overshoot of actual flow. The maximum overshoot in system responses is crucial in many applications, as it ensures that equipment is not unduly stressed and that its lifespan is not shortened. Non-linear PID methods allow for a rapid response to flow variations caused by external factors or by the change in the target value, while reducing oscillation and maximum overshoot during pump operation. The diagram in Figure 16 illustrates the step responses of the system’s actual flow for targeted flows of 100, 200, and 300 mL/s.

Figure 16.
The step response of the system for target flow of 100, 200, and 300 mL/s. Potential imperfections are seen as a valuable source of learning rather than an operating drawback.
As per Figure 16, the system achieves the desired flow (±2%) within a few seconds of starting to respond. For the given empirical factor values and given PID gains, the optimal step response (faster and without large overshoot) is presented for a target value of 200 mL/s, understating the variation in their optimal values per each individual system segment. Regarding the performance indicated in Figure 15b and Figure 16, it should be noted that the controller is not tuned perfectly and to follow every precomputed setpoint, given the flow sensor imperfections close to the scale limits. For these reasons, the backstepping method is proposed as a future improvement. Furthermore, the main objectives of the proposed approach are educational, and, thus, potential imperfections are seen as a valuable source of learning rather than an operating drawback.
In addition to the rapid and smooth step response of the system, the PID controller provides the system with the ability to withstand disturbances. This is particularly important, as the system would fail to achieve the desired water flow if a system parameter were to change. Parameters that can destabilise the system include a voltage drop in the pump supply, a narrowing of the outlet or inlet pipes, the introduction of air into the inlet pipe, or a change in the hydrostatic pressure at the pump inlet. Figure 17 illustrates the system’s response to the disturbance created by the flow limitation valve in the outlet pipe. In addition to the desired (red) and actual (blue) water flow, the variation in the pump rotation speed (pink) in RPM, the PWM output of the microcontroller (green), and the electrical consumption of the pump (black) in amperes are also illustrated. The first section of the diagram depicts the valve being partially closed (positive change), which temporarily restricts the actual pump flow at time “t(1)”. The PID controller swiftly identifies the fault and enhances the pump speed to ensure that the actual flow promptly reaches the desired flow. In the subsequent phase of the diagram, once the required flow is attained, the valve reopens (negative change) and stops the constriction of the outlet pipe at time “t(2)”, and, thus, the system is again out of the desired operation. The PID controller then again restores the flow to the desired level of 200 mL/s.
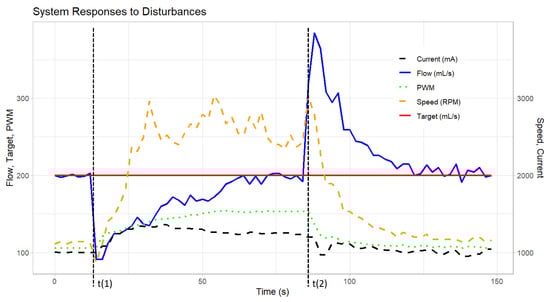
Figure 17.
The response of the system (flow, speed, PWM, and current) to positive and negative disturbances.
In both instances of positive and negative change, the wind-up effect is evident. This phenomenon is caused by the accumulation of error in the integral term, which results in the system performing either above or below the desired level in its attempt to return to the desired state. In both instances, the errors have a similar shape, but in a different direction. However, the maximum absolute value of the error occurring in the positive and negative disturbances differs. In the negative disturbance, the error exceeds 100 mL/s, which is the instantaneous value observed in the positive disturbance. This phenomenon can be attributed to the non-linear characteristics of the system, whereby the variation in flow is more pronounced when there are variations between small PWM values.
To help students understand better the concept of wind-up, it can be simulated by the behaviour of a person being pushed. If someone pushes a person backwards continuously, they will resist by trying to move forward. When the backward push suddenly stops, the person being pushed will continue moving forward for a while, despite the “disturbance” being removed.
It should be also noted that, in the performed test, the PID controller efficiently reset the flow to the desired levels. However, if the target flow was set close to the system’s maximum limits and a disturbance occurred, requiring an increase in motor speed to counteract it, the efficiency of the controller decreased. Therefore, in cases where disturbances are expected, motors with a higher power than that typically required should be selected.
4.3. Educational Impact
This section is dedicated to the presentation and analysis of the students’ responses to the questionnaire on the educational significance of the proposed interactive smart pump system. These university students, enrolled in the agricultural engineering specialty, also participated to a certain extent in the implementation and testing phase of the proposed system, as part of their undergraduate and/or their postgraduate curriculum activities. More specifically, these activities were relevant with the undergraduate courses “Electronics-Microprocessors”, “Automatic Process Control”, and “Applied Automatic Control”. They were also in close association with the courses ”Smart Sensors and IoT”, “Embedded and Real-time Systems”, “Enhanced and Autonomous Machinery and Vehicles”, and “Cyber-physical Systems and Smart Infrastructures”, which are included in the master’s degree program “Digital Technologies and Smart Infrastructure in Agriculture” at the AUA.
In this regard, Figure 18a,b depict characteristic instances of student involvement in the activities, communicating the discussed experimental smart water pump system principles.

Figure 18.
(a,b) Characteristics instances from the student involvement in the explanation of the experimental smart water pump system principles.
Among the participants, a total of 57 students responded anonymously and voluntarily to a Likert-scale [43] Google Forms questionnaire, from January of 2024 to March of 2025. The exact statements of this questionnaire are listed in Appendix A (Table A1), along with the mean scores and the standard deviations for each statement. These summarise the opinions of the participants according to their respective five-point Likert answers.
The initial results of the study are presented in a series of histograms, as shown in Figure 19, Figure 20, Figure 21, Figure 22, Figure 23, Figure 24 and Figure 25. The subsequent charts depict the proportion of individuals who express a particular level of agreement with the statement on top of each chart, as represented by the height of the respective purple bar on the vertical axis. As the most questions concern the contribution of the system to various fields or activities, the horizontal axis represents the characterisation of opinion groups by a numerical scale ranging from one to five, where one represents a «very low contribution» and five a «very high contribution».

Figure 19.
Students’ opinion about the contribution of the proposed activity to understand: (a) hardware assembling topics and (b) software programming topics.
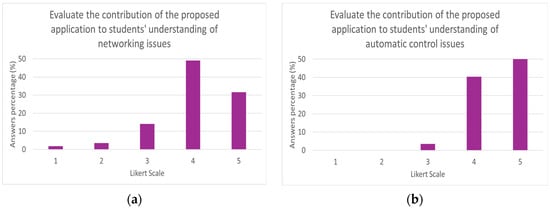
Figure 20.
Students’ opinion about the contribution of the proposed activity to understand: (a) network topics and (b) automatic control topics.
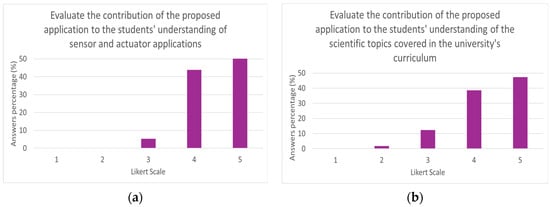
Figure 21.
Students’ opinion about the contribution of the proposed activity to understand: (a) sensor and actuator applications and (b) the scientific topics covered in their university’s curriculum.
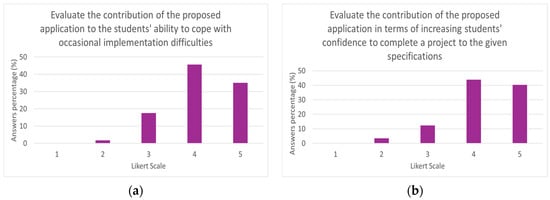
Figure 22.
Students’ opinion about the contribution of the proposed activity to: (a) students’ ability to cope with occasional implementation difficulties and (b) increase students’ confidence to complete a project to the given specifications.
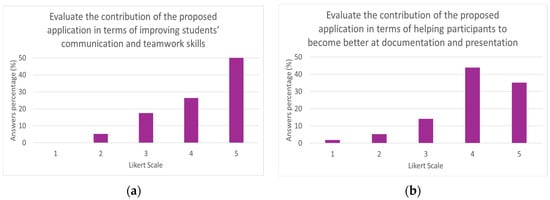
Figure 23.
Students’ opinion about the contribution of the proposed activity to: (a) students’ communication and social skill improvement and (b) improve students in documentation and presentation.
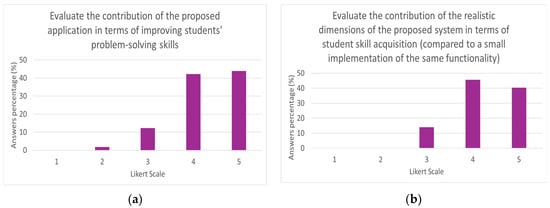
Figure 24.
Students’ opinion about the contribution of the proposed activity to: (a) improve students’ problem-solving skills and (b) students’ skills regarding the realistic scale of the system.
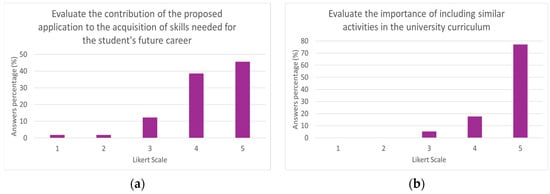
Figure 25.
Students’ opinion about: (a) the contribution of the proposed activity to the acquisition of students’ skills needed for their future career and (b) the importance of including similar activities to the university curriculum.
The results of the questionnaire provide valuable insights into the role of the system in the educational process. Despite the simplicity of its construction and the use of widely available and relatively inexpensive components, the smart water pump system facilitated a deeper comprehension of sensors and actuators among the students (Figure 18a). As illustrated in Figure 19a,b, the application facilitates learning and familiarisation with programming concepts while also offering an effective platform for hardware assembly training.
The application puts emphasis on the automatic control domain and on the wireless communication domain, better favouring the first one, as validated by the student responses shown in Figure 20a,b. It also facilitates satisfactorily the understanding of sensors and actuators, as indicated in Figure 21a. The majority of the respondents answered that the application helped to improve their understanding of the scientific fields of the curriculum (Figure 21b), demonstrating the paramount importance of including more, similar with the proposed one, applications in the university curriculum (Figure 25b). From Figure 23b and Figure 25a, it can be concluded that the application contributed sufficiently to improving students’ skills in the presentation and documentation and skills required for future careers, respectively.
The actual dimensions of the system facilitated the students’ acquisition of skills, as evidenced by Figure 24b. Additionally, the system’s contribution to students’ problem-solving abilities and their self-confidence in navigating challenges was notable (Figure 22a and Figure 24a). The preferred application was observed to moderately enhance students’ ability to carry out tasks in accordance with the necessary specifications (Figure 22b). Furthermore, it was identified as a particularly effective means of developing students’ communication and social skills (Figure 23a).
Finally, it must be noted that a total of 60% or more of the students who completed the questionnaire reported having had prior experience with similar applications during their academic career.
5. Discussion
5.1. Alternatives, Hardware Improvements, and Future Research Opportunities
The remote control and monitoring of system parameters have proven to be useful for potential users of the system and for educational purposes. One challenging alternative to studying includes the remote operation of the system through the public network. The user should be able to access the Android application or a web page with the same functionality from anywhere in the world, not just from the local network. To achieve this, the local network must have internet access and use a handy wireless communication protocol that enables seamless data transmission over the internet. Common examples of such protocols include MQTT and CoAP, which are often used in IoT applications [44]. This opportunity highlights the fact that the system can be expanded and educationally cover an even wider space in the ICT domain.
Future upgrades to the Android application would include live charts displaying system parameters, allowing for the monitoring of flow, rotation speeds, and energy consumption over time. The mobile app could also be able to store data logs on the device, in addition to presenting and graphing system parameters. Alternatively, the microcontroller could use a microSD card module to store data on a connected SD card and act as a data logger. Additionally, it is possible for the data to be stored externally, either on a server or in a cloud database, in case the microcontroller is connected to the internet.
It is important to note that a frequency converter can be used to regulate the rotational speed of the pump instead of using modules for phase control. Regulating the frequency of the current that supplies the electric motor provides a greater reliability and accuracy, but the necessary components are more expensive and would significantly increase the cost and the complexity of the system.
The existing system could be enhanced further in terms of both performance and educational friendliness by carefully incorporating techniques for avoiding and mitigating windup effects. Implementing anti-windup strategies is crucial when employing the positional form of the PID controller that incorporates integral action. The implementation of the non-linear PID (adapted gains, partial use of PID output, and delay activation of PID until a flow value has been reached) approaches is, by itself, a windup mitigation measure. However, the application of classical techniques, such as back calculation, incremental algorithm, and conditional integration, has the potential to further reduce the discrepancy between the desired and actual flow rates, thereby facilitating a more rapid response and consequently enhancing the efficiency of pump operation.
Another promising direction for future development involves the integration of event-triggered control mechanisms and disturbance-observer-based strategies within the proposed educational setup. These extensions could allow students to explore advanced concepts related to resource-efficient control and disturbance rejection, which are increasingly relevant in modern automation and smart systems. Moreover, incorporating data-driven tuning methods or dynamic guaranteed cost control could further enhance the system’s pedagogical value by exposing students to current trends in intelligent control systems.
The smart water pump system is designed to receive a pump flow target from 0 to 350 mL/s in increments of 50 mL/s, allowing the user to select between eight different flow values via their mobile phone. The system’s behaviour varies for each target value due to its non-linearity. The PID controller in the developed circuit was adjusted to ensure satisfactory outcomes for most target values. However, as can be seen from both Figure 15b and Figure 16, the behaviour of the system for specific PID gains and empirical factors differs according to the setpoint. Through the implementation of the non-linear backstepping approach, a higher level of efficiency can be achieved via dividing the system into numerous subsystems and designing individual controllers for each [45]. Consequently, in that scenario, each target flow can act as a distinct subsystem with its own controller with different PID gains or even different empirical factors a, b, c, and d, fine-tuned to its specific necessities.
More work should be performed for identifying the optimal form of the non-linear PID control techniques being investigated. This work presents indicative results using three non-linear methods that relied on empirically calculated factors after numerous tests. As each system is unique, the optimal values of these factors will vary per application. It is necessary to develop solutions that calculate the optimal values of the factor ‘a’ in the method of exploiting the output of the PID controller, along with a predefined PWM value. Additionally, it is important to determine the optimal values of the factor ‘b’ in the method that delays the activation of the PID controller, and the factors ‘c’ and ‘d’ in the method of exploiting the dynamic gains of the controller.
5.2. Further Discussion
Despite testing several algorithmic variants, this paper does not intend to propose novel control theory or advanced automation algorithms, but rather to showcase how widely accepted and established methods (e.g., PID control) can be recontextualised via full-scale, low-budget systems to support STEM education in agriculture-related engineering domains, fostering student technical and scientific skills. While the basic system incorporates standard technologies, its integration into a pedagogically structured educational activity, evaluated by students, can offer an inspiring paradigm for educators and learners who seek both theoretical understanding and practical insight.
It should be noted, however, that, from a technical standpoint, the whole experimentation with the aforementioned algorithmic alternatives allows for better-performing configurations to be identified, which can, in turn, be easily implemented utilising widely-available and low-cost microcontrollers. Consequently, the presented system has the potential to showcase how existing agricultural systems can be enhanced, reducing the consumption of water and energy via optimising the use of the electric motor pumps. The phase control technique is applicable to a diverse array of agricultural systems and machinery, including greenhouses and warehouses, where it can be used to regulate the speeds of aeration system fans, and agricultural tractors, where it can enable variable dose spraying. It is expected that, in the future, even larger AC agricultural robots will utilise speed regulation techniques to ensure smooth wheel operation. Furthermore, these robots could be integrated with PID controllers, utilising speed sensors as the input and a desired drive speed as the target value. The phase control technique, in conjunction with a closed-loop system in pumps, could potentially be exploited by reverse osmosis desalination plants, whereby the pressure before (or after the reverse osmosis membrane) is used as guide for the quality/quantity of the freshwater product.
From the perspective of educational training, the application presented is promising in that it provides insights into the techniques and methods used to develop automation systems. This enables students in agricultural engineering departments to gain the skills required to develop integrated mechanical and automation systems, rather than merely utilising them for agricultural purposes. The application, despite its simplicity, facilitates contact with a range of technologies and encourages an interdisciplinary approach. Even students with limited prior experience or knowledge of programming and automation can develop their skills and interest through the development of similar systems, thereby laying the foundation for future achievements in the subject. The selection of components was not commercial-use oriented, trying to find a good balance between cost minimisation, a decent system performance, and educational friendliness. Thus, well-documented components with a high modularity and reusability potential and comparatively easy assembly were favoured. The development of the overall system was a relatively straightforward process and was completed with a total cost of less than 200 Euros. Consequently, the smart water pump being presented can serve as a valuable teaching tool, assisting university educators in their role to communicate automation and digitisation principles in smart agriculture and beyond.
6. Conclusions
This work aims to demonstrate how real-scale, low-cost experimental systems can support engineering education by providing hands-on experiences with core concepts in control theory, automation, and digital monitoring. The value of this approach is twofold, i.e., both technical and educational in nature, as the goal is to assess both the technical performance of the developed system, highlighting alternative PID approaches, and its educational impact on university students of agriculture-related engineering programs. The overall enhanced construction can be seen as basis for acquainting students with the principles of composite (i.e., cyber–physical) systems, as it combines embedded intelligence with multilevel signal perception, providing fluent interaction with physical components and humans. The closed-loop approach that improved the pump’s performance is a successful instrument for a large number of real-world smart agricultural applications. Thus, in parallel, the whole freedom in experimentation with diverse algorithmic alternatives allows for better-performing configurations to be easily identified and implemented. The combination of non-linear PID automatic control techniques with phase control for the regulation of pump rotational speed is a noticeable example. Further enhancements to the system can be performed, specifically regarding automation and networking issues. The effectiveness of the PID controller can further be enhanced through techniques like the backstepping, and a set of rules ought to be established for the optimal determination of the key empirical factors used in the non-linear PID approaches.
The student feedback gathered from the evaluation process contains inevitable indications that the pilot system being developed can serve as an important teaching tool, aiming for students to acquire the necessary hard and soft skills needed to excel in their future careers. In this regard, from a pedagogical point of view, the approach being presented sets the guidelines for similar real-scale systems that leverage low-cost and simple applications for interactive learning and educational purposes, related to automated control and digitisation issues in modern agriculture.
Author Contributions
Conceptualisation, D.L. and I.G.; methodology, D.L. and I.G.; implementation D.L. and I.G.; data curation, D.L. and I.G.; writing—original draft preparation, D.L. and I.G.; validation, D.L., I.G. and K.G.A.; writing—review and editing, D.L., I.G. and K.G.A.; supervision, K.G.A. All authors have read and agreed to the published version of the manuscript.
Funding
This research was partially funded by the European Union project named “Digital agriculture for sustainable development”, with acronym AGRITECH EU and grant agreement number 101123258.
Institutional Review Board Statement
Ethical review and approval were waived for this study, due to not involving identifiable personal nor sensitive data.
Informed Consent Statement
Students’ consent was waived due to not involving identifiable personal nor sensitive data.
Data Availability Statement
The original contributions presented in this study are included in the article; further inquiries can be directed to the corresponding author.
Acknowledgments
The authors would like to thank the faculty and the students of the Department of Natural Resources Management and Agricultural Engineering, at AUA, Greece, for their voluntary assistance during the implementation and the anonymous evaluation activities being presented.
Conflicts of Interest
The authors declare no conflicts of interest.
Appendix A
Table A1 presents the primary questions utilised in the evaluation form outlined in Section 4.3. The mean score for each question on the Likert scale and the Standard Deviation (S.D.) are also provided.
Table A1.
The key questions that informed the development of the survey questionnaire on the system’s contribution to the educational process.
Table A1.
The key questions that informed the development of the survey questionnaire on the system’s contribution to the educational process.
| Questioning Elements | Mean | S.D. |
|---|---|---|
| Evaluate the contribution of the proposed application to a better understanding of hardware assembly issues. | 4.28 | 0.80 |
| Evaluate the contribution of the proposed techniques to a better understanding of software issues (network programming, operating systems, code writing, interface design, etc.). | 4.14 | 0.95 |
| Evaluate the contribution of the proposed application to students’ understanding of networking issues. | 4.05 | 0.87 |
| Evaluate the contribution of the proposed application to students’ understanding of automatic control issues. | 4.53 | 0.57 |
| Evaluate the contribution of the proposed application to the students’ understanding of sensor and actuator applications. | 4.46 | 0.60 |
| Evaluate the contribution of the proposed application to the students’ understanding of the scientific topics covered in the university’s curriculum. | 4.32 | 0.76 |
| Evaluate the contribution of the proposed application to the students’ ability to cope with occasional implementation difficulties. | 4.14 | 0.77 |
| Evaluate the contribution of the proposed application in terms of increasing students’ confidence to complete a project to the given specifications. | 4.21 | 0.80 |
| Evaluate the contribution of the proposed application in terms of improving students’ communication and teamwork skills. | 4.23 | 0.93 |
| Evaluate the contribution of the proposed application in terms of helping participants to become better at documentation and presentation. | 4.05 | 0.93 |
| Evaluate the contribution of the proposed application in terms of improving students’ problem-solving skills. | 4.28 | 0.75 |
| Evaluate the contribution of the realistic dimensions of the proposed system in terms of student skill acquisition (compared to a small implementation of the same functionality). | 4.26 | 0.70 |
| Evaluate the contribution of the proposed application to the acquisition of skills needed for the students’ future careers. | 4.25 | 0.87 |
| Evaluate the importance of including similar activities in the university curriculum. | 4.72 | 0.56 |
| Evaluate your previous experience with similar devices and practices in your student life. | 3.70 | 1.22 |
References
- da Silva, F.T.; Baierle, I.C.; Correa, R.G.d.F.; Sellitto, M.A.; Peres, F.A.P.; Kipper, L.M. Open Innovation in Agribusiness: Barriers and Challenges in the Transition to Agriculture 4.0. Sustainability 2023, 15, 8562. [Google Scholar] [CrossRef]
- Gonzalez-de-Santos, P.; Fernández, R.; Sepúlveda, D.; Navas, E.; Emmi, L.; Armada, M. Field Robots for Intelligent Farms—Inhering Features from Industry. Agronomy 2020, 10, 1638. [Google Scholar] [CrossRef]
- Zhai, Z.; Martínez, J.F.; Beltran, V.; Martínez, N.L. Decision Support Systems for Agriculture 4.0: Survey and Challenges. Comput. Electron. Agric. 2020, 170, 105256. [Google Scholar] [CrossRef]
- Dayioğlu, M.A.; Turker, U. Digital Transformation for Sustainable Future—Agriculture 4.0: A review. J. Agric. Sci. 2021, 27, 373–399. [Google Scholar] [CrossRef]
- Yadav, V.S.; Singh, A.R.; Raut, R.D.; Mangla, S.K.; Luthra, S.; Kumar, A. Exploring the Application of Industry 4.0 Technologies in the Agricultural Food Supply Chain: A Systematic Literature Review. Comput. Ind. Eng. 2022, 169, 108304. [Google Scholar] [CrossRef]
- Javaid, M.; Haleem, A.; Singh, R.P.; Suman, R. Enhancing Smart Farming through the Applications of Agriculture 4.0 Technologies. Int. J. Intell. Netw. 2022, 3, 150–164. [Google Scholar] [CrossRef]
- Balaska, V.; Adamidou, Z.; Vryzas, Z.; Gasteratos, A. Sustainable Crop Protection via Robotics and Artificial Intelligence Solutions. Machines 2023, 11, 774. [Google Scholar] [CrossRef]
- Papadakis, S.; Kalogiannakis, M. Handbook of Research on Using Educational Robotics to Facilitate Student Learning; IGI Global: Hershey, PA, USA, 2020; ISBN 978-1-79986-719-7. [Google Scholar]
- Markham, T. Project Based Learning. Teach. Libr. 2011, 39, 38–42. [Google Scholar]
- Anwar, S.; Bascou, N.; Menekse, M.; Kardgar, A. A Systematic Review of Studies on Educational Robotics. J. Pre-Coll. Eng. Educ. Res. (J-PEER) 2019, 9, 2. [Google Scholar] [CrossRef]
- Scaradozzi, D.; Cesaretti, L.; Screpanti, L.; Mangina, E. Identification of the Students Learning Process During Education Robotics Activities. Front. Robot. AI 2020, 7, 21. [Google Scholar] [CrossRef]
- Tan, J.T.C.; Iocchi, L.; Eguchi, A.; Okada, H. Bridging Robotics Education between High School and University: RoboCup@Home Education. In Proceedings of the 2019 IEEE AFRICON, Accra, Ghana, 25–27 September 2019; pp. 1–4. [Google Scholar] [CrossRef]
- Doran, M.V.; Clark, G.W. Enhancing Robotic Experiences throughout the Computing Curriculum. In Proceedings of the 49th ACM Technical Symposium on Computer Science Education, New York, NY, USA, 21 February 2018; Association for Computing Machinery: New York, NY, USA, 2018; pp. 368–371. [Google Scholar] [CrossRef]
- Benavides, L.M.C.; Tamayo Arias, J.A.; Arango Serna, M.D.; Branch Bedoya, J.W.; Burgos, D. Digital Transformation in Higher Education Institutions: A Systematic Literature Review. Sensors 2020, 20, 3291. [Google Scholar] [CrossRef] [PubMed]
- Vickrey, T.; Golick, D.; Stains, M. Educational Technologies and Instructional Practices in Agricultural Sciences: Leveraging the Technological Pedagogical Content Knowledge (TPACK) Framework to Critically Review the Literature. NACTA J. 2018, 62, 65–76. [Google Scholar]
- Loukatos, D.; Androulidakis, N.; Arvanitis, K.G.; Peppas, K.P.; Chondrogiannis, E. Using Open Tools to Transform Retired Equipment into Powerful Engineering Education Instruments: A Smart Agri-IoT Control Example. Electronics 2022, 11, 855. [Google Scholar] [CrossRef]
- Kondoyanni, M.; Loukatos, D.; Arvanitis, K.G.; Lygkoura, K.-A.; Symeonaki, E.; Maraveas, C. Adding Machine-Learning Functionality to Real Equipment for Water Preservation: An Evaluation Case Study in Higher Education. Sustainability 2024, 16, 3261. [Google Scholar] [CrossRef]
- Soma, T.; Nuckchady, B. Communicating the Benefits and Risks of Digital Agriculture Technologies: Perspectives on the Future of Digital Agricultural Education and Training. Front. Commun. 2021, 6, 762201. [Google Scholar] [CrossRef]
- Migliorini, P.; Wezel, A.; Veromann, E.; Strassner, C.; Średnicka-Tober, D.; Kahl, J.; Bügel, S.; Briz, T.; Kazimierczak, R.; Brives, H.; et al. Students’ Knowledge and Expectations about Sustainable Food Systems in Higher Education. Int. J. Sustain. High. Educ. 2020, 21, 1087–1110. [Google Scholar] [CrossRef]
- Dhal, S.B.; Jungbluth, K.; Lin, R.; Sabahi, S.P.; Bagavathiannan, M.; Braga-Neto, U.; Kalafatis, S. A Machine-Learning-Based IoT System for Optimizing Nutrient Supply in Commercial Aquaponic Operations. Sensors 2022, 22, 3510. [Google Scholar] [CrossRef]
- Fountas, S.; Mylonas, N.; Malounas, I.; Rodias, E.; Hellmann Santos, C.; Pekkeriet, E. Agricultural Robotics for Field Operations. Sensors 2020, 20, 2672. [Google Scholar] [CrossRef]
- Ahonen, T.; Tamminen, J.; Viholainen, J.; Koponen, J. Energy Efficiency Optimizing Speed Control Method for Reservoir Pumping Applications. Energy Effic. 2015, 8, 117–128. [Google Scholar] [CrossRef]
- Viholainen, J.; Tamminen, J.; Ahonen, T.; Ahola, J.; Vakkilainen, E.; Soukka, R. Energy-Efficient Control Strategy for Variable Speed-Driven Parallel Pumping Systems. Energy Effic. 2013, 6, 495–509. [Google Scholar] [CrossRef]
- Yao, K.; Xiao, H. Analysis of Frequency Control System in Single-Phase Asynchronous Motor. In Proceedings of the 2020 IEEE 1st China International Youth Conference on Electrical Engineering (CIYCEE), Wuhan, China, 1–4 November 2020; pp. 1–7. [Google Scholar] [CrossRef]
- Kemo 028. The Kemo M028 AC Control Module. 2021. Available online: https://www.kemo-electronic.de/en/Light-Sound/Effects/Modules/M028-Power-control-110-240-V-AC-2600-VA.php (accessed on 2 July 2024).
- Kemo M150. The Kemo M150 DC and Pulse Converter Control Module. 2021. Available online: https://www.kemo-electronic.de/en/Transformer-Dimmer/Converter/M150-DC-pulse-converter.php (accessed on 2 July 2024).
- Ma, J.; Nickerson, J.V. Hands-on, Simulated, and Remote Laboratories: A Comparative Literature Review. ACM Comput. Surv. 2006, 38, 7-es. [Google Scholar] [CrossRef]
- Ramsden, E. Hall-Effect Sensors: Theory and Application; Elsevier: Amsterdam, The Netherlands, 2011; ISBN 978-0-08-052374-3. [Google Scholar]
- Crescentini, M.; Syeda, S.F.; Gibiino, G.P. Hall-Effect Current Sensors: Principles of Operation and Implementation Techniques. IEEE Sens. J. 2022, 22, 10137–10151. [Google Scholar] [CrossRef]
- Yuliyanto, I.E.; Tjendro, T.; Harini, B.W.; Martanto, M. Input Power Measurement System for Driving Motor in Testing Low-Speed Generator. Int. J. Appl. Sci. Smart Technol. 2023, 5, 113–132. [Google Scholar] [CrossRef]
- Knörig, A.; Wettach, R.; Cohen, J. Fritzing: A Tool for Advancing Electronic Prototyping for Designers. In Proceedings of the 3rd International Conference on Tangible and Embedded Interaction, Cambridge, UK, 16–18 February 2009; Association for Computing Machinery: New York, NY, USA, 2009; pp. 351–358. [Google Scholar] [CrossRef]
- Liu, G.P.; Daley, S. Optimal-Tuning Nonlinear PID Control of Hydraulic Systems. Control Eng. Pract. 2000, 8, 1045–1053. [Google Scholar] [CrossRef]
- Tan, K.K.; Huang, S.; Ferdous, R. Robust Self-Tuning PID Controller for Nonlinear Systems. J. Process Control 2002, 12, 753–761. [Google Scholar] [CrossRef]
- Angel, L.; Viola, J.; Paez, M. Evaluation of the Windup Effect in a Practical PID Controller for the Speed Control of a DC-Motor System. In Proceedings of the 2019 IEEE 4th Colombian Conference on Automatic Control (CCAC), Medellin, Colombia, 15–18 October 2019; pp. 1–6. [Google Scholar] [CrossRef]
- Zhao, C.; Guo, L. Towards a Theoretical Foundation of PID Control for Uncertain Nonlinear Systems. Automatica 2022, 142, 110360. [Google Scholar] [CrossRef]
- Arduino PID. Description of the PID Library for Arduino. 2023. Available online: https://www.arduino.cc/reference/en/libraries/pid/ (accessed on 2 July 2024).
- App Inventor. The MIT App Inventor Programming Environment. 2022. Available online: http://appinventor.mit.edu/explore/ (accessed on 2 July 2024).
- Extension for the MIT App Inventor Environment in Order to Intercept Direct UDP Messaging. Available online: https://ullisroboterseite.de/android-AI2-UDP-en.html (accessed on 2 July 2024).
- Sun, X.; Liu, N.; Shen, R.; Wang, K.; Zhao, Z.; Sheng, X. Nonlinear PID Controller Parameters Optimization Using Improved Particle Swarm Optimization Algorithm for the CNC System. Appl. Sci. 2022, 12, 10269. [Google Scholar] [CrossRef]
- Savran, A.; Kahraman, G. A Fuzzy Model Based Adaptive PID Controller Design for Nonlinear and Uncertain Processes. ISA Trans. 2014, 53, 280–288. [Google Scholar] [CrossRef]
- What Is Data Streamer?-Microsoft Support. Available online: https://support.microsoft.com/en-us/office/what-is-data-streamer-1d52ffce-261c-4d7b-8017-89e8ee2b806f (accessed on 2 July 2024).
- Ziegler, J.G.; Nichols, N.B. Optimum Settings for Automatic Controllers. Trans. Am. Soc. Mech. Eng. 2022, 64, 759–765. [Google Scholar] [CrossRef]
- Likert, R. A Technique for the Measurement of Attitudes. Arch. Psychol. 1932, 140, 55. [Google Scholar]
- Naik, N. Choice of Effective Messaging Protocols for IoT Systems: MQTT, CoAP, AMQP and HTTP. In Proceedings of the 2017 IEEE International Systems Engineering Symposium (ISSE), Vienna, Austria, 11–13 October 2017; pp. 1–7. [Google Scholar] [CrossRef]
- John, J.A.; Jaffar, N.E.; Francis, R.M. Modelling and Control of Coupled Tank Liquid Level System Using Backstepping Method. Int. J. Eng. Res. Technol. 2015, 4, 667–671. [Google Scholar] [CrossRef]
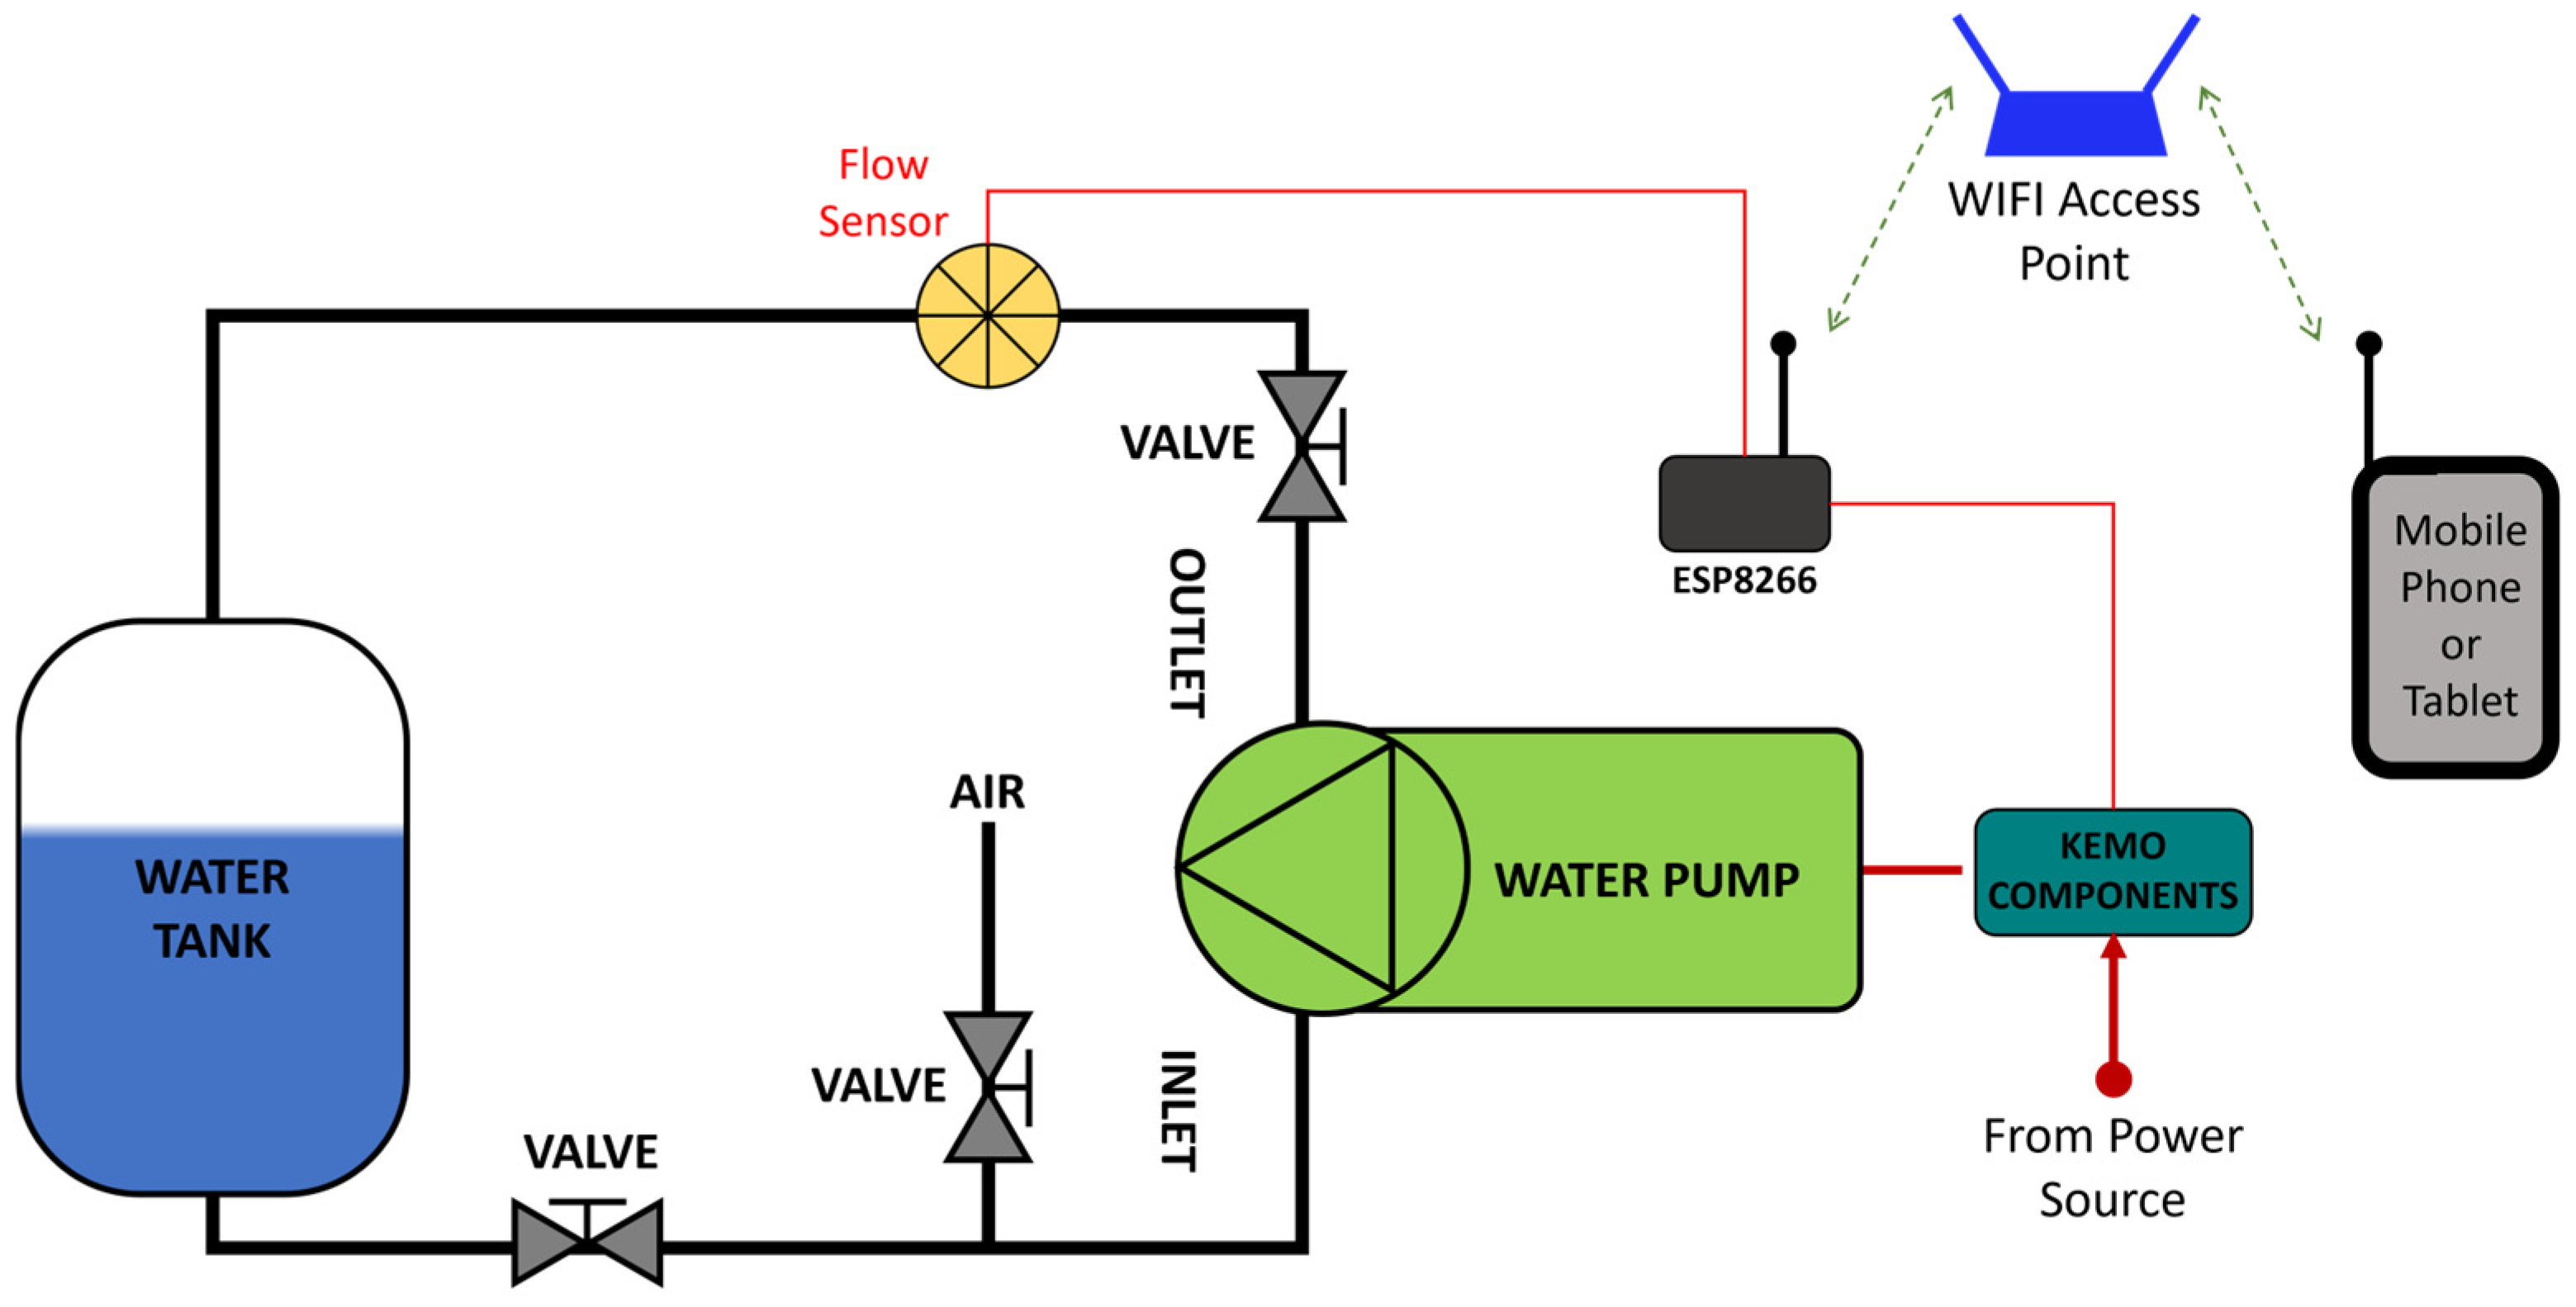

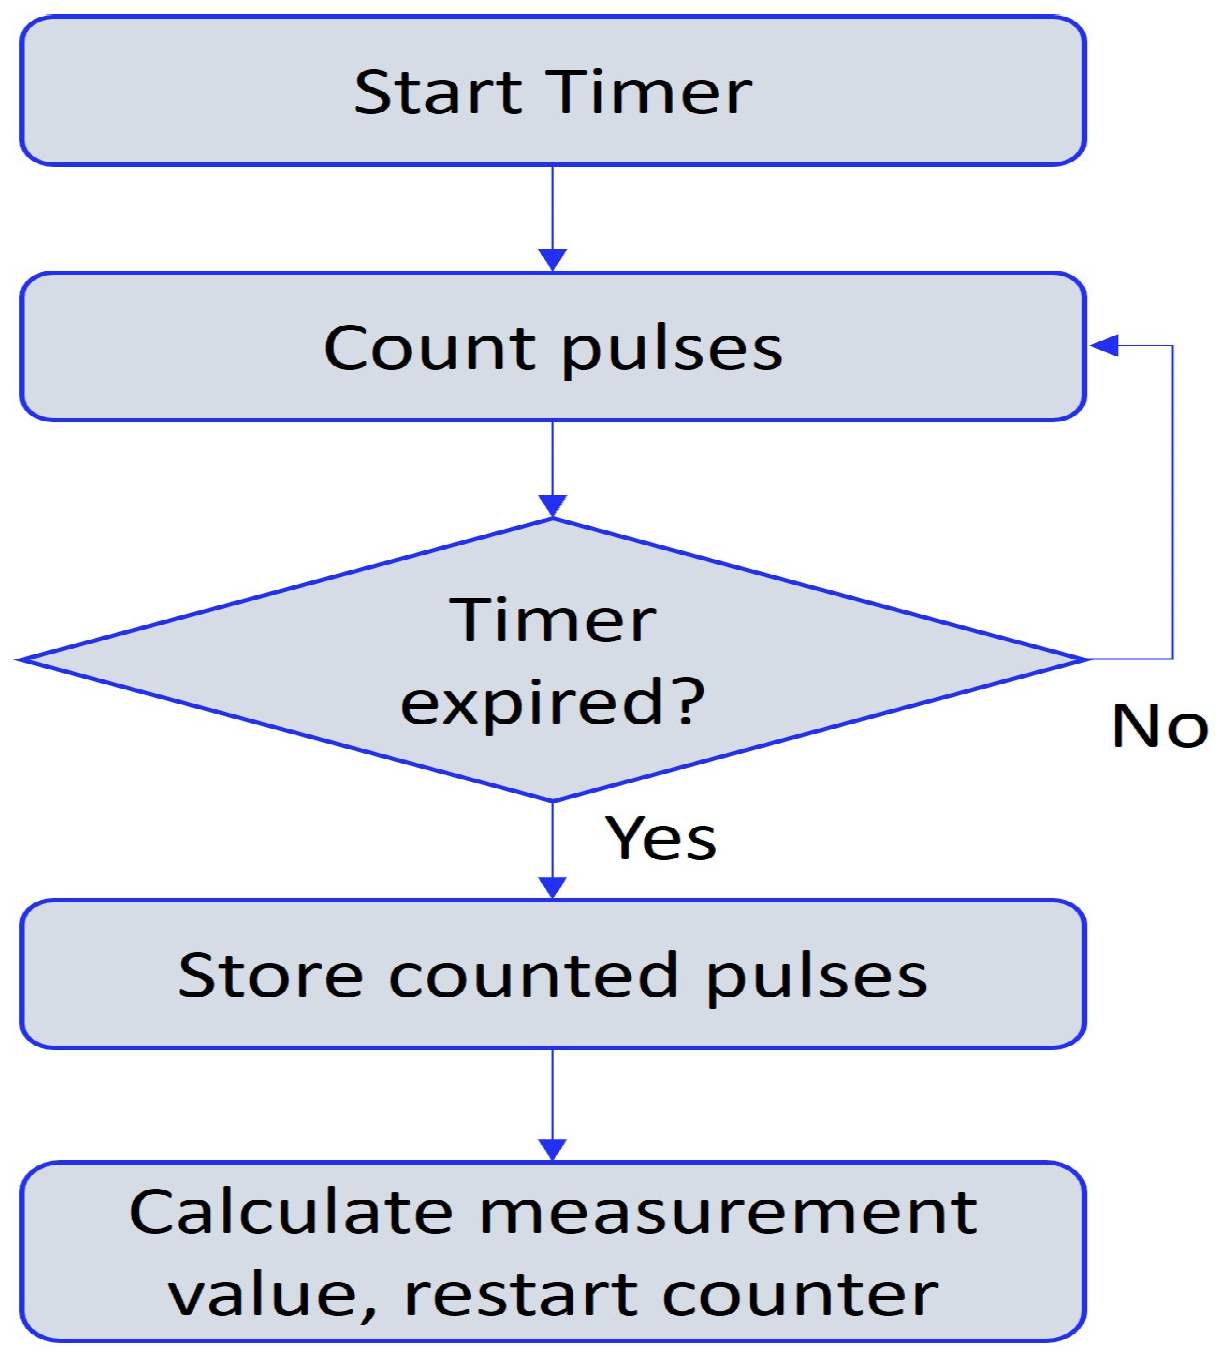

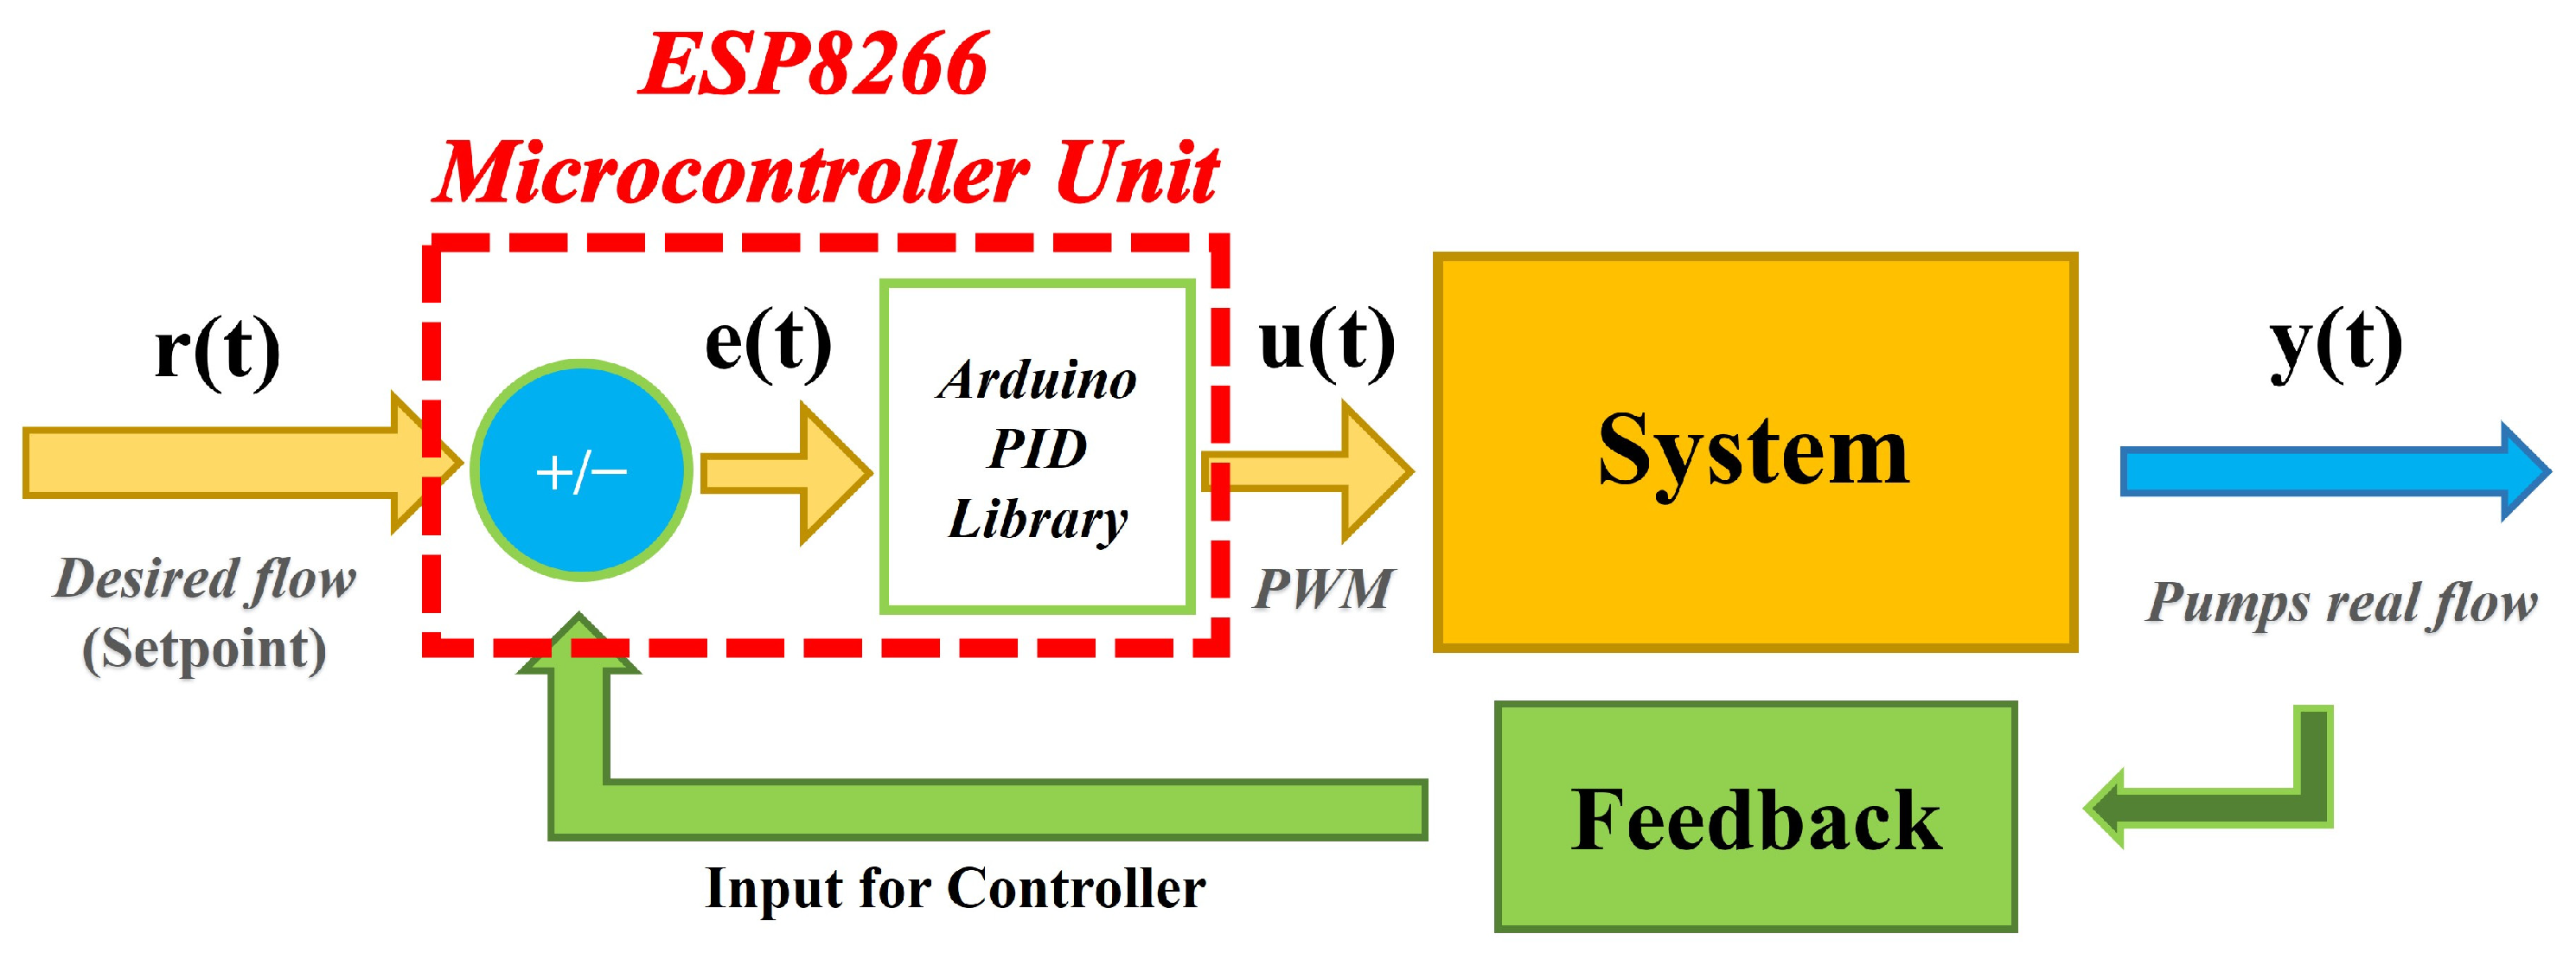
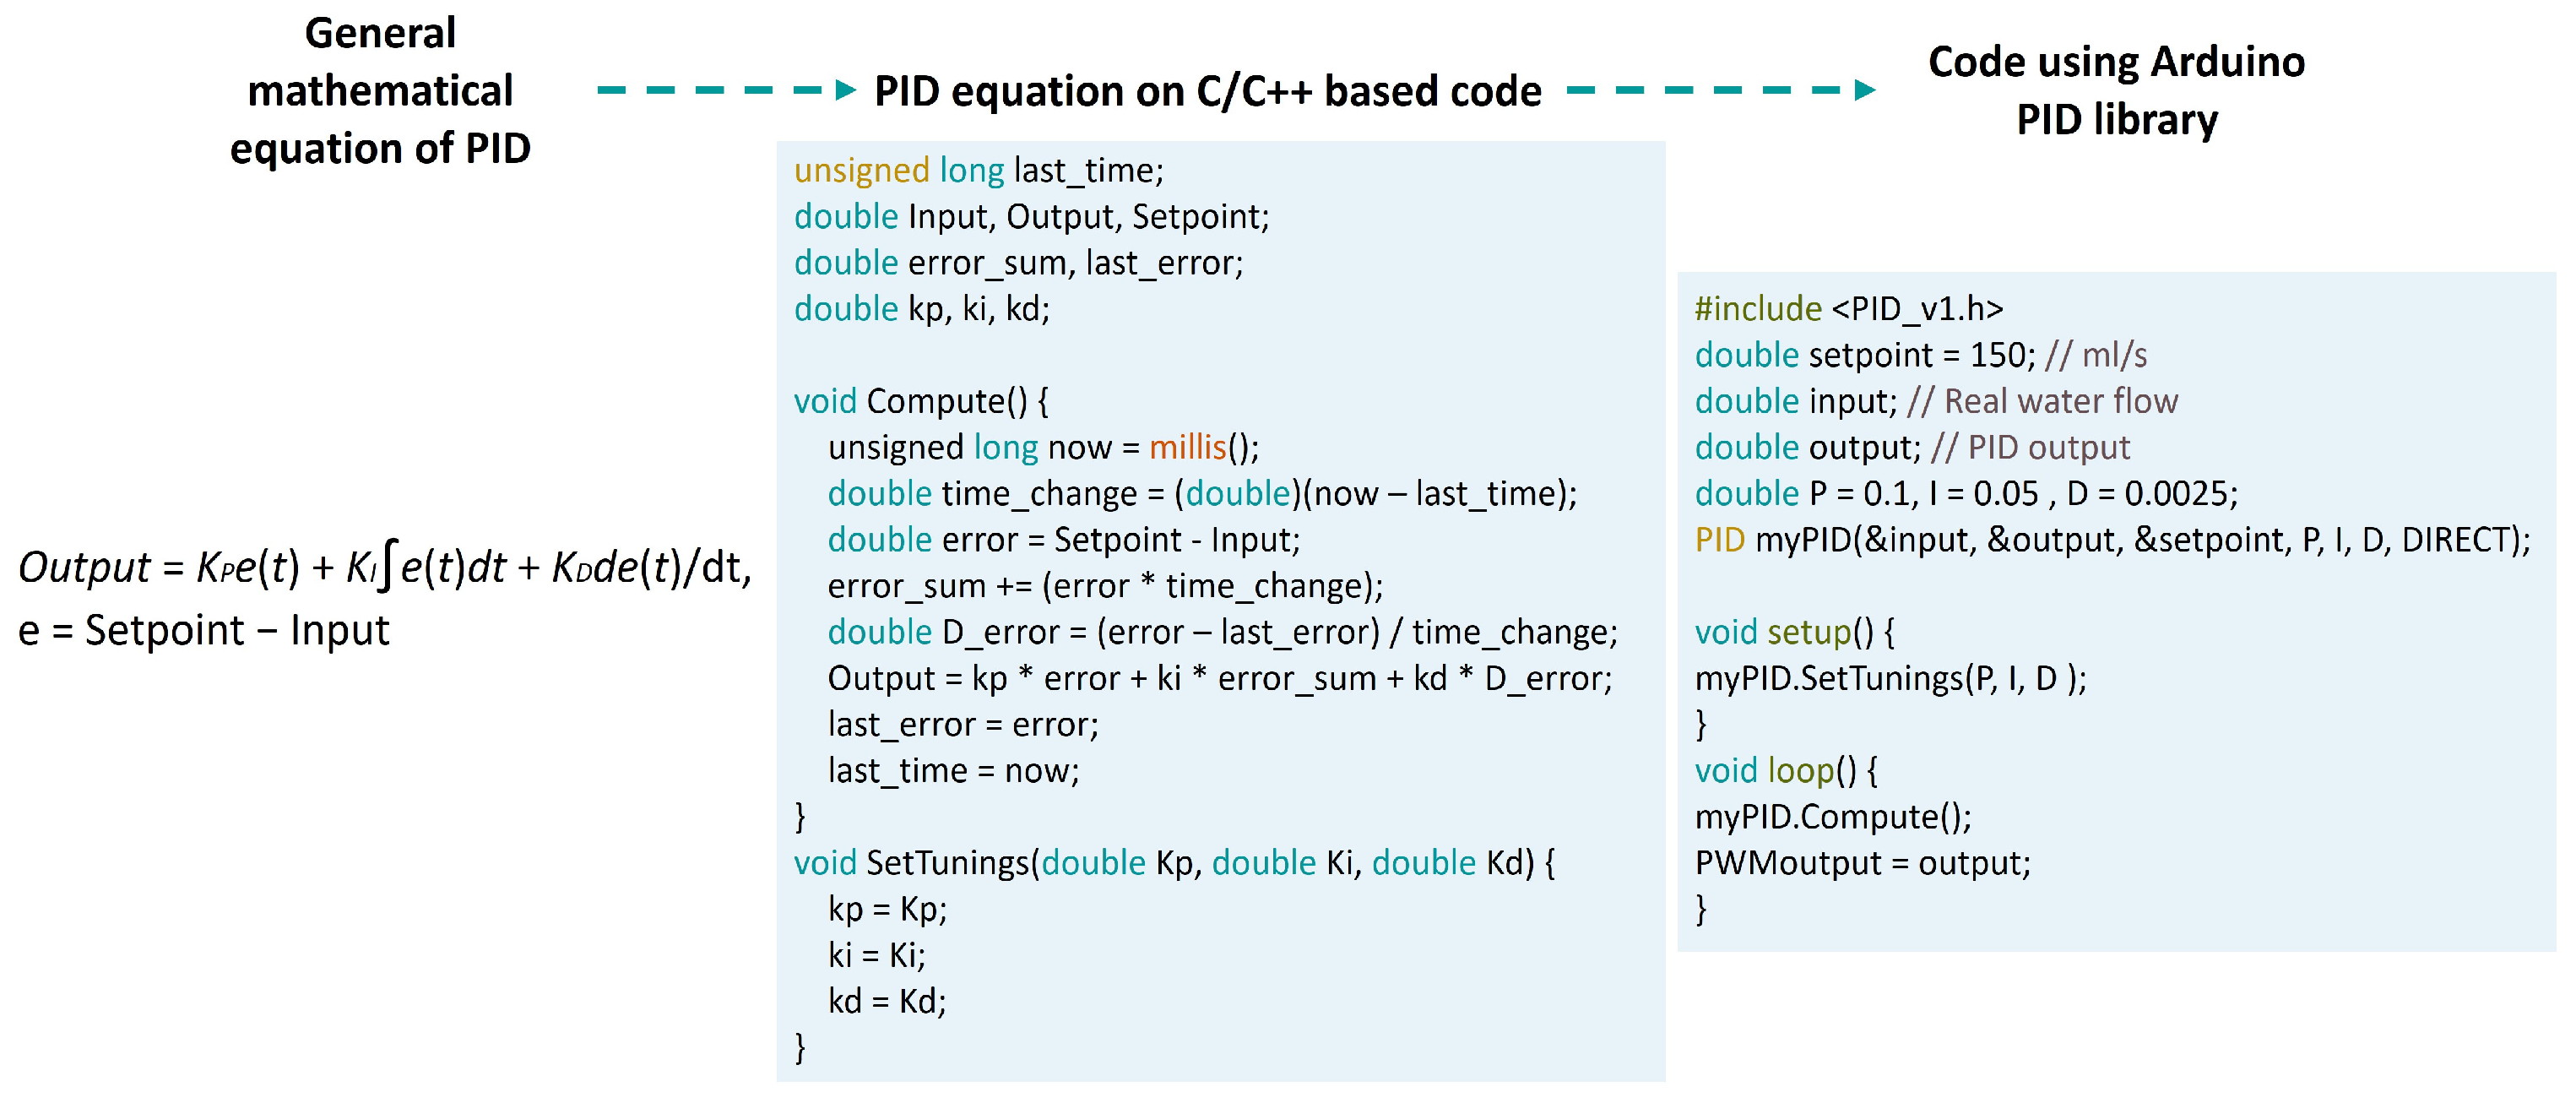


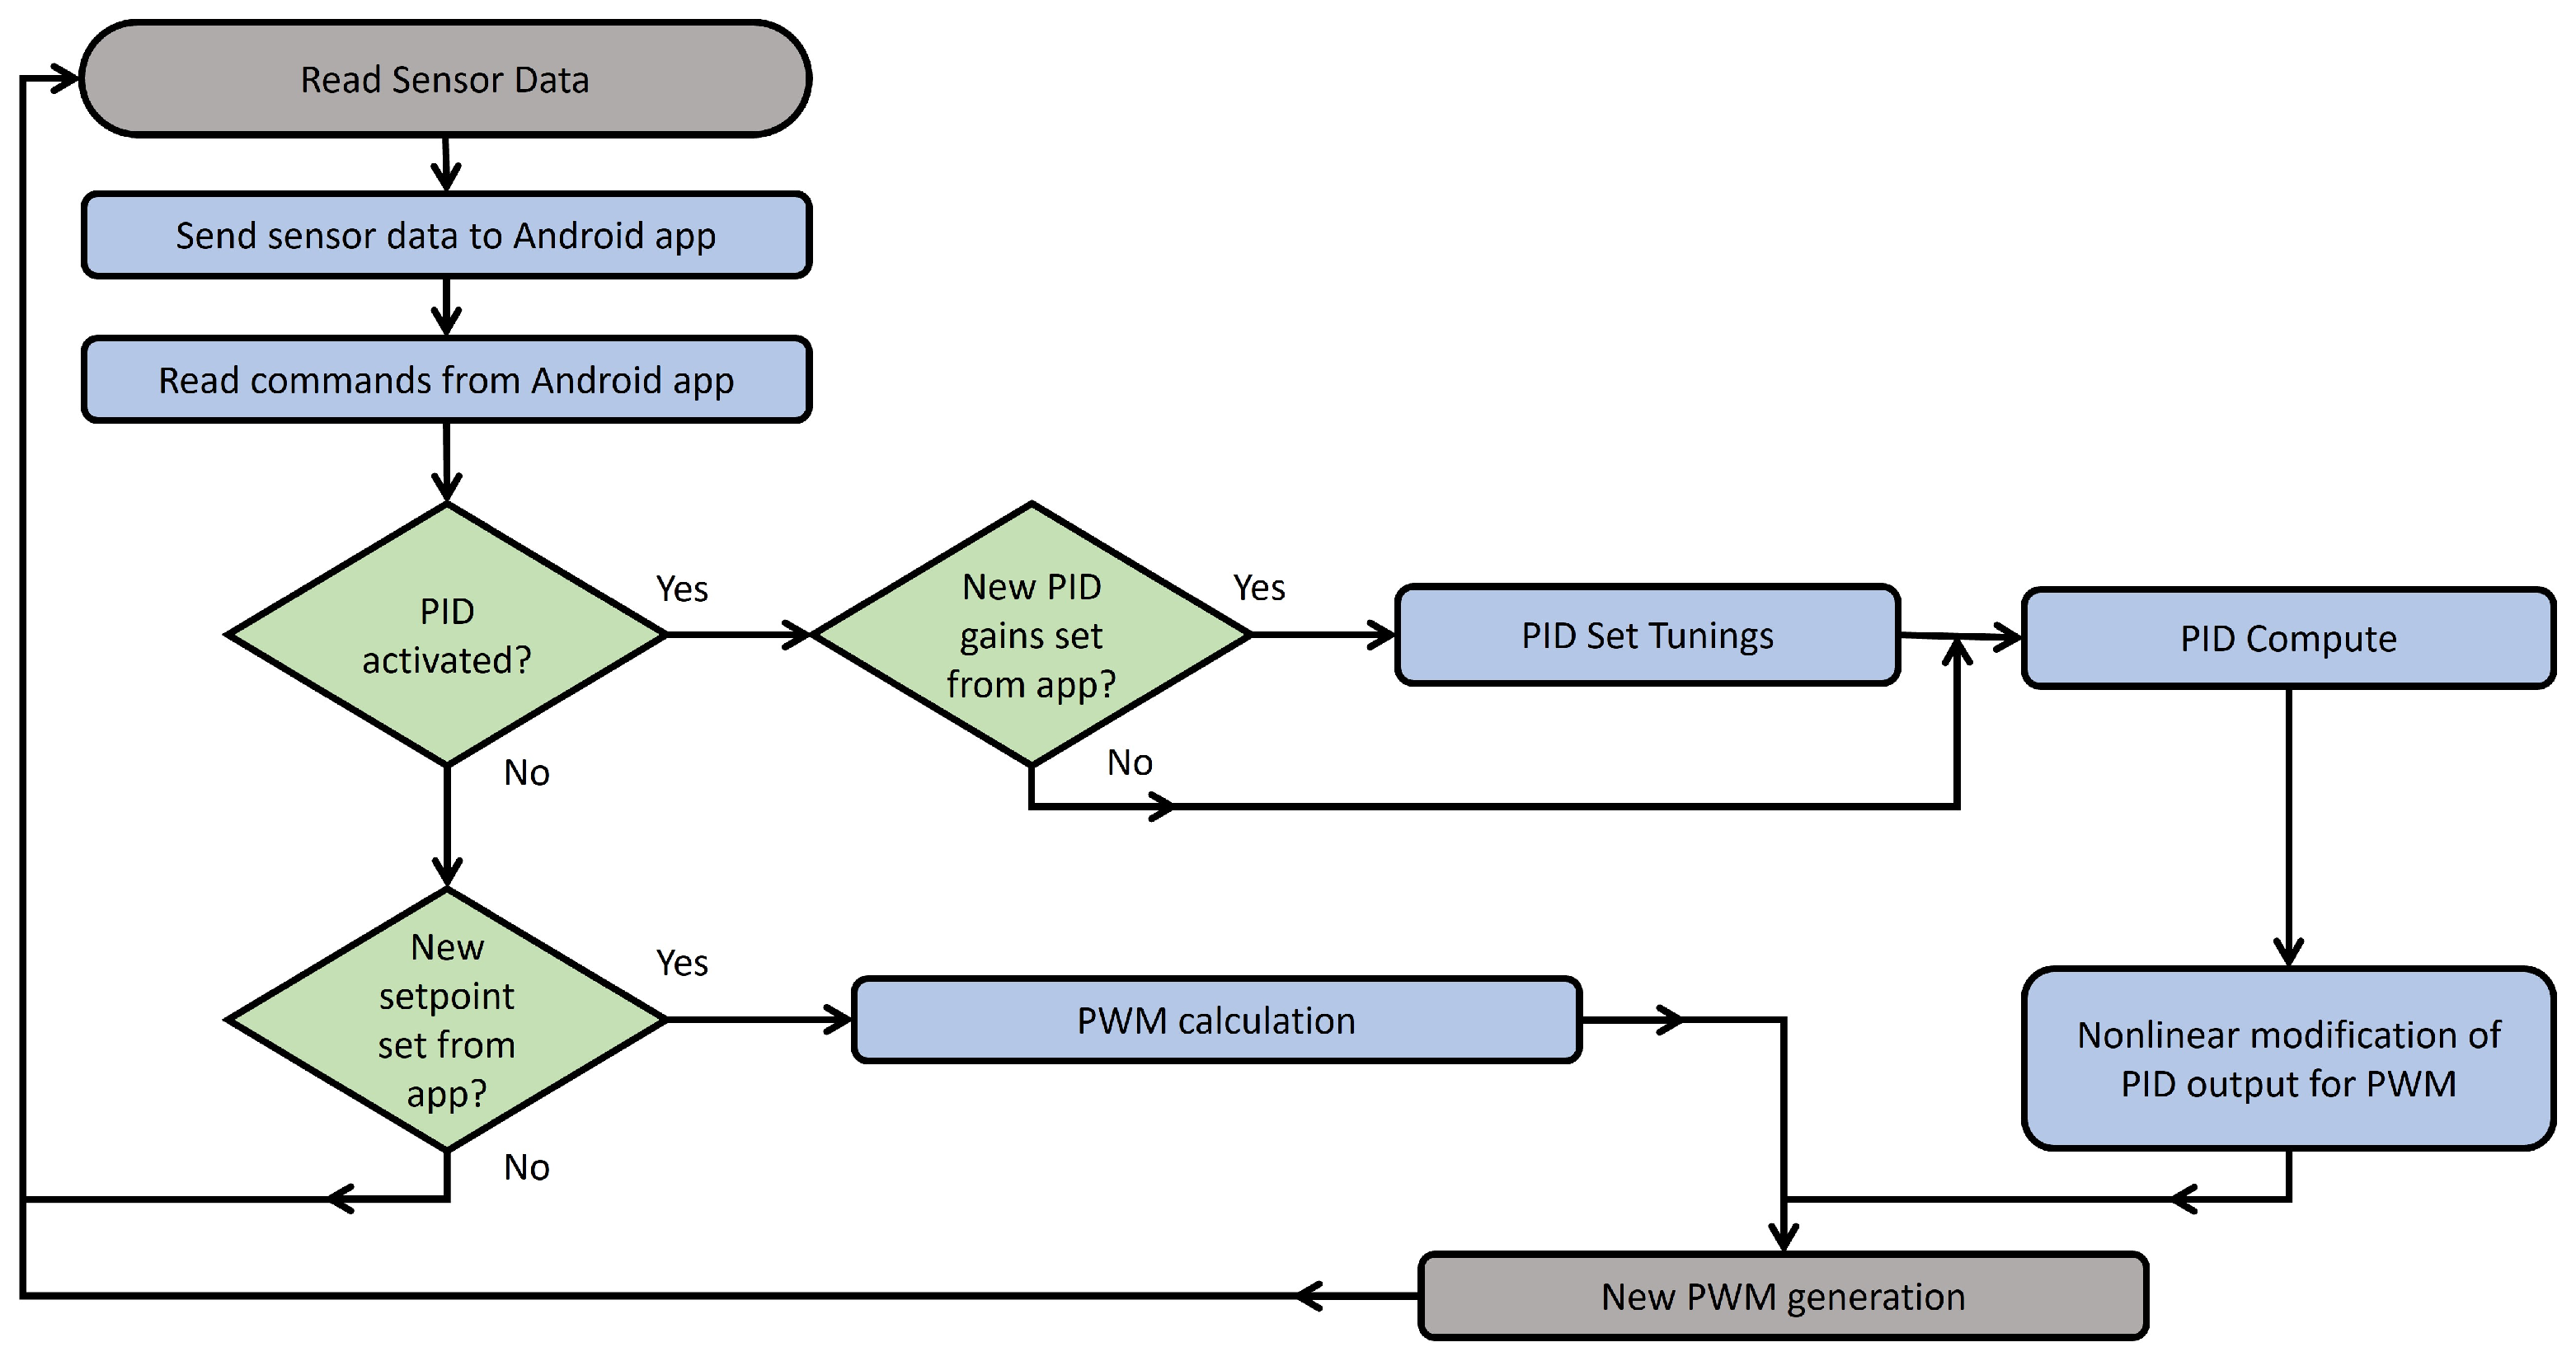
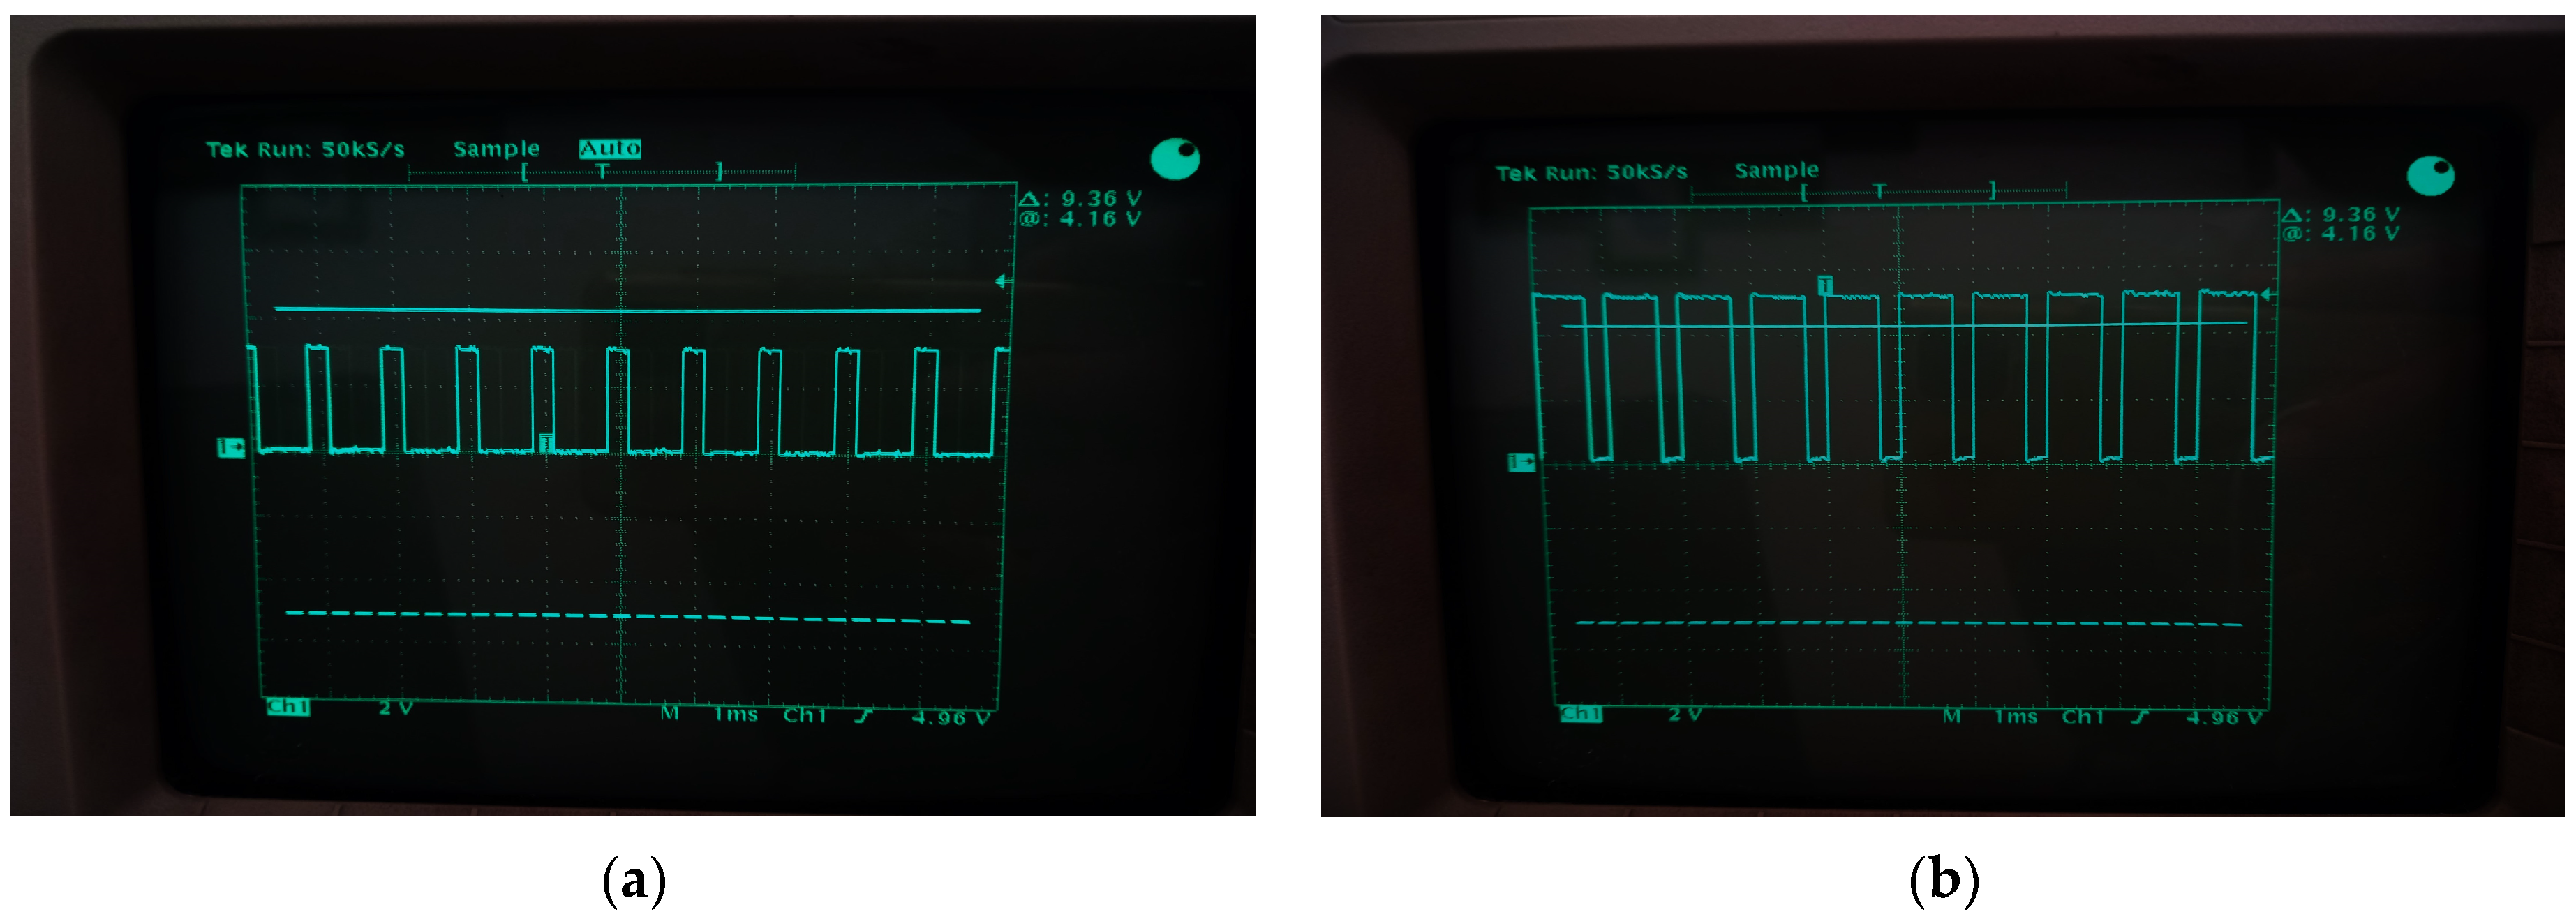
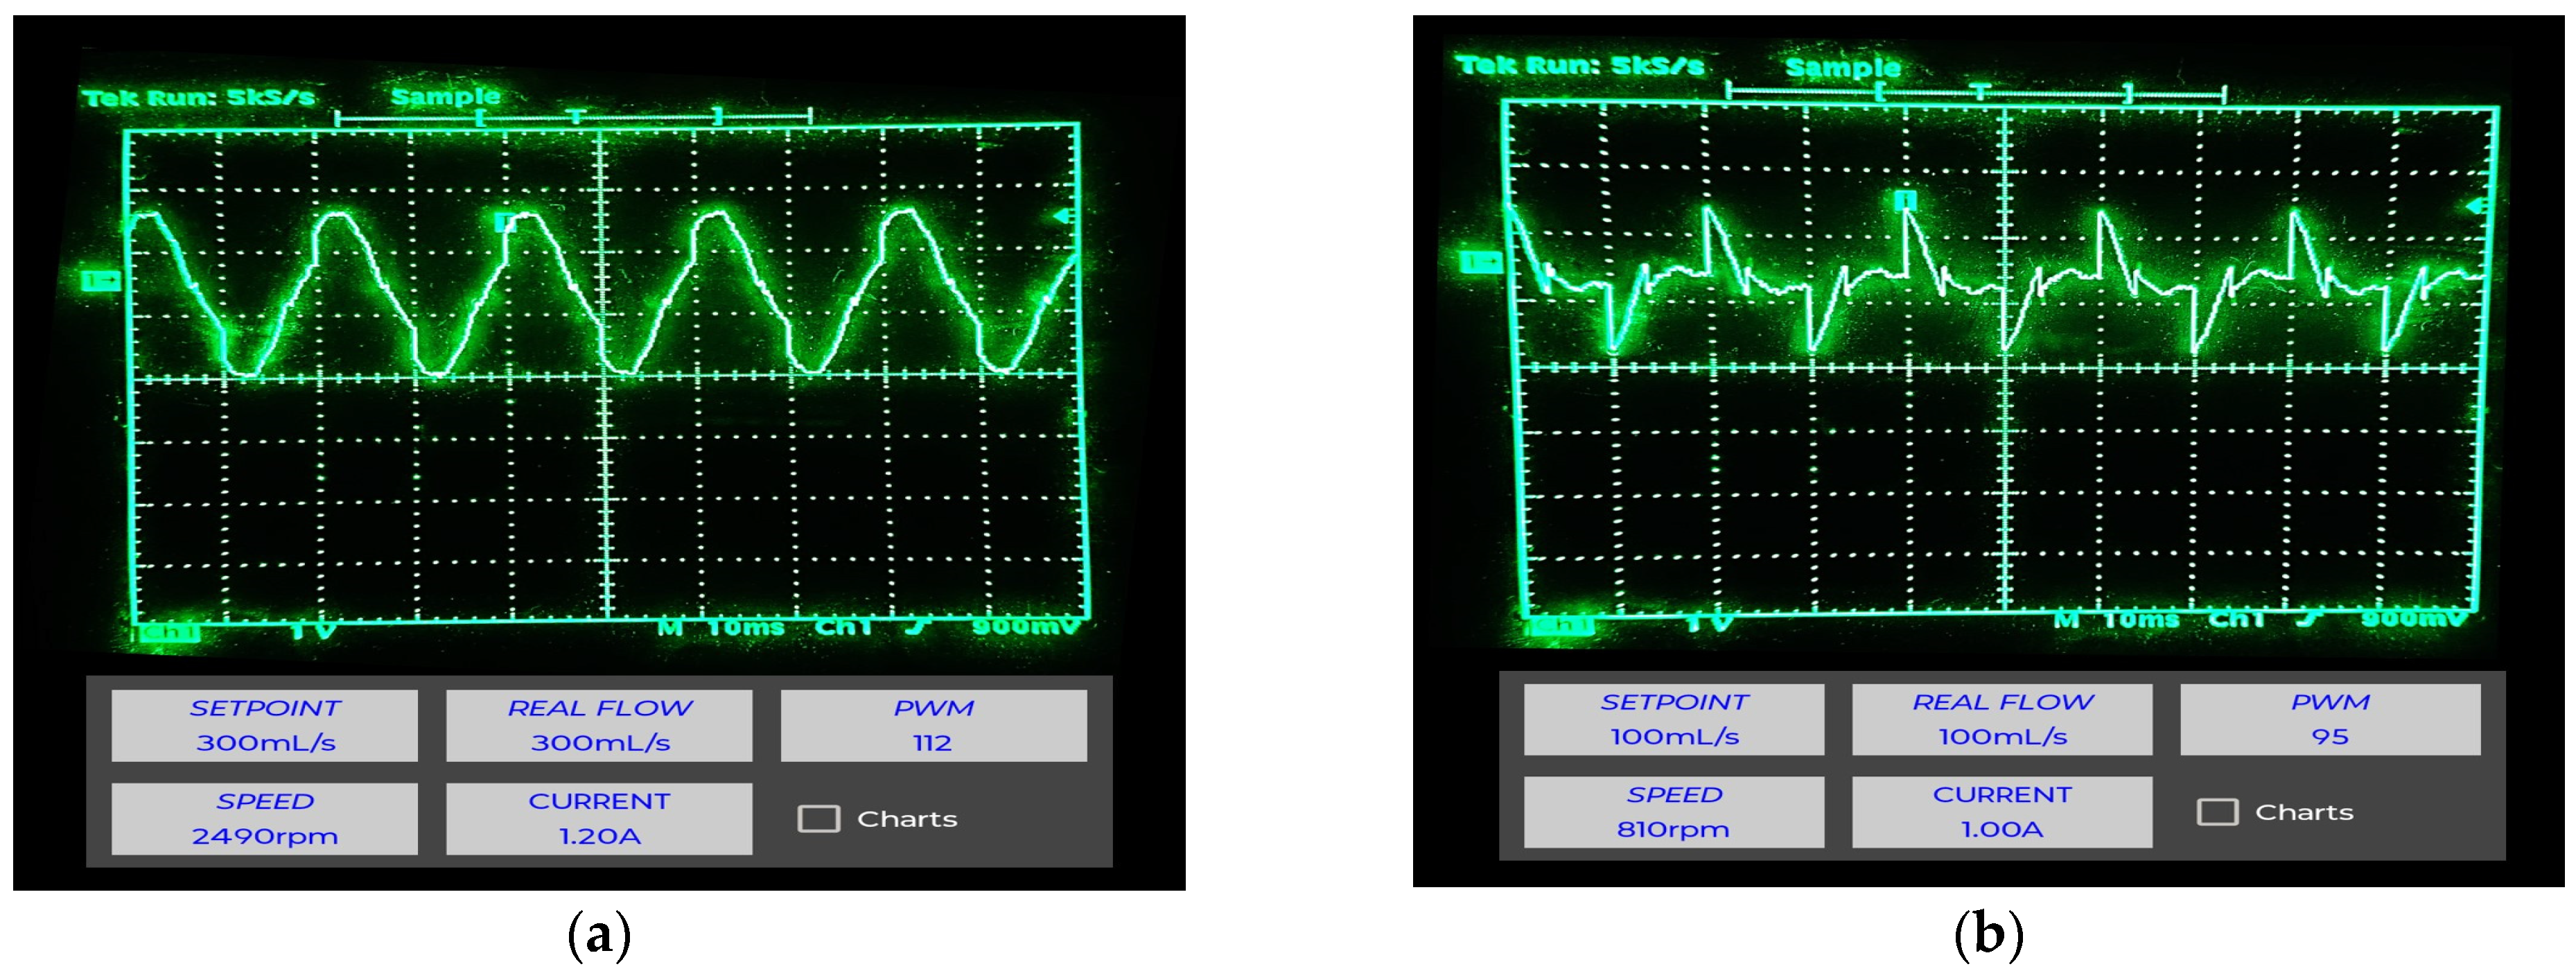
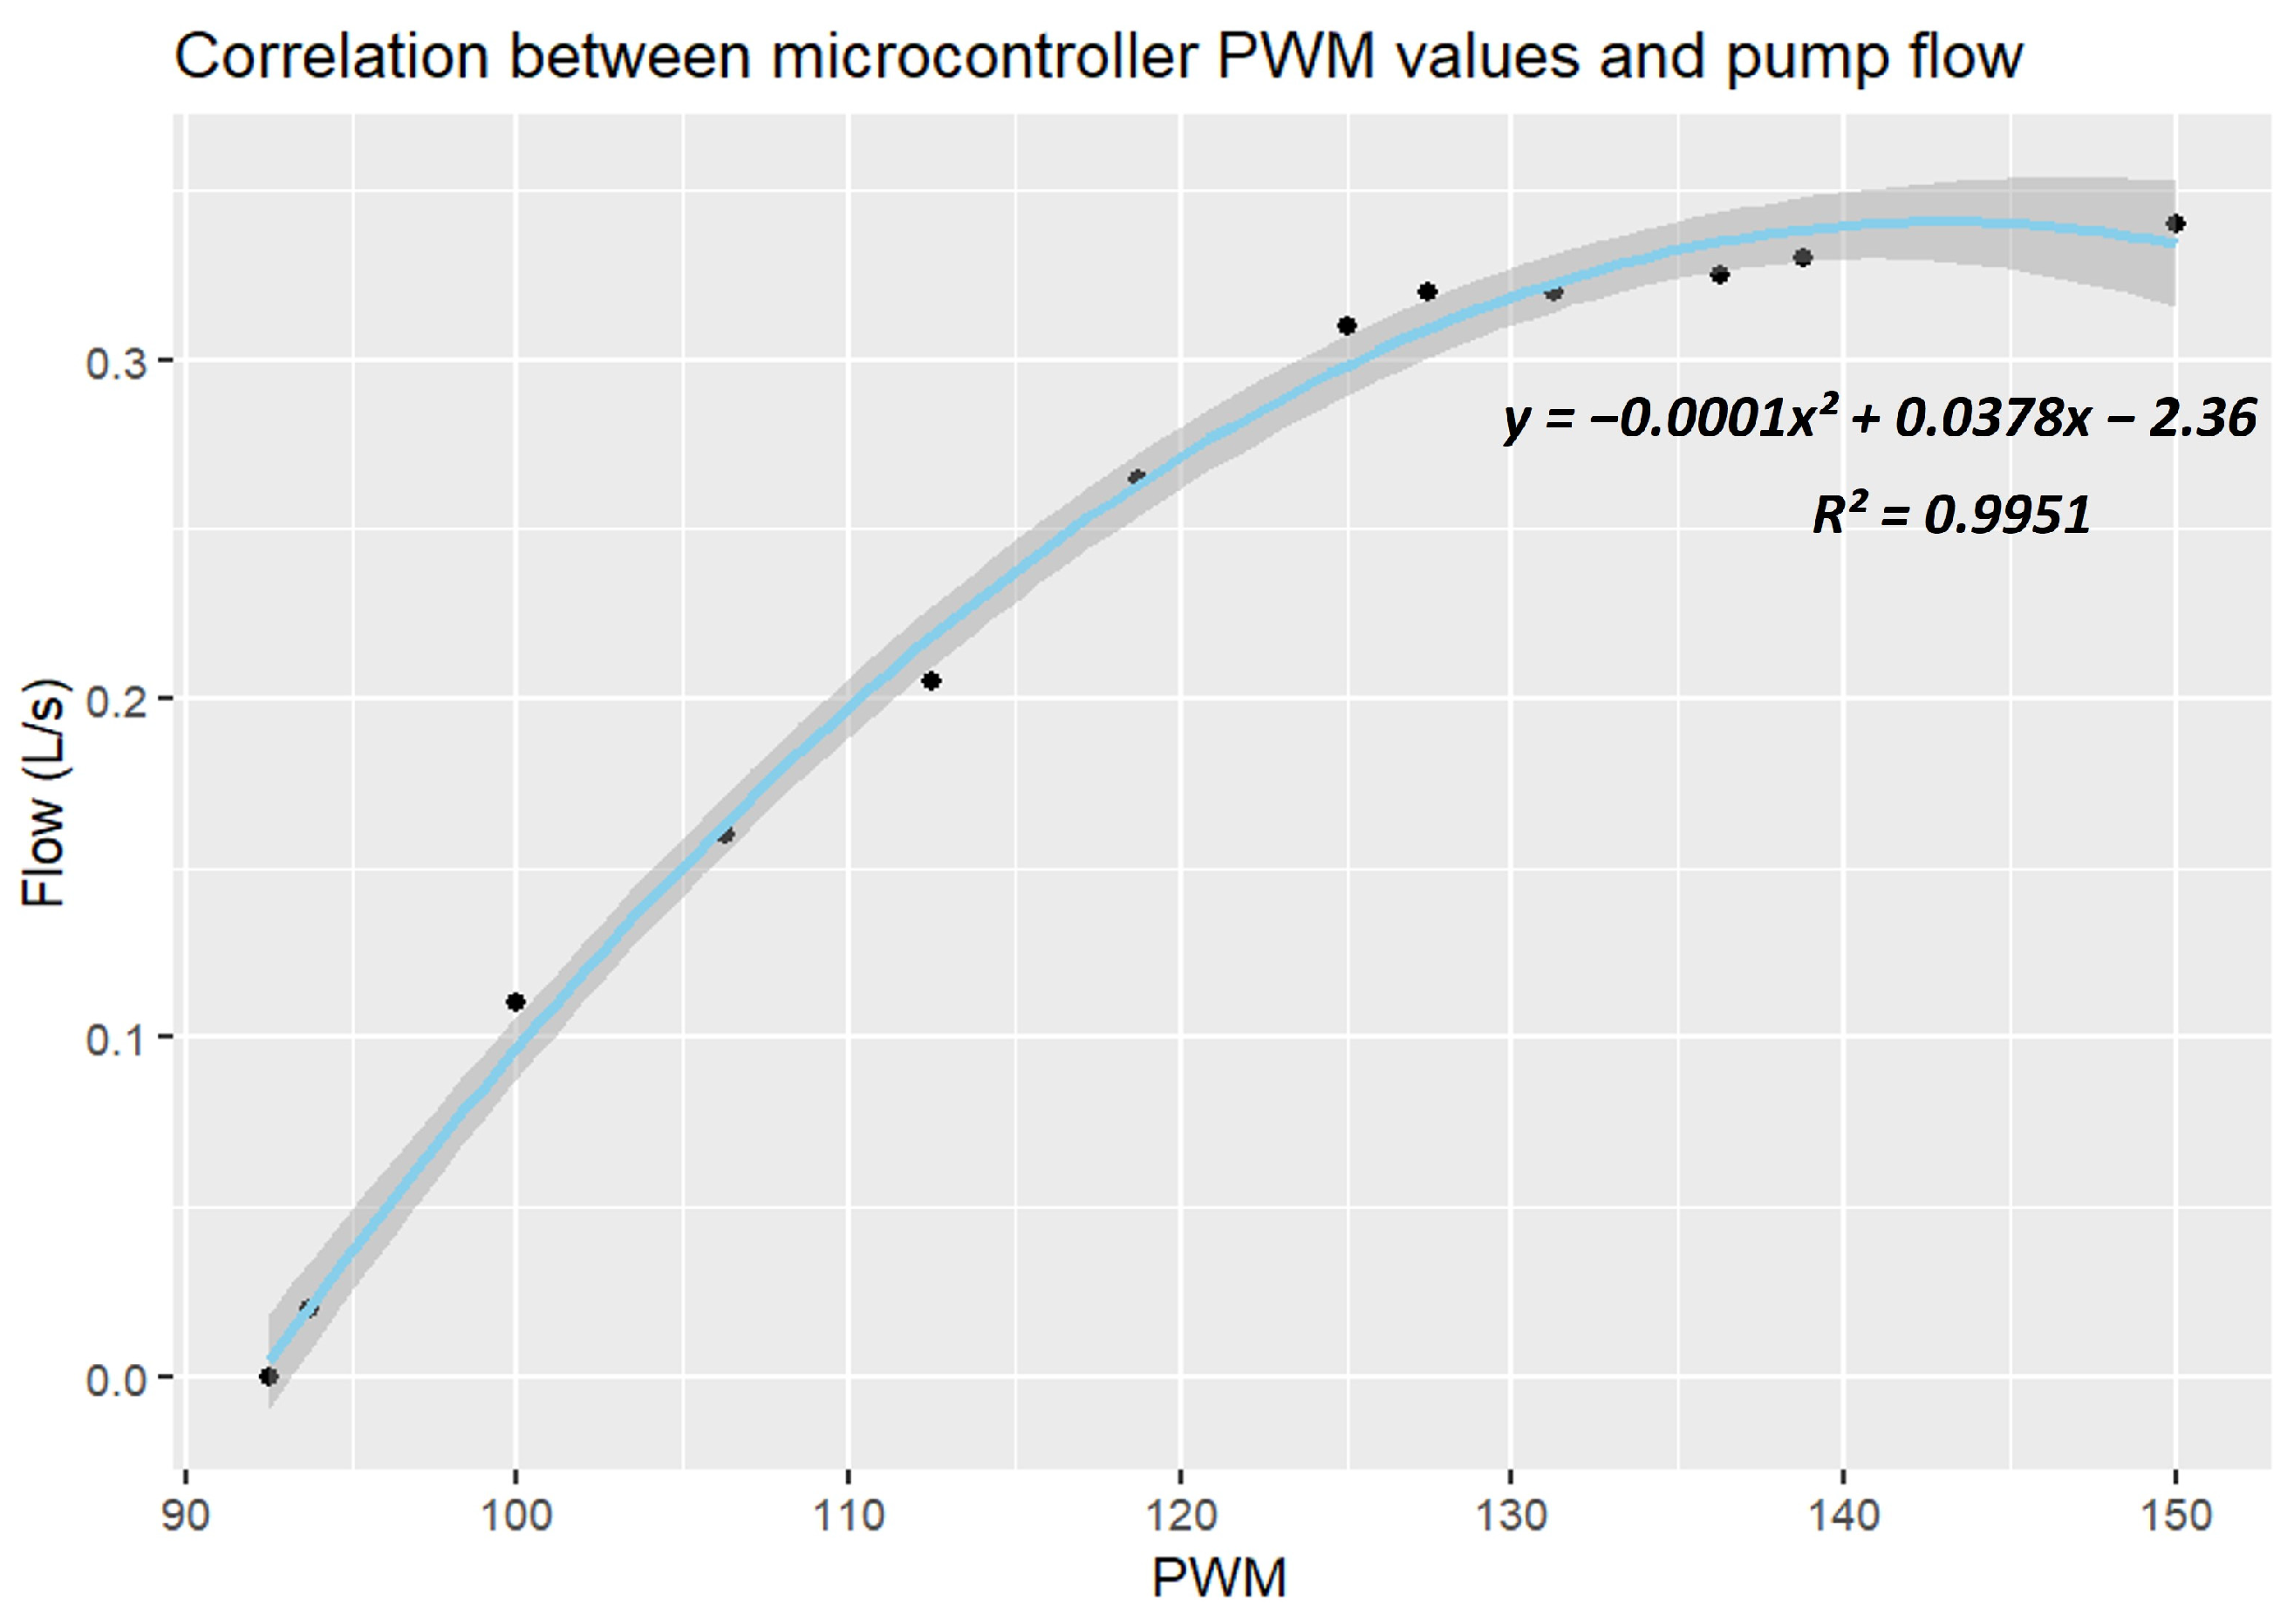
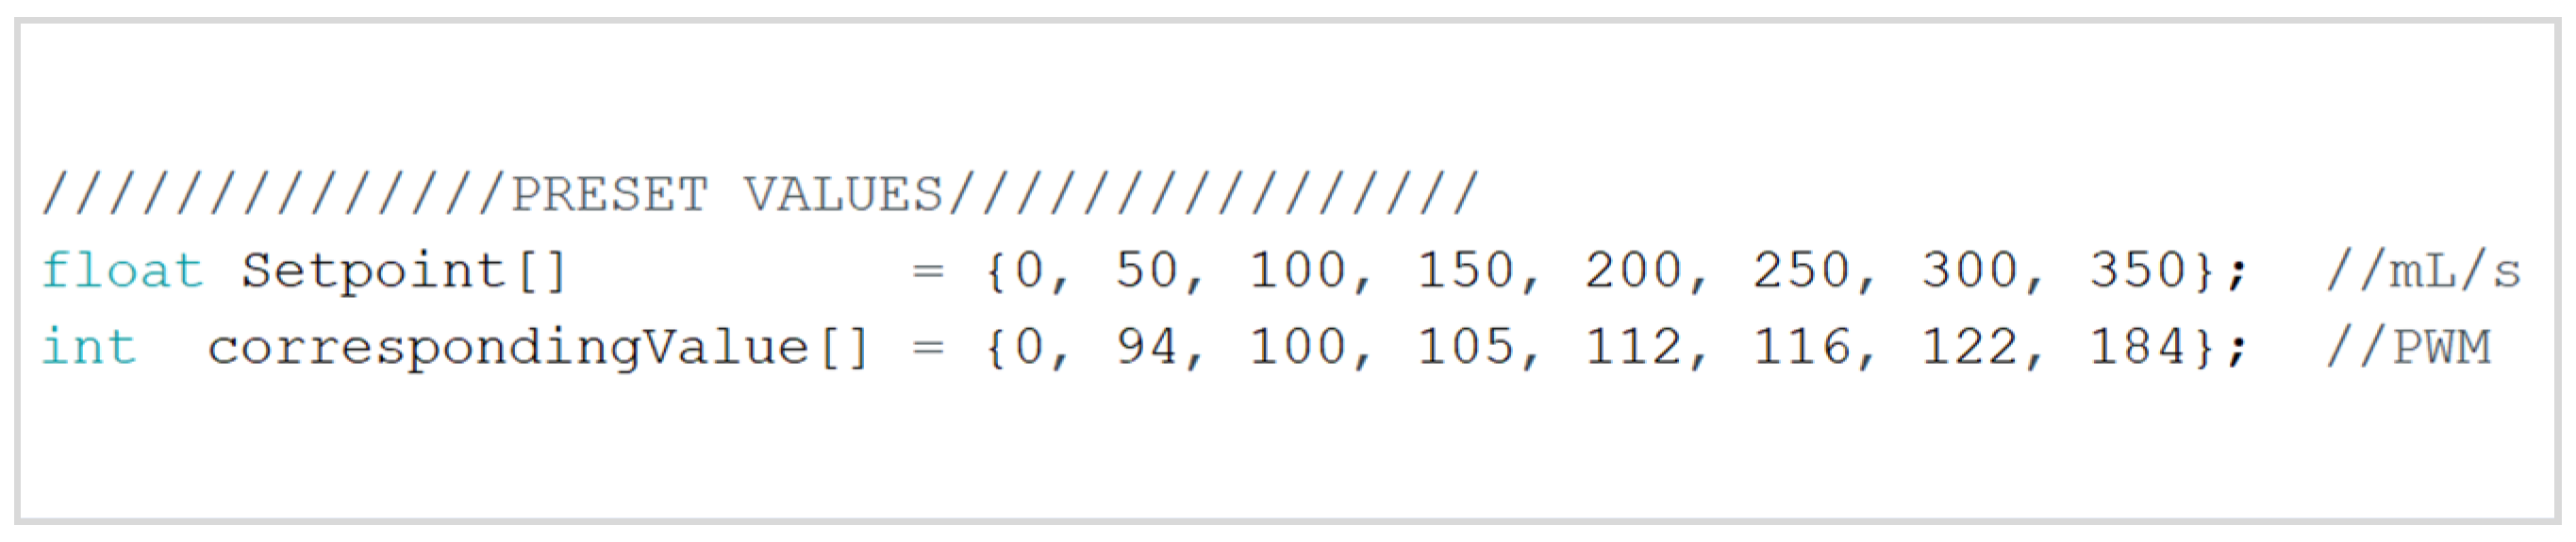
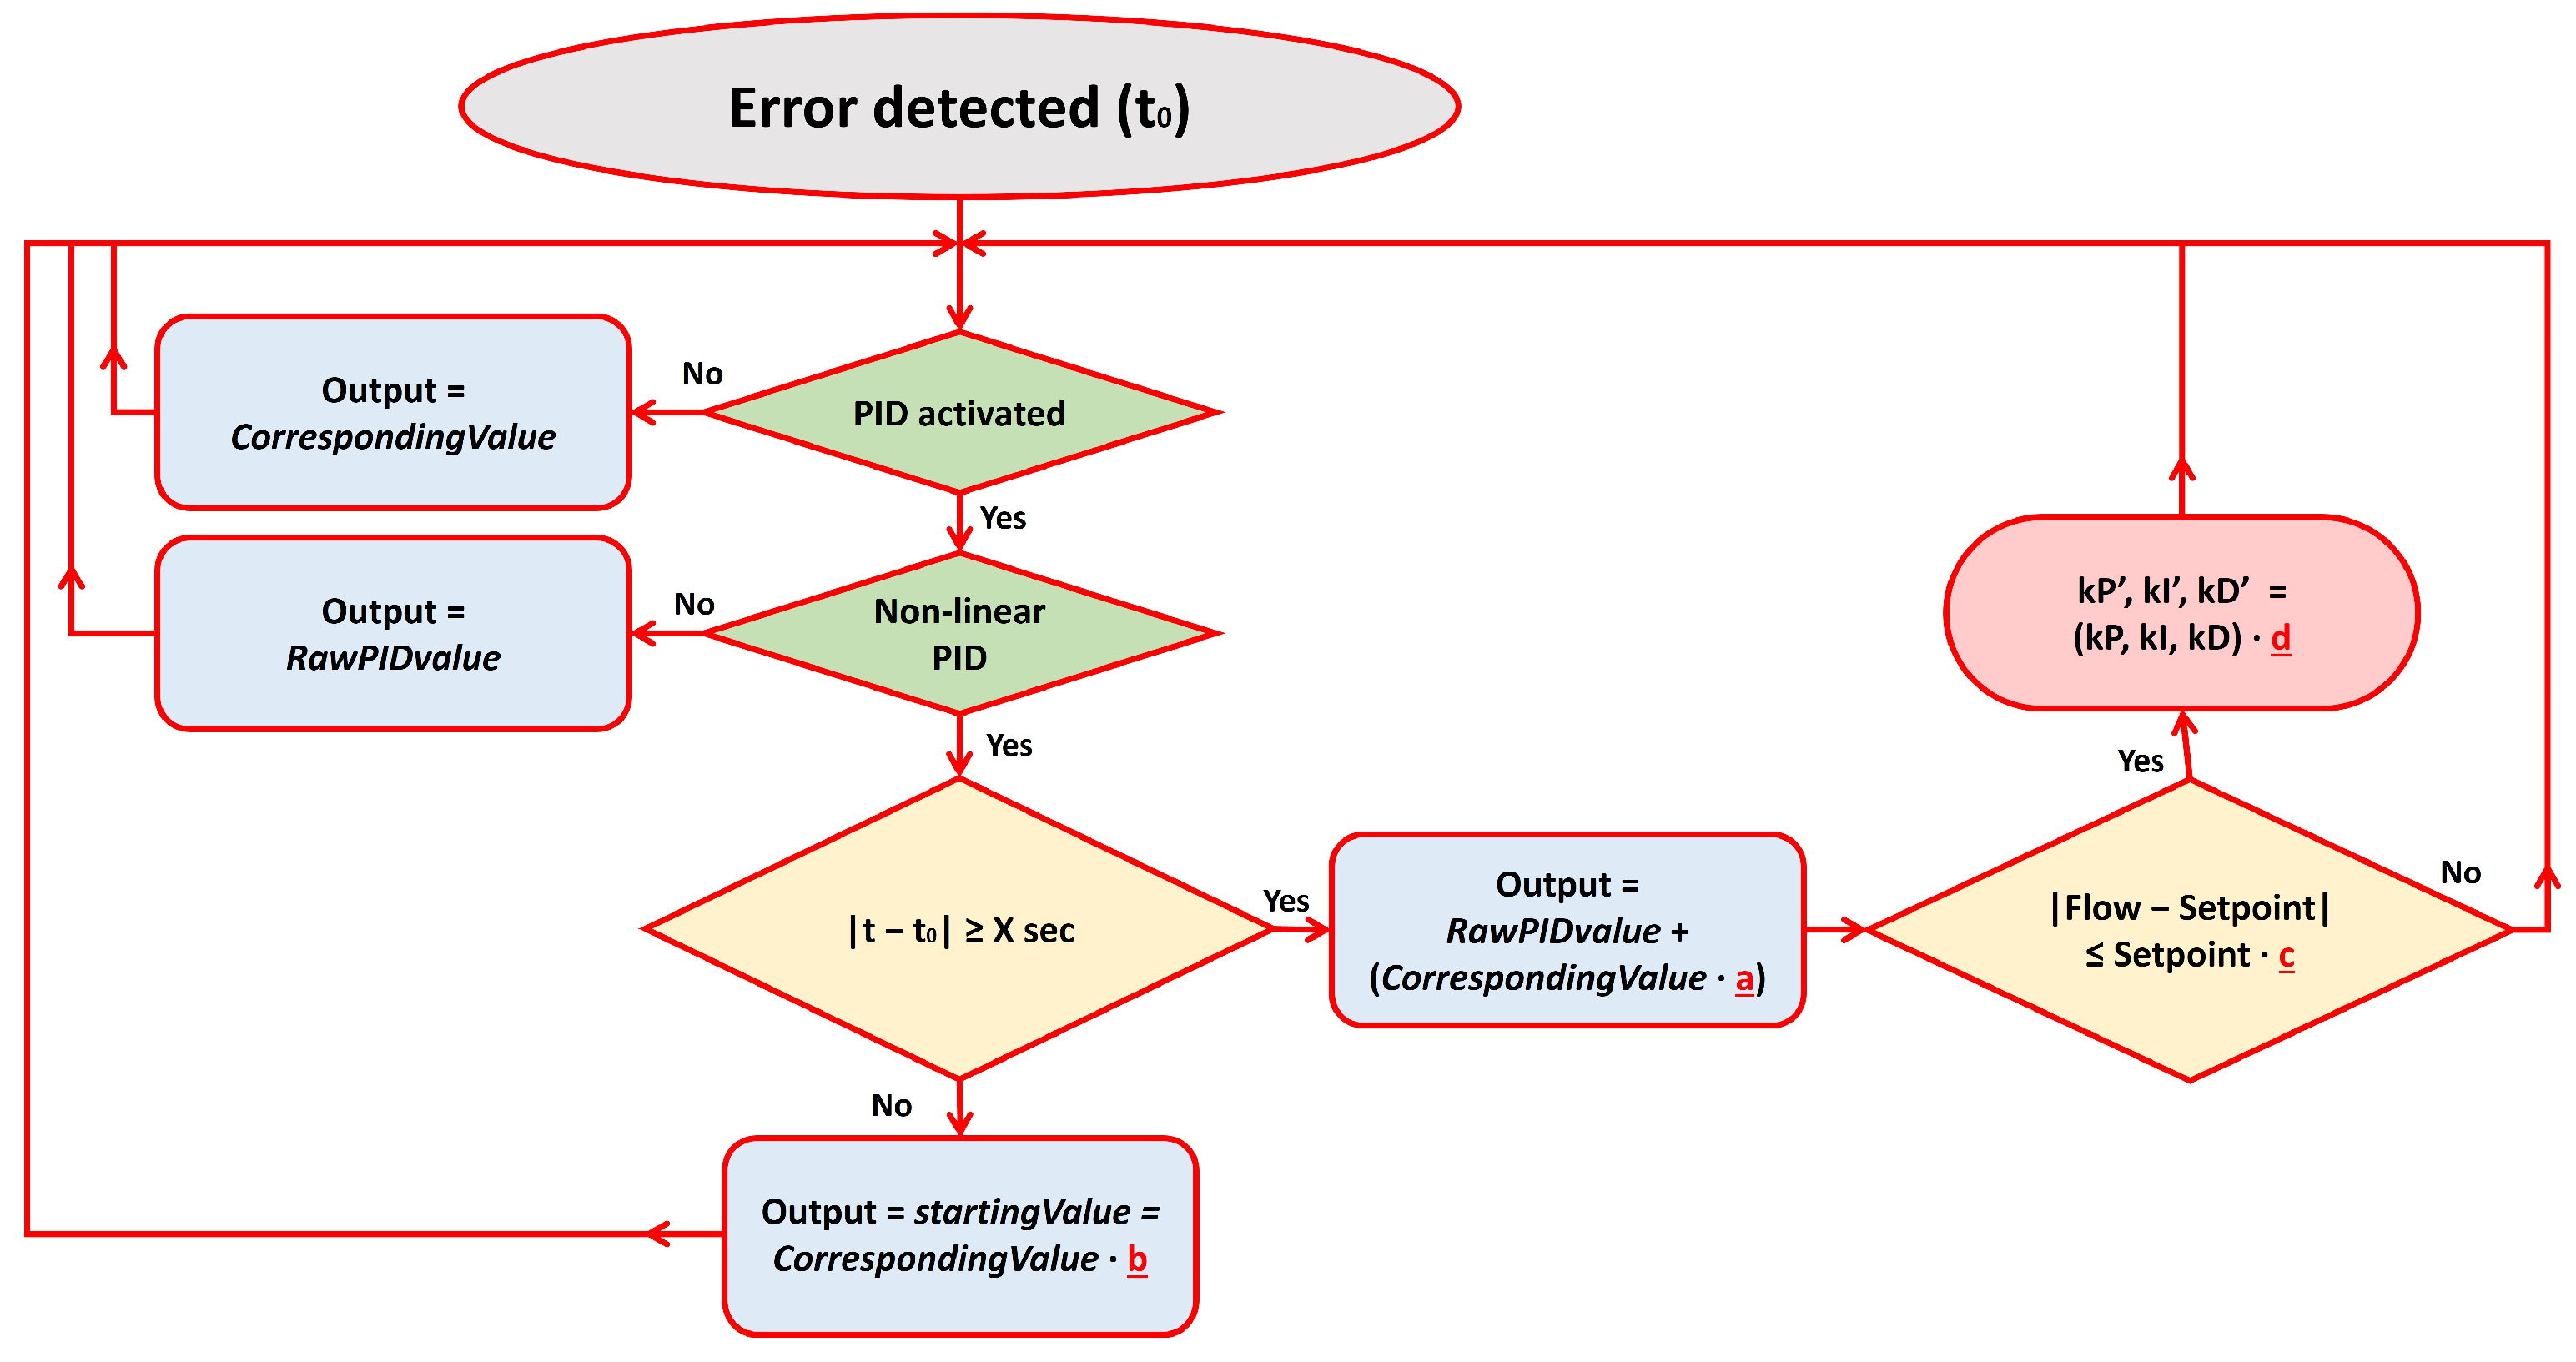
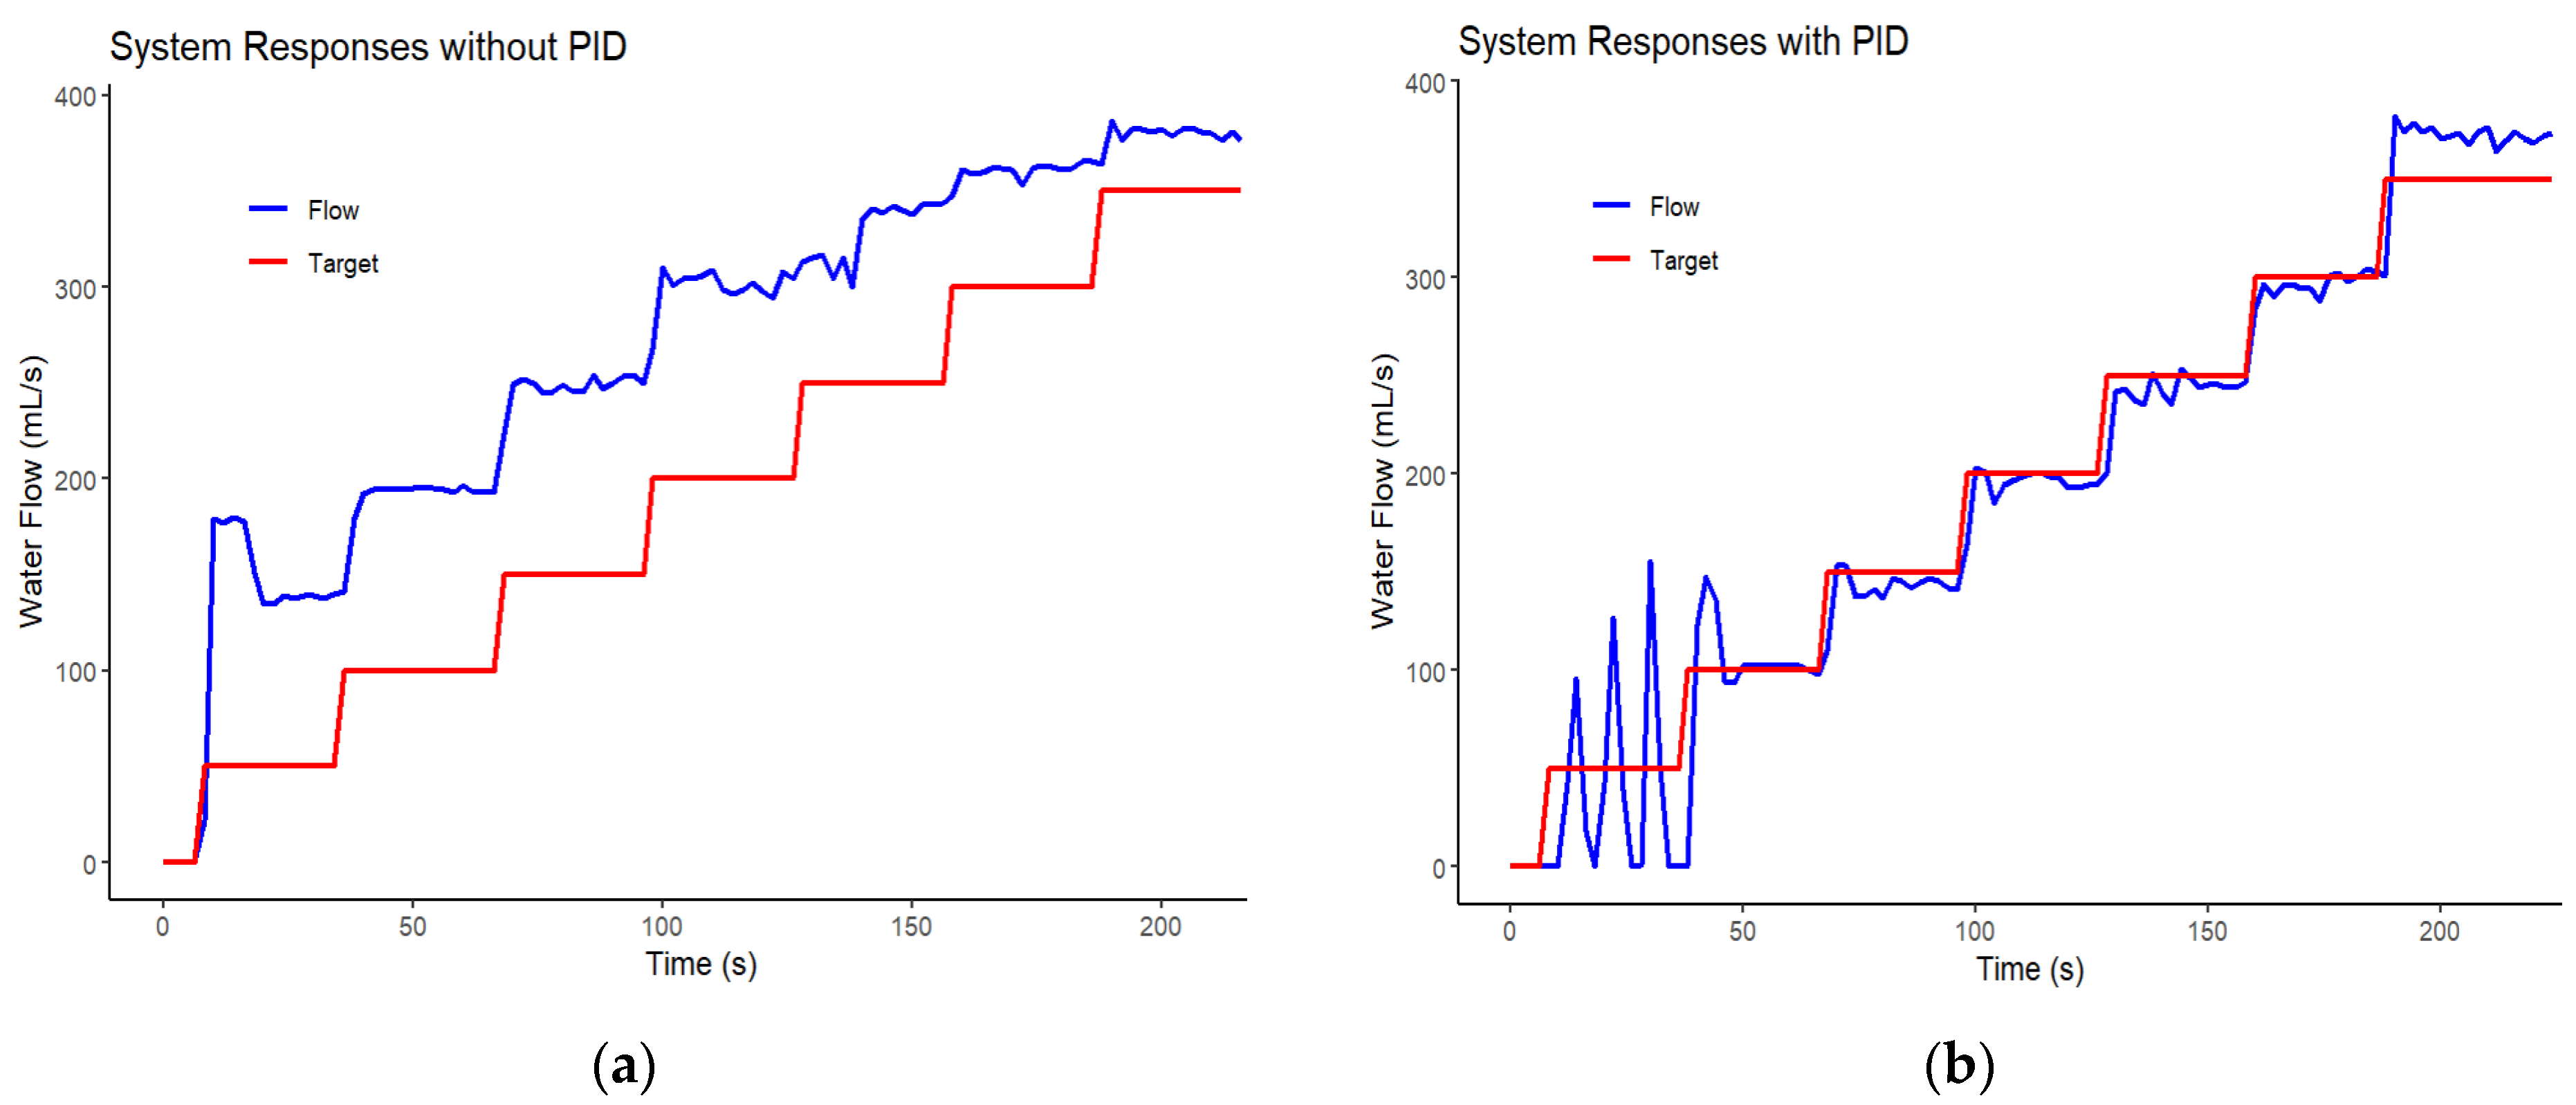
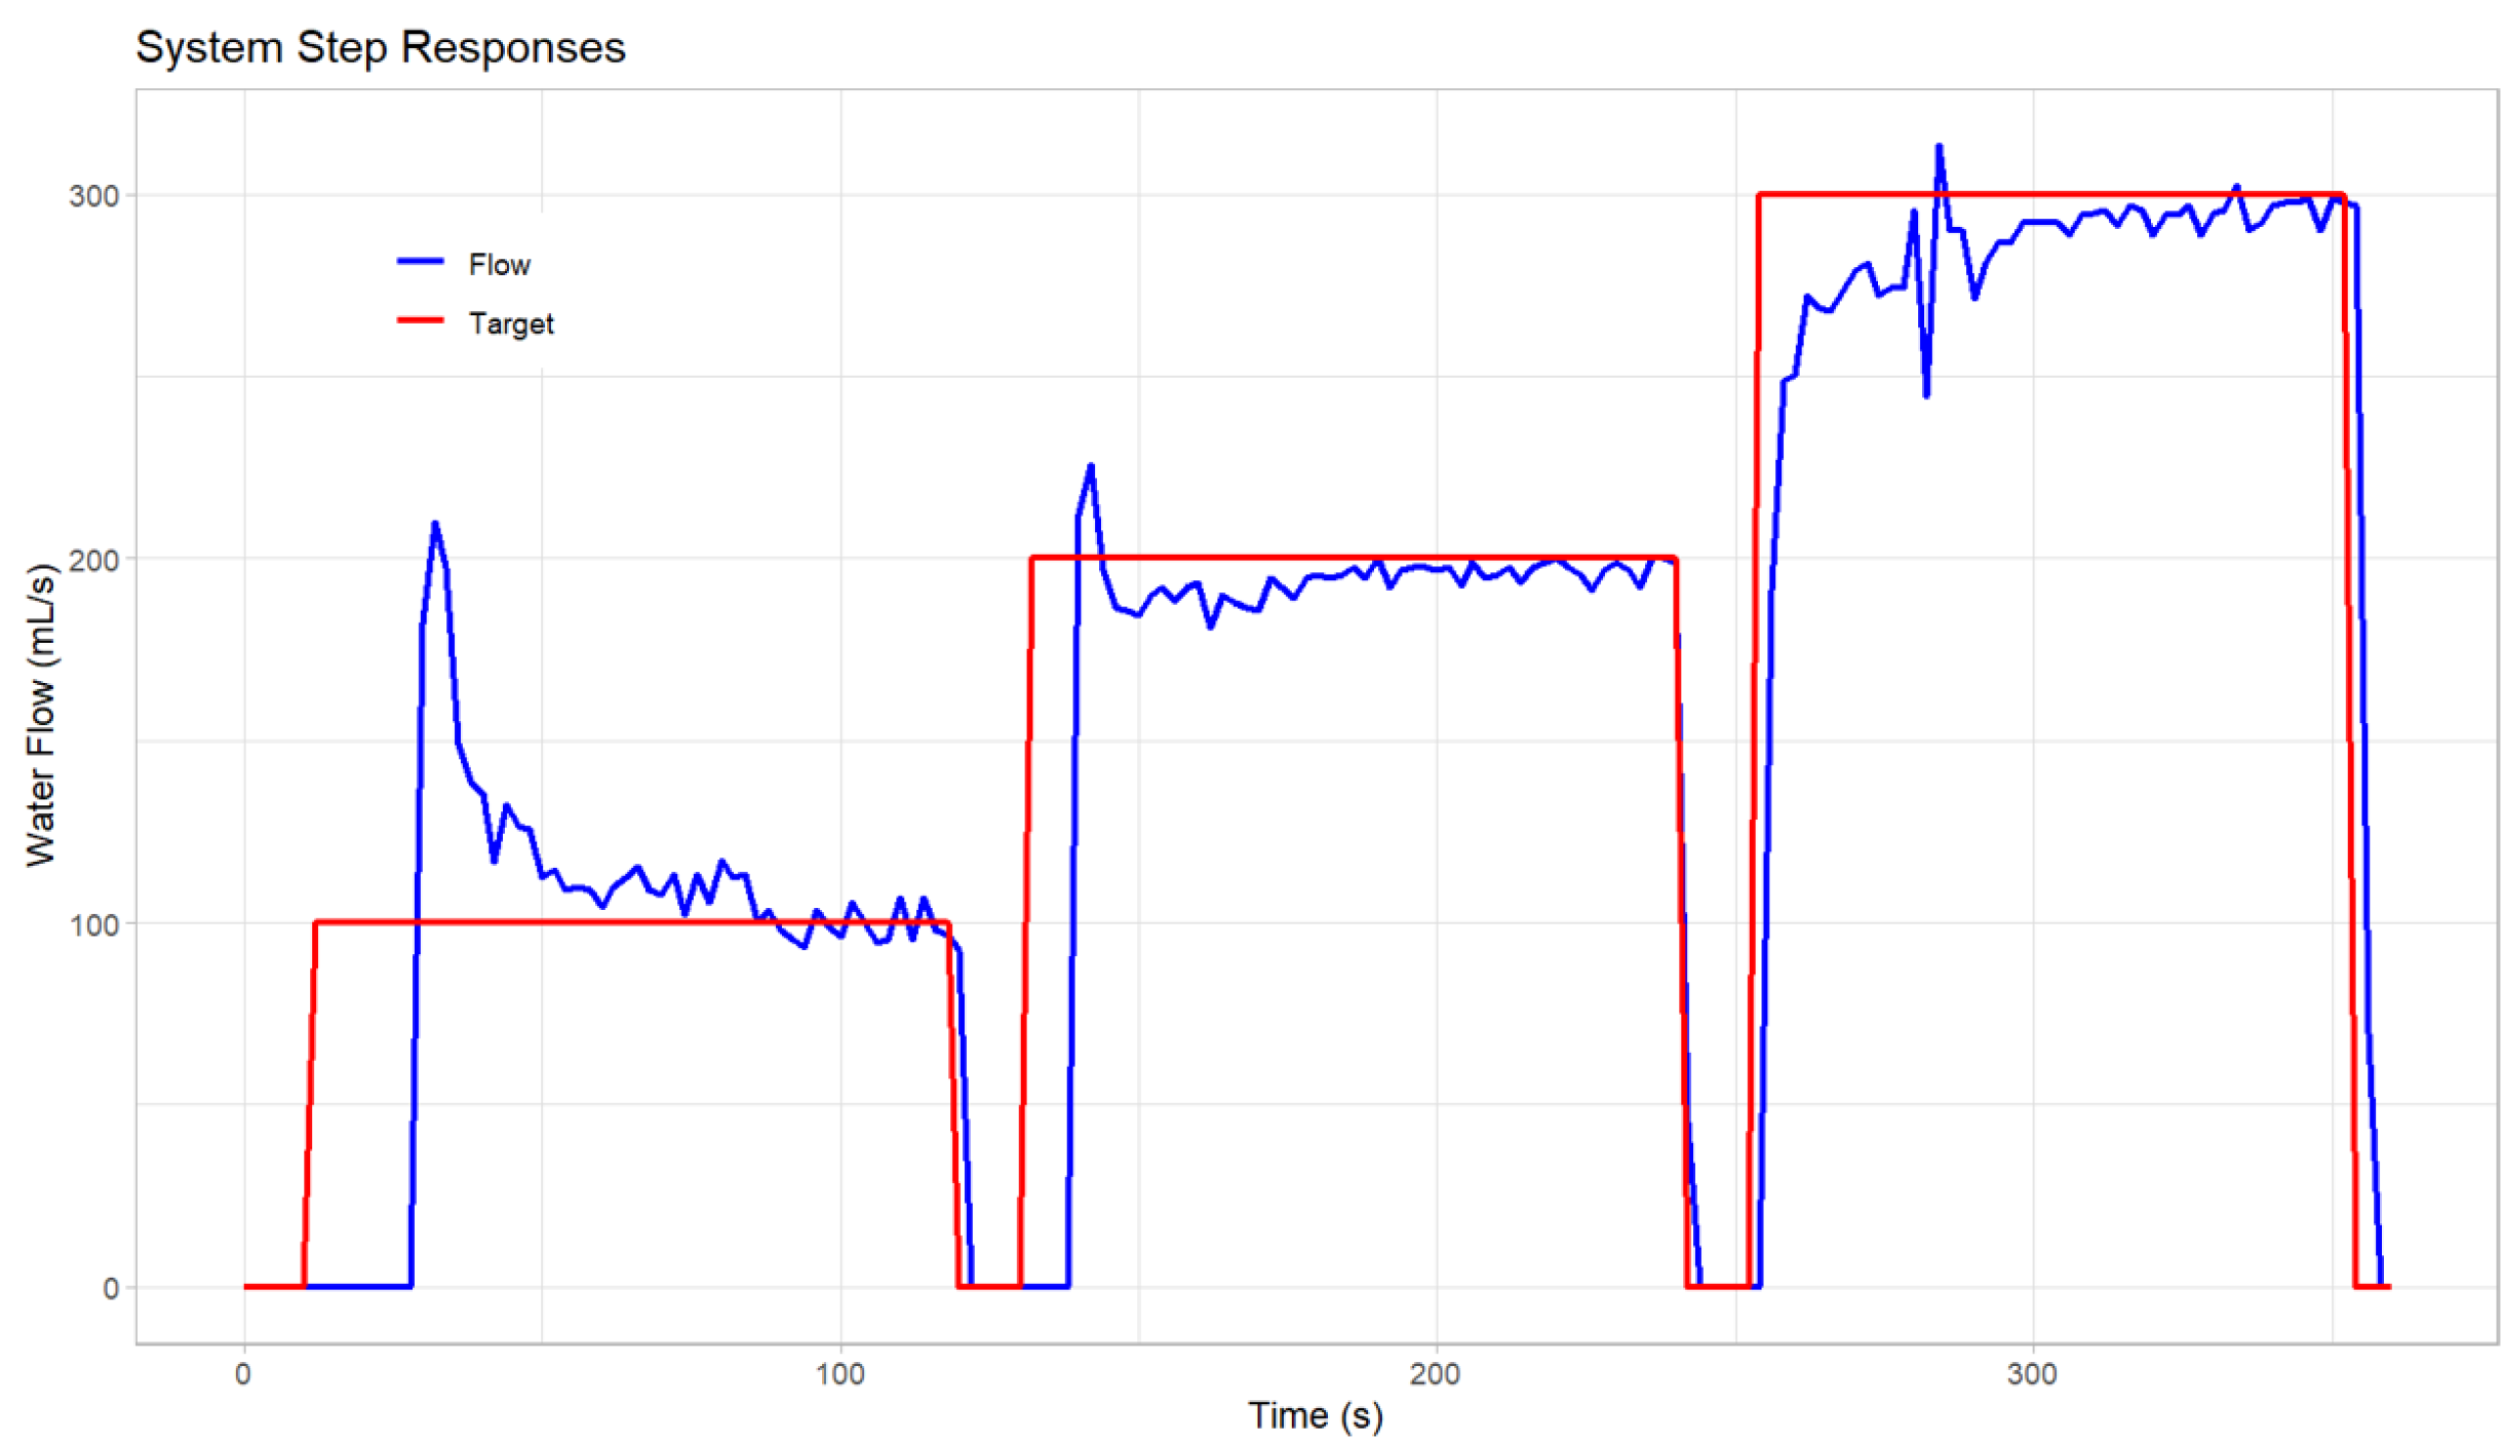
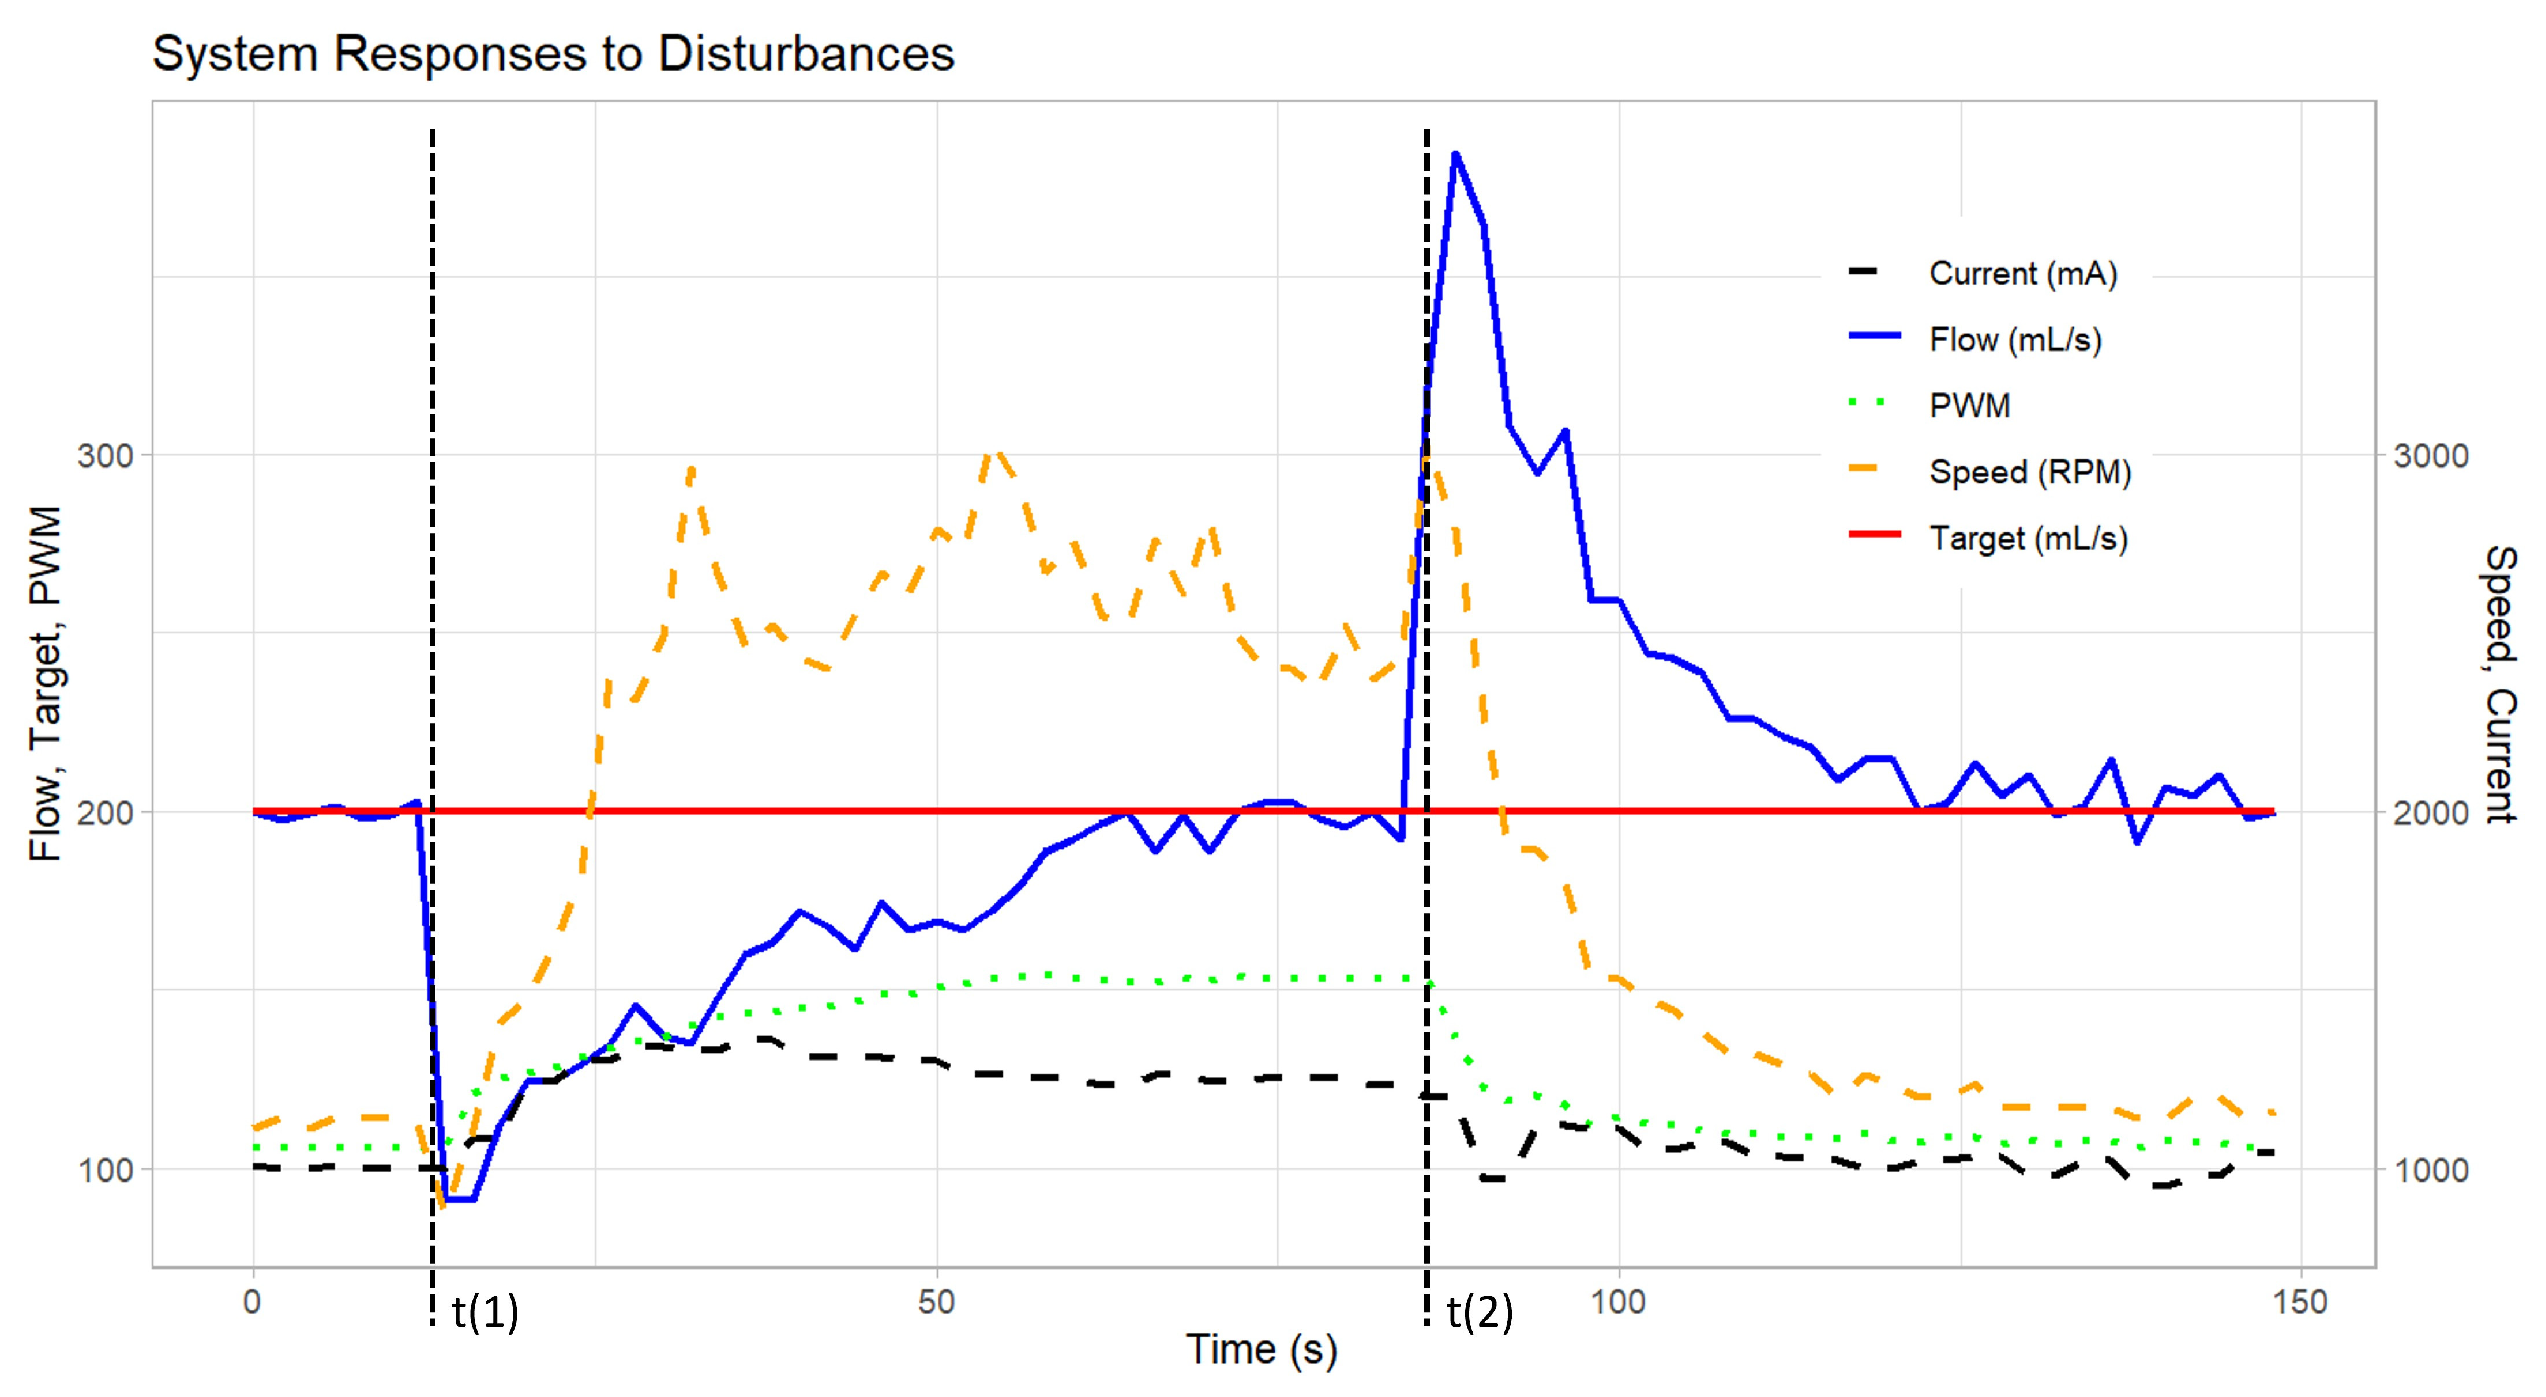
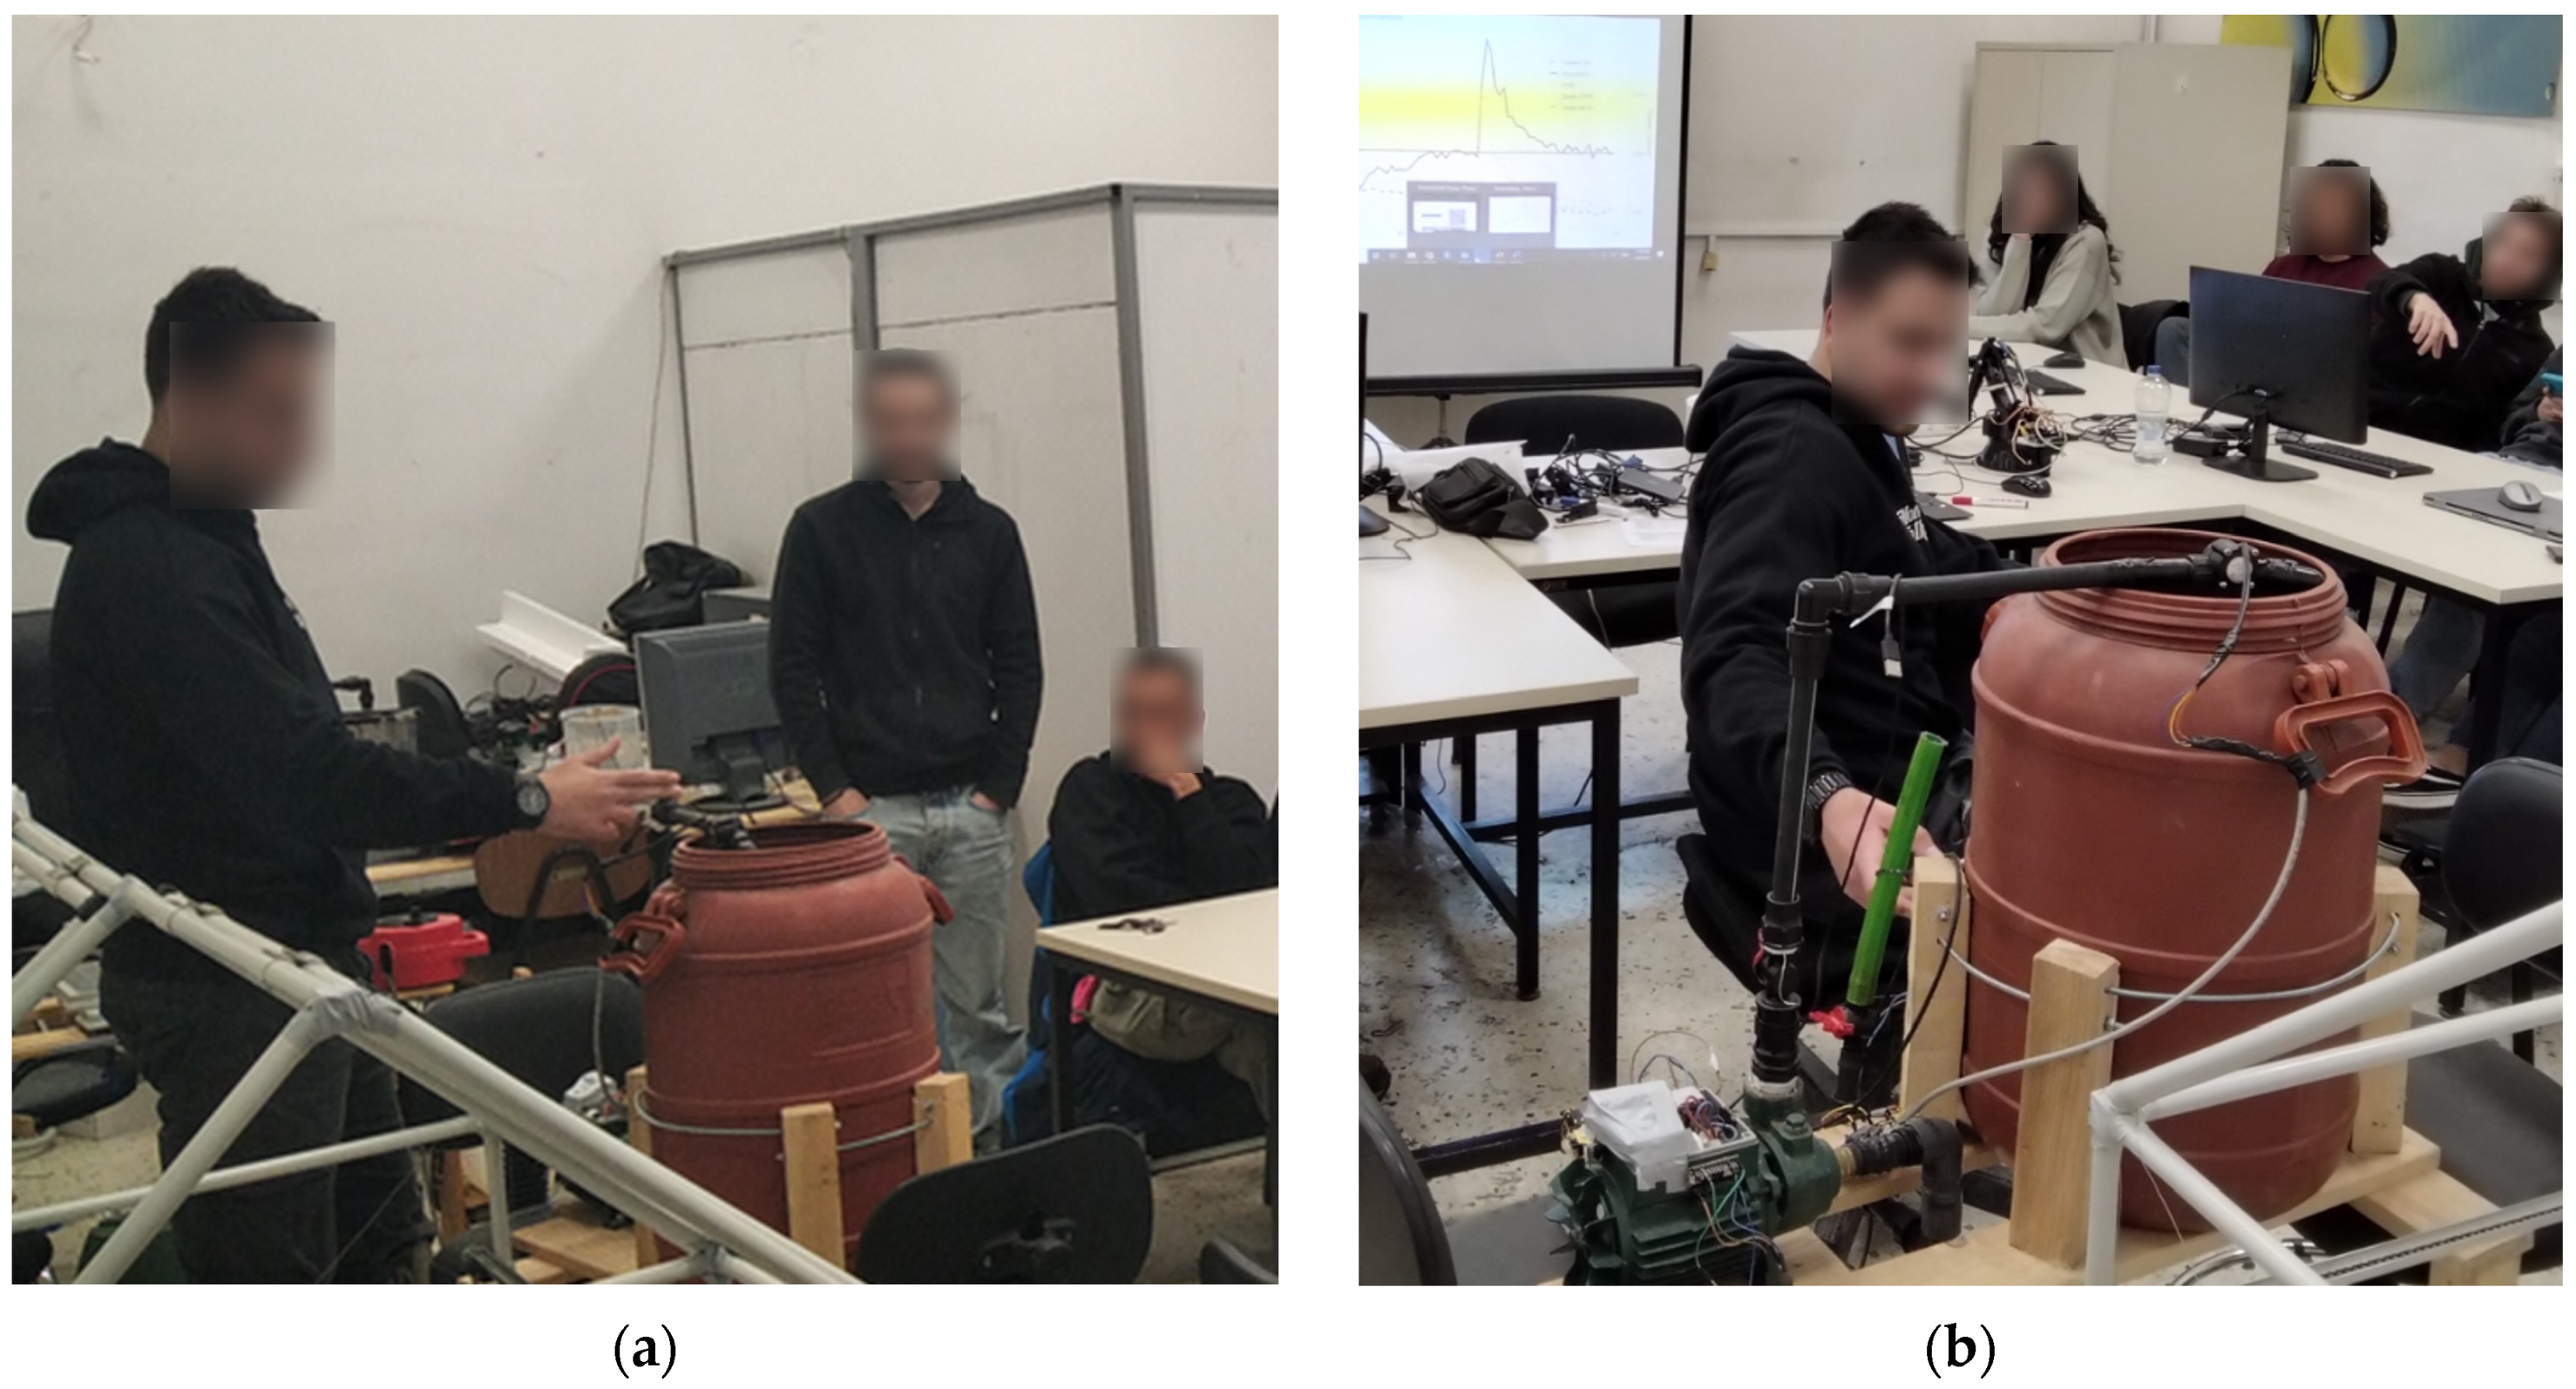
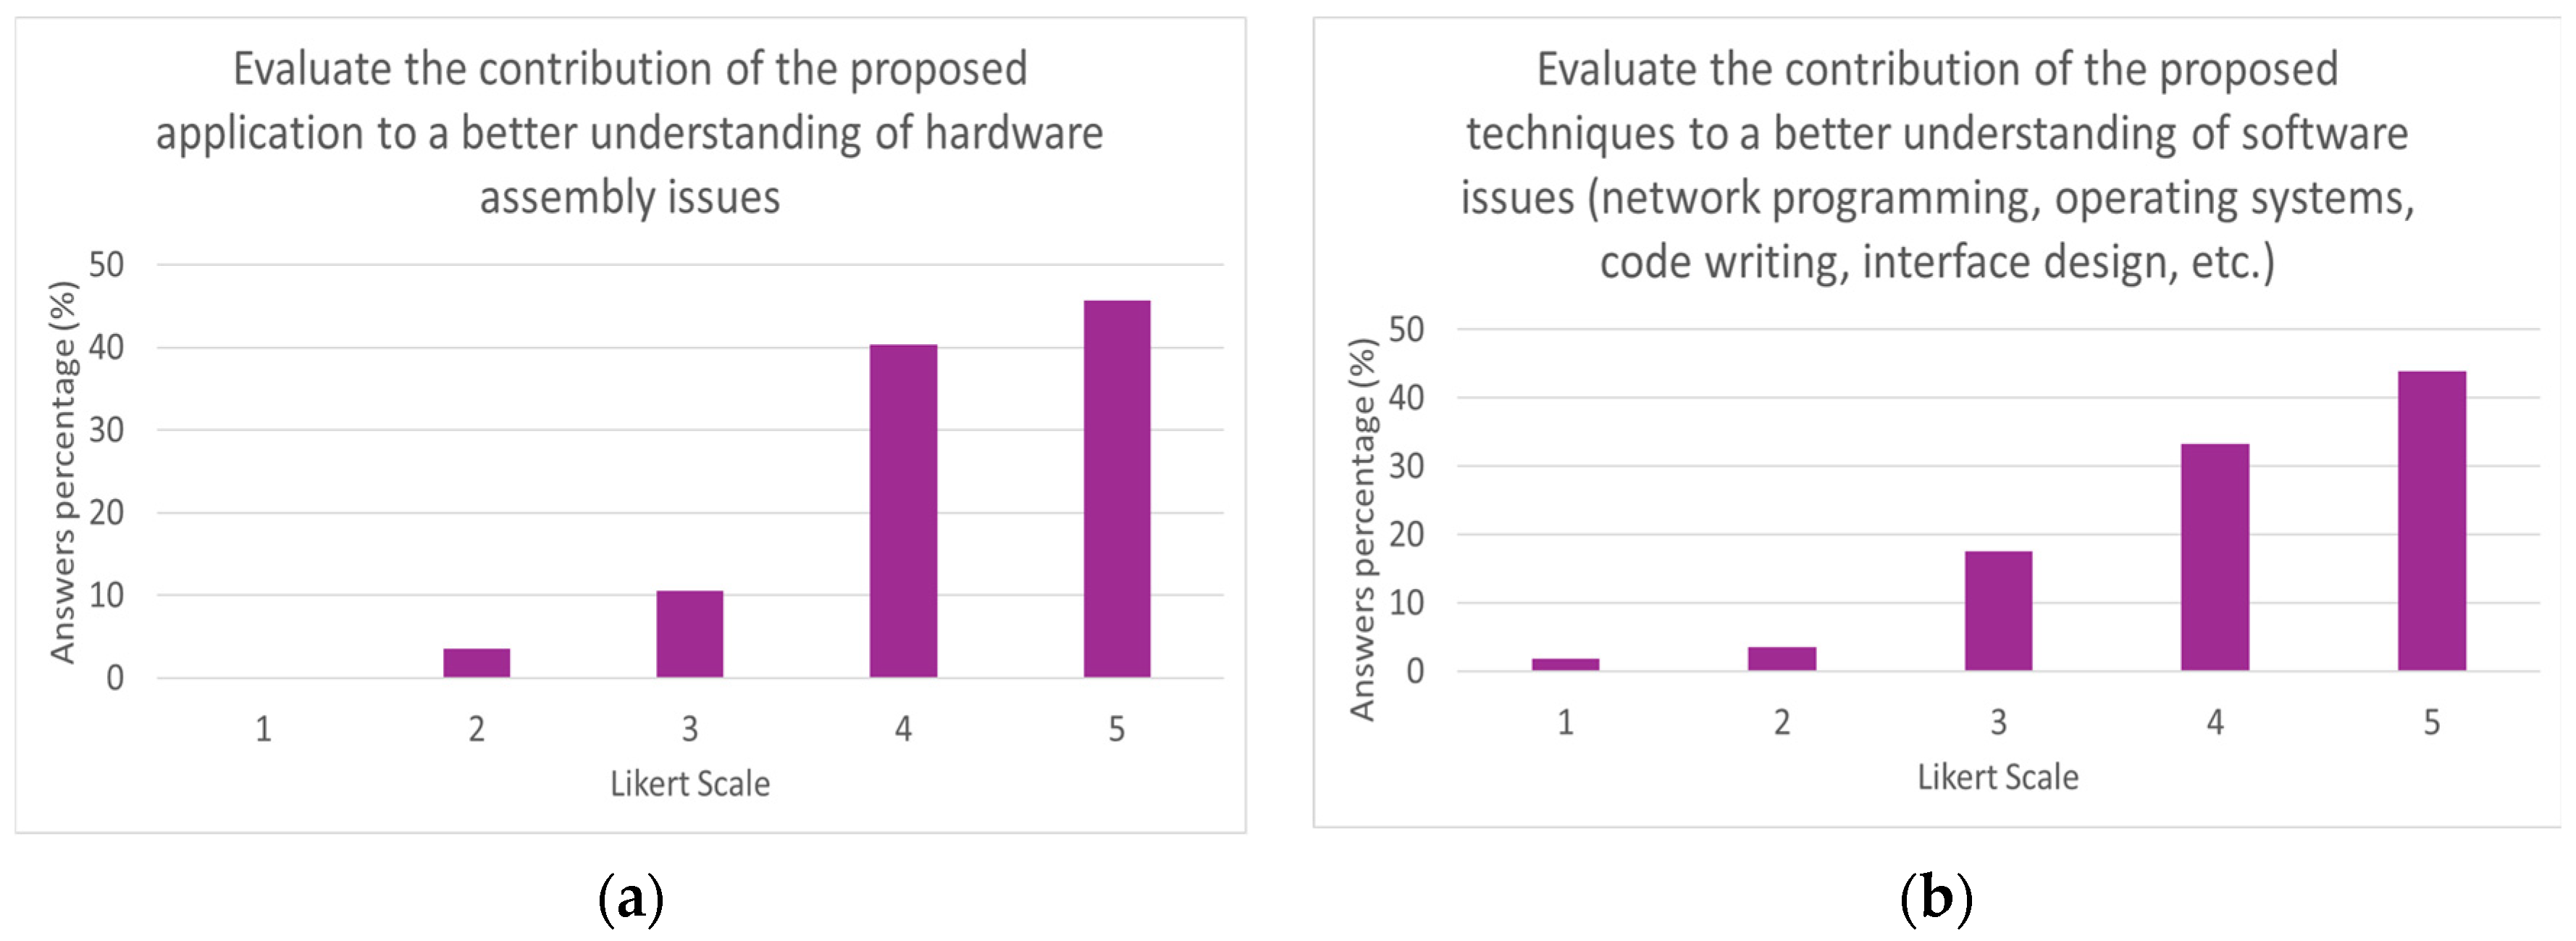

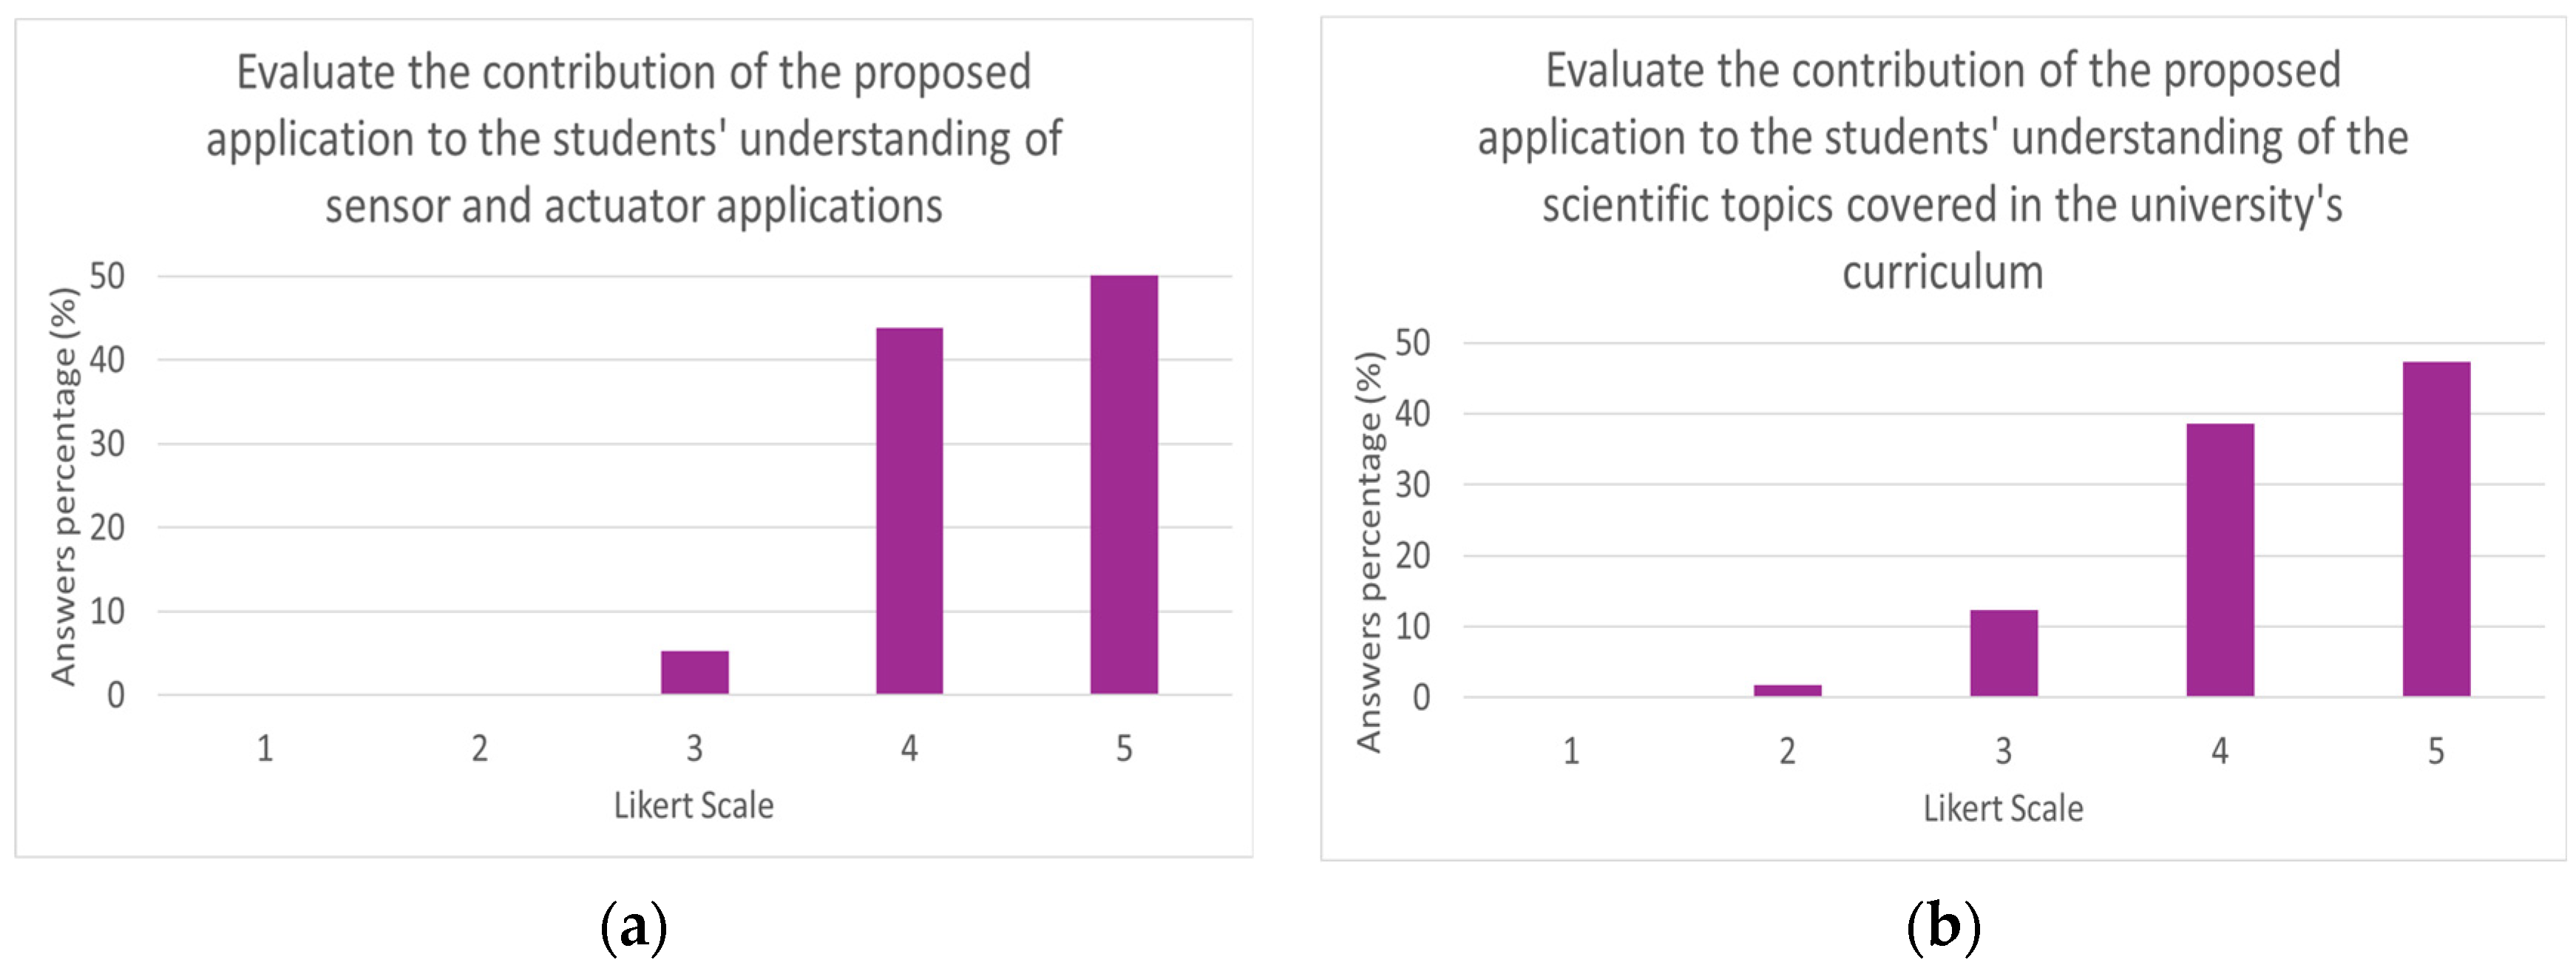
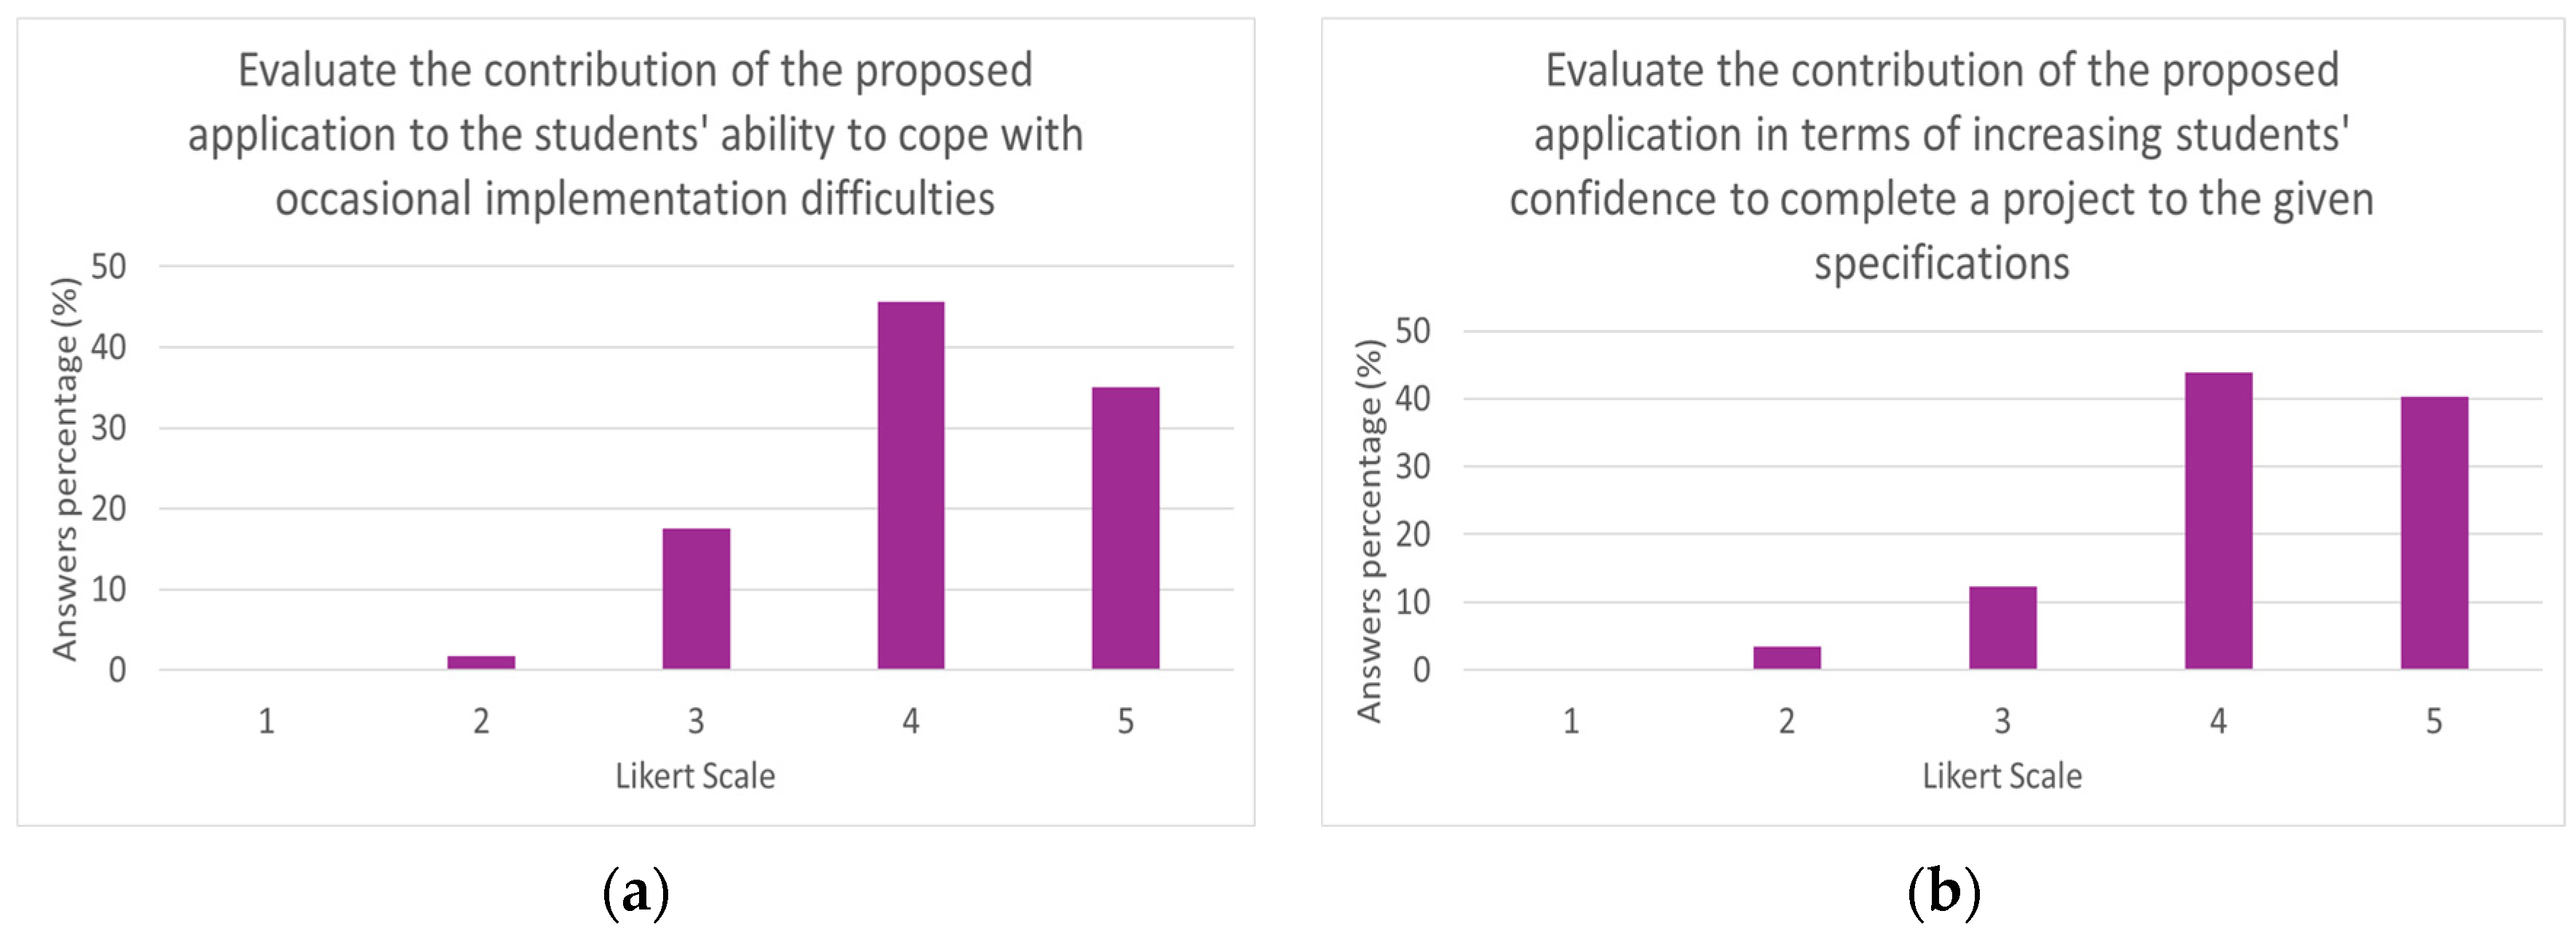
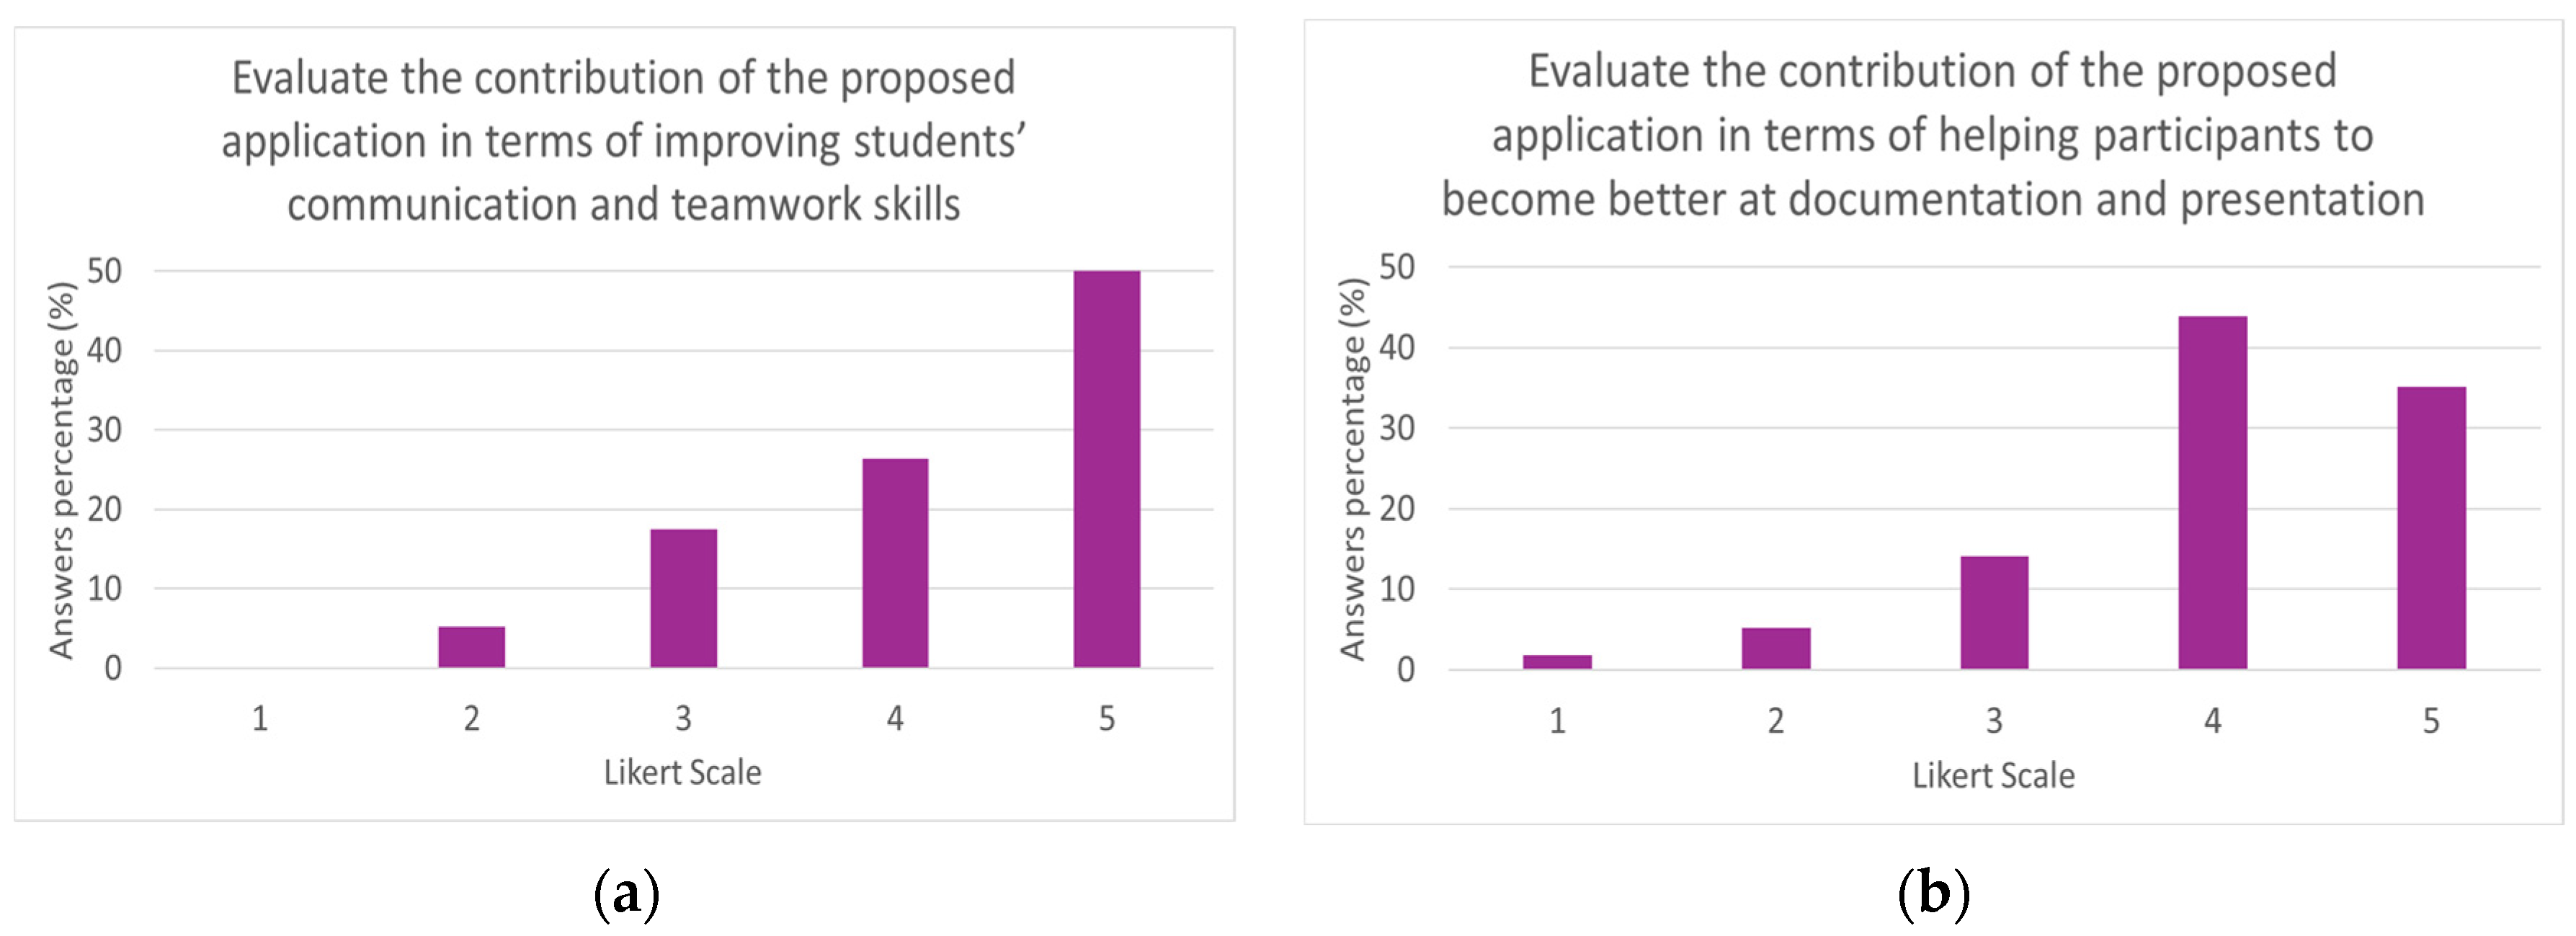
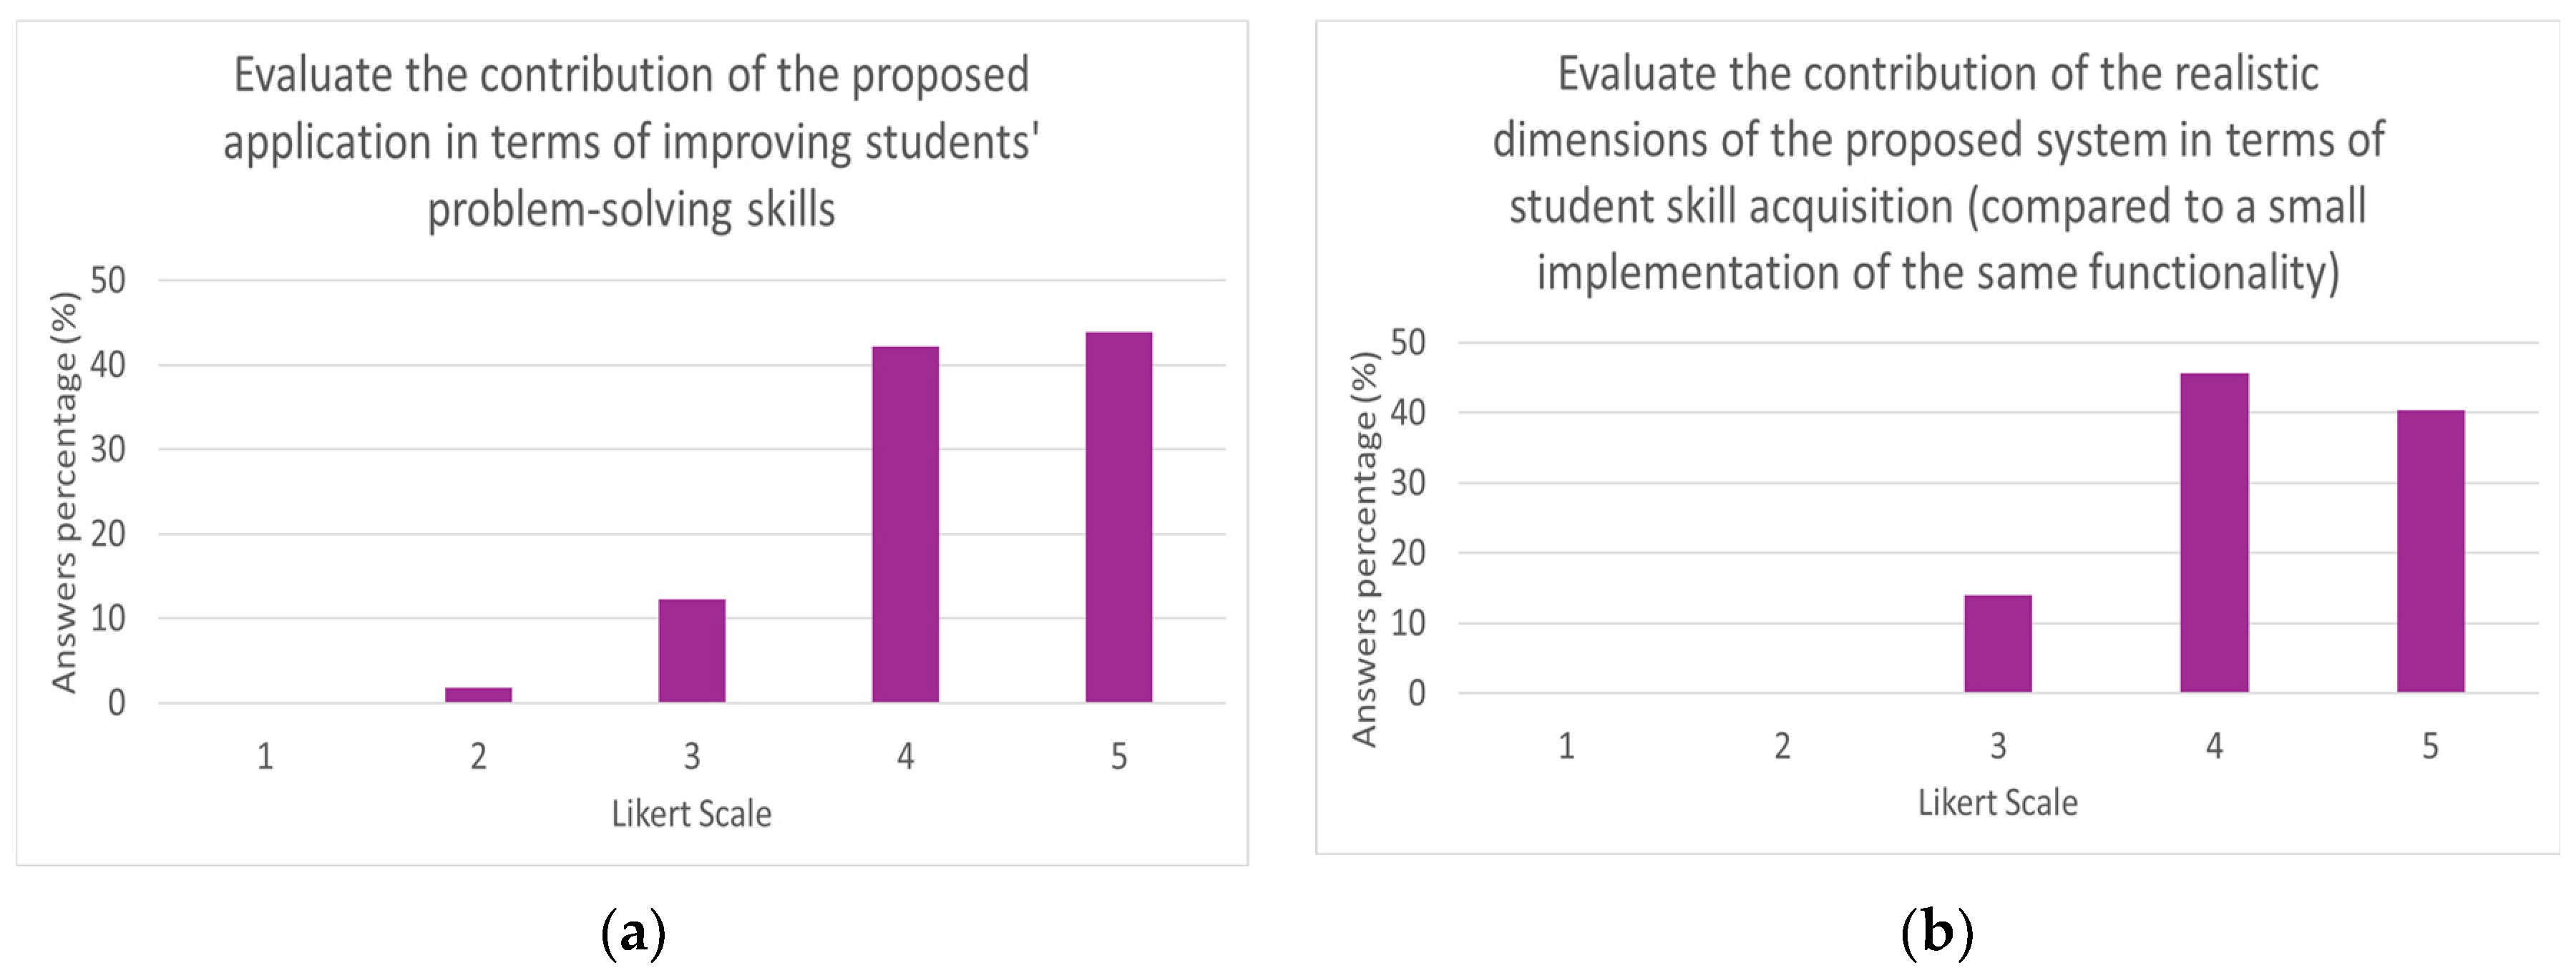
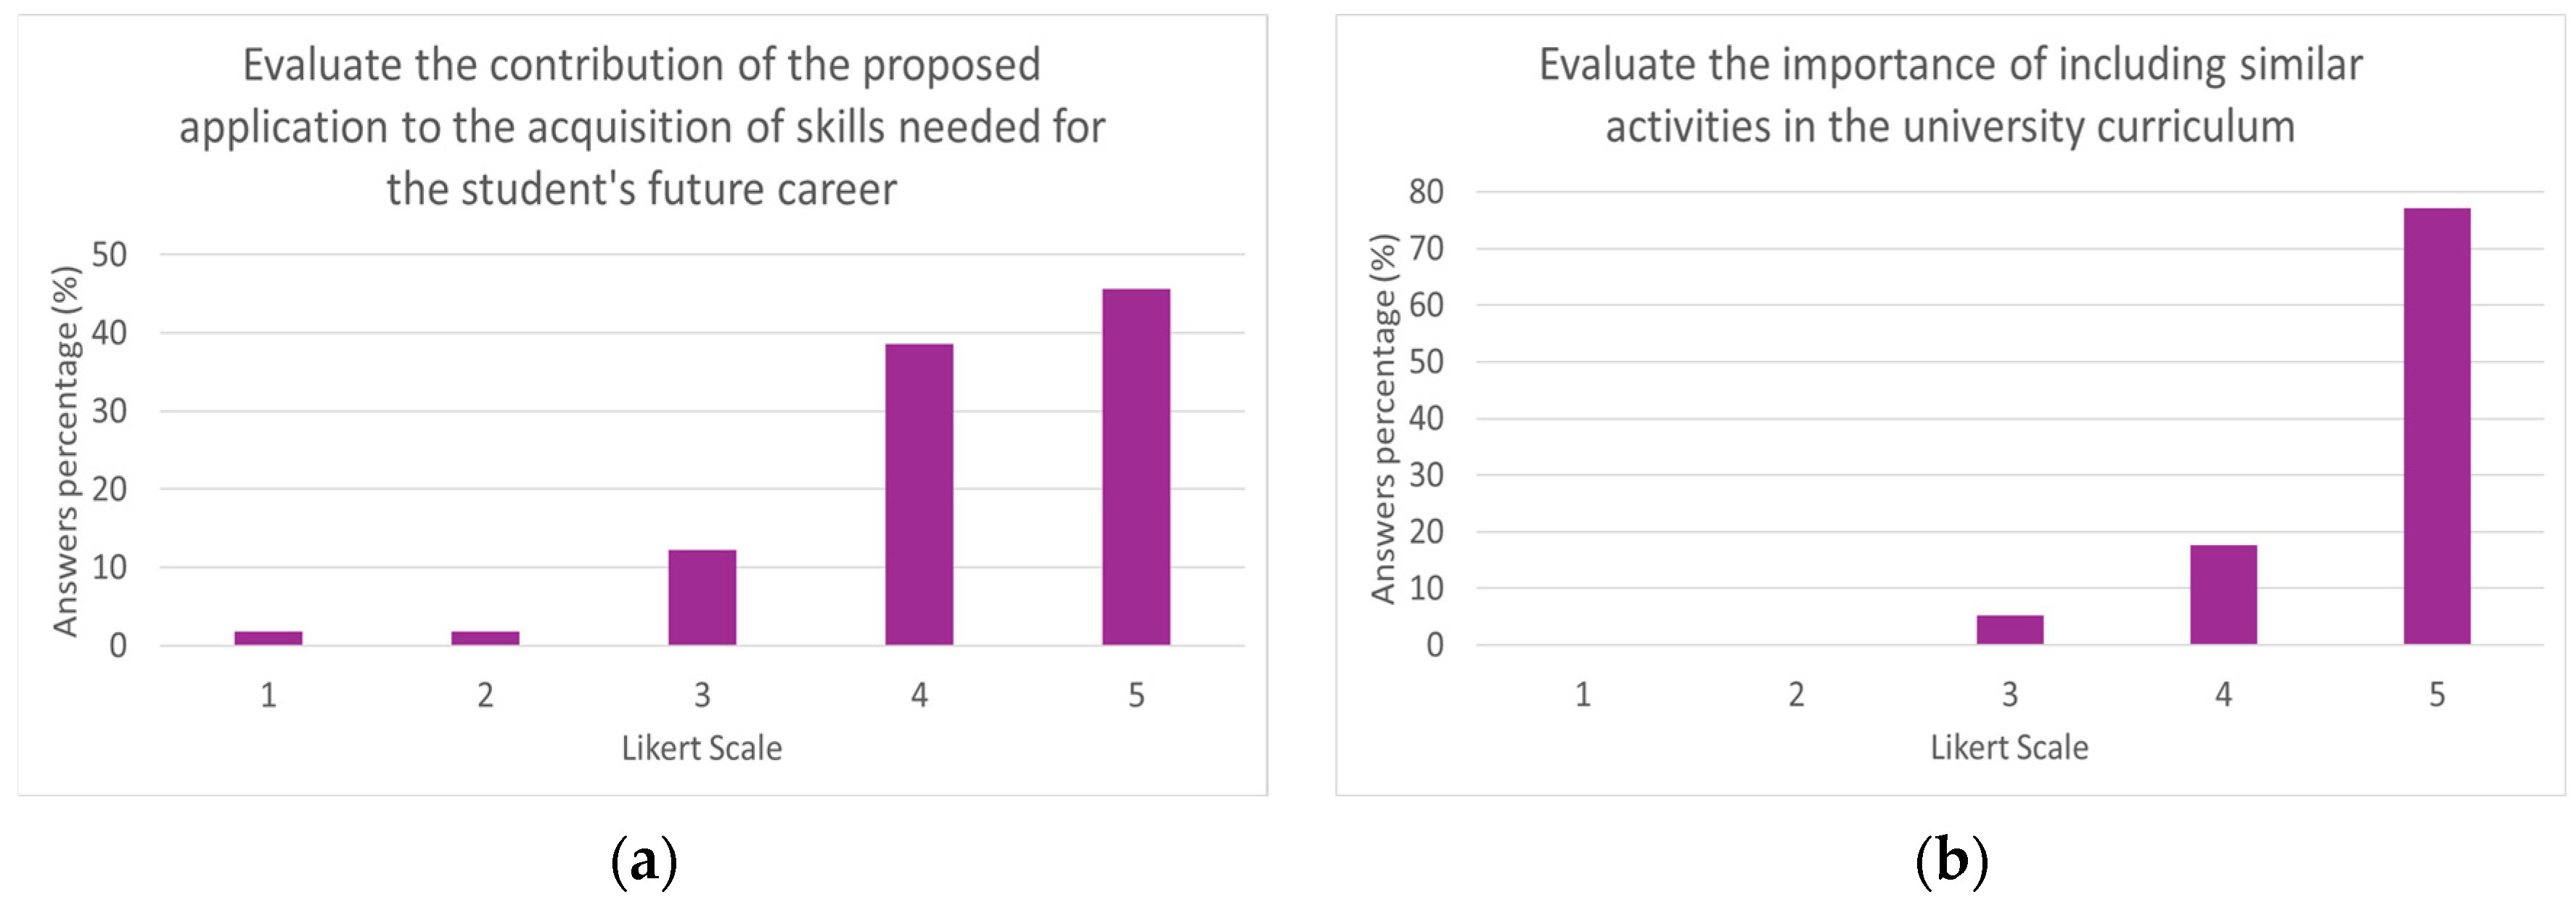
Disclaimer/Publisher’s Note: The statements, opinions and data contained in all publications are solely those of the individual author(s) and contributor(s) and not of MDPI and/or the editor(s). MDPI and/or the editor(s) disclaim responsibility for any injury to people or property resulting from any ideas, methods, instructions or products referred to in the content. |
© 2025 by the authors. Licensee MDPI, Basel, Switzerland. This article is an open access article distributed under the terms and conditions of the Creative Commons Attribution (CC BY) license (https://creativecommons.org/licenses/by/4.0/).