Quantifying Tubulin Concentration and Microtubule Number Throughout the Fission Yeast Cell Cycle

Abstract
:1. Introduction
2. Methods
2.1. Cell Strain and Preparation
2.2. Microscope Set-Up
2.3. Quantitative Imaging
2.4. Data Analysis
3. Results
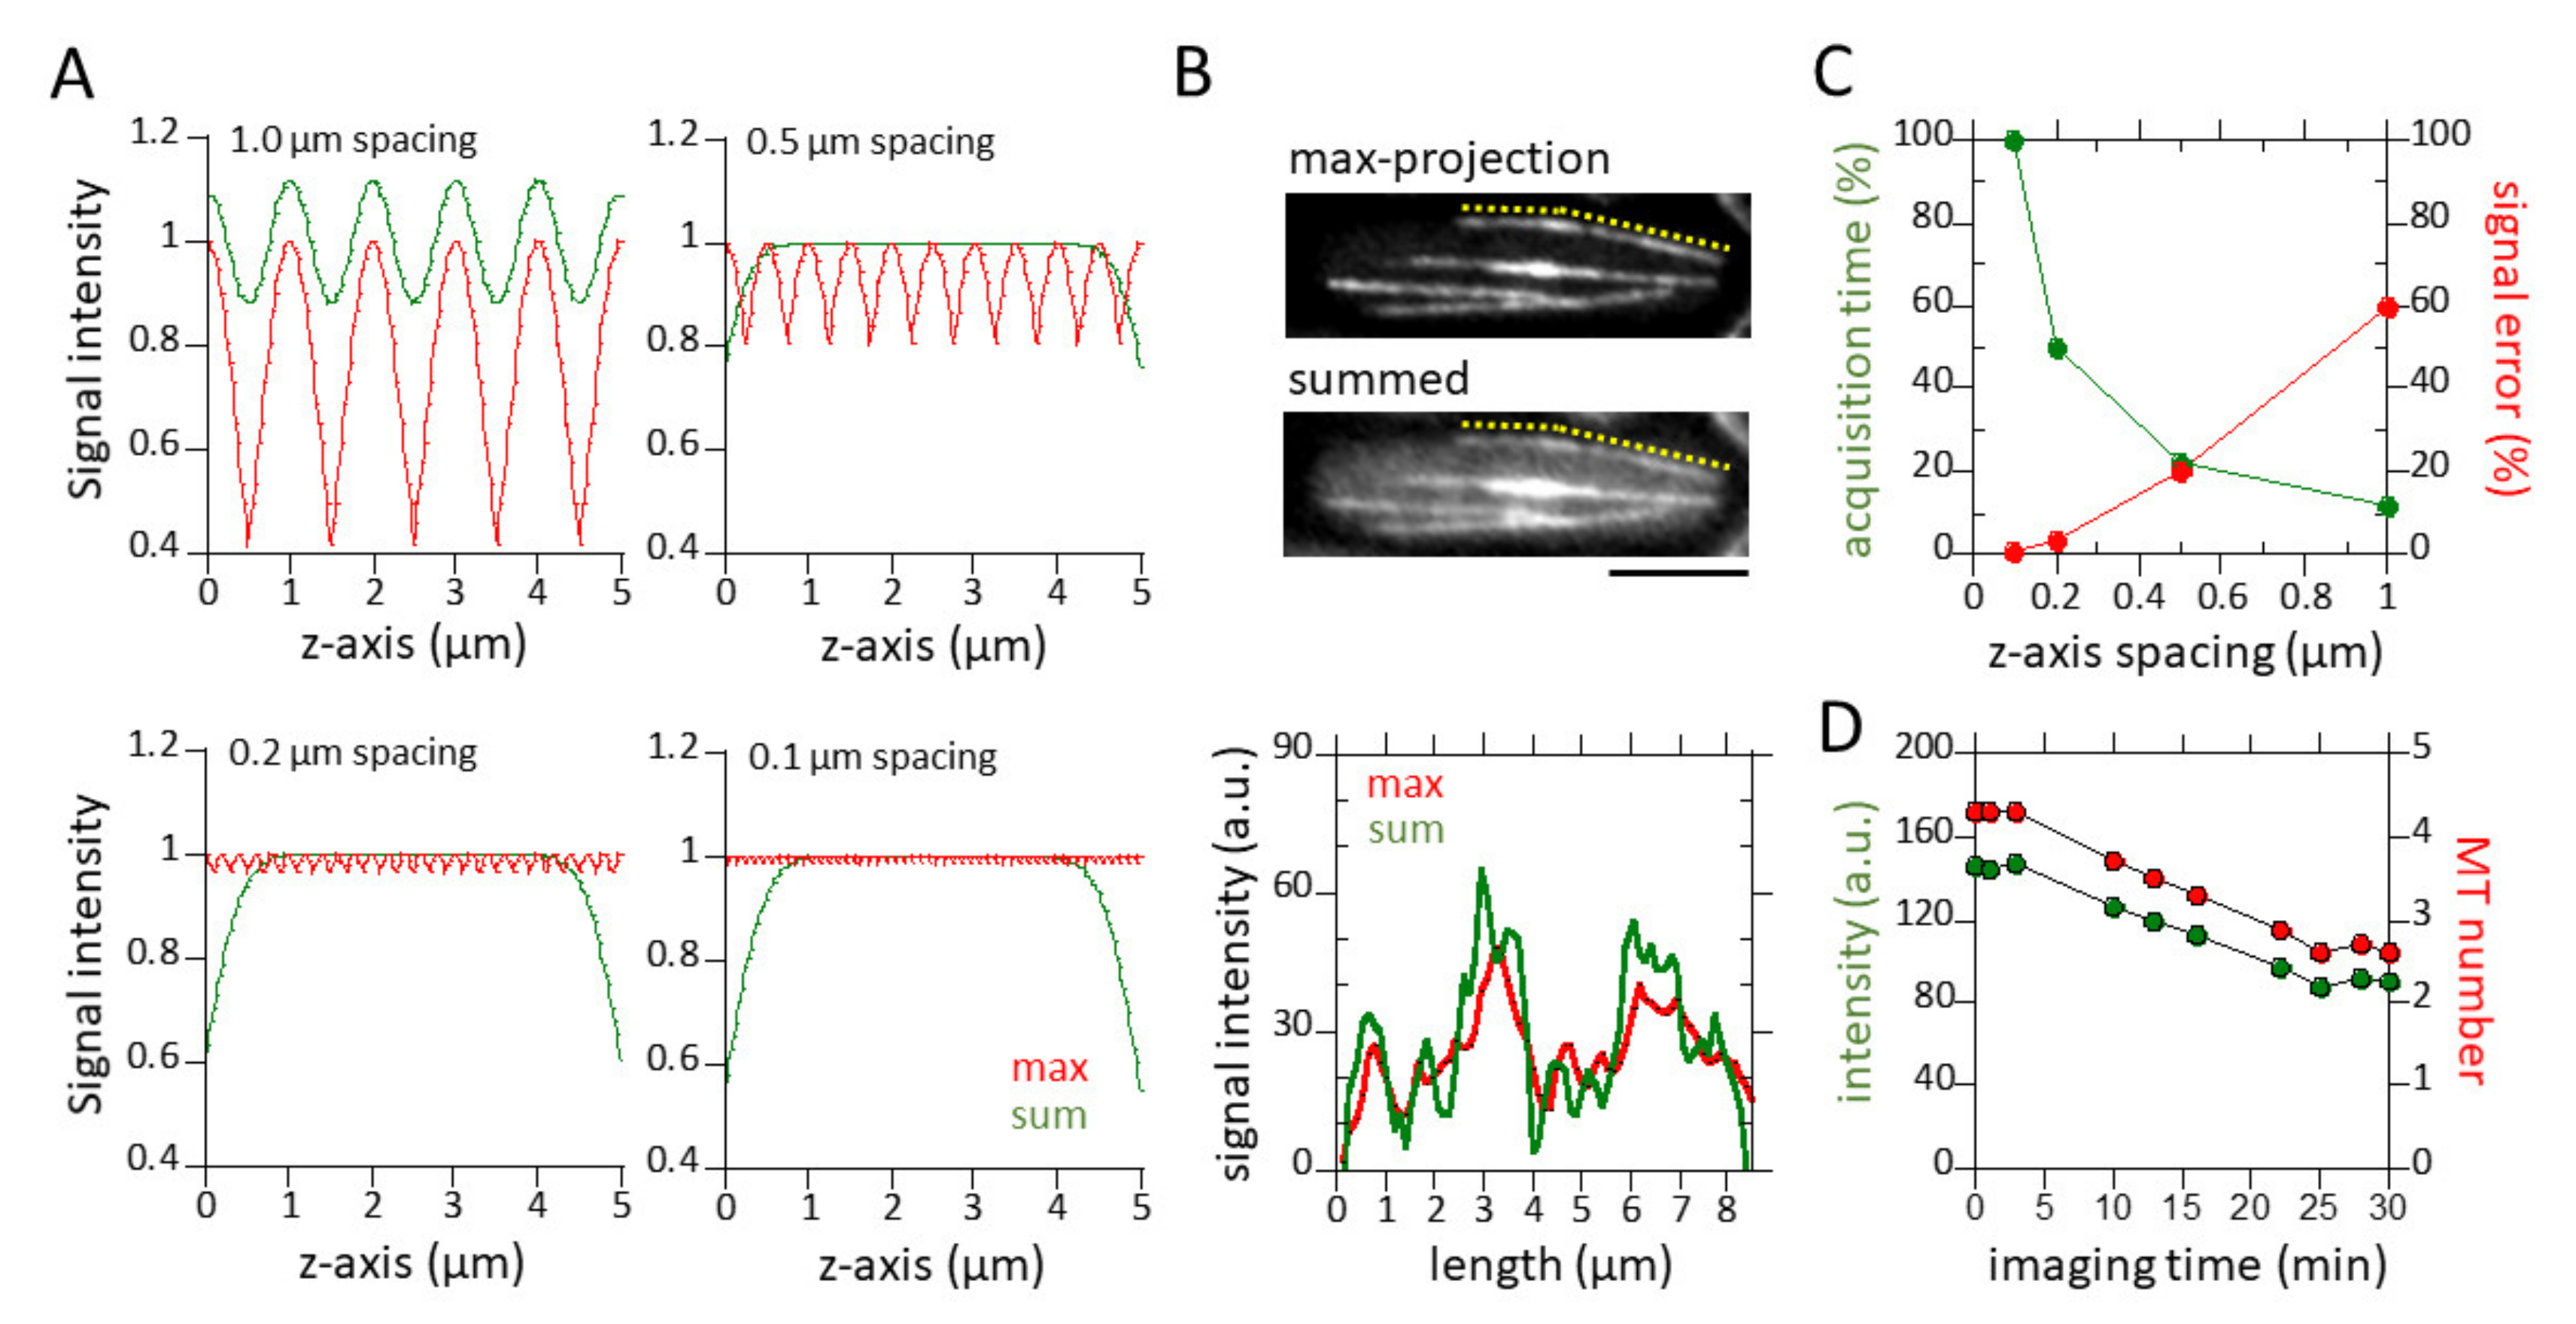
3.1. Sum of z-Sections and 0.5 µm z-Spacing Yield Practical Quantitative Measurements of Microtubules
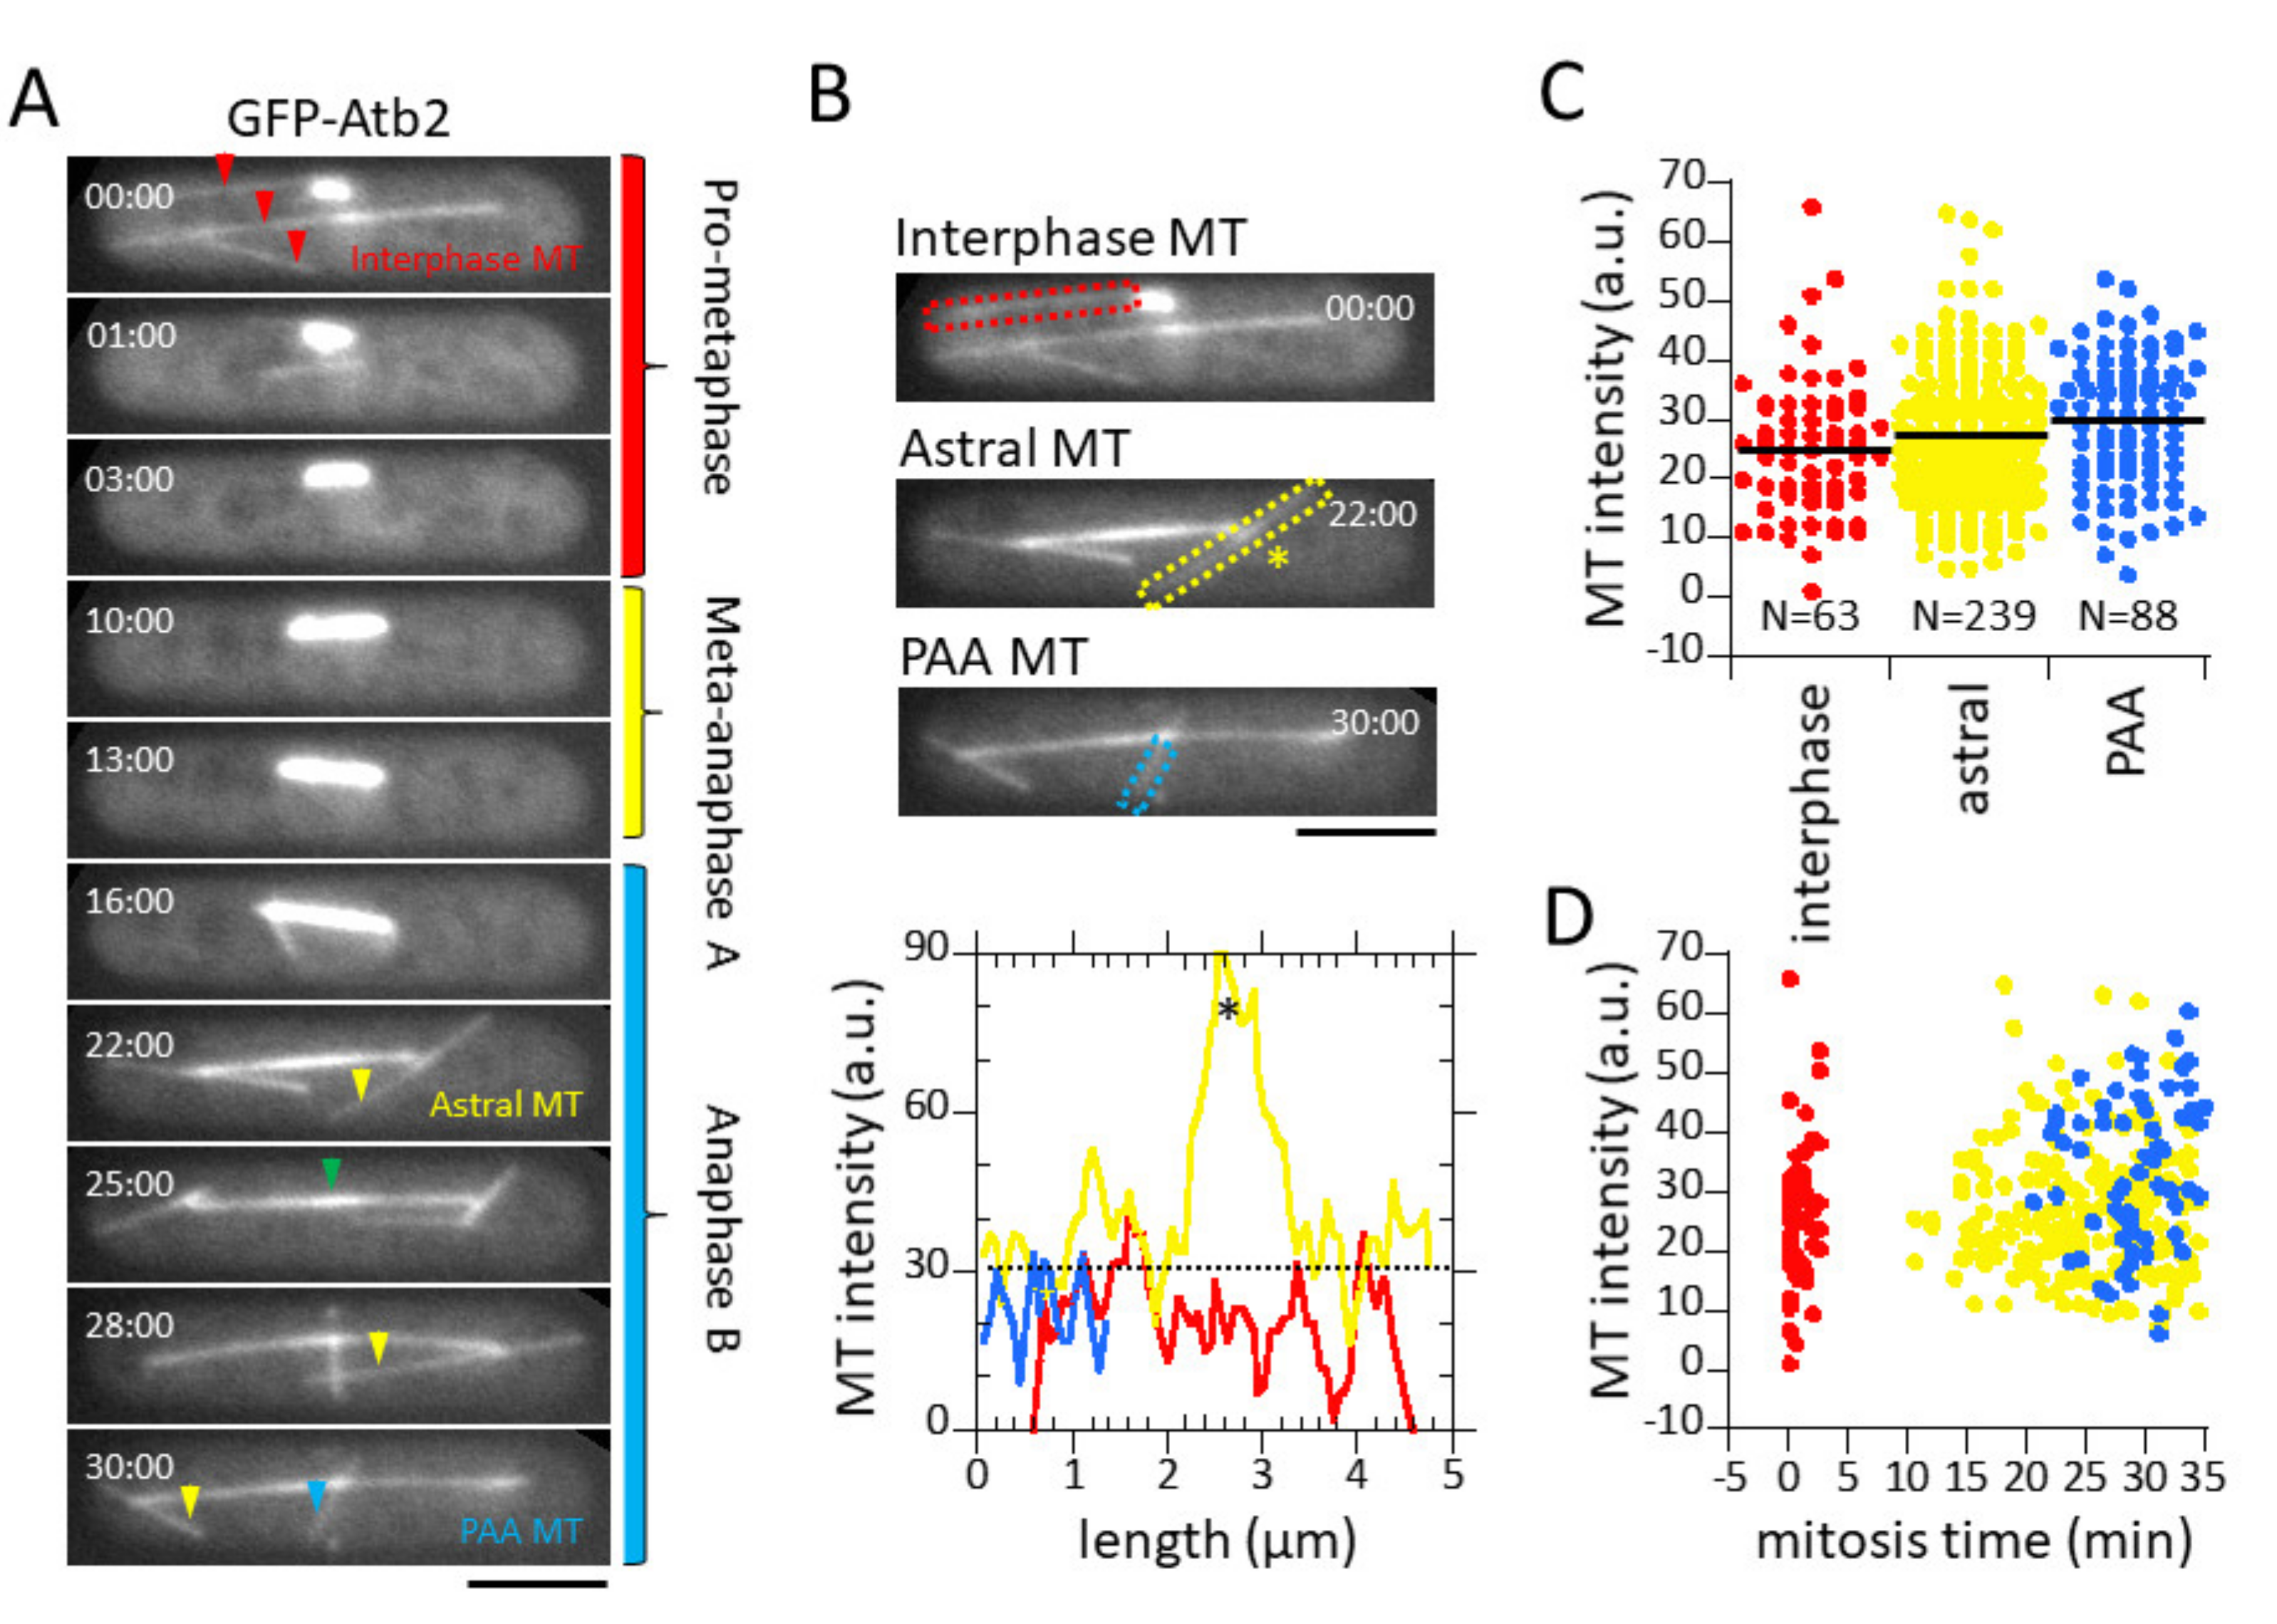
3.2. Microtubule Fluorescence is a Direct Measurement of Microtubule Number
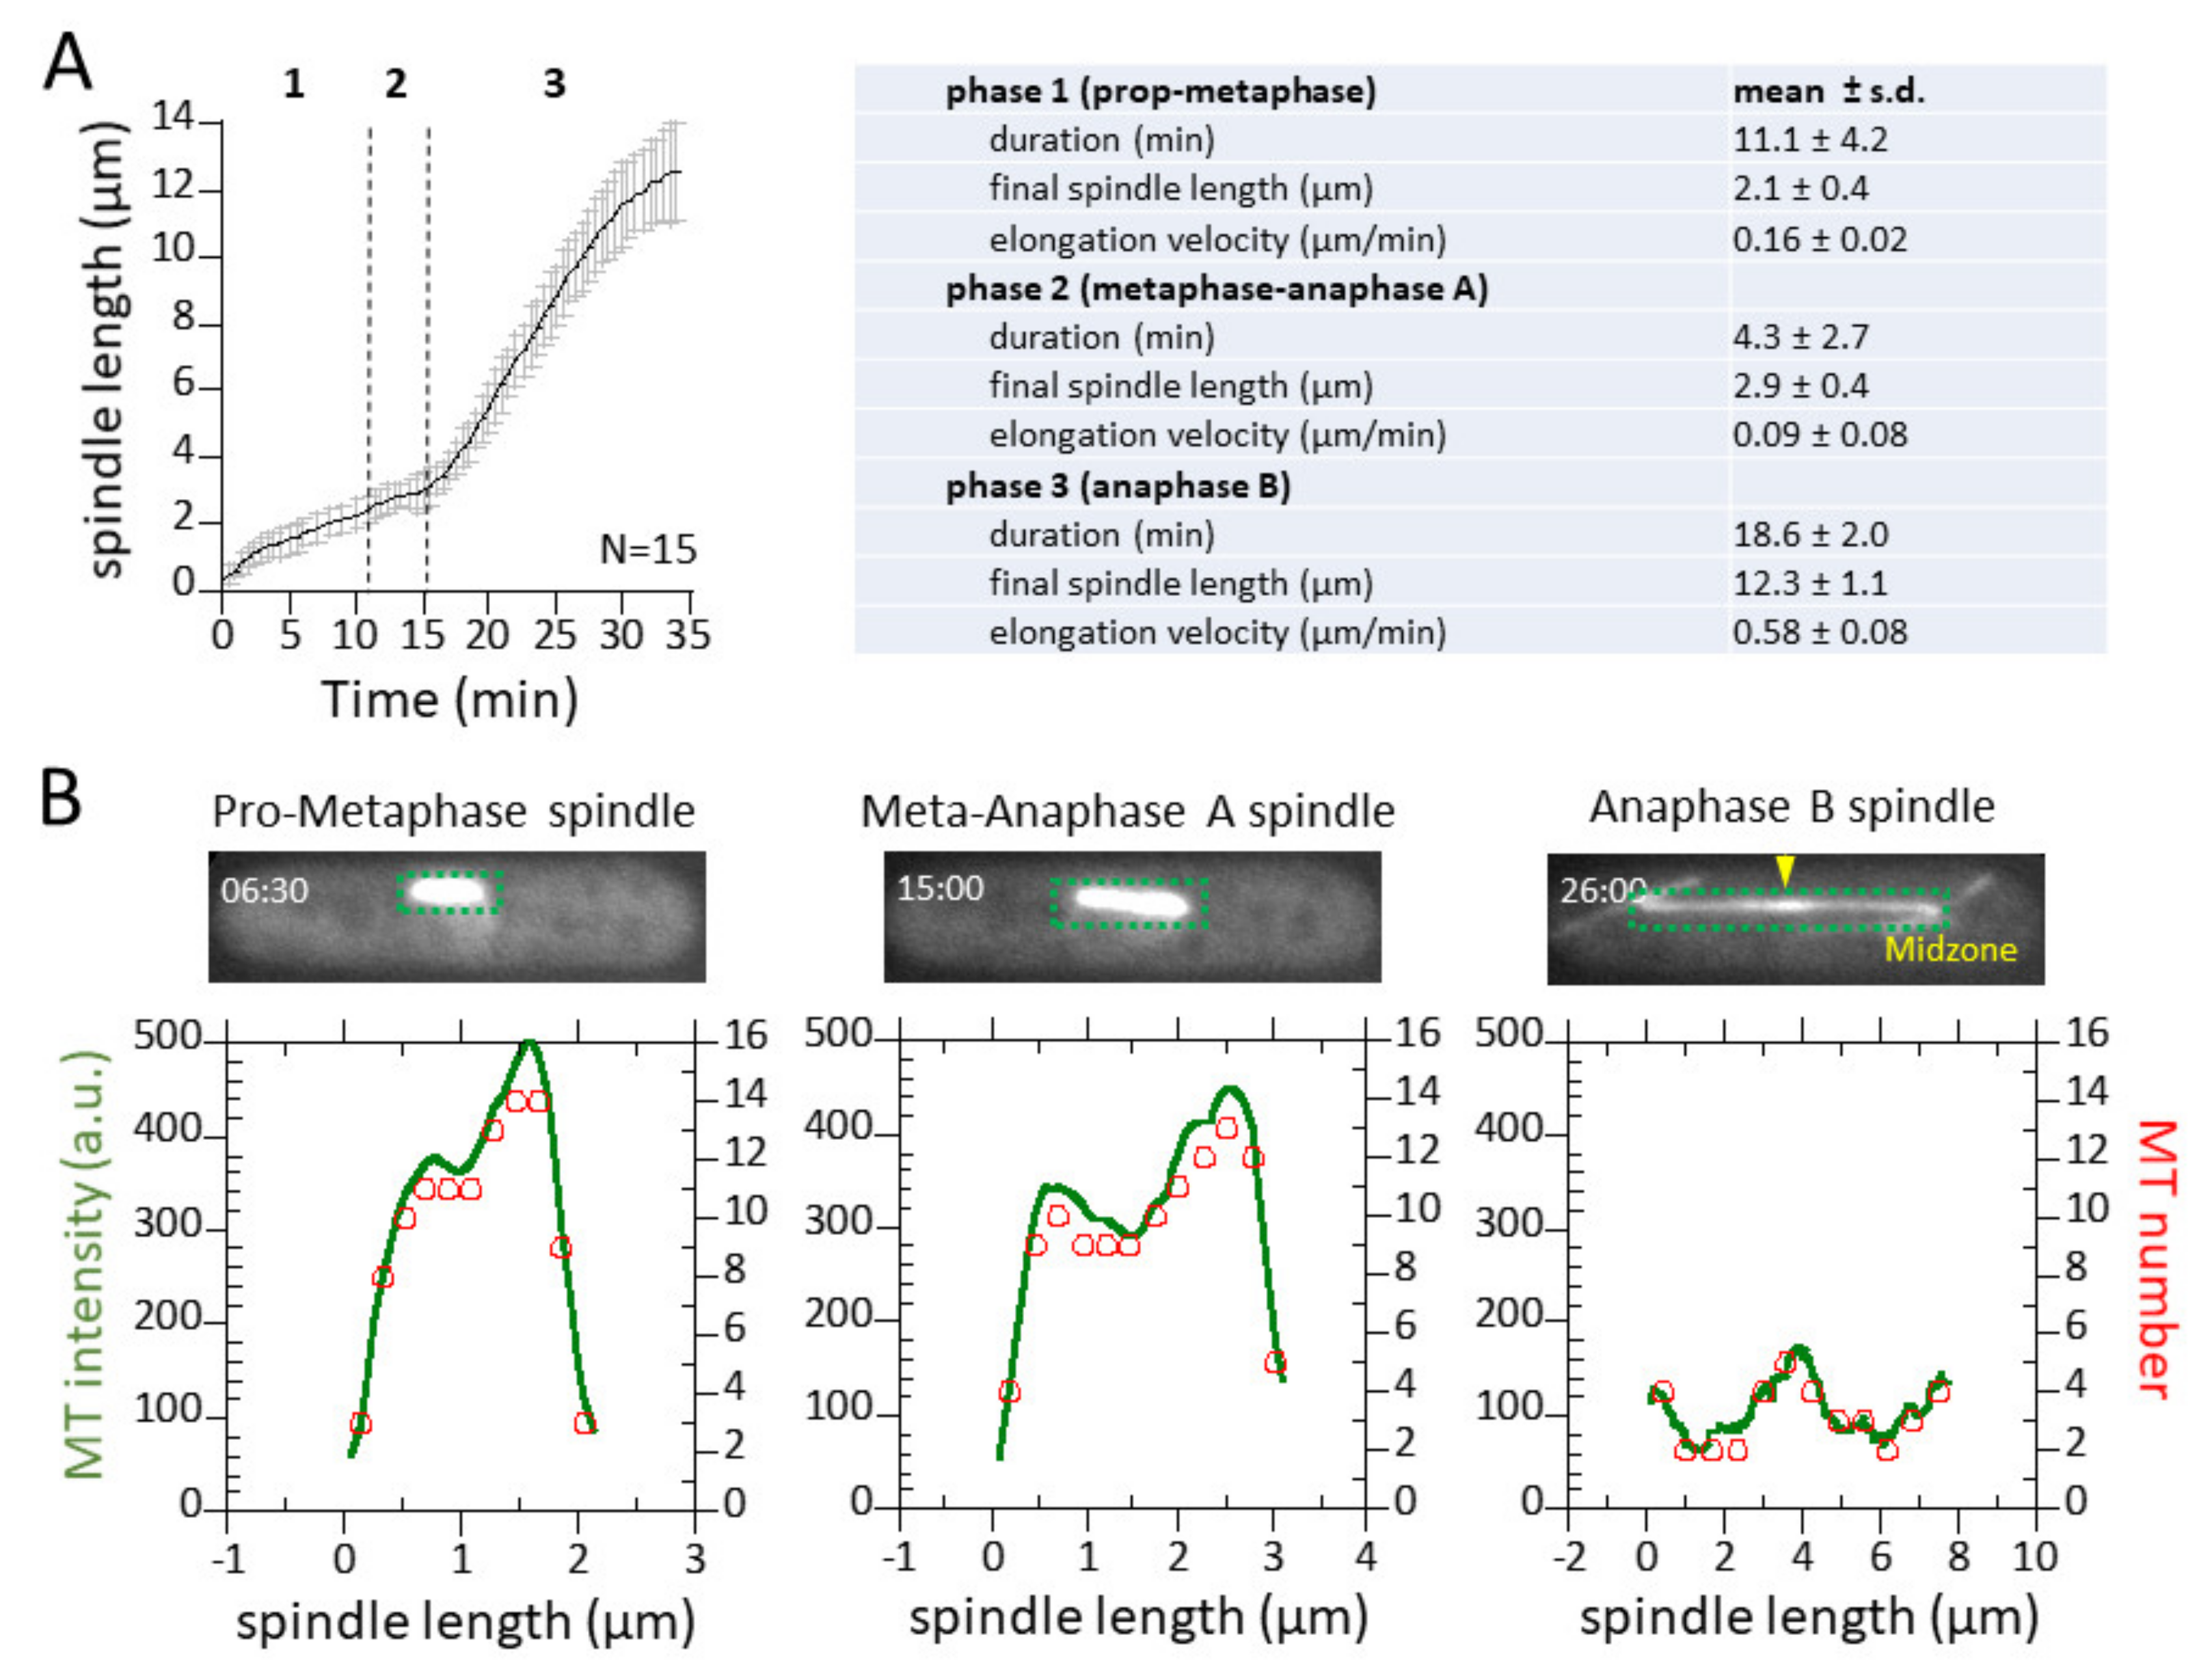
3.3. Spindle Elongation Exhibits 3-Phase Elongation Kinetics and Dynamic Microtubules
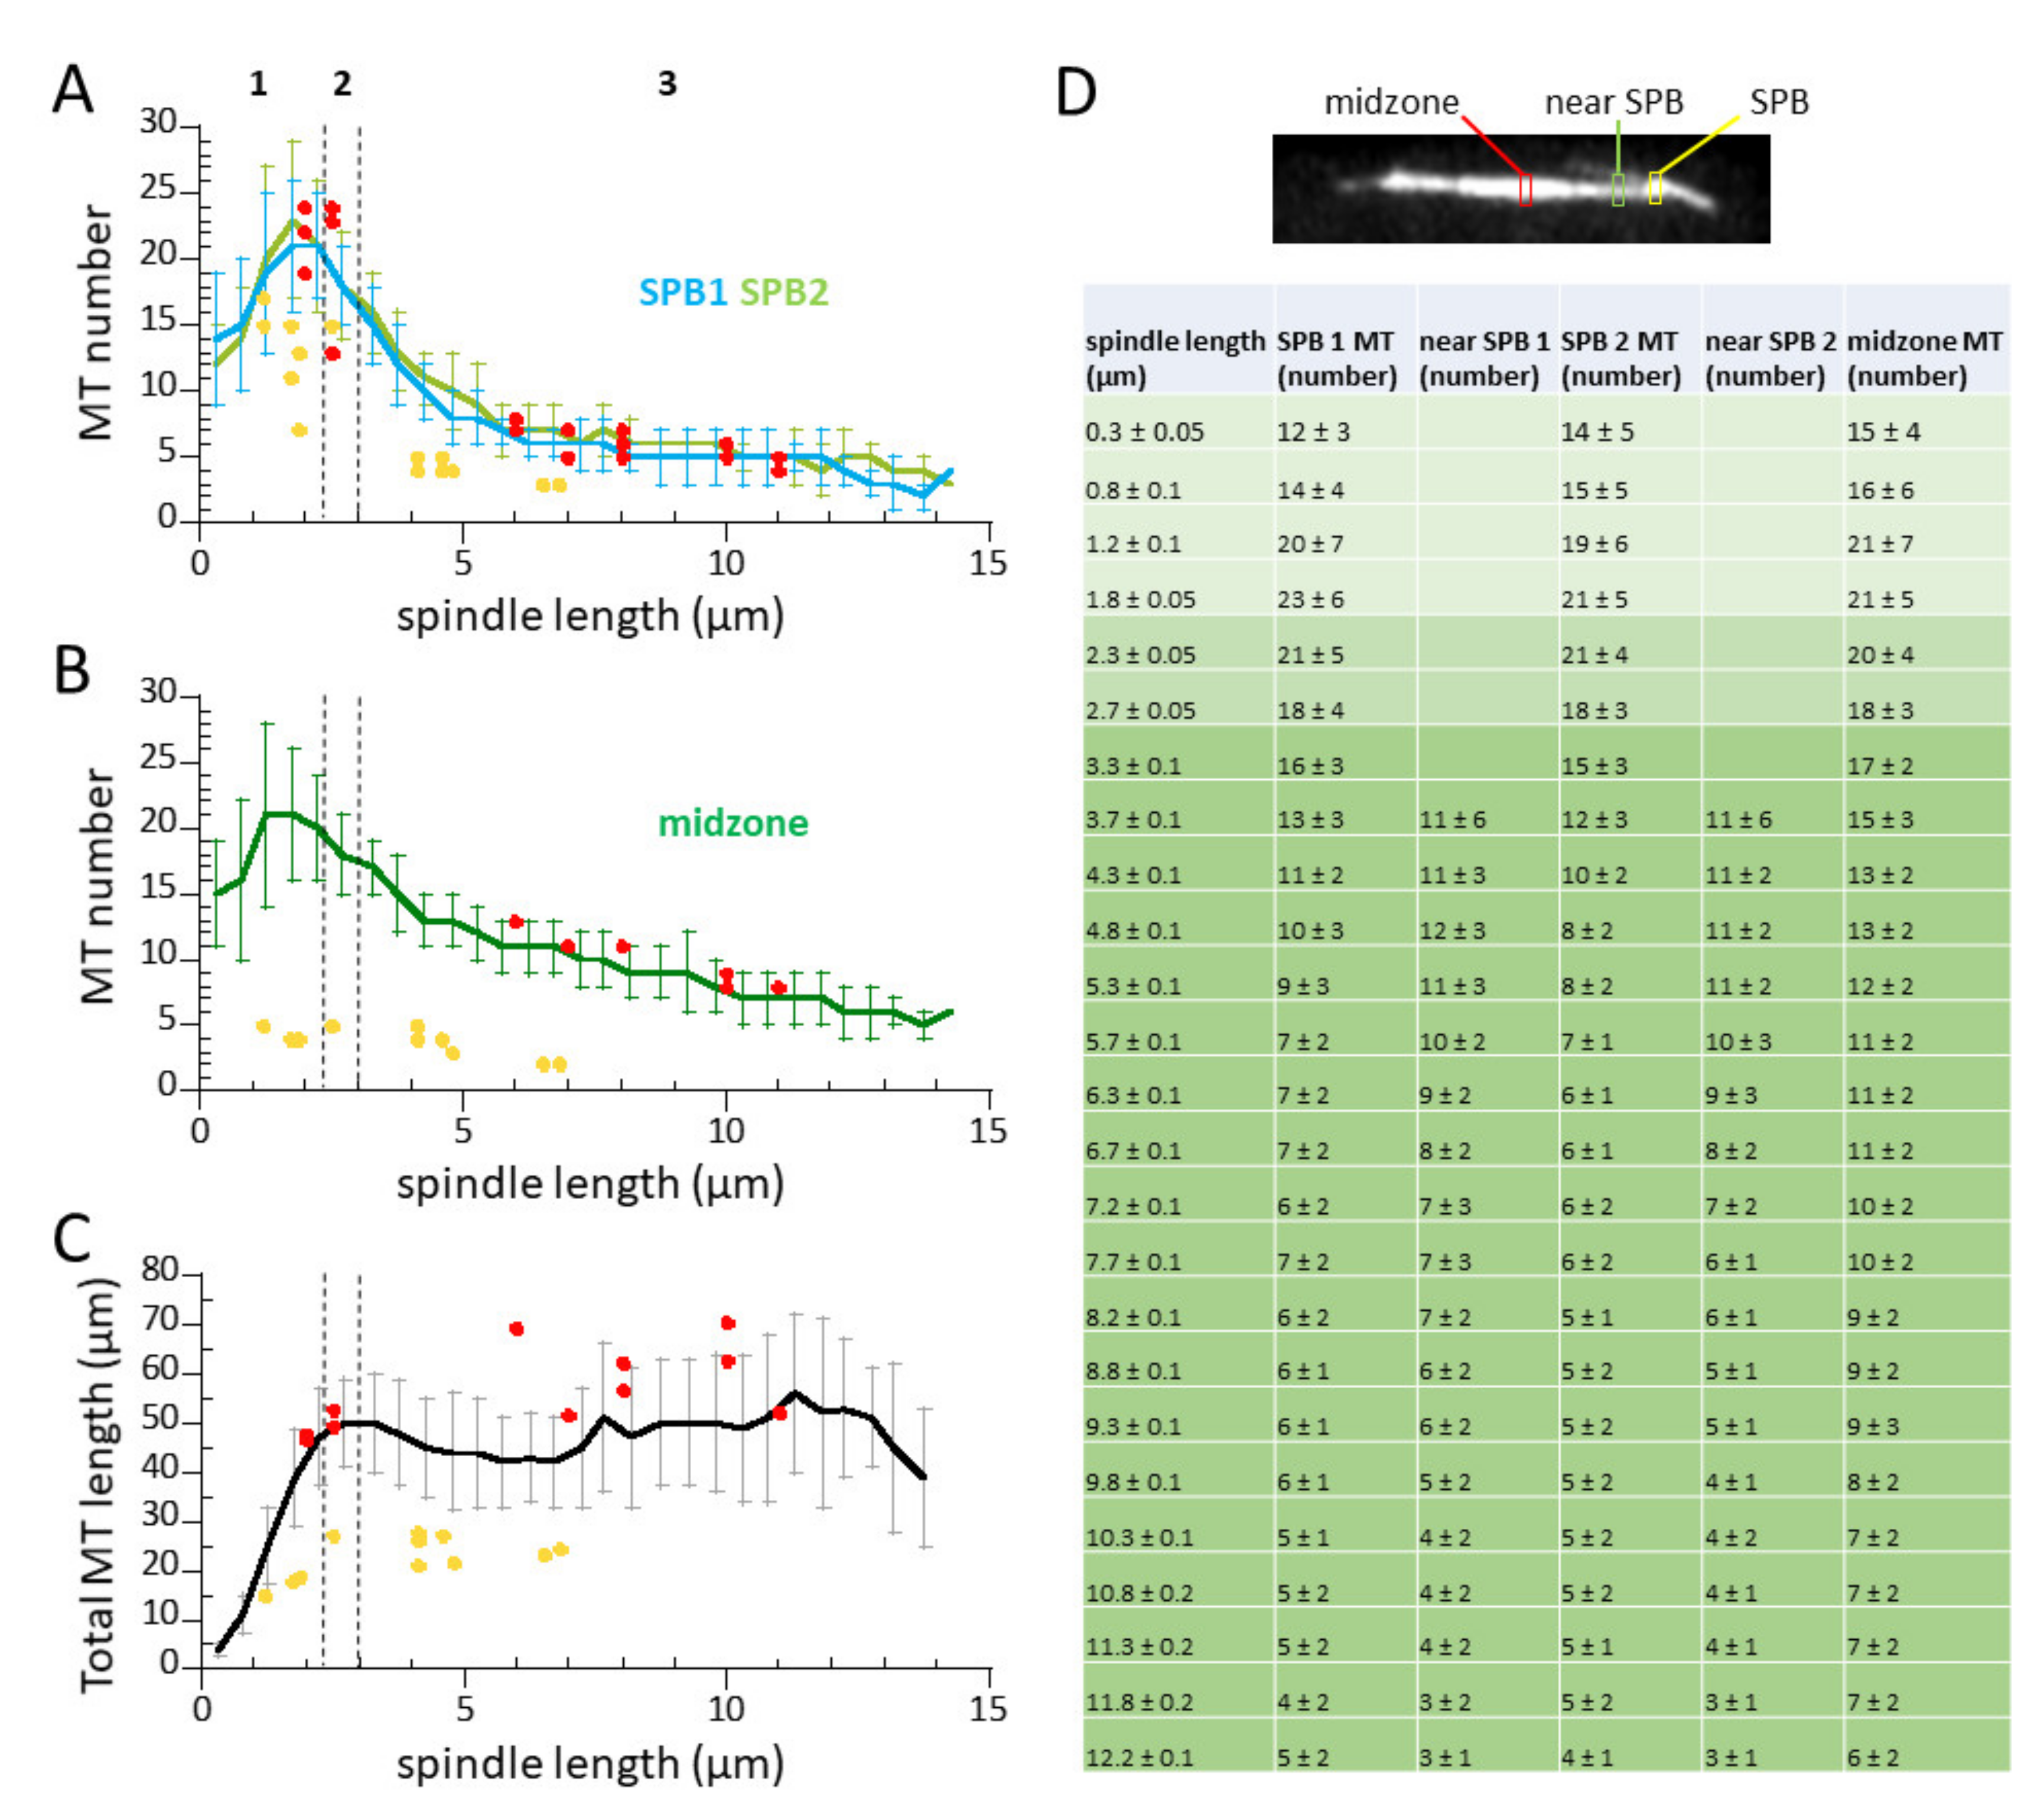
3.4. Microtubule Number Decreases, but Total Microtubule Polymer Length Remains Constant During Mitosis
3.5. Tubulin Concentrations in Interphase and Mitotic Cells
4. Discussion
4.1. Cellular αβ-Tubulin Concentrations
4.2. Differences in Mass Spectrometry, Electron Microscopy, and Fluorescent Imaging in Quantifying Microtubules
5. Conclusions
Author Contributions
Funding
Acknowledgments
Conflicts of Interest
References
- Hayles, J.; Nurse, P. A journey into space. Nat. Rev. Mol. Cell Biol. 2001, 2, 647–656. [Google Scholar] [CrossRef] [PubMed]
- Nurse, P. Genetic control of cell size at cell division in yeast. Nature 1975, 256, 547–551. [Google Scholar] [CrossRef] [PubMed]
- Wu, J.Q.; Kuhn, J.R.; Kovar, D.R.; Pollard, T.D. Spatial and temporal pathway for assembly and constriction of the contractile ring in fission yeast cytokinesis. Dev. Cell 2003, 5, 723–734. [Google Scholar] [CrossRef]
- Wu, J.Q.; Pollard, T.D. Counting cytokinesis proteins globally and locally in fission yeast. Science 2005, 310, 310–314. [Google Scholar] [CrossRef] [PubMed]
- Ding, D.Q.; Chikashige, Y.; Haraguchi, T.; and Hiraoka, Y. Oscillatory nuclear movement in fission yeast meiotic prophase is driven by astral microtubules, as revealed by continuous observation of chromosomes and microtubules in living cells. J. Cell Sci. 1998, 111, 701–712. [Google Scholar] [PubMed]
- Drummond, D.R.; Cross, R.A. Dynamics of interphase microtubules in Schizosaccharomyces pombe. Curr. Biol. 2000, 10, 766–775. [Google Scholar] [CrossRef]
- Sagolla, M.J.; Uzawa, S.; Cande, W.Z. Individual microtubule dynamics contribute to the function of mitotic and cytoplasmic arrays in fission yeast. J. Cell Sci. 2003, 116, 4891–4903. [Google Scholar] [CrossRef] [PubMed]
- Tran, P.T.; Marsh, L.; Doye, V.; Inoue, S.; Chang, F. A mechanism for nuclear positioning in fission yeast based on microtubule pushing. J. Cell Biol. 2001, 153, 397–411. [Google Scholar] [CrossRef] [PubMed]
- Daga, R.R.; Chang, F. Dynamic positioning of the fission yeast cell division plane. Proc. Natl. Acad. Sci. USA 2005, 102, 8228–8232. [Google Scholar] [CrossRef] [PubMed]
- Tolic-Norrelykke, I.M.; Sacconi, L.; Stringari, C.; Raabe, I.; Pavone, F.S. Nuclear and division-plane positioning revealed by optical micromanipulation. Curr. Biol. 2005, 15, 1212–1216. [Google Scholar] [CrossRef] [PubMed]
- Brunner, D.; Nurse, P. CLIP170-like tip1p spatially organizes microtubular dynamics in fission yeast. Cell 2000, 102, 695–704. [Google Scholar] [CrossRef]
- Mata, J.; Nurse, P. tea1 and the microtubular cytoskeleton are important for generating global spatial order within the fission yeast cell. Cell 1997, 89, 939–949. [Google Scholar] [CrossRef]
- Piel, M.; Tran, P.T. Cell shape and cell division in fission yeast. Curr. Biol. 2009, 19, R823–R827. [Google Scholar] [CrossRef] [PubMed]
- Nabeshima, K.; Nakagawa, T.; Straight, A.F.; Murray, A.; Chikashige, Y.; Yamashita, Y.M.; Hiraoka, Y.; Yanagida, M. Dynamics of centromeres during metaphase-anaphase transition in fission yeast: Dis1 is implicated in force balance in metaphase bipolar spindle. Mol. Biol. Cell 1998, 9, 3211–3225. [Google Scholar] [CrossRef] [PubMed]
- Tolic-Norrelykke, I.M.; Sacconi, L.; Thon, G.; Pavone, F.S. Positioning and elongation of the fission yeast spindle by microtubule-based pushing. Curr. Biol. 2004, 14, 1181–1186. [Google Scholar] [CrossRef] [PubMed]
- Hagan, I.M. The fission yeast microtubule cytoskeleton. J. Cell Sci. 1998, 111, 1603–1612. [Google Scholar] [PubMed]
- Samejima, I.; Miller, V.J.; Rincon, S.A.; Sawin, K.E. Fission yeast Mto1 regulates diversity of cytoplasmic microtubule organizing centers. Curr. Biol. 2010, 20, 1959–1965. [Google Scholar] [CrossRef] [PubMed]
- Sawin, K.E.; Tran, P.T. Cytoplasmic microtubule organization in fission yeast. Yeast 2006, 23, 1001–1014. [Google Scholar] [CrossRef] [PubMed]
- Carpy, A.; Krug, K.; Graf, S.; Koch, A.; Popic, S.; Hauf, S.; Macek, B. Absolute proteome and phosphoproteome dynamics during the cell cycle of Schizosaccharomyces pombe (Fission Yeast). Mol. Cell Proteomics 2014, 13, 1925–1936. [Google Scholar] [CrossRef] [PubMed]
- Ding, R.; McDonald, K.L.; McIntosh, J.R. Three-dimensional reconstruction and analysis of mitotic spindles from the yeast, Schizosaccharomyces pombe. J. Cell Biol. 1993, 120, 141–151. [Google Scholar] [CrossRef] [PubMed]
- Hoog, J.L.; Schwartz, C.; Noon, A.T.; O’Toole, E.T.; Mastronarde, D.N.; McIntosh, J.R.; Antony, C. Organization of interphase microtubules in fission yeast analyzed by electron tomography. Dev. Cell 2007, 12, 349–361. [Google Scholar] [CrossRef] [PubMed]
- Marguerat, S.; Schmidt, A.; Codlin, S.; Chen, W.; Aebersold, R.; Bahler, J. Quantitative analysis of fission yeast transcriptomes and proteomes in proliferating and quiescent cells. Cell 2012, 151, 671–683. [Google Scholar] [CrossRef] [PubMed]
- Ward, J.J.; Roque, H.; Antony, C.; Nedelec, F. Mechanical design principles of a mitotic spindle. eLife 2014, 3, e03398. [Google Scholar] [CrossRef] [PubMed]
- Moreno, S.; Klar, A.; Nurse, P. Molecular genetic analysis of fission yeast Schizosaccharomyces pombe. Methods Enzymol. 1991, 194, 795–823. [Google Scholar] [PubMed]
- Tran, P.T.; Paoletti, A.; Chang, F. Imaging green fluorescent protein fusions in living fission yeast cells. Methods 2004, 33, 220–225. [Google Scholar] [CrossRef] [PubMed]
- Maundrell, K. nmt1 of fission yeast. A highly transcribed gene completely repressed by thiamine. J. Biol. Chem. 1990, 265, 10857–10864. [Google Scholar] [PubMed]
- Inoue, S.; Inoue, T. Direct-view high-speed confocal scanner: The CSU-10. Methods Cell Biol. 2002, 70, 87–127. [Google Scholar] [PubMed]
- Loiodice, I.; Staub, J.; Setty, T.G.; Nguyen, N.P.; Paoletti, A.; Tran, P.T. Ase1p organizes antiparallel microtubule arrays during interphase and mitosis in fission yeast. Mol. Biol. Cell 2005, 16, 1756–1768. [Google Scholar] [CrossRef] [PubMed]
- Mitchison, J.M.; Nurse, P. Growth in cell length in the fission yeast Schizosaccharomyces pombe. J. Cell Sci. 1985, 75, 357–376. [Google Scholar] [PubMed]
- Yamashita, A.; Sato, M.; Fujita, A.; Yamamoto, M.; Toda, T. The roles of fission yeast ase1 in mitotic cell division, meiotic nuclear oscillation, and cytokinesis checkpoint signaling. Mol. Biol. Cell 2005, 16, 1378–1395. [Google Scholar] [CrossRef] [PubMed]
- Janson, M.E.; Loughlin, R.; Loiodice, I.; Fu, C.; Brunner, D.; Nedelec, F.J.; Tran, P.T. Crosslinkers and motors organize dynamic microtubules to form stable bipolar arrays in fission yeast. Cell 2007, 128, 357–368. [Google Scholar] [CrossRef] [PubMed]
- Janson, M.E.; Setty, T.G.; Paoletti, A.; Tran, P.T. Efficient formation of bipolar microtubule bundles requires microtubule-bound γ-tubulin complexes. J. Cell Biol. 2005, 169, 297–308. [Google Scholar] [CrossRef] [PubMed]
- Samejima, I.; Lourenco, P.C.; Snaith, H.A.; Sawin, K.E. Fission yeast mto2p regulates microtubule nucleation by the centrosomin-related protein mto1p. Mol. Biol. Cell 2005, 16, 3040–3051. [Google Scholar] [CrossRef] [PubMed]
- Zhai, Y.; Borisy, G.G. Quantitative determination of the proportion of microtubule polymer present during the mitosis-interphase transition. J. Cell Sci. 1994, 107, 881–890. [Google Scholar] [PubMed]
- Zhai, Y.; Kronebusch, P.J.; Simon, P.M.; Borisy, G.G. Microtubule dynamics at the G2/M transition: Abrupt breakdown of cytoplasmic microtubules at nuclear envelope breakdown and implications for spindle morphogenesis. J. Cell Biol. 1996, 135, 201–214. [Google Scholar] [CrossRef] [PubMed]
- Fygenson, D.K.; Braun, E.; Libchaber, A. Phase diagram of microtubules. Phys. Rev. E Stat. Phys. Plasmas Fluids Relat. Interdiscip. Top. 1994, 50, 1579–1588. [Google Scholar] [CrossRef]


| Interphase (G1-S) | Interphase (G2) | Mitosis (M) | |
|---|---|---|---|
| Cell length (μm) | 7.38 ± 0.43 | 12.82 ± 1.16 | 14.62 ± 1.46 |
| Cell width (μm) | 2.94 ± 0.14 | 3.03 ± 0.11 | 2.96 ± 0.13 |
| Cell volume (μm3) | 43.36 ± 3.35 | 85.32 ± 11.21 | 93.76 ± 13.10 |
| Number of MT bundles | 3.71 ± 0.49 | 4.11 ± 0.60 | vary, * |
| Tip-to-tip length of bundles | 5.29 ± 1.55 | 8.48 ± 2.92 | vary, * |
| Total MT polymer length (μm) | 22.82 ± 3.70 | 40.94 ± 5.00 | 47.86 ± 4.59 |
| Fraction of tubulin in MT polymer (%) | 35 | 34 | 26 |
| Fraction of tubulin in cytoplasm (%) | 65 | 66 | 74 |
| Total tubulin subunit per cell | 1.06 ± 0.30 × 10⁵ | 1.97 ± 0.24 × 10⁵ | 3.02 ± 0.45 × 10⁵ |
| Total tubulin concentration in cell (μM) | 4.04 ± 0.24 | 3.83 ± 0.32 | 5.35 ± 0.55 |
| Tubulin concentration in MT (μM) | 1.41 ± 0.24 | 1.30 ± 0.32 | 1.39 ± 0.55 |
| Tubulin concentration in cytoplasm (μM) | 2.63 ± 0.24 | 2.53 ± 0.32 | 3.96 ± 0.55 |
| § Corrected total tubulin subunit per cell | 1.41 ± 0.40 × 10⁵ | 2.62 ± 0.32 × 10⁵ | |
| § Corrected total tubulin concentration in cell (μM) | 5.37 ± 0.32 | 5.09 ± 0.43 | |
| § Corrected concentration in MT (μM) | 1.88 ± 0.32 | 1.73 ± 0.43 | |
| § Corrected concentration in cytoplasm (μM) | 3.49 ± 0.32 | 3.36 ± 0.43 | |
| Cells measured (N) | 7 | 9 | 6 |
© 2019 by the authors. Licensee MDPI, Basel, Switzerland. This article is an open access article distributed under the terms and conditions of the Creative Commons Attribution (CC BY) license (http://creativecommons.org/licenses/by/4.0/).
Share and Cite
Loiodice, I.; Janson, M.E.; Tavormina, P.; Schaub, S.; Bhatt, D.; Cochran, R.; Czupryna, J.; Fu, C.; Tran, P.T. Quantifying Tubulin Concentration and Microtubule Number Throughout the Fission Yeast Cell Cycle. Biomolecules 2019, 9, 86. https://doi.org/10.3390/biom9030086
Loiodice I, Janson ME, Tavormina P, Schaub S, Bhatt D, Cochran R, Czupryna J, Fu C, Tran PT. Quantifying Tubulin Concentration and Microtubule Number Throughout the Fission Yeast Cell Cycle. Biomolecules. 2019; 9(3):86. https://doi.org/10.3390/biom9030086
Chicago/Turabian StyleLoiodice, Isabelle, Marcel E. Janson, Penny Tavormina, Sebastien Schaub, Divya Bhatt, Ryan Cochran, Julie Czupryna, Chuanhai Fu, and Phong T. Tran. 2019. "Quantifying Tubulin Concentration and Microtubule Number Throughout the Fission Yeast Cell Cycle" Biomolecules 9, no. 3: 86. https://doi.org/10.3390/biom9030086
APA StyleLoiodice, I., Janson, M. E., Tavormina, P., Schaub, S., Bhatt, D., Cochran, R., Czupryna, J., Fu, C., & Tran, P. T. (2019). Quantifying Tubulin Concentration and Microtubule Number Throughout the Fission Yeast Cell Cycle. Biomolecules, 9(3), 86. https://doi.org/10.3390/biom9030086