Delineating the Dynamic Transcriptome Response of mRNA and microRNA during Zebrafish Heart Regeneration

 , and
, and
Abstract
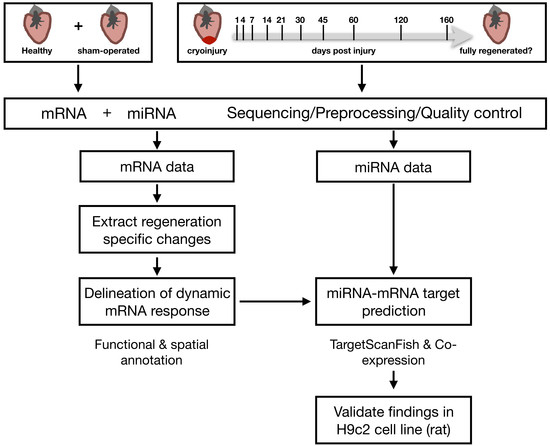
1. Introduction
2. Results
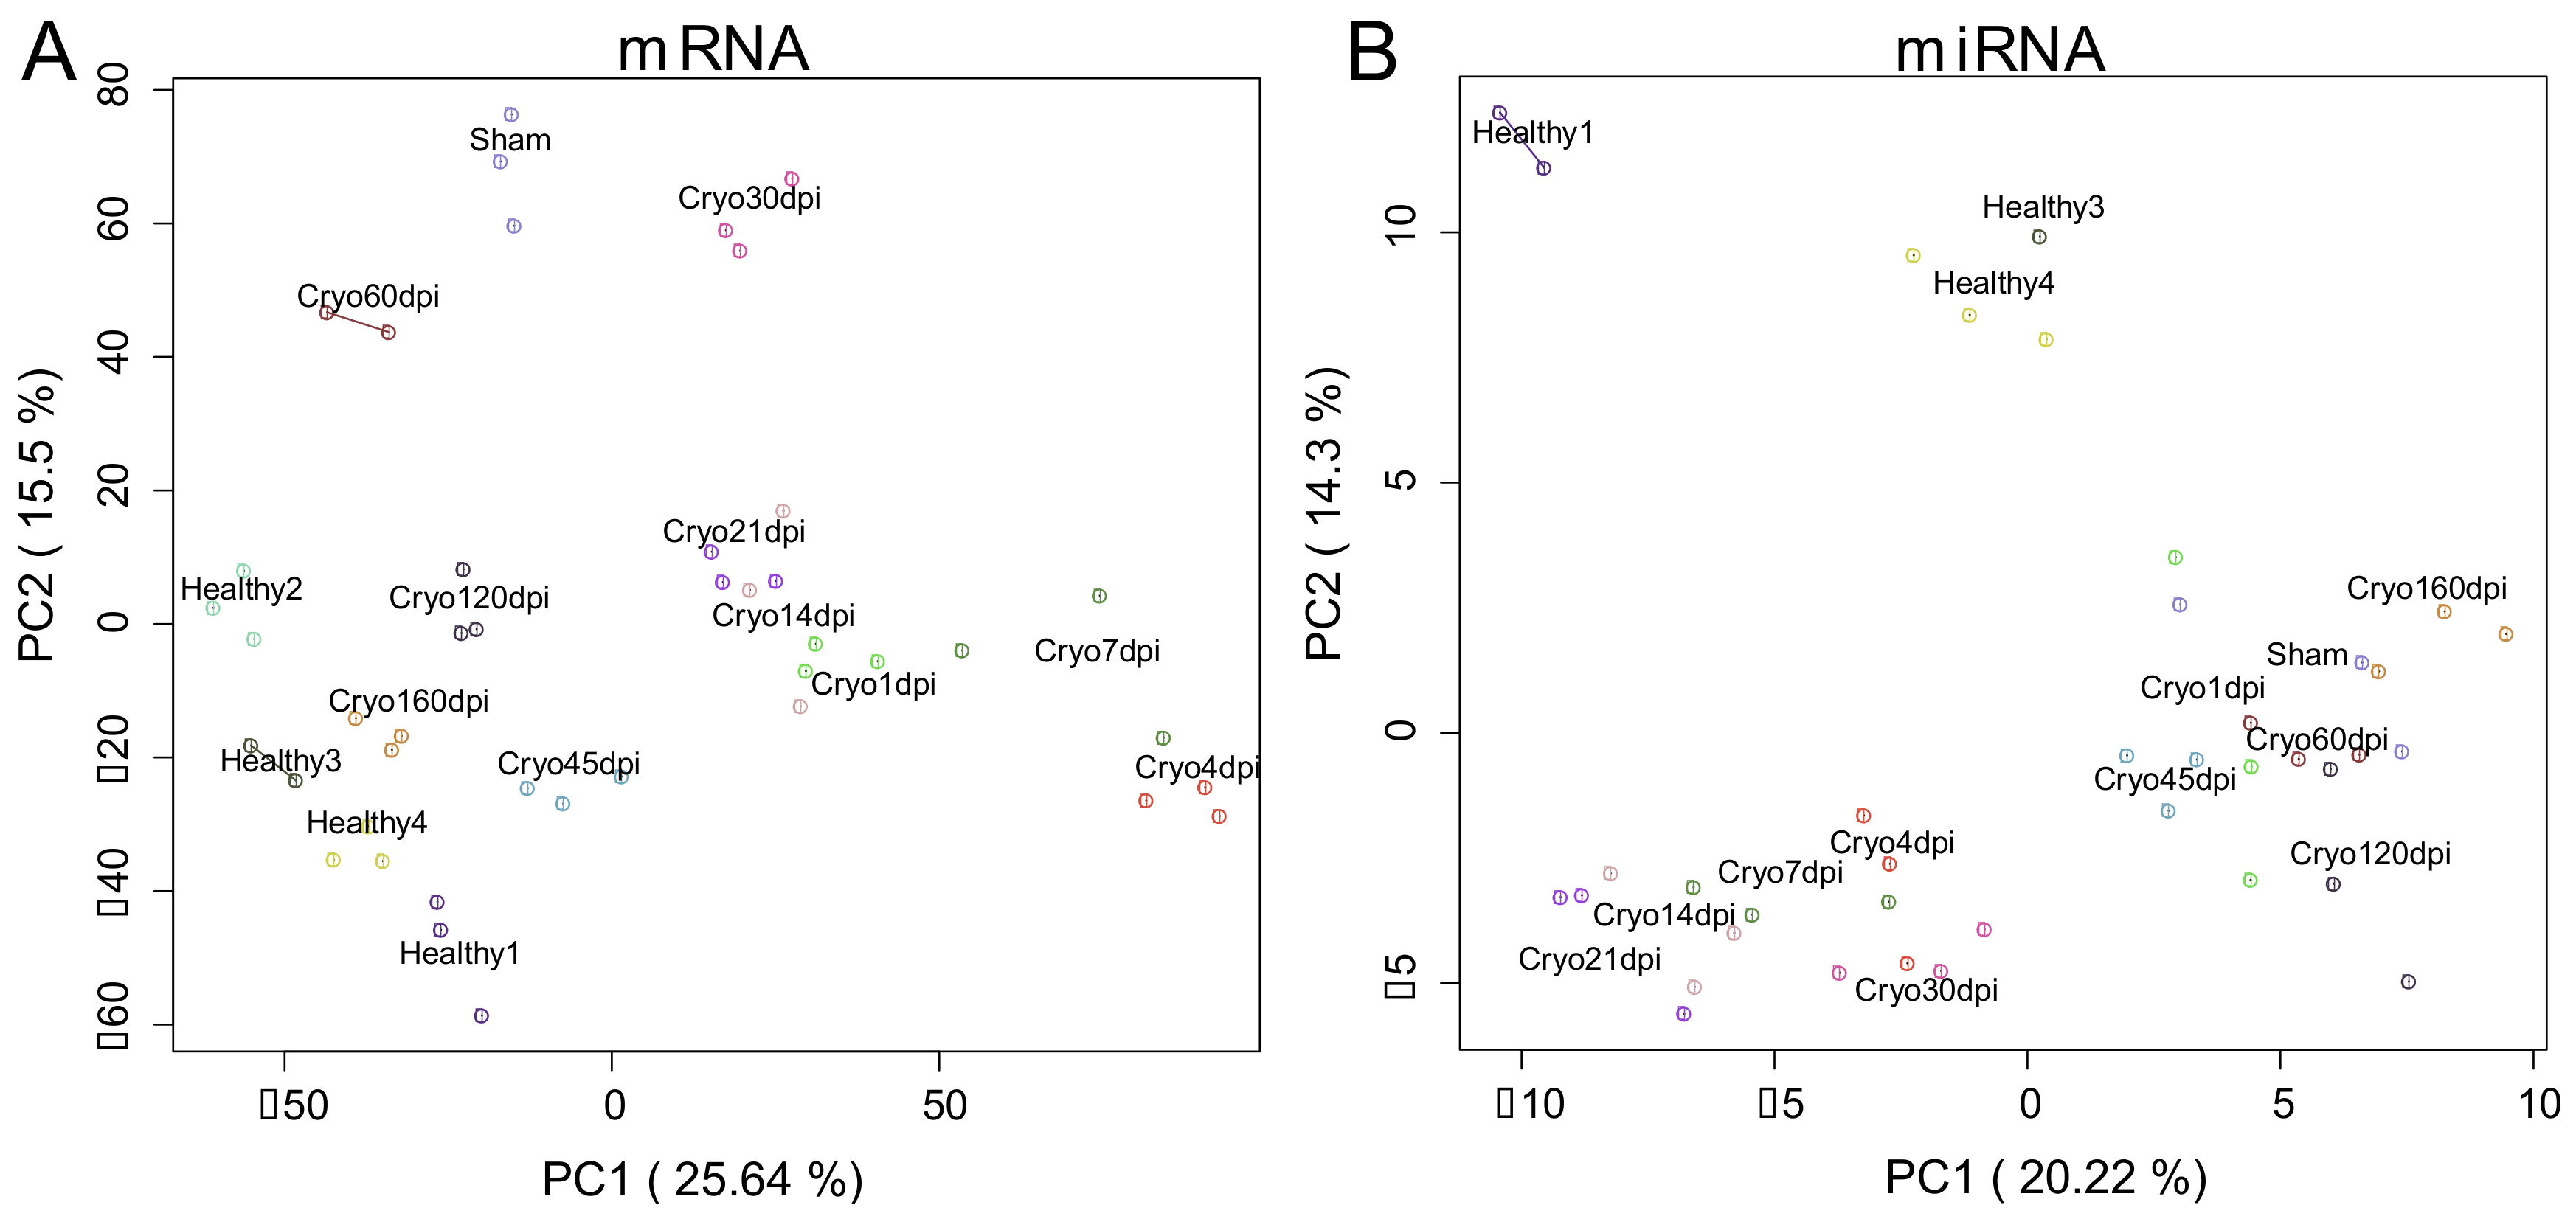
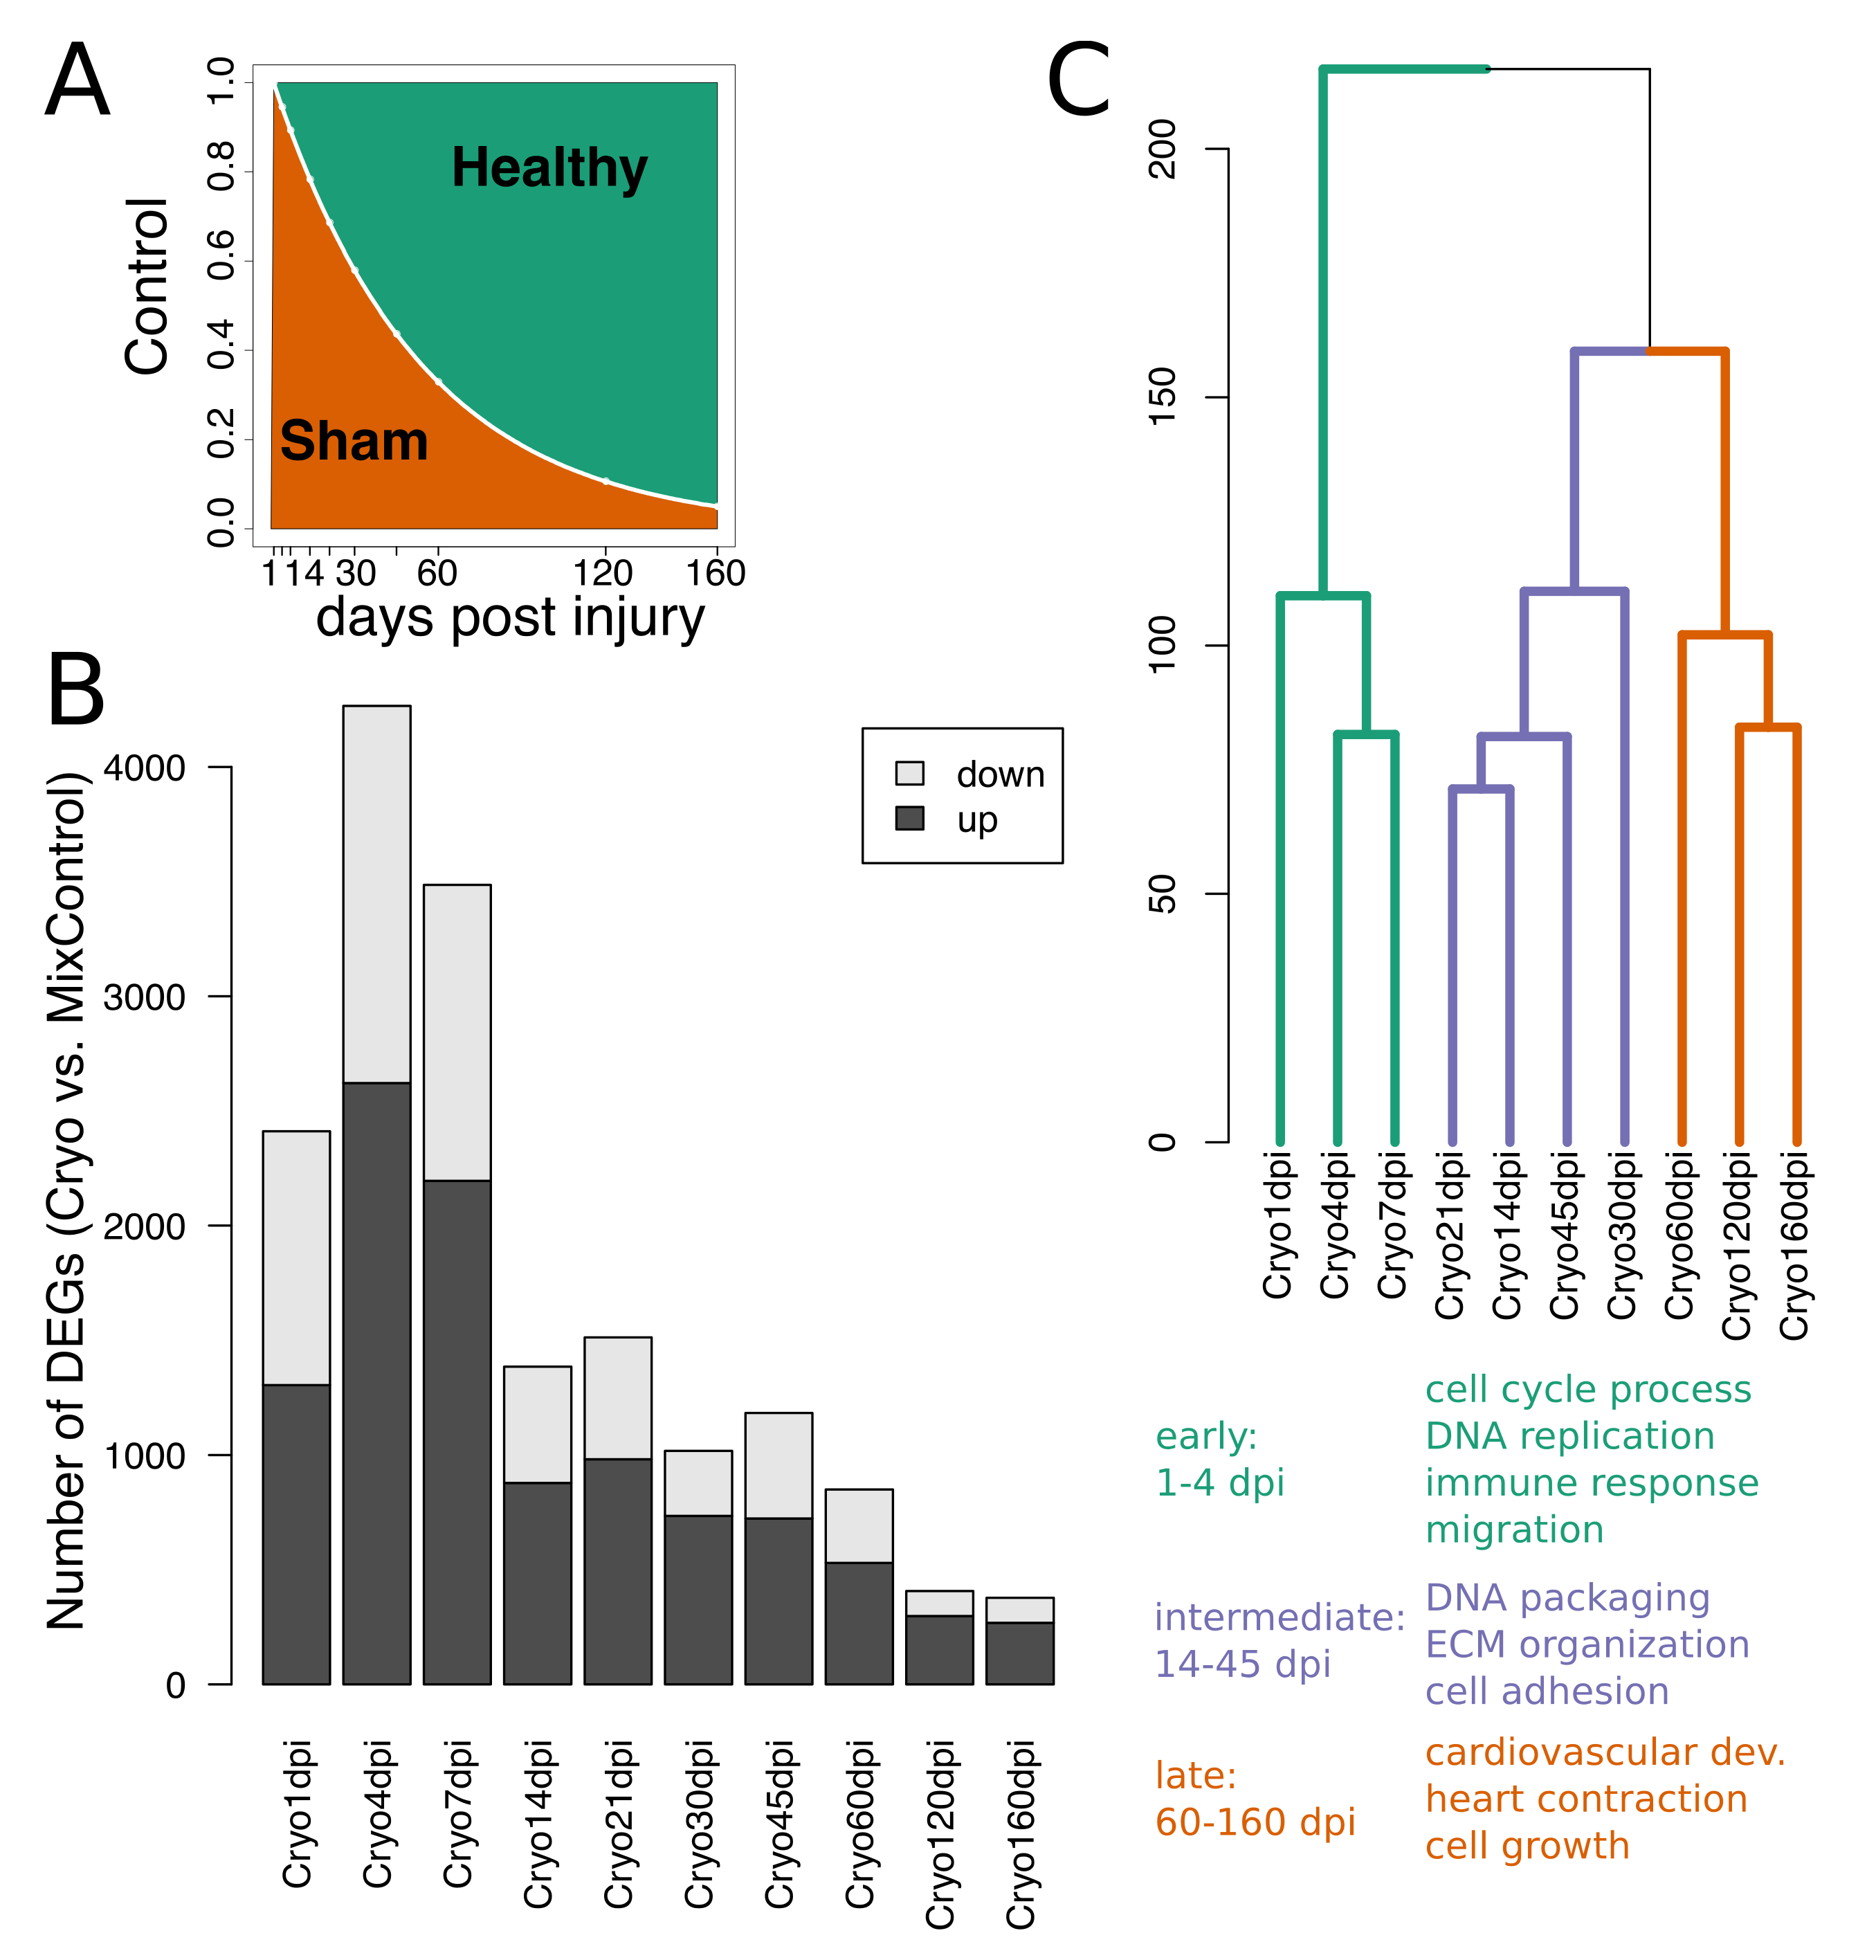
2.1. Extracting Cardiac Regenerative Transcriptome Responses after Cryoinjury in Zebrafish
2.2. Spatio-Temporal Organization during Cardiac Regeneration
2.3. Identification of miRNA-mRNA Interactions during Cardiac Regeneration
2.4. Validation of Players Involved in Proliferation in Differentiating H9c2 Cells
3. Discussion
4. Materials and Methods
4.1. Zebrafish Care and Cryoinjury
4.2. Cell Culture
4.3. RNA-Seq and Preprocessing
4.4. Mix-Control Modeling and Statistical Analysis
4.5. Spatio-Temporal Organization
4.6. miRNA-mRNA Predictions
4.7. Homologue Mapping between Zebrafish and Rat
5. Conclusions
Supplementary Materials
Author Contributions
Funding
Acknowledgments
Conflicts of Interest
References
- Benjamin, E.J.; Blaha, M.J.; Chiuve, S.E.; Cushman, M.; Das, S.R.; Deo, R.; de Ferranti, S.D. Heart Disease and Stroke Statistics—Update: A Report From the American Heart Association. Circulation 2017, 135, e146–603. [Google Scholar] [CrossRef] [PubMed]
- Porrello, E.R.; Ahmed, I.M.; Simpson, E.; Hill, J.A.; Richardson, J.A.; Olson, E.N.; Sadek, H.A. Transient Regenerative Potential of the Neonatal Mouse Heart. Science 2011, 331, 1078–1080. [Google Scholar] [CrossRef] [PubMed]
- Haubner, B.J.; Adamowicz-Brice, M.; Khadayate, S.; Tiefenthaler, V.; Metzler, B.; Aitman, T.; Penninger, J.M. Complete Cardiac Regeneration in a Mouse Model of Myocardial Infarction. Aging 2012, 4, 966–977. [Google Scholar] [CrossRef] [PubMed]
- Poss, K.D.; Wilson, L.G.; Keating, M.T. Heart Regeneration in Zebrafish. Science 2002, 298, 2188–2190. [Google Scholar] [CrossRef] [PubMed]
- Raya, A.; Koth, C.M.; Büscher, D.; Kawakami, Y.; Itoh, T.; Raya, R.M.; Sternik, G.; Tsai, H.-J.J. Activation of Notch Signaling Pathway Precedes Heart Regeneration in Zebrafish. Proc. Natl. Acad. Sci. USA 2003, 100, 11889–11895. [Google Scholar] [CrossRef] [PubMed]
- Gonzalez-Rosa, J.M.V.; Martin, M.; Peralta, M.; Torres, M.; Mercader, N. Extensive Scar Formation and Regression during Heart Regeneration after Cryoinjury in Zebrafish. Development 2011, 138, 1663–1674. [Google Scholar] [CrossRef] [PubMed]
- Chablais, F.; Veit, J.; Rainer, G.; Jaźwińska, A. The Zebrafish Heart Regenerates after Cryoinjury-Induced Myocardial Infarction. BMC Dev. Biol. 2011, 11, 21. [Google Scholar] [CrossRef]
- Hein, S.J.; Lehmann, L.H.; Kossack, M.; Juergensen, L.; Fuchs, D.; Katus, H.A.; Hassel, D. Advanced Echocardiography in Adult Zebrafish Reveals Delayed Recovery of Heart Function after Myocardial Cryoinjury. PLoS ONE 2015, 10, e0122665. [Google Scholar] [CrossRef]
- González-Rosa, J.M.; Guzmán-Martínez, G.; Marques, I.J.; Sánchez-Iranzo, H.; Jiménez-Borreguero, L.J.; Mercader, N. Use of Echocardiography Reveals Reestablishment of Ventricular Pumping Efficiency and Partial Ventricular Wall Motion Recovery upon Ventricular Cryoinjury in the Zebrafish. PLoS ONE 2014, 9, e115604. [Google Scholar] [CrossRef]
- Jopling, C.; Sleep, E.; Raya, M.; Martí, M.; Raya, A.; Belmonte, J.C.I. Zebrafish Heart Regeneration Occurs by Cardiomyocyte Dedifferentiation and Proliferation. Nature 2010, 464, 606–609. [Google Scholar] [CrossRef]
- Kikuchi, K.; Holdway, J.E.; Werdich, A.A.; Anderson, R.M.; Fang, Y.; Egnaczyk, G.F.; Evans, T.; a Macrae, C.; Stainier, D.J.R.; Poss, K.D. Primary Contribution to Zebrafish Heart Regeneration by gata4(+) Cardiomyocytes. Nature 2010, 464, 601–605. [Google Scholar] [CrossRef] [PubMed]
- Sleep, E.; Boué, S.; Jopling, C.; Raya, M.; Raya, A.; Belmonte, J.C.I. Transcriptomics Approach to Investigate Zebrafish Heart Regeneration. J. Cardiovasc. Med. 2010, 11, 369–380. [Google Scholar] [CrossRef] [PubMed]
- Tahara, N.; Brush, M.; Kawakami, Y. Cell Migration during Heart Regeneration in Zebrafish. Dev. Dyn. 2016, 245, 774–787. [Google Scholar] [CrossRef] [PubMed]
- Heallen, T.; Morikawa, Y.; Tao, G.; Willerson, J.T.; Johnson, R.L.; Martin, J.F. Hippo Signaling Impedes Adult Heart Regeneration. Development 2013, 140, 4683–4690. [Google Scholar] [CrossRef] [PubMed]
- Wu, C.C.; Kruse, F.; Vasudevarao, M.D.; Junker, J.P.; Zebrowski, D.C.; Fischer, K.; Emily, S. Spatially Resolved Genome-Wide Transcriptional Profiling Identifies BMP Signaling as Essential Regulator of Zebrafish Cardiomyocyte Regeneration. Dev. Cell 2016, 36, 36–49. [Google Scholar] [CrossRef] [PubMed]
- Lien, C.L.; Schebesta, M.; Makino, S.; Weber, G.J.; Keating, M.T. Gene Expression Analysis of Zebrafish Heart Regeneration. PLoS Biol. 2006, 4, e260. [Google Scholar] [CrossRef] [PubMed]
- Schindler, Y.L.; Garske, K.M.; Wang, J.; Firulli, B.; Firulli, A.B.; Poss, K.D.; Yelon, D. Hand2 Elevates Cardiomyocyte Production during Zebrafish Heart Development and Regeneration. Development 2014, 141, 3112–3122. [Google Scholar] [CrossRef]
- Fiedler, J.; Thum, T. MicroRNAs in Myocardial Infarction. Arteriosclerosis Thromb. Vasc. Biol. 2013, 33, 201–205. [Google Scholar] [CrossRef]
- Joladarashi, D.; Thandavarayan, R.; Babu, S.; Krishnamurthy, P. Small Engine, Big Power: MicroRNAs as Regulators of Cardiac Diseases and Regeneration. Int. J. Mol. Sci. 2014, 15, 15891–15911. [Google Scholar] [CrossRef]
- Didiano, D.; Hobert, O. Perfect Seed Pairing Is Not a Generally Reliable Predictor for miRNA-Target Interactions. Nat. Struct. Mol. Biol. 2006, 13, 849–851. [Google Scholar] [CrossRef]
- Wang, Y.-P.; Li, K.-B. Correlation of Expression Profiles between microRNAs and mRNA Targets Using NCI-60 Data. BMC Genomics 2009, 10, 218. [Google Scholar] [CrossRef] [PubMed]
- Friedman, R.C.; Farh, K.K.H.; Burge, C.B.; Bartel, B.P. Most Mammalian mRNAs Are Conserved Targets of microRNAs. Genome Res. 2009, 19, 92–105. [Google Scholar] [CrossRef] [PubMed]
- Yin, V.P.; Lepilina, A.; Smith, A.; Poss, K.D. Regulation of Zebrafish Heart Regeneration by miR-133. Dev. Biol. 2012, 365, 319–327. [Google Scholar] [CrossRef] [PubMed]
- Beauchemin, M.; Smith, A.; Yin, V.P. Dynamic microRNA-101a and Fosab Expression Controls Zebrafish Heart Regeneration. Development (Cambridge, England) 2015, 142, 4026–4037. [Google Scholar] [CrossRef] [PubMed]
- Crippa, S.; Nemir, M.; Ounzain, S.; Ibberson, M.; Berthonneche, C.; Sarre, A.; Boisset, G. Comparative Transcriptome Profiling of the Injured Zebrafish and Mouse Hearts Identifies miRNA-Dependent Repair Pathways. Cardiovasc. Res. 2016, 110, 73–84. [Google Scholar] [CrossRef] [PubMed]
- Moore, J.; Kasales, C.J.; Cheng, K.C.; Gerhard, G.S.; Kauffman, E.J.; Wang, X.; Stewart, R. Life Spans and Senescent Phenotypes in Two Strains of Zebrafish (Danio Rerio). Exp. Gerontol. 2002, 5565, 1055–1068. [Google Scholar] [CrossRef]
- Du Noüy, P.L. Cicatrization of Wounds: II. Mathematical Expression of the Curve Representing Cicatrization. J. Exp. Med. 1916, 24, 451–460. [Google Scholar] [CrossRef]
- Carleton, M.; Cleary, M.A.; Linsley, P.S. MicroRNAs and Cell Cycle Regulation. Cell Cycle 2007, 6, 2127–2132. [Google Scholar] [CrossRef]
- Lewis, B.P.; Burge, C.B.; Bartel, D.P. Conserved Seed Pairing, Often Flanked by Adenosines, Indicates That Thousands of Human Genes Are microRNA Targets. Cell 2005, 120, 15–20. [Google Scholar] [CrossRef]
- Yue, D.; Liu, H.; Huang, Y. Survey of Computational Algorithms for MicroRNA Target Prediction. Curr. Genomics 2009, 10, 478–492. [Google Scholar] [CrossRef]
- Rooij, E.v.; Sutherland, L.B.; Thatcher, J.E.; DiMaio, J.M.; Naseem, R.H.; Marshall, W.S.; Hill, J.; Olson, E.N. Dysregulation of microRNAs after Myocardial Infarction Reveals a Role of miR-29 in Cardiac Fibrosis. Proc. Natl. Acad. Sci. USA 2008, 105, 13027–13032. [Google Scholar] [CrossRef] [PubMed]
- Watkins, S.J.; Borthwick, G.M.; Arthur, H.M. The H9C2 cell line and primary neonatal cardiomyocyte cells show similar hypertrophic responses in vitro. In Vitro Cell. Dev. Biol. Anim. 2011, 47, 125–131. [Google Scholar] [CrossRef] [PubMed]
- Branco, A.F.; Pereira, S.P.; Gonzalez, S.; Gusev, O.; Rizvanov, A.A.; Oliveira, P.J. Gene Expression Profiling of H9c2 Myoblast Differentiation towards a Cardiac-like Phenotype. PLoS ONE 2015, 10, e0129303. [Google Scholar] [CrossRef] [PubMed]
- Rodius, S.; Androsova, G.; Götz, L.; Liechti, R.; Crespo, I.; Merz, S.; Nazarov, P.V. Analysis of the Dynamic Co-Expression Network of Heart Regeneration in the Zebrafish. Sci. Rep. 2016, 6, 26822. [Google Scholar] [CrossRef] [PubMed]
- Su, Z.; Si, W.; Li, L.; Zhou, B.; Li, X.; Xu, Y.; Xu, C.; Jia, H.; Wang, Q.K. MiR-144 Regulates Hematopoiesis and Vascular Development by Targeting meis1 during Zebrafish Development. Int. J. Biochem. Cell Biol. 2014, 49, 53–63. [Google Scholar] [CrossRef] [PubMed]
- Gu, J.-J.; Gao, G.-Z.; Zhang, S.-M. miR-218 Inhibits the Tumorgenesis and Proliferation of Glioma Cells by Targeting Robo1. Cancer Biomark. 2016, 16, 309–317. [Google Scholar] [CrossRef] [PubMed]
- Cheng, Y.; Yang, X.; Deng, X.; Zhang, X.; Li, P.; Tao, J.; Lu, Q. MicroRNA-218 Inhibits Bladder Cancer Cell Proliferation, Migration, and Invasion by Targeting BMI-1. Tumour Biol. J. Int. Soc. Oncodev. Biol. Med. 2015, 36, 8015–8023. [Google Scholar] [CrossRef] [PubMed]
- Zhu, K.; Ding, H.; Wang, W.; Liao, Z.; Fu, Z.; Hong, Y.; Zhou, Y. Tumor-Suppressive miR-218-5p Inhibits Cancer Cell Proliferation and Migration via EGFR in Non-Small Cell Lung Cancer. Oncotarget 2016, 7, 28075–28085. [Google Scholar] [CrossRef]
- Li, Y.; Deng, X.; Peng, X. The Role of Mir-148a in Cancer. J. Cancer 2016, 7, 1233–1241. [Google Scholar] [CrossRef]
- Lalwani, M.K.; Sharma, M.; Singh, A.R.; Chauhan, R.K.; Patowary, A.; Singh, N.; Scaria, V.; Sivasubbu, S. Reverse genetics screen in zebrafish identifies a role of miR-142a-3p in vascular development and integrity. PLoS ONE 2012, 7, e52588. [Google Scholar] [CrossRef]
- Song, C.; Wu, G.; Xiang, A.; Zhang, Q.; Li, W.; Yang, G.; Shi, X.E.; Sun, S.; Li, X. Over-Expression of miR-125a-5p Inhibits Proliferation in C2C12 Myoblasts by Targeting E2F3. Acta Biochim. Biophys. Sin. 2015, 47, 244–249. [Google Scholar] [CrossRef] [PubMed]
- Huang, W.; Feng, Y.; Liang, J.; Yu, H.; Wang, C.; Wang, B.; Wang, M. Loss of microRNA-128 Promotes Cardiomyocyte Proliferation and Heart Regeneration. Nat. Commun. 2018, 9, 700. [Google Scholar] [CrossRef] [PubMed]
- Westerfield, M. The Zebrafish Book. A Guide for the Laboratory Use of Zebrafish (Danio Rerio), 3rd ed.; University of Oregon Press: Eugene, OR, USA, 1995. [Google Scholar]
- Bolger, A.M.; Lohse, M.; Usadel, B. Trimmomatic: A Flexible Trimmer for Illumina Sequence Data. Bioinformatics 2014, 30, 2114–2120. [Google Scholar] [CrossRef] [PubMed]
- Dobin, A.; Davis, C.A.; Schlesinger, F.; Drenkow, J.; Zaleski, C.; Jha, S.; Batut, P.; Chaisson, M.; Gingeras, T.R. STAR: Ultrafast Universal RNA-Seq Aligner. Bioinformatics 2013, 29, 15–21. [Google Scholar] [CrossRef]
- Leek, J.T.; Storey, J.D. Capturing Heterogeneity in Gene Expression Studies by Surrogate Variable Analysis. PLoS Genet. 2007, 3, 1724–1735. [Google Scholar] [CrossRef] [PubMed]
- Robinson, M.D.; McCarthy, D.J.; Smyth, G.K. edgeR: A Bioconductor Package for Differential Expression Analysis of Digital Gene Expression Data. Bioinformatics 2009, 26, 139–140. [Google Scholar] [CrossRef]
- Kumar, L.; Futschik, M.E. Mfuzz: A Software Package for Soft Clustering of Microarray Data. Bioinformation 2007, 2, 5–7. [Google Scholar] [CrossRef]
- Durinck, S.; Spellman, P.T.; Birney, E.; Huber, W. Mapping Identifiers for the Integration of Genomic Datasets with the R/Bioconductor Package biomaRt. Nat. Protocols 2009, 4, 1184–1191. [Google Scholar] [CrossRef]


© 2018 by the authors. Licensee MDPI, Basel, Switzerland. This article is an open access article distributed under the terms and conditions of the Creative Commons Attribution (CC BY) license (http://creativecommons.org/licenses/by/4.0/).
Share and Cite
Klett, H.; Jürgensen, L.; Most, P.; Busch, M.; Günther, F.; Dobreva, G.; Leuschner, F.; Hassel, D.; Busch, H.; Boerries, M. Delineating the Dynamic Transcriptome Response of mRNA and microRNA during Zebrafish Heart Regeneration. Biomolecules 2019, 9, 11. https://doi.org/10.3390/biom9010011
Klett H, Jürgensen L, Most P, Busch M, Günther F, Dobreva G, Leuschner F, Hassel D, Busch H, Boerries M. Delineating the Dynamic Transcriptome Response of mRNA and microRNA during Zebrafish Heart Regeneration. Biomolecules. 2019; 9(1):11. https://doi.org/10.3390/biom9010011
Chicago/Turabian StyleKlett, Hagen, Lonny Jürgensen, Patrick Most, Martin Busch, Fabian Günther, Gergana Dobreva, Florian Leuschner, David Hassel, Hauke Busch, and Melanie Boerries. 2019. "Delineating the Dynamic Transcriptome Response of mRNA and microRNA during Zebrafish Heart Regeneration" Biomolecules 9, no. 1: 11. https://doi.org/10.3390/biom9010011
APA StyleKlett, H., Jürgensen, L., Most, P., Busch, M., Günther, F., Dobreva, G., Leuschner, F., Hassel, D., Busch, H., & Boerries, M. (2019). Delineating the Dynamic Transcriptome Response of mRNA and microRNA during Zebrafish Heart Regeneration. Biomolecules, 9(1), 11. https://doi.org/10.3390/biom9010011