Abstract
The characterization of the binding of reducing carbohydrates present as mixtures of anomers in solution to a sugar recepor (lectin) poses severe difficulties. In this situation, NMR spectroscopy enables the observation of signals for each anomer in the mixture by applying approaches based on ligand observation. Saturation transfer difference (STD) NMR allows fast and efficient screening of compound mixtures for reactivity to a receptor. Owing to the exceptionally favorable properties of 19F in NMR spectroscopy and the often complex 1H spectra of carbohydrates, 19F-containing sugars have the potential to be turned into versatile sensors for recognition. Extending the recently established 1H → 1H STDre19F-NMR technique, we here demonstrate its applicability to measure anomeric selectivity of binding in a model system using the plant lectin concanavalin A (ConA) and 2-deoxy-2-fluoro-d-mannose. Indeed, it is also possible to account for the mutual inhibition between the anomers on binding to the lectin by means of a kinetic model. The monitoring of 19F-NMR signal perturbation disclosed the relative activities of the anomers in solution and thus enabled the calculation of their binding affinity towards ConA. The obtained data show a preference for the α anomer that increases with temperature. This experimental approach can be extended to others systems of biomedical interest by testing human lectins with suitably tailored glycan derivatives.
1. Introduction
Glycoconjugates are abundant and ubiquitous in nature, suggesting functional significance. The enormous complexity of the glycan part of cellular glycoconjugates has delayed the interest in studying these biomolecules so that structure-activity relationships are emerging far behind those for proteins and nucleic acids [1]. In direct comparison, using sugars (the third alphabet of life) as platform, an unsurpassed density of information coding is realized in these glycan chains, the basis of the concept of the sugar code [2]. Strategically combined with sophisticated purification protocols and other analytical techniques, high-resolution 1H-nuclear magnetic resonance spectroscopy (NMR) has become a powerful tool in the quest to accomplish full structural elucidation of these natural “code words” [3,4,5,6]. For example, reporter-group signals provide essential information on the primary structure and substitution patterns [4,5,6]. When distinct glycan determinants are bound by their receptor (lectin) to “read the encoded information”, NMR continues to be a rich source of information on structural aspects, here on intimate details of the complex [7,8]. As a consequence of the broad physiological significance of glycan-lectin recognition processes, their study has revealed a potential for drug design [2]. Given the relevance of advances in NMR application for drug design [9,10], basic and applied research in structural glycobiology is sure to benefit from this technology. In this respect, monitoring different nuclei broadened in scope. Moving beyond 1H, 13C and 15N, the use of 19F was introduced four decades ago into the study of glycan-protein interactions, examining chemical shift perturbations and line broadening in the cases of lysozyme [11,12], wheat germ agglutinin [13,14] or concanavalin A [15]. Of note, fluorine has very favorable properties when considering NMR: the 19F nucleus, with 100% natural abundance, nuclear spin ½ and a gyromagnetic ratio close to that of 1H (0.94 γ19F/γ1H), has similar NMR sensitivity as a proton. Due to these favorable properties 19F-based NMR spectroscopy continues to open doors to new applications [16,17,18,19,20]. An additional benefit of using 19F-NMR is the absence of dynamic range and chemical exchange problems related to the large NMR signal of the common solvent water. In NMR studies of glycans, the residual water signal often masks key signals from the very diluted biological samples. The broad 19F-NMR observation range (200 ppm) can also avoid the frequent signal overlap in glycan 1H-NMR (less than 3 ppms wide for common carbohydrate molecules). This problem is further aggravated when working with mixtures of compounds. Overall, its pharmacological and NMR properties thus make the fluorine nucleus to an excellent atomic probe in interaction studies [16,17,18,19,20], prompting us to explore its use in protocols developed for drug screening, here adapted for a lectin (for recent reviews on biomedical aspects of glycan structure and recognition, please see [2,21,22,23]). Having started by using fluoro derivatives for probing into requirements for hydrogen binding [24,25,26,27] following classical chemical mapping strategies [28], it was thus tempting to proceed to evaluate 19F-NMR as reporter for lectin recognition. We here address the question on its applicability to infer anomer selectivity.
The legume lectin concanavalin A (ConA), isolated from jack bean (Canavalia ensiformis) seeds, is a common test model [29]. It selectively binds mannose and glucose. Studies with simple sugars revealed that the OH groups at C-3, C-4 and C-6 positions are essential and the α-anomeric position is preferred [30,31]. Reflecting the specificity for mannose/glucose, the substituent and stereochemistry at the C-2 position is of minor importance. Thus, methyl α-glycosides [32] and their respective fluoro and deoxy derivatives [33] of these sugars are ligands of ConA. 2-Deoxy-2-fluoro-d-mannose (2FDM, Scheme 1), where the axial hydroxyl at position 2 is replaced by a fluorine atom, belongs to this group. In solution, 2FDM is present as a mixture of anomers, establishing an attractive test system for 19F-NMR to reveal anomer selectivity by a lectin.
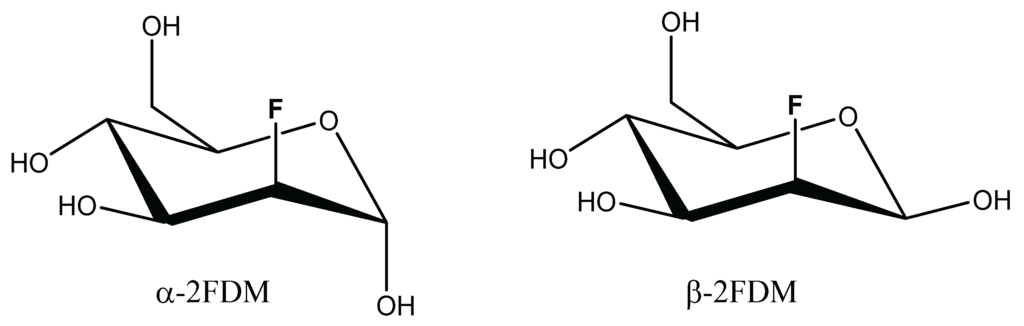
Scheme 1.
Formulas of 2-Deoxy-2-fluoro-d-mannose anomers.
Anomeric selectivity has been studied in enzymes involved in carbohydrate metabolism using kinetic approaches [34,35]. However, monitoring of substrate processing is not possible in the case of lectins, which by definition are devoid of any enzymatic activity on the bound ligand [36]. The common strategy to measure anomer selectivity engages a chemical modification at the anomeric position (a simple aglycon (methyl or isopropyl) introduction), hereby locking the molecule in its α or β configuration. Direct detection of differential recognition of each anomer without derivatives formation still remains a challenge, the available biophysical techniques in solution that relay information by receptor-based analysis provide an averaged macroscopic view of the recognition event involving the mixture of anomers in equilibrium. In principle, 1H-NMR spectroscopy may well pick up characteristic signals for each anomer, despite a chemical equilibrium exchange [37]. In addition to 1H, other nuclei can be used to determine the position of the anomeric equilibrium. As an instructive example, 13C-NMR has been recently used qualitatively to reveal the β-anomer preference for bacterial sugar-binding proteins involved in bacterial chemotaxis [38]. Moreover, a rare case of 3H-NMR was instrumental in detecting the anomeric preference of a maltose-binding protein [39]. As for 19F-NMR, it has been applied to monitor fluoroglucose exchange across membranes [40] as well as to differentiate the binding of N-trifluoroacetyl-glucosamine anomers to ConA [15] and more recently the binding of N-trifluoroacetyl-galactosamine anomers to winged bean agglutinin [41] following line broadening perturbations. With the aim to advance the status of 19F as versatile sensor in lectin research, we recently developed a 19F-detected STD NMR methodology, successfully tested for ConA [42,43]. Building on this foundation, the given strategy, in addition to overcome signal-overlap problems, can help to obtain quantitative information on the binding of each anomer by simplifying the observation to single and well-resolved fluorine signals for each of them. Obviously, such a procedure will circumvent the need of any chemical fixation of the anomeric position on the glycan.
STD NMR is a powerful and efficient technique that allows detecting association of low-molecular-weight ligands (<2000 Da) to comparatively large receptors (>20,000 Da) such as proteins [44,45]. Besides the identification of the ligand epitope (contact) STD can be used to measure dissociation constants by titrations experiments performed at different ligand concentrations [45,46]. However, as the transfer of spin saturation from the irradiated protein to the ligand is dependent on the irradiation time, the correlation between STD signals and the concentration of loaded binding sites cannot be obtained directly from the intensity of STD signals at a single saturation time. Thus, courses of saturation time dependency must be used to infer the initial velocities of saturation [47]. Also, the relaxation of ligand-saturated spins during the irradiation time, when the ligand is not bound to the protein, should also be taken into account [48,49,50]. Recently, we have applied a kinetic model based on the DynaFit software [51] that explicitly includes the rebinding and relaxation of already saturated ligand in one analysis of the experimental STD values [52]. Herein, we present the extension of this kinetic model to include, in an individualized way, the presence of the α and β anomers as two competing ligands in equilibrium.
2. Material and Methods
2.1. Chemicals and Reagents
2FDM was obtained from Toronto Research Chemicals (Toronto, ON, Canada).
2.2. Purification of ConA
The lectin was purified from extracts of of Canavalia ensiformis by affinity chromatography on mannose-bearing Sepharose 4B, as described previously [31].
2.3. NMR Experiments
The experiments were performed at 280, 290, 300 and 310K using New Era 5 mm borosilicate tubes (reference NE-SL5-7). Samples contained 90 µM ConA and 2FDM concentrations ranging from 0 to 12.1 mM, dissolved in 99.9% D2O-based PBS ([NaCl] = 138 mM; [KCl] = 2.7 mM; [Na2HPO4] = 10.1 mM; [NaH2PO4] = 1.8 mM) at pD 7.0.
STD experiments were carried out on a Bruker Advance III 600 MHz spectrometer equipped with a 19F, 1H double resonance fluorine-selective (SEF) probe optimized for direct 19F detection and equipped with a z-spoil gradient coil (Bruker Biospin, Rheinstetten, Germany). The experiments were recorded using the described 1H → 1H STDre19F-NMR pulse sequence [42]. Selective saturation of the protein signal was obtained using a standard STD pulse train of multiple Gaussian pulses with a saturation time ranging between 0.75 and 12 s depending of the experiment. On-resonance irradiation of the protein was performed at a proton chemical shift of 0.93 ppm, and off-resonance irradiation was set to 145 ppm. STD spectra were acquired with a total of transients varying from 128 to 1 K.
Inversion recovery experiments to measure T1 relaxation times were carried out on samples with 2FDM at 12.1 mM and by means of a pseudo 2D spectrum recording a series of 32 fluorine spin inversion spectra with proton decoupling, varying the recovery delay time after spin inversion between 0.75 s up to 8.5 s and a prescan delay of 4 s. All fluorine spectra were recorded using a 40 ppm spectral width centered at −210 ppm (trifluoroacetic acid signal at −76.55 ppm was used as fluorine reference). Spectra were processed with TOPSPIN2.1 (Bruker, Rheinstetten, Germany).
2.4. Kinetic Model
The program DynaFit [51] was used to process the experimental data within the model. As follows, we describe the components, chemical equations (Equations 1–17), kinetic constants, concentrations and experimental data sets (Equations 18 and 19) that were used:
2.4.1. Components
Ligand, 2FDM; [α]total + [α]total = [2FDM]total
R, receptor (ConA); R*, steady-state saturated receptor during on-resonance irradiation time
α, unsaturated α anomer; β, unsaturated β anomer
α*, saturated α anomer; β*, saturated β anomer
2.4.2. Equations
| R* + α ⇆ R*α | koffα/kon = KDα (konα ≡ konβ ≡ kon) | (1) |
| R* + β ⇆ R*β | koffβ/kon = KDβ (konβ ≡ konα ≡ kon) | (2) |
| R*α → R*α* | km (kmα ≡ kmβ) | (3) |
| R*β → R*β* | km (kmβ ≡ kmα) | (4) |
| α* → α | krα | (5) |
| β* → β | krβ | (6) |
| R* + α* ⇆ R*α* | koffα/kon (KDα* ≡ KDα) | (7) |
| R* + β* ⇆ R*β* | koffβ/kon (KDβ* ≡ KDβ) | (8) |
2.4.3. Derived Differential Equations Used in Dynafit Fitting Proccedure
| d[R*]/dt = −kon[R*][α] + koffα[R*α] − kon[R*][α*] + koffα[R*α*] − kon[R*][β] + koffβ[R*β] − kon[R*][β*] + koffβ[R*β*] | (9) |
| d[α]/dt = −kon[R*][α] + koffα[R*α] + krα[α*] | (10) |
| d[α*]/dt = −kon[R*][α*] + koffα[R*α*] − krα[α*] | (11) |
| d[β]/dt = −kon[R*][β] + koffβ[R*β] + krβ[β*] | (12) |
| d[β*]/dt = −kon[R*][β*] + koffβ[R*β*] − krβ[β*] | (13) |
| d[R*α]/dt = +kon[R*][α] − koffα[R*α] − km[R*α] | (14) |
| d[R*β]/dt = +kon[R*][β] − koffβ[R*β] − km[R*β] | (15) |
| d[R*α*]/dt = +kon[R*][α*] − koffα[R*α*] + km[R*α] | (16) |
| d[R*β*]/dt = +kon [R*][β*] − koffβ[R*β*] + km[R*β] | (17) |
2.4.4. Constants
kon, fixed constant at 108 M−1 s−1 for both anomers (approximation to diffusion-controlled process).
koffα; koffβ; km; krα; krβ. Adjustable constants.
2.4.5. Concentrations
Concentration of ConA (R*) was 0.09 mM in all experiments: [α]total and [β]total were calculated by knowing the total concentration of 2FDM and the anomeric ratio, canomer, obtained from the integration of the corresponding fluorine NMR peaks:
[α]total + [β]total = [2FDM]total; concentration used: 0.96; 1.94; 4.14; 5.57 and 12.1 mM
canomer = [α]total/[β]total, constant value for each temperature: (1.92; 1.92; 1.82; 1.72 for 280 K, 290 K, 300 K and 310 K respectively).
2.4.6. Experimental Data Sets
For every temperature (280 K, 290 K, 300 K and 310 K) and 2FDM concentration (0.96; 1.94; 4.14; 5.57 and 12.1 mM) the corresponding saturation time course (0.75, 1.5, 3, 6 and 12 s) data series of formal concentrations of saturated anomers, α* and β* were obtained from the experimental percentages of saturation of each anomer:
α* = %STDα × [α]total
β* = %STDβ × [β]total
3. Results and Discussions
As mentioned in the introduction, the 19F-observed STD NMR approach does not suffer from signal overlap when dealing with carbohydrates. Thus, it yields a maximally simplified, background-free spectrum of α and β anomers. In this system, the regular 1H → 1H STD analysis would provide incomplete information, due to the overlap of proton signals (either H1 or H2 of the ligands) with the signal of residual HDO (Figure 1, left).
The prerequisite for this type of analysis is the existence of a significant difference between the relative STD signal (ratio of signal in the difference spectra and signal in the off-resonance spectra) of the α and the β anomer, which is fulfilled (Figure 1, right). This clearly observable difference between both anomers (1.1% and 0.5% STD for α and β, respectively at 280 K and with 0.75 s irradiation) makes it possible to quantify the binding affinity of each anomer.
First, a control experiment was conducted with 2FDM in the absence and presence of ConA, with the purpose of testing if any direct saturation transfer between the anomers occurs due to the anomeric exchange. This blank experiment corresponds to the regular saturation transfer experiment (as employed to detect dimethyl formamide chemical exchange around the amide bond). The irradiation on α-2FDM, with saturation times (tsat) ranging from 0.75 to 60 s, yielded no β-2FDM 19F signal (and vice versa), indicating that, at the time scale of the STD scan acquisitions, the kinetics of the anomeric exchange are considerably slower and do not interfere with the kinetics of the intermolecular (protein-sugar) saturation transfer. Therefore, the behavior of each anomer can be independently evaluated.
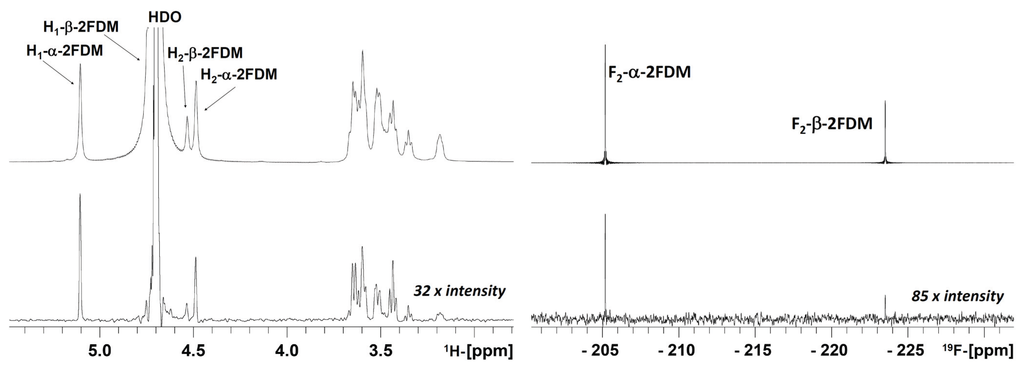
Figure 1.
1H → 1H STD and 1H → 1H STDre19F STD decoupled spectra of a 2FDM/ConA sample, in 99% D2O at 280 K and 0.75 s irradiation. At the left: 1H → 1H STD spectrum (bottom) and corresponding off-resonance spectrum (at the top). Several proton signals, H1 and H2 of β-2FDM and H2 of α-2FDM, are positioned under or very close to the HDO signal at this temperature and its STD information is lost; at the right: 1H → 1H STDre19F (bottom) and the reference 19F off-resonance spectrum (at the top). Ligand (2FDM) and lectin (ConA) were present at 12.1 mM and 90 µM concentrations, respectively.
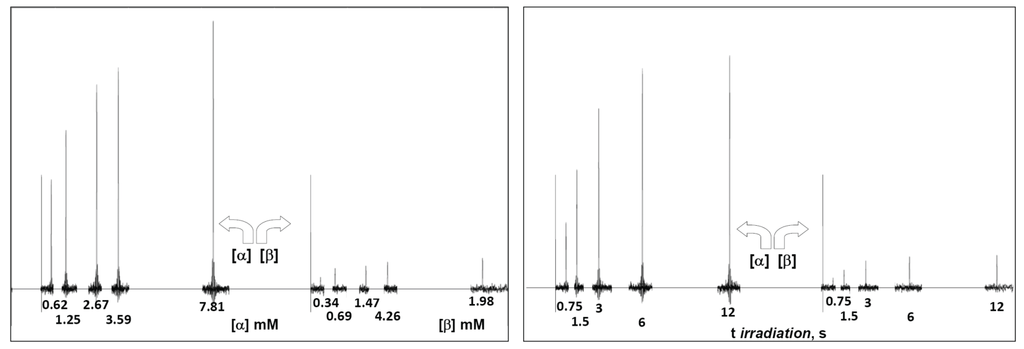
Figure 2.
(Left) Serial STD spectra as a function of ligand concentration obtained at 300 K, 0.09 mM ConA and 3 s saturation time with anomeric percentages of 64.5% and 35.5% for α-2FDM and β-2FDM, respectively. The concentration of each anomer is below each signal, and each spectrum is shifted proportionally to the variable condition (ligand concentration); (Right) Serial STD difference spectra as a function of saturation time obtained at 290 K with 0.09 mM ConA and 12.1 mM total concentration of 2DFM with 65.8% and 34.2% for α and β anomer, respectively; the saturation time of each experiment is below each signal, and each spectrum is shifted proportionally to the variable condition (spin irradiation time).
Next, full-scale saturation curves at different ligand concentrations were obtained by performing series of STD experiments with increasing saturation times (0.75, 1.5, 3, 6 and 12 s) and at four different temperatures (280, 290, 300 and 310 K). As examples of STD spectra, Figure 2 shows the raw data of a set of overlaid STD experiments. In one set, the STD intensity dependency on sugar concentration at one protein saturation time (3 s) and one fixed temperature (300 K) is shown. The alternative set displays the STD intensity dependency on the saturation time at one particular sugar concentration (12.1 mM) and a different temperature (290 K). At each temperature, the anomeric ratio was calculated from the intensity ratio of the fluorine signals between both anomers. The α/β ratio varies between 1.7 (310 K) and 1.9 (280 K) in favor of α anomer, as expected for a manno- configuration, and is close to the 2.2 value reported previously [53]. As additional example, Figure 3 presents the growing curves of the STD (in percentages), as calculated from the spectra obtained at 290 K. They are represented as functions of the saturation time and the sugar concentration.
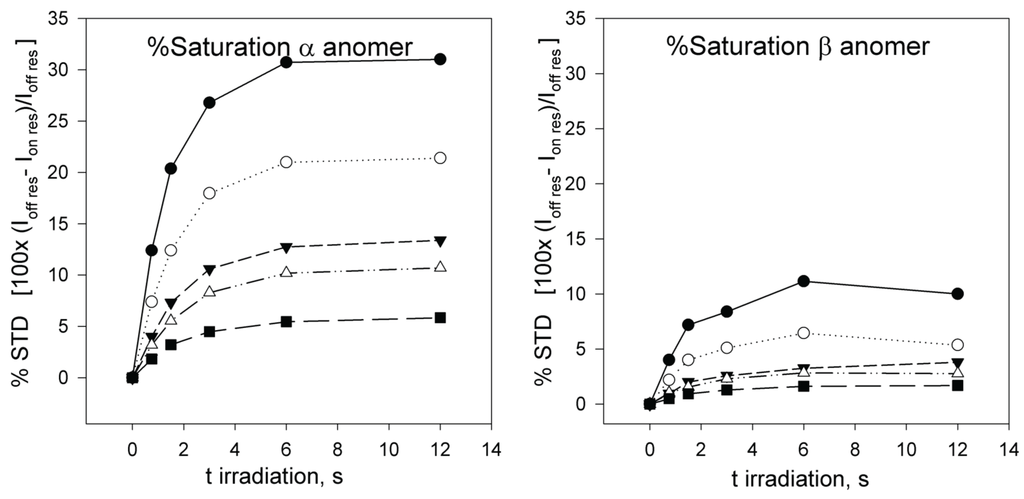
Figure 3.
% STD build-up curves obtained at 290 K for α-2FDM (left) and β-2FDM (right) in the presence of ConA (90 µM) at several total concentrations of monosaccharide 0.96 (●); 1.94 (○); 4.14 (▼); 5.57 (Δ); and 12.1 mM (■) (anomer percentages 66% α-2FDM and 34% β-2FDM). The representation of 19F STD intensity versus saturation time shows that a stationary state, where saturation is compensated by relaxation, is reached at an approximate spin irradiation time of 6 s.
The percentage of saturation follows the standard definition in STD experiments, see equation 20 [45]:
where Ioff res corresponds to the signal intensity in the off-resonance spectrum, Ion res to the signal intensity in the on-resonance spectrum and (Ioff res − Ion res) to the signal intensity in the difference STD spectrum (Figure 3). This percentage of saturation for each anomer can easily be transformed into the formal concentration of each anomer already saturated by multiplying by the total anomer concentration, see methods, equations 18 and 19.
%STD = 100 × (Ioff res − Ion res)/Ioff res
Then it is possible to apply a kinetic model to these saturation progress curves, similar to the treatment of an enzymatic reaction, where the steady-state saturated receptor during the on-resonance spectrum can be likened to an “enzyme” catalyzing the transfer of saturation to the ligand. The following chemical equilibrium and kinetic steps must be considered:
[R] = [R*] (concentration of receptor, whose spins are steady-state saturated (R*) in the on-resonance spectra).
Binding equilibrium:
R* + L ⇆ R*L
Kinetic step of saturation transfer:
R*L → R*L*
Dissociation and rebinding of already saturated ligand rendering an unproductive complex:
R* + L* ⇆ R*L*
Relaxation of saturated ligand when not associated to the receptor:
L* → L
With this simple kinetic model, it is possible to calculate corresponding dissociation and kinetic constants:
KD, dissociation constant of the binding equilibrium, equation 20:
KD = koff/kon = [R*].[L]/[R*L] = [R*].[L*]/[R*L*]
km = magnetization transfer kinetic constant of the kinetic step R*L → R*L*.
kr = spin relaxation velocity constant for the process L* → L related with the inverse of the longitudinal relaxation time T1.
The build-up curves of saturated ligand at different concentrations can now be used to estimate the three parameters, KD, km and kr by applying non-linear fitting procedures used in enzymatic studies, as implemented in DynaFit [51,52].
Of special note in the case of the anomeric mixture, both anomers must be simultaneously considered as reciprocal inhibitors: one inhibits the binding of the other and vice versa [37]. Moreover, the system cannot be studied with a simple competitive inhibition approach by varying inhibitor and ligand concentrations independently, because the concentrations of both anomers are correlated by the anomerization equilibrium and both simultaneously vary. This behavior has already been described for enzyme inhibition studies, when the competitive inhibitor was a contaminant of the substrate (ratio inhibitor/substrate constant) [54] and, with relevance to glycan recognition, in the case of the binding of anomers of N-acetylglucosamine to lysozyme [37]. Thus, in the case of a given mixture of anomers in equilibrium (αtotal⇆ βtotal, canomer = [α]total/[β]total), a double set of equilibrium and kinetic equations with their corresponding constants (see Methods, equations 1 to 19) must be considered.
Assuming that bound α- and β-2FDM ligands (and the protein) adopt closely related geometries in their bound states, then magnetization transfer towards the fluorine atom in both anomers is carried out in a similar manner. As an approximation, the magnetization transfer constant km will have the same value for both anomers (kmα = kmβ = km), reflecting that the 19F atom is axial in both cases. In sharp contrast, the 1H → 1H STD of the well-resolved anomeric protons will be based on their different axial or equatorial orientations, with distinct saturation pathways. In our case, the two anomers interact with ConA, albeit with different affinities (see Figure 4).
The calculated saturated concentrations of both anomers from the experimental STD percentages at every concentration and saturation time were globally fitted to a series of kinetic differential equations corresponding to the above model using the DynaFit software [51] (Figure 4). Instead of directly using the equilibrium dissociation constants (KDα and KDβ), the kinetic dissociation constants (koffα and koffβ) were used as adjustable parameters. First, the association constant kon was considered to be constant and fixed to the diffusion-limited encounter at 108 M−1·s−1.This is a reasonable approximation of the kinetics of binding monosaccharides to ConA. Interestingly, it has been shown that, when analyzing STD data in processes that are not diffusion-controlled, the kinetics of the association must be considered [55]. Therefore, our kinetic model allows for checking the dependency of the dissociation constant by varying the association kinetics. Using this approach, it was possible to satisfactorily confirm that the use of kon values even as small as 105 M−1 s−1 did not appreciably modify the obtained equilibrium dissociation constants. We can take 105 as a safe lower limit considering the reported value measured by SPR for the association constant between ConA and mannan polisaccharides [56]. The relaxation constants (krα and krβ) for each anomer and the magnetization transfer constant, km (the same for both anomers) were also taken as adjustable parameters (Table 1).
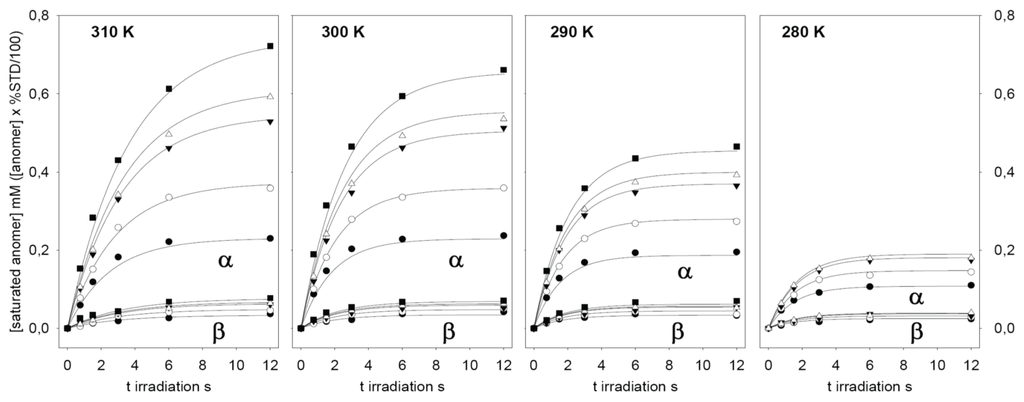
Figure 4.
Time-dependent build-up curves of ligand saturation, expressed in mM, obtained for α-2FDM (upper lines) and β-2FDM (lower lines) in the presence of ConA (90 µM). Five different total concentrations of 2FDM, i.e., 0.96 (●); 1.94 (○); 4.14 (▼); 5.57 (Δ); and 12.1 mM (■), were studied from 0 to 12 s irradiation time and at four temperatures. The solid lines correspond to calculated curves for each 2FDM concentration obtained from the global fitting of the experimental data at each temperature to the kinetic model (see Methods and text) with DynaFit [51] (data for the highest concentration of 2FDM at 280K was excluded from the fitting). Values derived from the fitting for the dissociation constants are in Table 1.
These relaxations velocities account for the observed flattening of the saturation build-up curves at long saturation times (Figure 3 and Figure 4). Interestingly, these relaxation velocities show a faster relaxation for the β anomer and also an inverse dependency on temperature: the observed values decreased when the temperature was increased. This behavior is also related with the inverse of the longitudinal relaxation time T1, experimentally measured for 19F in the absence of proton saturation (Table 1). Longer T1 values for the α anomer 19F signal were observed. Furthermore, the T1 relaxation times for both anomers increased with temperature, as expected for small molecules with faster molecular tumbling at high temperatures.
The data presented in Table 1 reveal a clear preference of ConA for the α anomer of 2FDM, in accordance with its known specificity for α-mannosides. It is possible to calculate an apparent macroscopic dissociation constant KD from data obtained with the mixture of unsubstituted monosaccharides (Table 1). In this case, the combined dissociation constant for 2FDM (0.78 mM−1 at 290 K) is in the range for those described for mannose and glucose (0.45 mM−1 at 290 K and 1.8 mM−1 at 292 K, respectively) [32] or 2-fluorodeoxyglucose (2.2 mM−1 at 298 K) [33]. Interestingly, the observed anomer selectivity showed a temperature dependency. The preference towards the α anomer was increased from 2.2 times at 280 K to more than five times at 310 K.

Table 1.
α- and β-2FDM dissociation (KDα and KDβ), magnetization (km) and relaxation constants (krα and krα) calculated by fitting to differential kinetic equations with DynaFit [51]. Experimental relaxivities (R = 1/T1) and anomeric ratios were measured at each temperature by inversion recovery NMR experiments and 1D- 19F spectral information obtained from the ratio of the corresponding peak of each anomer, respectively. Errors correspond to the standard deviation for each parameter obtained after non-linear fitting. For comparison, the calculated combined macroscopic dissociation constant corresponding to the total monosaccharide concentration is included.
| Temperature K | 280 | 290 | 300 | 310 |
|---|---|---|---|---|
| KDα (mM) | 0.43 ± 0.04 | 0.59 ± 0.04 | 0.68 ± 0.05 | 0.88 ± 0.05 |
| KDβ (mM) | 1.15 ± 0.2 | 2.1 ± 0.24 | 3.1 ± 0.5 | 4.7 ± 0.7 |
| KD (mM) ª | 0.54 | 0.78 | 0.94 | 1.15 |
| krα (s−1) | 0.57 ± 0.02 | 0.46 ± 0.01 | 0.35 ± 0.01 | 0.25 ± 0.01 |
| 1/T1α (s−1) | 0.84 | 0.66 | 0.50 | 0.42 |
| krβ (s−1) | 0.60 ± 0.09 | 0.53 ± 0.07 | 0.45 ± 0.09 | 0.30 ± 0.06 |
| 1/T1β (s−1) | 0.95 | 0.79 | 0.59 | 0.50 |
| km (s−1) | 1.6 ± 0.06 | 3.1 ± 0.07 | 3.4 ± 0.01 | 2.84 ± 0.07 |
| %α %β | 65.9% 34.1% | 65.8% 34.2% | 64.5% 35.5% | 63.3% 36.7% |
ª Macroscopic KD for total concentration of monosaccharide: KD = ([α] + [β])*[R]/([Rα] + [Rβ]) and can be deduced KD = (1 + 1*canomer)*(Kα*Kβ)/(Kα + Kβ*canomer).
4. Conclusions
A broad range of techniques have been employed to monitor ligand binding to lectins in solution (for an overview, please see Table 1 in [57]). We here extend our previously developed concept of using 19F-NMR spectroscopy by 1H → 1H STDre19F monitoring [42,43]. Using a common test system (ConA, 2FDM), at different concentrations and temperatures, anomer selectivity could be measured, without signal overlap and without the requirement for chemical modifications. Obviously, the sensor capacity of 19F is sufficient for obtaining quantitative data and can thus inspire further applications in advancing our understanding of structural aspects of lectin-carbohydrate interaction in solution, e.g., when working with human lectins such as the adhesion/growth-regulatory galectins [58].
Acknowledgments
The authors acknowledge the financial support from MINECO, Spain (project CTQ2012-32025) and the EC-funded Marie Curie Initial Training Network GLYCOPHARM (PITN-GA-2012-317297) and thank the reviewers for their valuable input.
Author Contributions
João P. Ribeiro, Tammo Diercks, Sabine André and Francisco Javier Cañada performed experiments. Tammo Diercks developed NMR-pulse sequences. João P. Ribeiro, Tammo Diercks, Sabine André, Jesús Jiménez-Barbero, Hans-Joachim Gabius and Francisco Javier Cañada analyzed results and wrote the paper. Jesús Jiménez-Barbero, Hans-Joachim Gabius and Francisco Javier Cañada designed and coordinated the work.
Abbreviations
| 2FDM | 2-fluoro-2-deoxy- d-mannose |
| 2α-FDM | 2-fluoro-2-deoxy-α- d-mannose |
| 2β-FDM | 2-fluoro-2-deoxy-β- d-mannose |
| ConA | concanavalin A |
| STD | Saturation Transfer Difference |
| NMR | Nuclear Magnetic Resonance |
| 1H → 1H STDre19F-NMR | H,H-Saturation Transfer Difference (STD) experiment with relay to 19F |
Conflicts of Interest
The authors declare no conflict of interest.
References
- Roseman, S. Reflections on glycobiology. J. Biol. Chem. 2001, 276, 41527–41542. [Google Scholar] [CrossRef] [PubMed]
- Gabius, H.-J. The Sugar Code: Fundamentals of Glycosciences; Wiley-VCH: Weinheim, Germany, 2009. [Google Scholar]
- Jiménez-Barbero, J.; Peters, T. NMR Spectroscopy of Glycoconjugates; Wiley-VCH: Weinheim, Germany, 2002. [Google Scholar]
- Kamerling, J.P.; Vliegenthart, J.F.G. High-resolution 1H-nuclear magnetic resonance spectroscopy of oligosaccharide-alditols released from mucin-type O-glycoproteins. In Carbohydrates and Nucleic Acids; Berliner, L., Reuben, J., Eds.; Springer: New York, NY, USA, 1992; Volume 10, pp. 1–194. [Google Scholar]
- Vliegenthart, J.F.G.; Dorland, L.; VanHalbeek, H. High-resolution, 1H-nuclear magnetic resonance spectroscopy as a tool in the structural analysis of carbohydrates related to glycoproteins. Adv. Carbohydr. Chem. Biochem. 1983, 41, 209–374. [Google Scholar]
- Vliegenthart, J.F.G.; van Halbeek, H.; Dorland, L. The applicability of 500 MHz high-resolution 1H-NMR spectroscopy for the structure determination of carbohydrates derived from glycoproteins. Pure Appl. Chem. 1981, 53, 45–77. [Google Scholar] [CrossRef] [Green Version]
- Poveda, A.; Jiménez-Barbero, J. NMR studies of carbohydrate-protein interactions in solution. Chem. Soc. Rev. 1998, 27, 133–143. [Google Scholar] [CrossRef]
- Roldos, V.; Cañada, F.J.; Jiménez-Barbero, J. Carbohydrate-protein interactions: A 3D view by NMR. ChemBioChem 2011, 12, 990–1005. [Google Scholar] [CrossRef] [PubMed]
- Diercks, T.; Coles, M.; Kessler, H. Applications of NMR in drug discovery. Curr. Opin. Chem. Biol. 2001, 5, 285–291. [Google Scholar] [CrossRef]
- Homans, S.W. NMR spectroscopy tools for structure-aided drug design. Angew. Chem. Int. Ed. 2004, 43, 290–300. [Google Scholar] [CrossRef] [PubMed]
- Dwek, R.A.; Kent, P.W.; Xavier, A.V. N-Fluoroacetyl-d-glucosamine as a molecular probe of lysozyme structure using 19F fluorine nuclear magnetic resonance techniques. Eur. J. Biochem. 1971, 23, 343–348. [Google Scholar] [CrossRef] [PubMed]
- Millett, F.; Raftery, M.A. 19F Nuclear magnetic resonance study of binding of trifluoroacetylglucosamine oligomers to lysozyme. Biochemistry 1972, 11, 1639–1643. [Google Scholar] [CrossRef] [PubMed]
- Midoux, P.; Grivet, J.P.; Monsigny, M. Lectin-sugar interactions: The binding of 1-O-methyl-di-N-trifluoroacetyl-b-chitobioside to wheat germ agglutinin. FEBS Lett. 1980, 120, 29–32. [Google Scholar] [CrossRef]
- Jordan, F.; Bahr, H.; Patrick, J.; Woo, P.W. Nuclear magnetic resonance studies on wheat germ agglutinin-monomeric amino sugar interactions. Arch. Biochem. Biophys. 1981, 207, 81–86. [Google Scholar] [CrossRef]
- Alter, G.M.; Magnuson, J.A. Characterization of concanavalin A sugar binding site by 19F nuclear magnetic resonance. Biochemistry 1974, 13, 4038–4045. [Google Scholar] [CrossRef] [PubMed]
- Dalvit, C. Ligand- and substrate-based 19F-NMR screening: Principles and applications to drug discovery. Prog. Nucl. Magn. Reson. Spectrosc. 2007, 51, 243–271. [Google Scholar] [CrossRef]
- Cobb, S.L.; Murphy, C.D. 19F-NMR applications in chemical biology. J. Fluor. Chem. 2009, 130, 132–143. [Google Scholar] [CrossRef]
- Bartusik, D.; Tomanek, B. Detection of 19F-labeled biopharmaceuticals in cell cultures with magnetic resonance. Adv. Drug Deliv. Rev. 2013, 65, 1056–1064. [Google Scholar] [CrossRef] [PubMed]
- Chen, H.; Viel, S.; Ziarelli, F.; Peng, L. 19F-NMR: A valuable tool for studying biological events. Chem. Soc. Rev. 2013, 42, 7971–7982. [Google Scholar] [CrossRef] [PubMed]
- Yu, J.X.; Hallac, R.R.; Chiguru, S.; Mason, R.P. New frontiers and developing applications in 19F-NMR. Prog. Nucl. Magn. Reson. Spectrosc. 2013, 70, 25–49. [Google Scholar] [CrossRef] [PubMed]
- Gabius, H.-J.; Kaltner, H.; Kopitz, J.; André, S. The glycobiology of the CD system: A dictionary for translating marker designations into glycan/lectin structure and function. Trends Biochem. Sci. 2015, 40, 360–376. [Google Scholar] [CrossRef] [PubMed]
- Gabius, H.-J. The magic of the sugar code. Trends Biochem. Sci. 2015. [Google Scholar] [CrossRef] [PubMed]
- André, S.; Kaltner, H.; Manning, J.C.; Murphy, P.V.; Gabius, H.-J. Lectins: Getting familiar with translators of the sugar code. Molecules 2015, 20, 1788–1823. [Google Scholar] [CrossRef] [PubMed]
- Solís, D.; Jiménez-Barbero, J.; Martín-Lomas, M.; Díaz-Mauriño, T. Probing hydrogen-bonding interactions of bovine heart galectin-1 and methyl β-lactoside by use of engineered ligands. Eur. J. Biochem. 1994, 223, 107–114. [Google Scholar] [CrossRef] [PubMed]
- Solís, D.; Fernández, P.; Díaz-Mauriño, T.; Jiménez-Barbero, J.; Martín-Lomas, M. Hydrogen-bonding pattern of methyl β-lactoside binding to the Ricinus communis lectins. Eur. J. Biochem. 1993, 214, 677–683. [Google Scholar] [CrossRef] [PubMed]
- Lemieux, R.U. The origin of the specificity in the recognition of oligosaccharides by proteins. Chem. Soc. Rev. 1989, 18, 347–374. [Google Scholar] [CrossRef]
- Solís, D.; Romero, A.; Kaltner, H.; Gabius, H.-J.; Diaz-Mauriño, T. Different architecture of the combining site of the two chicken galectins revealed by chemical mapping studies with synthetic ligand derivatives. J. Biol. Chem. 1996, 271, 12744–12748. [Google Scholar] [PubMed]
- Bhattacharyya, L.; Brewer, C.F. Lectin-carbohydrate interactions—Studies of the nature of hydrogen-bonding between d-galactose and certain d-galactose-specific lectins, and between d-mannose and concanavalin A. Eur. J. Biochem. 1988, 176, 207–212. [Google Scholar] [CrossRef] [PubMed]
- Bittiger, H.; Schnebli, H.P. Concanavalin A as a Tool; Wiley: London, UK, 1976; p. 639. [Google Scholar]
- Goldstein, I.J.; Hollerman, C.E.; Smith, E.E. Protein-carbohydrate interaction. II. Inhibition studies on the interaction of concanavalin A with polysaccharides. Biochemistry 1965, 4, 876–883. [Google Scholar] [CrossRef] [PubMed]
- Smith, E.E.; Goldstein, I.J. Protein-carbohydrate interaction. V. Further inhibition studies directed toward defining the stereochemical requirements of the reactive sites of concanavalin A. Arch. Biochem. Biophys. 1967, 121, 88–95. [Google Scholar] [PubMed]
- Schwarz, F.P.; Puri, K.D.; Bhat, R.G.; Surolia, A. Thermodynamics of monosaccharide binding to concanavalin A, pea (Pisum sativum) lectin, and lentil (Lens culinaris) lectin. J. Biol. Chem. 1993, 268, 7668–7677. [Google Scholar] [PubMed]
- Schwarz, F.P.; Misquith, S.; Surolia, A. Effect of substituent on the thermodynamics of d-glucopyranoside binding to concanavalin A, pea (Pisum sativum) lectin and lentil (Lens culinaris) lectin. Biochem. J. 1996, 316, 123–129. [Google Scholar] [CrossRef] [PubMed]
- Benkovic, S.J. Anomeric specificity of carbohydrate-utilizing enzymes. Methods Enzymol. 1979, 63, 370–379. [Google Scholar] [PubMed]
- Salas, J.; Salas, M.; Viñuela, E.; Sols, A. Glucokinase of rabbit liver. J. Biol. Chem. 1965, 240, 1014–1018. [Google Scholar] [PubMed]
- Gabius, H.-J.; André, S.; Jiménez-Barbero, J.; Romero, A.; Solís, D. From lectin structure to functional glycomics: Principles of the sugar code. Trends Biochem. Sci. 2011, 36, 298–313. [Google Scholar] [CrossRef] [PubMed]
- Dahlquist, F.W.; Raftery, M.A. A nuclear magnetic resonance study of association equilibria and enzyme-boud environments of N-acetyl-d-glucosamine anomers and lysozyme. Biochemistry 1968, 7, 3269–3276. [Google Scholar] [CrossRef] [PubMed]
- Borrok, M.J.; Kiessling, L.L.; Forest, K.T. Conformational changes of glucose/galactose-binding protein illuminated by open, unliganded, and ultra-high-resolution ligand-bound structures. Protein Sci. 2007, 16, 1032–1041. [Google Scholar] [CrossRef] [PubMed]
- Gehring, K.; Williams, P.G.; Pelton, J.G.; Morimoto, H.; Wemmer, D.E. Tritium NMR spectroscopy of ligand binding to maltose-binding protein. Biochemistry 1991, 30, 5524–5531. [Google Scholar] [CrossRef] [PubMed]
- Potts, J.R.; Kuchel, P.W. Anomeric preference of fluoroglucose exchange across human red-cell membranes. 19F-NMR studies. Biochem. J. 1992, 281, 753–759. [Google Scholar] [CrossRef] [PubMed]
- Katiyar, S.; Singh, A.; Surolia, A. The interaction of N-trifluoroacetylgalactosamine and its derivatives with winged bean (Psophocarpus tetragonolobus) basic agglutinin reveals differential mechanism of their recognition: A fluorine-19 nuclear magnetic resonance study. Glycoconj. J. 2014, 31, 537–543. [Google Scholar] [CrossRef] [PubMed]
- Diercks, T.; Ribeiro, J.P.; Cañada, F.J.; André, S.; Jiménez-Barbero, J.; Gabius, H.-J. Fluorinated carbohydrates as lectin ligands: Versatile sensors in 19F-detected saturation transfer difference NMR spectroscopy. Chem. Eur. J. 2009, 15, 5666–5668. [Google Scholar] [CrossRef] [PubMed]
- André, S.; Cañada, F.J.; Shiao, T.C.; Largartera, L.; Diercks, T.; Bergeron-Brlek, M.; el Biari, K.; Papadopoulos, A.; Ribeiro, J.P.; Touaibia, M.; et al. Fluorinated carbohydrates as lectin ligands: biorelevant sensors with capacity to monitor anomer affinity in 19F-NMR-based inhibitor screening. Eur. J. Org. Chem. 2012, 2012, 4354–4364. [Google Scholar] [CrossRef]
- Mayer, M.; Meyer, B. Characterization of ligand binding by saturation transfer difference NMR spectroscopy. Angew. Chem. Int. Ed. 1999, 38, 1784–1788. [Google Scholar] [CrossRef]
- Meyer, B.; Peters, T. NMR spectroscopy techniques for screening and identifying ligand binding topProtein receptors. Angew. Chem. Int. Ed. 2003, 42, 864–890. [Google Scholar] [CrossRef] [PubMed]
- Angulo, J.; Nieto, P.M. STD-NMR: Application to transient interactions between biomolecules—A quantitative approach. Eur. Biophys. J. 2011, 40, 1357–1369. [Google Scholar] [CrossRef] [PubMed]
- Angulo, J.; Enríquez-Navas, P.M.; Nieto, P.M. Ligand-receptor binding affinities from saturation transfer difference (STD) NMR spectroscopy: The binding isotherm of STD initial growth rates. Chem. Eur. J. 2010, 16, 7803–7812. [Google Scholar] [CrossRef] [PubMed]
- Kemper, S.; Patel, M.K.; Errey, J.C.; Davis, B.G.; Jones, J.A.; Claridge, T.D.W. Group epitope mapping considering relaxation of the ligand (GEM-CRL): Including longitudinal relaxation rates in the analysis of saturation transfer difference (STD) experiments. J. Magn. Reson. 2010, 203, 1–10. [Google Scholar] [CrossRef] [PubMed]
- Yan, J.L.; Kline, A.D.; Mo, H.P.; Shapiro, M.J.; Zartler, E.R. The effect of relaxation on the epitope mapping by saturation transfer difference NMR. J. Magn. Reson. 2003, 163, 270–276. [Google Scholar] [CrossRef]
- Jayalakshmi, V.; Krishna, N.R. Complete relaxation and conformational exchange matrix (CORCEMA) analysis of intermolecular saturation transfer effects in reversibly forming ligand-receptor complexes. J. Magn. Reson. 2002, 155, 106–118. [Google Scholar] [CrossRef] [PubMed]
- Kuzmic, P. DynaFit: A software package for enzymology. Methods Enzymol. 2009, 467, 247–280. [Google Scholar] [PubMed]
- Marcelo, F.; Garcia-Martin, F.; Matsushita, T.; Sardinha, J.; Coelho, H.; Oude-Vrielink, A.; Koller, C.; Andre, S.; Cabrita, E.J.; Gabius, H.-J.; et al. Delineating binding modes of Gal/GalNAc and structural elements of the molecular recognition of tumor-associated mucin glycopeptides by the human macrophage galactose-type lectin. Chem. Eur. J. 2014, 20, 16147–16155. [Google Scholar] [CrossRef] [PubMed]
- Phillips, L.; Wray, V. Stereospecific electronegative effects. Part I. The 19F nuclear magnetic resonance spectra of deoxyfluoro-d-glucopyranoses. J. Chem. Soc. B 1971. [Google Scholar] [CrossRef]
- Tubbs, P.K. Effects of inhibitors on mitochondrial d-α-hydroxy acid dehydrogenase. Biochem. J. 1962, 82, 36–42. [Google Scholar] [CrossRef] [PubMed]
- Pederson, K.; Mitchell, D.A.; Prestegard, J.H. Structural characterization of the DC-SIGN-LewisX complex. Biochemistry 2014, 53, 5700–5709. [Google Scholar] [CrossRef] [PubMed]
- Vornholt, W.; Hartmann, M.; Keusgen, M. SPR studies of carbohydrate-lectin interactions as useful tool for screening on lectin sources. Biosens. Bioelectron. 2007, 22, 2983–2988. [Google Scholar] [CrossRef] [PubMed]
- Solís, D.; Bovin, N.V.; Davis, A.P.; Jiménez-Barbero, J.; Romero, A.; Roy, R.; Smetana, K., Jr.; Gabius, H.-J. A guide into glycosciences: How chemistry, biochemistry and biology cooperate to crack the sugar code. Biochim. Biophys. Acta 2015, 1850, 186–235. [Google Scholar] [CrossRef] [PubMed]
- Kaltner, H.; Gabius, H.-J. A toolbox of lectins for translating the sugar code: The galectin network in phylogenesis and tumors. Histol. Histopathol. 2012, 27, 397–416. [Google Scholar] [PubMed]
© 2015 by the authors; licensee MDPI, Basel, Switzerland. This article is an open access article distributed under the terms and conditions of the Creative Commons Attribution license (http://creativecommons.org/licenses/by/4.0/).