1. Introduction
China ranks among the world’s leading producers of dairy products. However, the lactation performance of Chinese Holstein cattle still needs improvement compared with other countries. For example, the average annual MY (milk yield) per Holstein cow in the United States was 10,603 kg, whereas in China it was approximately 8300 kg in 2020, indicating a productivity gap between the two countries’ dairy industries [
1]. The Chinese dairy industry mainly relies on Holstein cows, whose lactation traits largely determine economic returns and are important indicators of milk quality [
2]. Lactation traits, including MY, milk fat percentage (MFP), and milk protein percentage (MPP), are widely recognized and commonly used as primary indicators for determining both the productivity of dairy cattle and the quality of milk produced [
3]. These traits are influenced by both environmental and genetic factors. Among environmental factors, management practices, heat stress, and nutrition can significantly affect lactation performance [
4]. However, improvements in management and feeding have limitations, and genetic factors are likely the key to sustainably enhancing milk production. Therefore, genetic improvement of Holstein cattle represents a promising strategy to increase MY, optimize milk composition, and ultimately improve the efficiency and profitability of China’s dairy industry.
The ELF5 (E74-like ETS transcription factor 5), which belongs to the
ETS (E26 transformation-specific) transcription factor family and is characterized as a key epithelial-specific member, was initially discovered in 1998 and has been reported to be broadly expressed in multiple tissues, including the mammary gland [
5]. During the development of the mammalian mammary gland as well as the lactation process, ELF5 has been identified as a crucial regulatory factor governing mammary acinar cell lineage commitment, the morphogenesis of breast tissue, and the onset and initiation of lactation [
6]. Deletion or dysregulation of ELF5 directly results in impaired acinar development and arrested mammary tissue growth, severely compromising the establishment and maintenance of normal lactation function [
6]. Recent livestock research has demonstrated that ELF5 in buffalo mammary gland tissue exerts a positive regulatory effect on essential lactation-associated physiological processes, such as the proliferation of mammary epithelial cells and the synthesis of milk proteins, primarily through the modulation of classical lactation signaling pathways, including the JAK2–STAT5 axis and the PI3K/AKT1/mTOR signaling pathway [
7]. Meanwhile, investigations employing an in vitro cell model such as MAC-T have shown that progesterone markedly promotes the upregulation of
ELF5 expression, along with genes associated with milk component synthesis, thereby further reinforcing the role of ELF5 as a critical functional regulator involved in milk synthesis and lactation processes in dairy cattle [
8]. Although the lactation-regulatory function of
ELF5 has been preliminarily validated, current studies have mainly focused on functional characterization and signaling pathway exploration. Research on genetic variations in the
ELF5 gene in dairy cattle remains limited, particularly regarding the association between
ELF5 SNPs and lactation traits in Chinese Holstein cattle. This gap greatly restricts the application of
ELF5 in molecular marker-assisted breeding programs for dairy cattle.
MicroRNAs (miRNAs) are short regulatory non-coding RNA molecules that control gene expression after transcription by associating with complementary sequences within the 3′ UTR of mRNAs, resulting in reduced protein synthesis or enhanced transcript decay [
9,
10,
11]. Evidences indicated that differential miRNA expression plays an important role in regulating lactation performance, mammary gland health, and reproductive traits in dairy cows [
12]. For example, miR-126-3p exhibits stage-specific expression associated with MY and somatic cell score (SCS) in subsequent lactations. In addition, the ratio of miR-127 to miR-30c-5p modulates milk fat and protein synthesis, thereby influencing milk quality and yield. Furthermore, miR-142-5p, along with related miRNA combinations, is associated with key reproductive traits such as calving interval [
13]. These findings suggest that miRNAs regulate multiple economically important traits through diverse mechanisms. Nevertheless, most studies have focused on single miRNA–trait associations, and it remains unclear whether miRNAs can directly target
ELF5 to modulate mammary epithelial cell proliferation and thereby influence lactation.
Therefore, this study used a total of 1314 Chinese Holstein dairy cows as the experimental population and integrated phenotypic data on lactation traits to perform association analyses for identifying SNPs in the ELF5 gene. This approach aimed to identify functional SNPs associated with lactation traits and further elucidate the genetic mechanisms by which ELF5 variants regulate these traits in dairy cattle. In addition, MAC-T cells were used as an in vitro model to validate miRNA-targeted regulatory effects and investigate molecular mechanisms through which miRNAs regulate mammary epithelial cell proliferation and lactation traits. This study provides new insights into the regulatory mechanisms underlying lactation traits mediated by ELF5 and miRNAs, and further establishes a theoretical basis for molecular breeding strategies and genetic improvement in dairy cattle.
2. Materials and Methods
2.1. Blood Sample Collection
A total of 1314 Holstein dairy cows from Jiangsu Province, China, were selected for this study. All animals were raised under the same feeding and management conditions. This study followed the guidelines of the Ethics Committee of the College of Animal Science and Technology of Northwest A&F University (DK2026061566).
Blood samples were collected from the ear vein of each cow. Before sampling, the collection site was cleaned and disinfected, and blood samples were collected into anticoagulant tubes containing EDTA. The collected blood samples were immediately transported to the laboratory under cold-chain conditions and stored at −20 °C until genomic DNA extraction. Genomic DNA was extracted from blood samples and used for PCR amplification, Sanger sequencing, genotype identification, and subsequent association analysis between the identified polymorphism and milk production traits.
2.2. Genomic DNA Extraction
Genomic DNA was extracted using Tris-saturated phenol-phenol–chloroform methods according to the manufacturer’s protocol [
14]. In brief, blood samples were lysed with lysis buffer, followed by protein digestion with proteinase K (Solarbio, P9460, Beijing, China). The lysates were extracted with an equal volume of Tris-saturated phenol and phenol–chloroform mixture to remove proteins and other impurities. After centrifugation, the aqueous phase was carefully collected, and genomic DNA was precipitated with ethanol. The DNA pellets were washed with 70% ethanol, air-dried, and dissolved in DEPC water (Solarbio, R1600, Beijing, China). The quality and concentration of extracted DNA were determined using a spectrophotometer (NanoDrop One, Thermo Fisher Scientific, Waltham, MA, USA), and DNA samples were stored at −80 °C until further analysis.
2.3. Cell Culture
The MAC-T and HEK-293T cell lines were kindly provided by Professor Xingping Wang (Ningxia University, Yinchuan, Ningxia, China). MAC-T and HEK-293T cell lines were grown in DMEM (HyClone, SH30243.01, Marlborough, MA, USA) containing 10% fetal bovine serum (Daxi Biotechnology, DX-1001, Hohhot, Inner Mongolia Autonomous Region, China) along with 1% penicillin–streptomycin (Solarbio, P7630, Beijing, China) and incubated at 37 °C in a humidified atmosphere of 5% CO2. After thawing, cells were rapidly recovered in complete medium and cultured in T25 culture flasks at 37 °C in a humidified atmosphere containing 5% CO2. The culture medium was replaced every day, and cells were passaged when they reached the logarithmic growth phase. Cells were expanded for several passages before being used for experiments. For cryopreservation, cells were suspended in freezing fetal bovine serum containing 10% dimethyl sulfoxide (DMSO) (Solarbio, D8371, Beijing, China) and stored in liquid nitrogen for long-term preservation.
2.4. Polymerase Chain Reaction (PCR)
The amplification was performed using Novagen Taq polymerase. First, a total of 9.5 μL of DEPC-treated water was dispensed into the PCR tube, after which 1 μL (100 ng) of DNA was subsequently added to the reaction mixture. Then, 1 μL of each primer was added, and finally, 12.5 μL of Taq mix was added. PCR amplification was carried out with an initial denaturation step at 95 °C for 3 min, after which 30 cycles of amplification were performed, each comprising denaturation at 95 °C for 5 s, annealing at 55 °C for 30 s, and extension at 72 °C for 5 s, followed by a final extension step at 72 °C for 5 min. Primers were designed based on the reference sequence of the bovine ELF5 gene available in the NCBI database to amplify the genomic region containing the candidate polymorphic site. The sequences of primers for amplifying the ELF5 g.32793 locus were: Forward 5′-TGGCTCAAGCTGTCAACACA-3′; Reverse 5′-TGCGTACCCATCAGGTAGGA-3′.
Following PCR amplification, the PCR products were purified and submitted to Sangon Biotech (Shanghai, China) for Sanger sequencing.
2.5. Kompetitive Allele-Specific PCR (KASP)
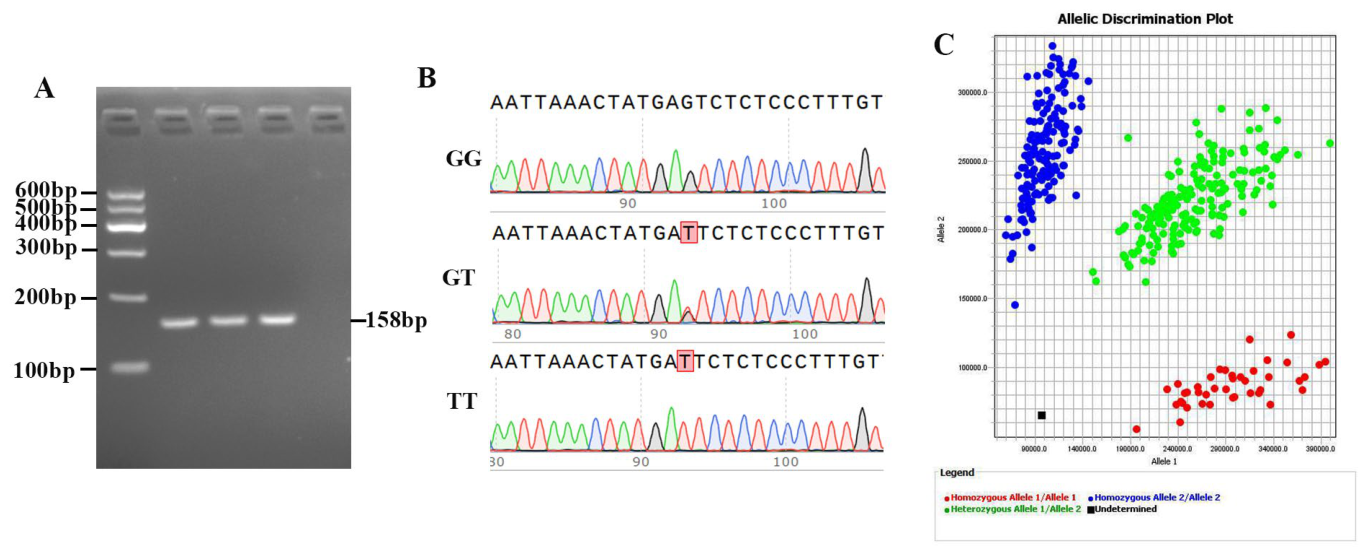
The KASP genotyping assay was carried out using a touchdown PCR program. PCRs contained 2× KASP Master Mix, two allele-specific forward primers (Primer 1 and Primer 2), a reverse primer, diluted genomic DNA template (20 ng), and ddH2O in a final volume of 10 μL. After amplification, fluorescence signals of FAM and HEX channels were collected at 30 °C using a real-time PCR system. Genotypes were automatically clustered and classified based on fluorescence intensity values: homozygous genotype TT for the FAM-labeled allele, homozygous genotype GG for the HEX-labeled allele, and heterozygous genotype GT carrying both alleles. Samples with ambiguous or low fluorescence signals were excluded from subsequent statistical analysis. The primer sequences used for KASP were as follows: Primer 1, Forward 5′-GAAGGTGACCAAGTTCATGCTGGTAGGAAAACAAAGGGAGAGAA-3′; Primer 2, Forward 5′-GAAGGTCGGAGTCAACGGATTGGTAGGAAAACAAAGGGAGAGAC-3′; Reverse 5′-CTGACGGCTCTGTAATAGGCAA. The quality of KASP genotyping was evaluated based on fluorescence clustering patterns. Clear separation of genotype clusters was observed, and all samples were successfully assigned to corresponding genotypes. In addition, representative samples with different genotypes were randomly selected for Sanger sequencing validation, and the sequencing results were consistent with the KASP genotyping results, confirming the accuracy of the genotyping assay.
2.6. MAC-T Cell Proliferation Assay Using EdU Assay
In this study, the EdU assay was performed to evaluate the proliferation ability of bovine mammary epithelial cells. The EdU detection in this study was conducted using the EdU Kit (Beyotime, C0075S, Shanghai, China). First, cells were exposed to pre-warmed EdU working solution for 2 h. After incubation, fixation was carried out using 4% paraformaldehyde for 15–20 min, then washed three times with PBS (Mishushengwu, MI00625, Shaanxi, China). And using 0.3% Triton X-100 (Solarbio, T8205, Beijing, China) was used for permeabilization for 20 min, and subsequently incubated with the EdU reaction solution and nuclear stain. Fluorescence microscopy was used for observation; quantitative analysis was carried out through Fiji Image J (V 1.54H).
2.7. Cell Cycle and Flow Analysis
Cell cycle distribution was evaluated using the Cell Cycle Detection Kit (MCE, HY-K1071, Monmouth Junction, NJ, USA) in accordance with the manufacturer’s protocol. Collected cells were added to 1 mL of ice-cold 70% ethanol, gently mixed, and fixed at 4 °C. Then centrifuging for 5 min to obtain the cell pellet. Using 1 mL of ice-cold PBS to wash cells again. After the supernatant was removed while retaining approximately 50 μL PBS, the tube was gently flicked to disperse the cells. Each sample was incubated with 0.5 mL PI solution, followed by gentle and thorough resuspension of the cell pellet. Samples were incubated for 30 min. Flow cytometric analysis was performed following PI staining. All data were processed and analyzed with the appropriate software integrated with the FongCyte™ flow cytometer (Challen Biotechnology, Beijing, China).
2.8. Western Blot
Cells were washed with PBS and lysed with RIPA lysis buffer (Solarbio, R0010, Beijing, China) containing a protease inhibitor cocktail. Approximately 1 × 10⁶ cells were lysed in 200 μL lysis buffer for 30 min on ice. The lysates were centrifuged at 12,000 rpm for 15 min at 4 °C to remove cell debris, and the supernatants were collected. Protein concentrations were determined using the BCA protein assay kit (Epizyme, ZJ101, Shanghai, China) according to the manufacturer’s instructions. Equal amounts of denatured protein (5× SDS loading buffer, 100 °C, 8 min) were separated by SDS-PAGE (85 V for stacking gel, 100 V for resolving gel) and transferred onto PVDF membranes (Millipore Corporation, IPVH00010, Billerica, MA, USA) through a wet transfer system (250 mA). The membranes were first blocked using Protein-Free Rapid Blocking Solution (Epizyme, PS108P, Shanghai, China)) for 15 min, followed by three washes with TBST (3 × 5 min). Subsequently, primary antibodies were incubated overnight at 4 °C, and the membranes were then treated with secondary antibodies for 2 h at room temperature. Protein bands were detected using a chemiluminescence system and visualized with GV90L-E Chemiluminescence Imaging System (BLT BioLight Technology, Guangzhou, China). The relative protein expression levels were quantified by Fiji Image J software with internal reference proteins for normalization.
The primary antibodies used in this study were as follows: anti-CDK2 antibody (Huabio, ET1602-6, 1:1000 dilution, Hangzhou, Zhejiang, China), anti-PCNA antibody (Huabio, ET1605-38, 1:5000 dilution, Hangzhou, Zhejiang, China), anti-CCND1 antibody (Wanlei, WL01435a, 1:500 dilution, Dalian, Liaoning, China), and anti-β-actin antibody (Proteintech, 66009-I-Ig, 1:100,000 dilution, Proteintech Group, Chicago, IL, USA).
2.9. Transfection
The miRNA mimics and inhibitors were synthesized, and the dual-luciferase reporter vectors were constructed by Sangon Biotech (Shanghai, China).
Cell transfection was performed when the cell confluence reached approximately 70%. Cells were transfected with miRNA mimics, inhibitors, or plasmid DNA using Lipofectamine 2000 (Thermo Fisher Scientific, 11668019, Waltham, MA, USA) according to the manufacturer’s instructions. Briefly, nucleic acids were diluted in Opti-MEM (Gibco, 51985091, Waltham, MA, USA) and mixed with Lipofectamine 2000 to form transfection complexes. After incubation, the complexes were added to cells cultured in serum-free and antibiotic-free medium. After 6 h of incubation, the medium was replaced with complete culture medium, and cells were maintained under standard culture conditions for subsequent experiments.
2.10. Dual-Luciferase Reporter Assays
Dual-luciferase reporter assays were performed using a dual-luciferase reporter assay kit (Yeasen, 11402ES60, Shanghai, China) according to the manufacturer’s instructions. Briefly, after transfection, cell lysates were collected, and the activities of firefly and Renilla luciferases were sequentially measured. The relative luciferase activity was calculated as the ratio of firefly luciferase activity to Renilla luciferase activity (F/R).
2.11. Data Analysis
The genetic diversity parameters of the identified polymorphic loci were analyzed based on allele frequencies according to the method described by Nei [
15]. The observed heterozygosity (Ho), effective allele number (Ne), and polymorphism information content (PIC) were calculated to evaluate the genetic variation in the population.
Statistical analyses were conducted using SPSS software (version R26.0.0.0; IBM Corp., Armonk, NY, USA) and GraphPad Prism (version 10.1.2; GraphPad Software, San Diego, CA, USA). All cell-based experiments were performed with three independent biological replicates. Quantitative data from Western blot densitometric analysis and flow cytometric cell cycle analysis are presented as mean ± standard deviation (SD). Statistical significance was determined using appropriate statistical tests, with p < 0.05, p < 0.01, and p < 0.001 considered statistically significant.
For cellular and molecular experiments, differences between two groups were assessed using an unpaired two-tailed Student’s t-test, while comparisons involving more than two groups were performed using one-way analysis of variance (ANOVA).
The association between the ELF5 g.32793 G>T polymorphism and lactation traits was evaluated using a general linear model (GLM). Genotype, parity, calving year, testing season, and lactation stage were included as fixed effects in the model. The statistical model was defined as Yijklmn = μ + Gi + Pj + CYk + Sl + LSm + eijklmn, where Yijklmn represents the observed milk production traits; μ represents the overall mean; Gi represents the genotype effect; Pj represents the parity effect; CYk represents the calving year effect; Sl represents the testing season effect; LSm represents the lactation stage effect; and eijklmn represents the residual error. Type III sums of squares were applied to correct for unequal sample sizes among genotype groups. Because all animals were derived from the same herd and maintained under the same feeding and management conditions, herd and management effects were not included as independent fixed effects. Age was not included as an independent factor because it was highly correlated with parity. FDR correction was performed to control false positives caused by multiple trait testing. When significant differences among genotypes were detected, Duncan’s multiple range test was conducted for pairwise comparisons among genotype means. Statistical significance was defined as p < 0.05.
4. Discussion
A novel SNP locus,
ELF5 g.32793 (G>T), was identified in this study and subsequently genotyped in 1314 Holstein dairy cattle. At the
ELF5 g.32793 (G>T) locus, the frequency of the G allele was higher than that of the T allele. The GG and GT genotypes were more prevalent than the TT genotype. The PIC of the variant was 0.325, indicating moderate polymorphism. On the other hand, the observed genotype frequencies at this locus significantly deviated from HWE (
p < 0.05), which can be attributed to several factors. First, Holstein cattle have been intensively selected worldwide for high milk yield. To improve milk production, milk quality, disease resistance, and other economically important traits, the cattle often undergo a selection program for specific genotypes. Such selective pressure directly alters allele and genotype frequencies at targeted loci, resulting in deviations from HWE [
16]. Second, in commercial dairy farms, artificial insemination and selective breeding strategies are commonly employed to optimize breeding goals rather than random mating. This mating scheme alters genotype frequencies, increasing homozygosity and decreasing heterozygosity (i.e., inbreeding), thereby causing deviations from HWE [
17]. However, deviation from HWE may also result from other factors, including population stratification, relatedness among sampled individuals, sampling bias, and random genetic processes.
Previous studies have demonstrated that
ELF5 is specifically highly expressed in mammary alveolar epithelial cells and serves as a key molecular switch that determines the differentiation of mammary epithelial cells toward the secretory lineage [
7]. During the onset of lactation, the expression level of
ELF5 is markedly increased, and
ELF5 functions as a direct transcriptional activator of key milk protein–encoding genes, such as β-casein (CSN2), αS1-casein (CSN1S1), and κ-casein (CSN3), through its specific binding to ETS consensus motifs located within the promoter regions of these milk protein genes [
18]. Although previous studies have extensively characterized the biological functions of ELF5 in mammary epithelial differentiation and lactation regulation, the contribution of
ELF5 genetic variation to lactation-related traits remains largely unexplored in dairy cattle. Most previous investigations have focused on the transcriptional regulation and functional roles of
ELF5, whereas whether naturally occurring variants within the
ELF5 locus affect its regulatory activity and phenotypic variation has not been fully elucidated. In the present study, association analysis between the
ELF5 g.32793 (G>T) locus and lactation traits revealed that this locus was significantly associated with daily MY, 305-day MY, MFP, MPP, and SCS. These findings are consistent with the previously reported biological functions of
ELF5. Furthermore, we found that individuals carrying the GT genotype exhibited significantly higher daily MY and 305-day MY than those with the other two genotypes, suggesting that this genotype may be advantageous in practical dairy production. However, individuals with the GT genotype were also associated with lower MFP, MPP, and SCS. The negative relationship between MY and milk component percentages observed in this study may be partially explained by the dilution effect commonly observed in high-producing dairy cows, in which increased milk volume may reduce the concentrations of milk components [
19]. However, this explanation was not directly evaluated in the present study, and further investigations are required to clarify the biological mechanisms underlying the balance between milk yield and milk composition traits, which can be considered a limitation of the current study. Collectively, these findings indicate that high MY is generally accompanied by reduced MF and MPP, consistent with previous studies suggesting that superior lactation performance may compromise nutrient allocation for milk components such as fat and protein.
Increasing evidence suggests that functional variants located in the 3′ UTRs can contribute to complex trait variation by modifying post-transcriptional regulation, particularly through altering miRNA binding sites. In dairy cattle, several functional 3′ UTR SNPs, including variants in OLR1 [
20], AMPKγ1 [
21], CSN3 [
22], and LEP [
23], have been reported to influence economically important traits by altering miRNA-mediated post-transcriptional regulation of target genes. However, whether
ELF5 3′ UTR variants participate in lactation regulation through similar mechanisms remains unknown. Therefore, the identification of the
ELF5 g.32793 G>T variant in the present study provides new insights into the genetic regulation of lactation traits and suggests a potential role of miRNA-associated regulatory variation in dairy cattle.
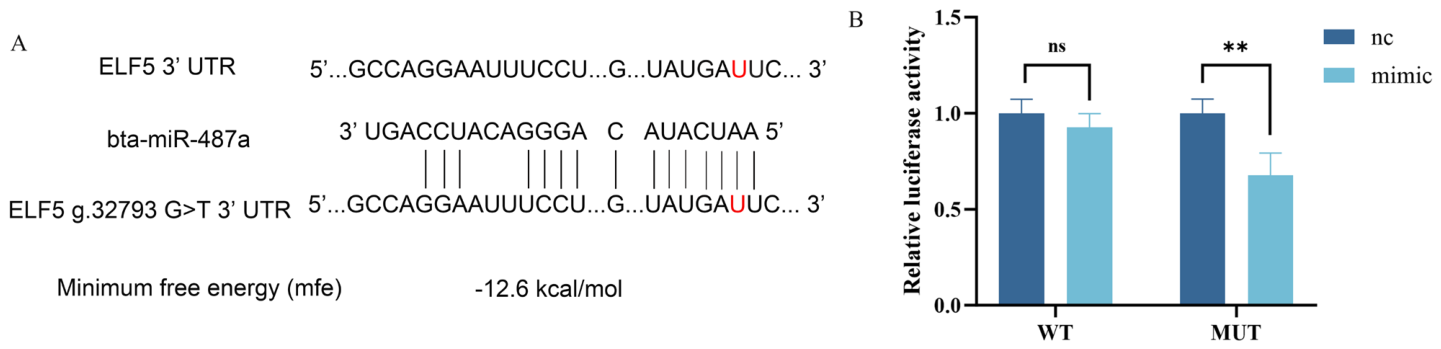
In this study, we further identified that bta-miR-487a targets the
ELF5 g.32793 (G>T) locus, suggesting that this SNP may represent a functional regulatory variant. The nucleotide change could affect the binding affinity of bta-miR-487a to
ELF5, thereby modulating
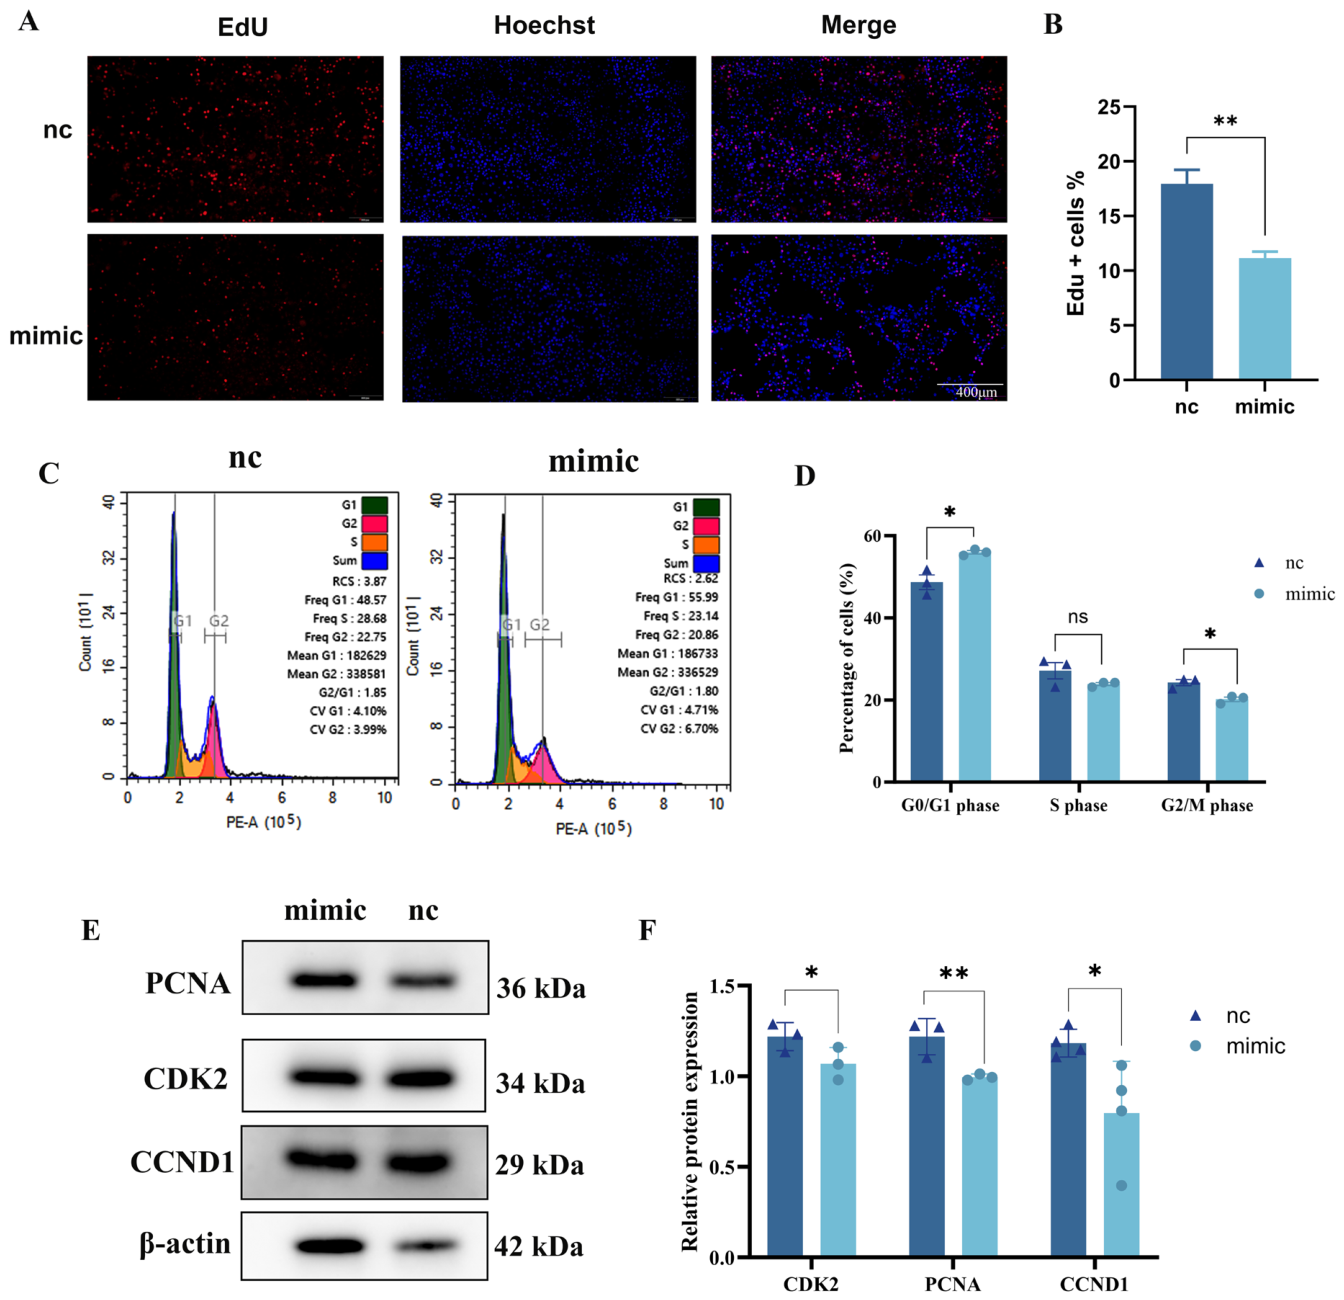
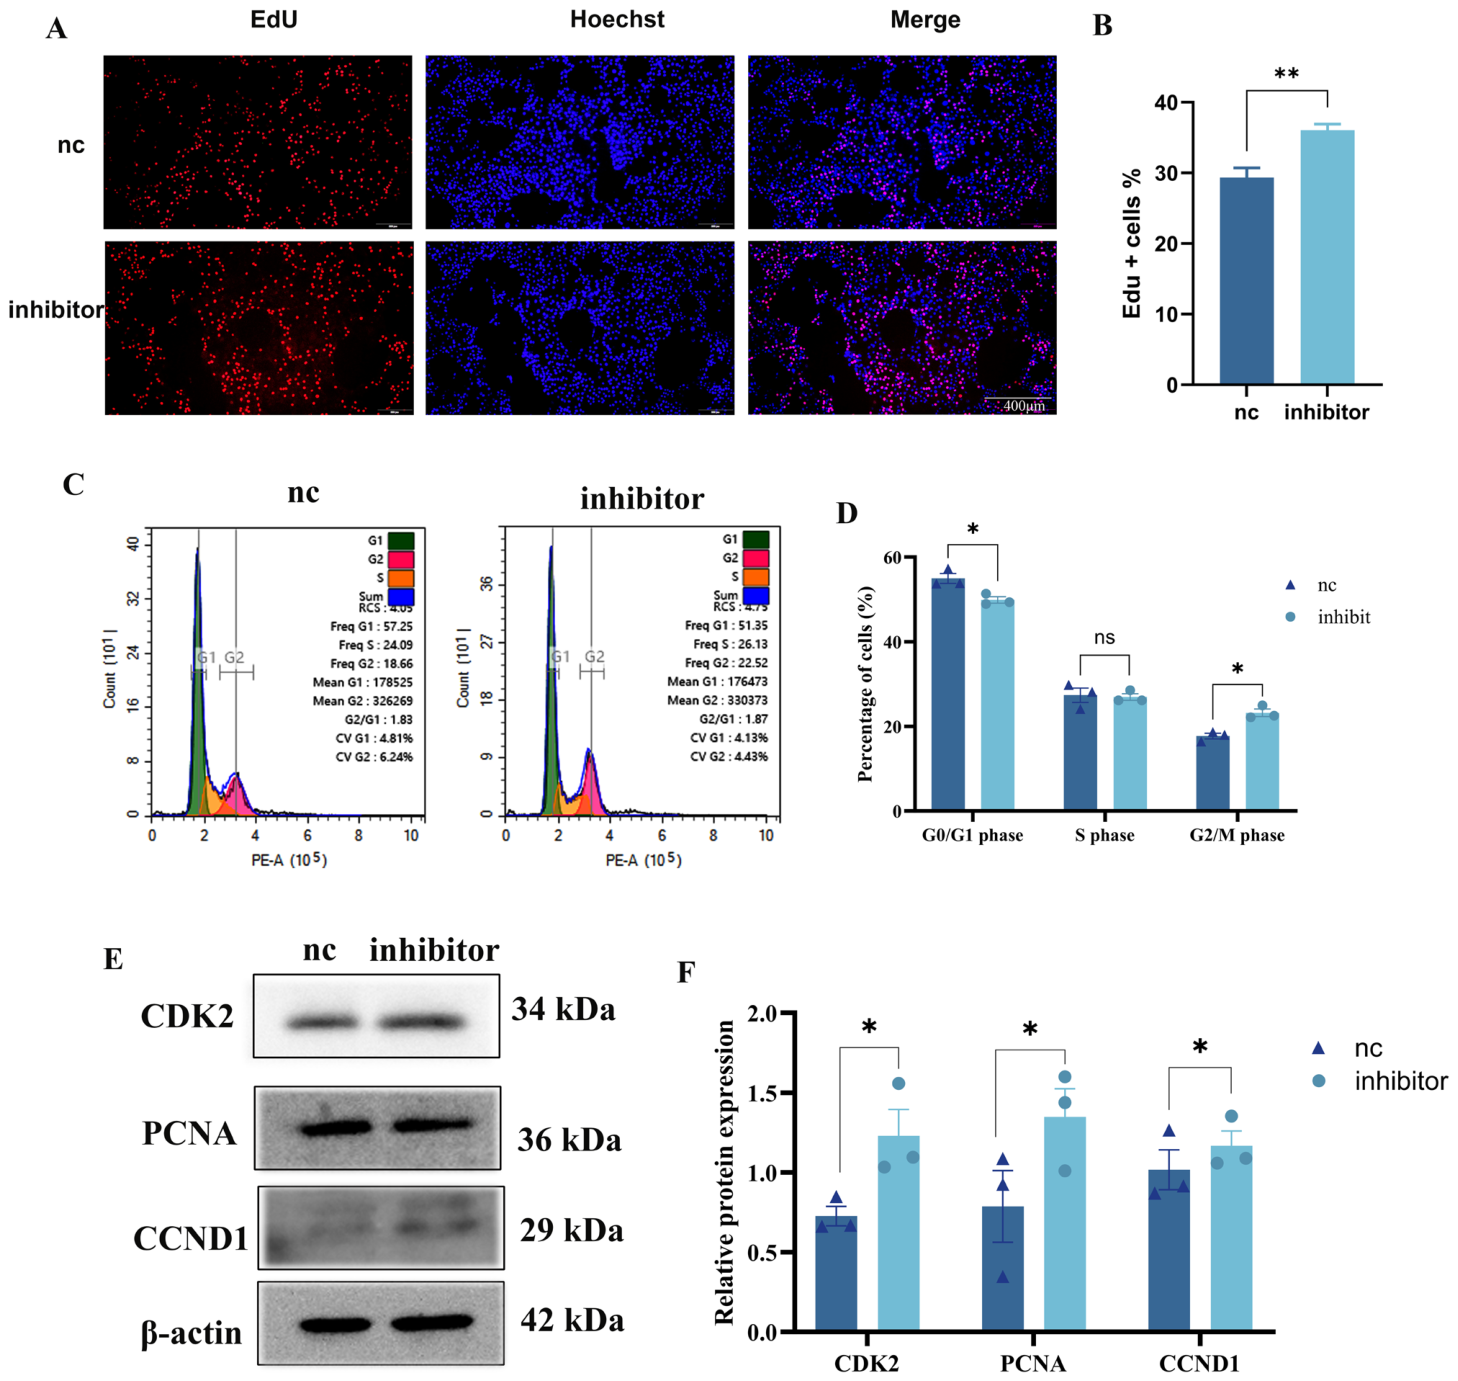
ELF5 expression and subsequently influencing related cellular processes. Functional assays demonstrated that bta-miR-487a regulates MAC-T cell proliferation by modulating the cell cycle, likely through inhibition of the G1/S transition, leading to suppressed DNA replication and cell proliferation. Corresponding changes in the expression of proliferation-related genes, including CDK2, CCND1, and PCNA, further support a role for bta-miR-487a in the regulation of mammary epithelial cell proliferation. Previous studies have shown that miR-487a primarily regulates the progression of osteosarcoma [
24], and clear cell renal cell carcinoma [
25] by targeting downstream genes, whereas its function in bovine mammary cells has not been reported, indicating cell type-specific roles for miR-487a.
The proliferative potential of mammary epithelial cells is tightly linked to lactation performance, since the total population of functional secretory epithelial cells directly influences and ultimately determines the overall capacity for milk synthesis [
26]. Thus, based on the targeting relationship between bta-miR-487a and the
ELF5 g.32793 (G>T) variant, we proposed that this SNP may influence mammary epithelial cell proliferation via a miRNA-mediated post-transcriptional mechanism, thereby promoting differentiation toward a secretory lineage and ultimately affecting lactation traits. Our functional experiments showed that bta-miR-487a-mediated cell cycle regulation suppresses MAC-T cell proliferation, which may facilitate differentiation of mammary epithelial cells toward a secretory phenotype, enhancing MF and protein synthesis. Genotype analysis revealed that GT individuals exhibited higher daily MY and 305-day MY but relatively lower MPP and MFP, likely due to a dilution effect associated with high milk volume, whereas TT individuals showed moderate daily MY and 305-day MY but higher MPP and MFP, suggesting that limited proliferation under this genotype may favor enhanced secretory function [
27]. These findings indicate that the
ELF5 g.32793 (G>T) locus may modulate the balance between proliferation and differentiation of mammary epithelial cells through miRNA-
ELF5 interactions, leading to a trade-off between milk yield and composition. This provides new molecular insights into the regulation of mammary epithelial cell proliferation and secretory function, and highlights a potential functional SNP target for genetic improvement in dairy cattle. In the current study, genotype-dependent
ELF5 expression was not evaluated, which can also be considered a limitation of the study. Future studies using genotype-defined mammary tissues or animal models, together with
ELF5 rescue experiments, are needed to further validate the regulatory mechanism proposed in this study.




 ,
,