
Antimicrobial and Antiradical Activity of Extracts from Leaves of Various Cultivars of Pyrus communis and Pyrus pyrifolia
 , , , and
Abstract
1. Introduction
2. Materials and Methods
2.1. Raw Material
2.2. Reagents
2.3. Apparatus
2.4. Preparation of Extracts
2.5. Colorimetric Measurement of Total Phenol Content
2.6. Measurement of Flavonoids in Extracts
2.7. Investigation of Antioxidant Activity of Extracts
2.7.1. Investigation of Antioxidant Activity of Extracts Using ABTS•+˙ Radical
2.7.2. Calculation of the Number of TAUABTS/mg and TAUABTS/g Units
2.7.3. Measurement of Antiradical Activity of Extracts Using DPPH Radical
2.7.4. Calculation of the Number of TAUDPPH/mg Units
2.8. Measurement of Arbutin and Hydroquinone in Extracts Obtained from Leaves of Pyrus communis and Pyrus pyrifolia
2.9. Investigation of Antimicrobial Activity of Extracts
2.9.1. Bacterial Strains and Storage
2.9.2. Cultivation of Microorganisms
2.9.3. Measurement of Antimicrobial Activity of Extracts
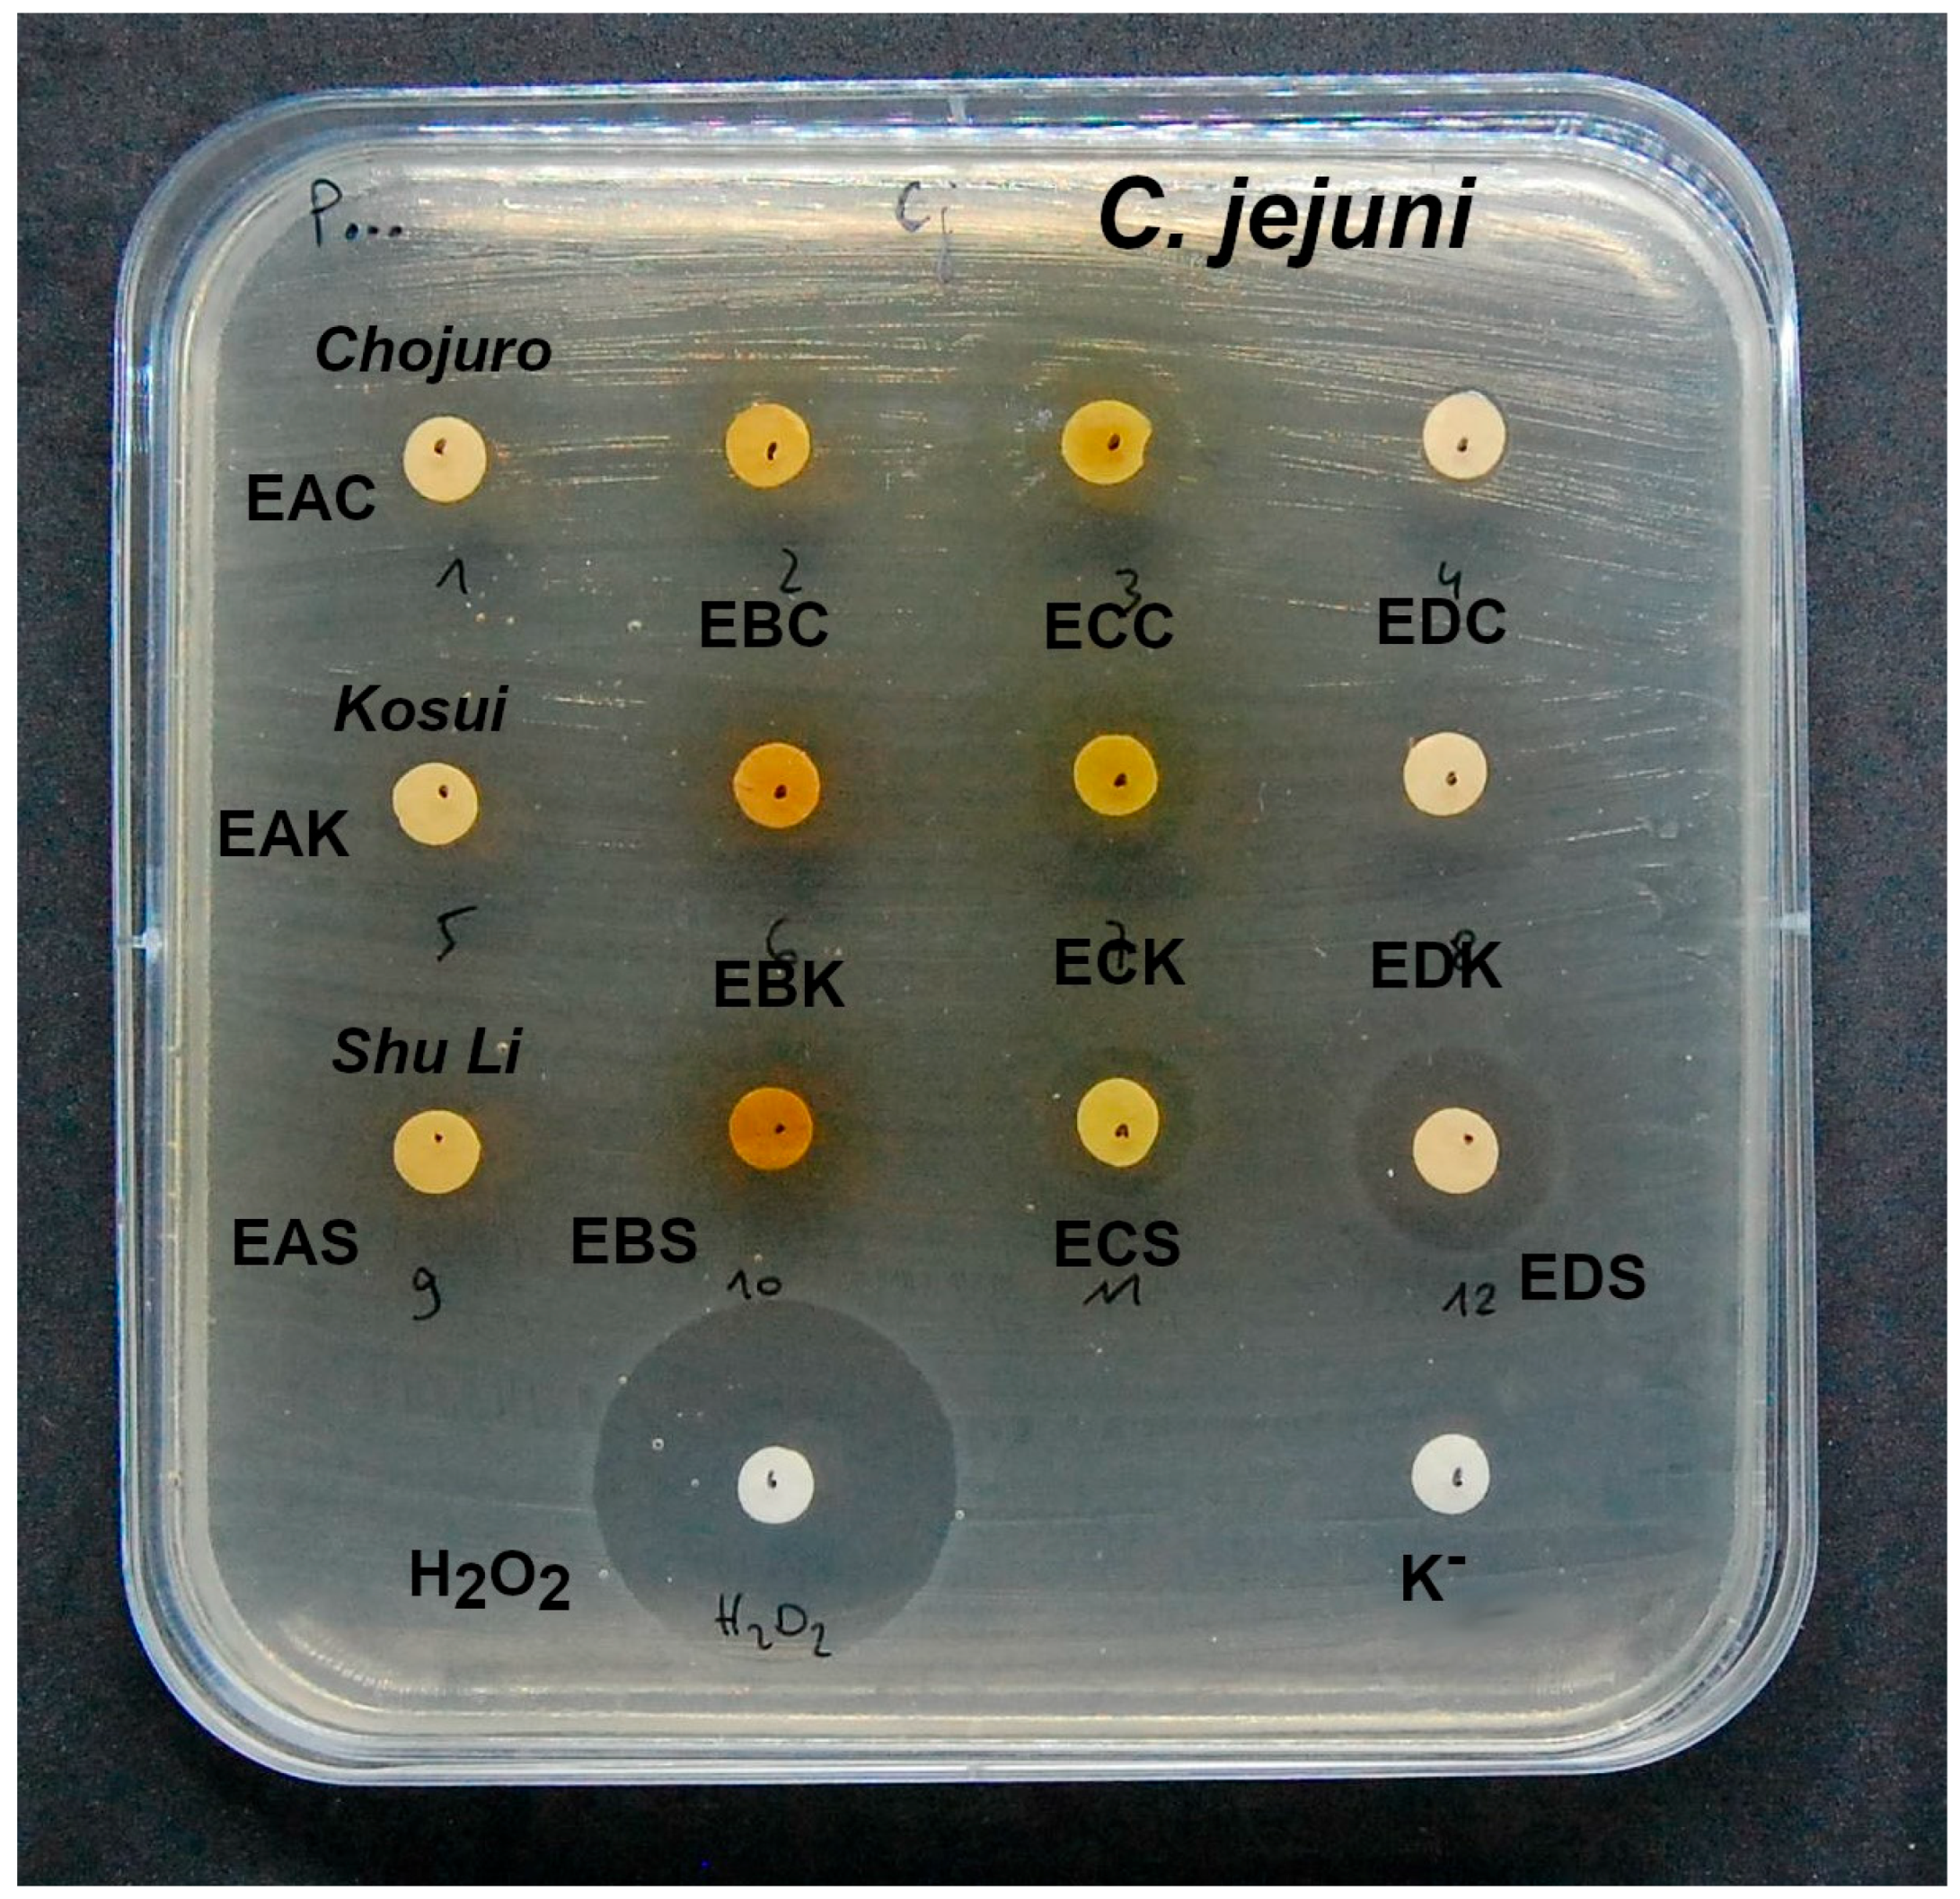
2.9.4. Investigation of Inhibition of Growth of Extracts on Campylobacter Jejuni NCTC 11168
3. Results
3.1. Amounts of Phenolic Compounds and Flavonoids in Extracts and Raw Materials
3.2. Antiradical Potential of Extracts and Leaves of P. pyrifolia and P. communis
3.3. Antibacterial Activity of Extracts Obtained from Leaves of Different P. pyrifolia and P. communis Cultivars
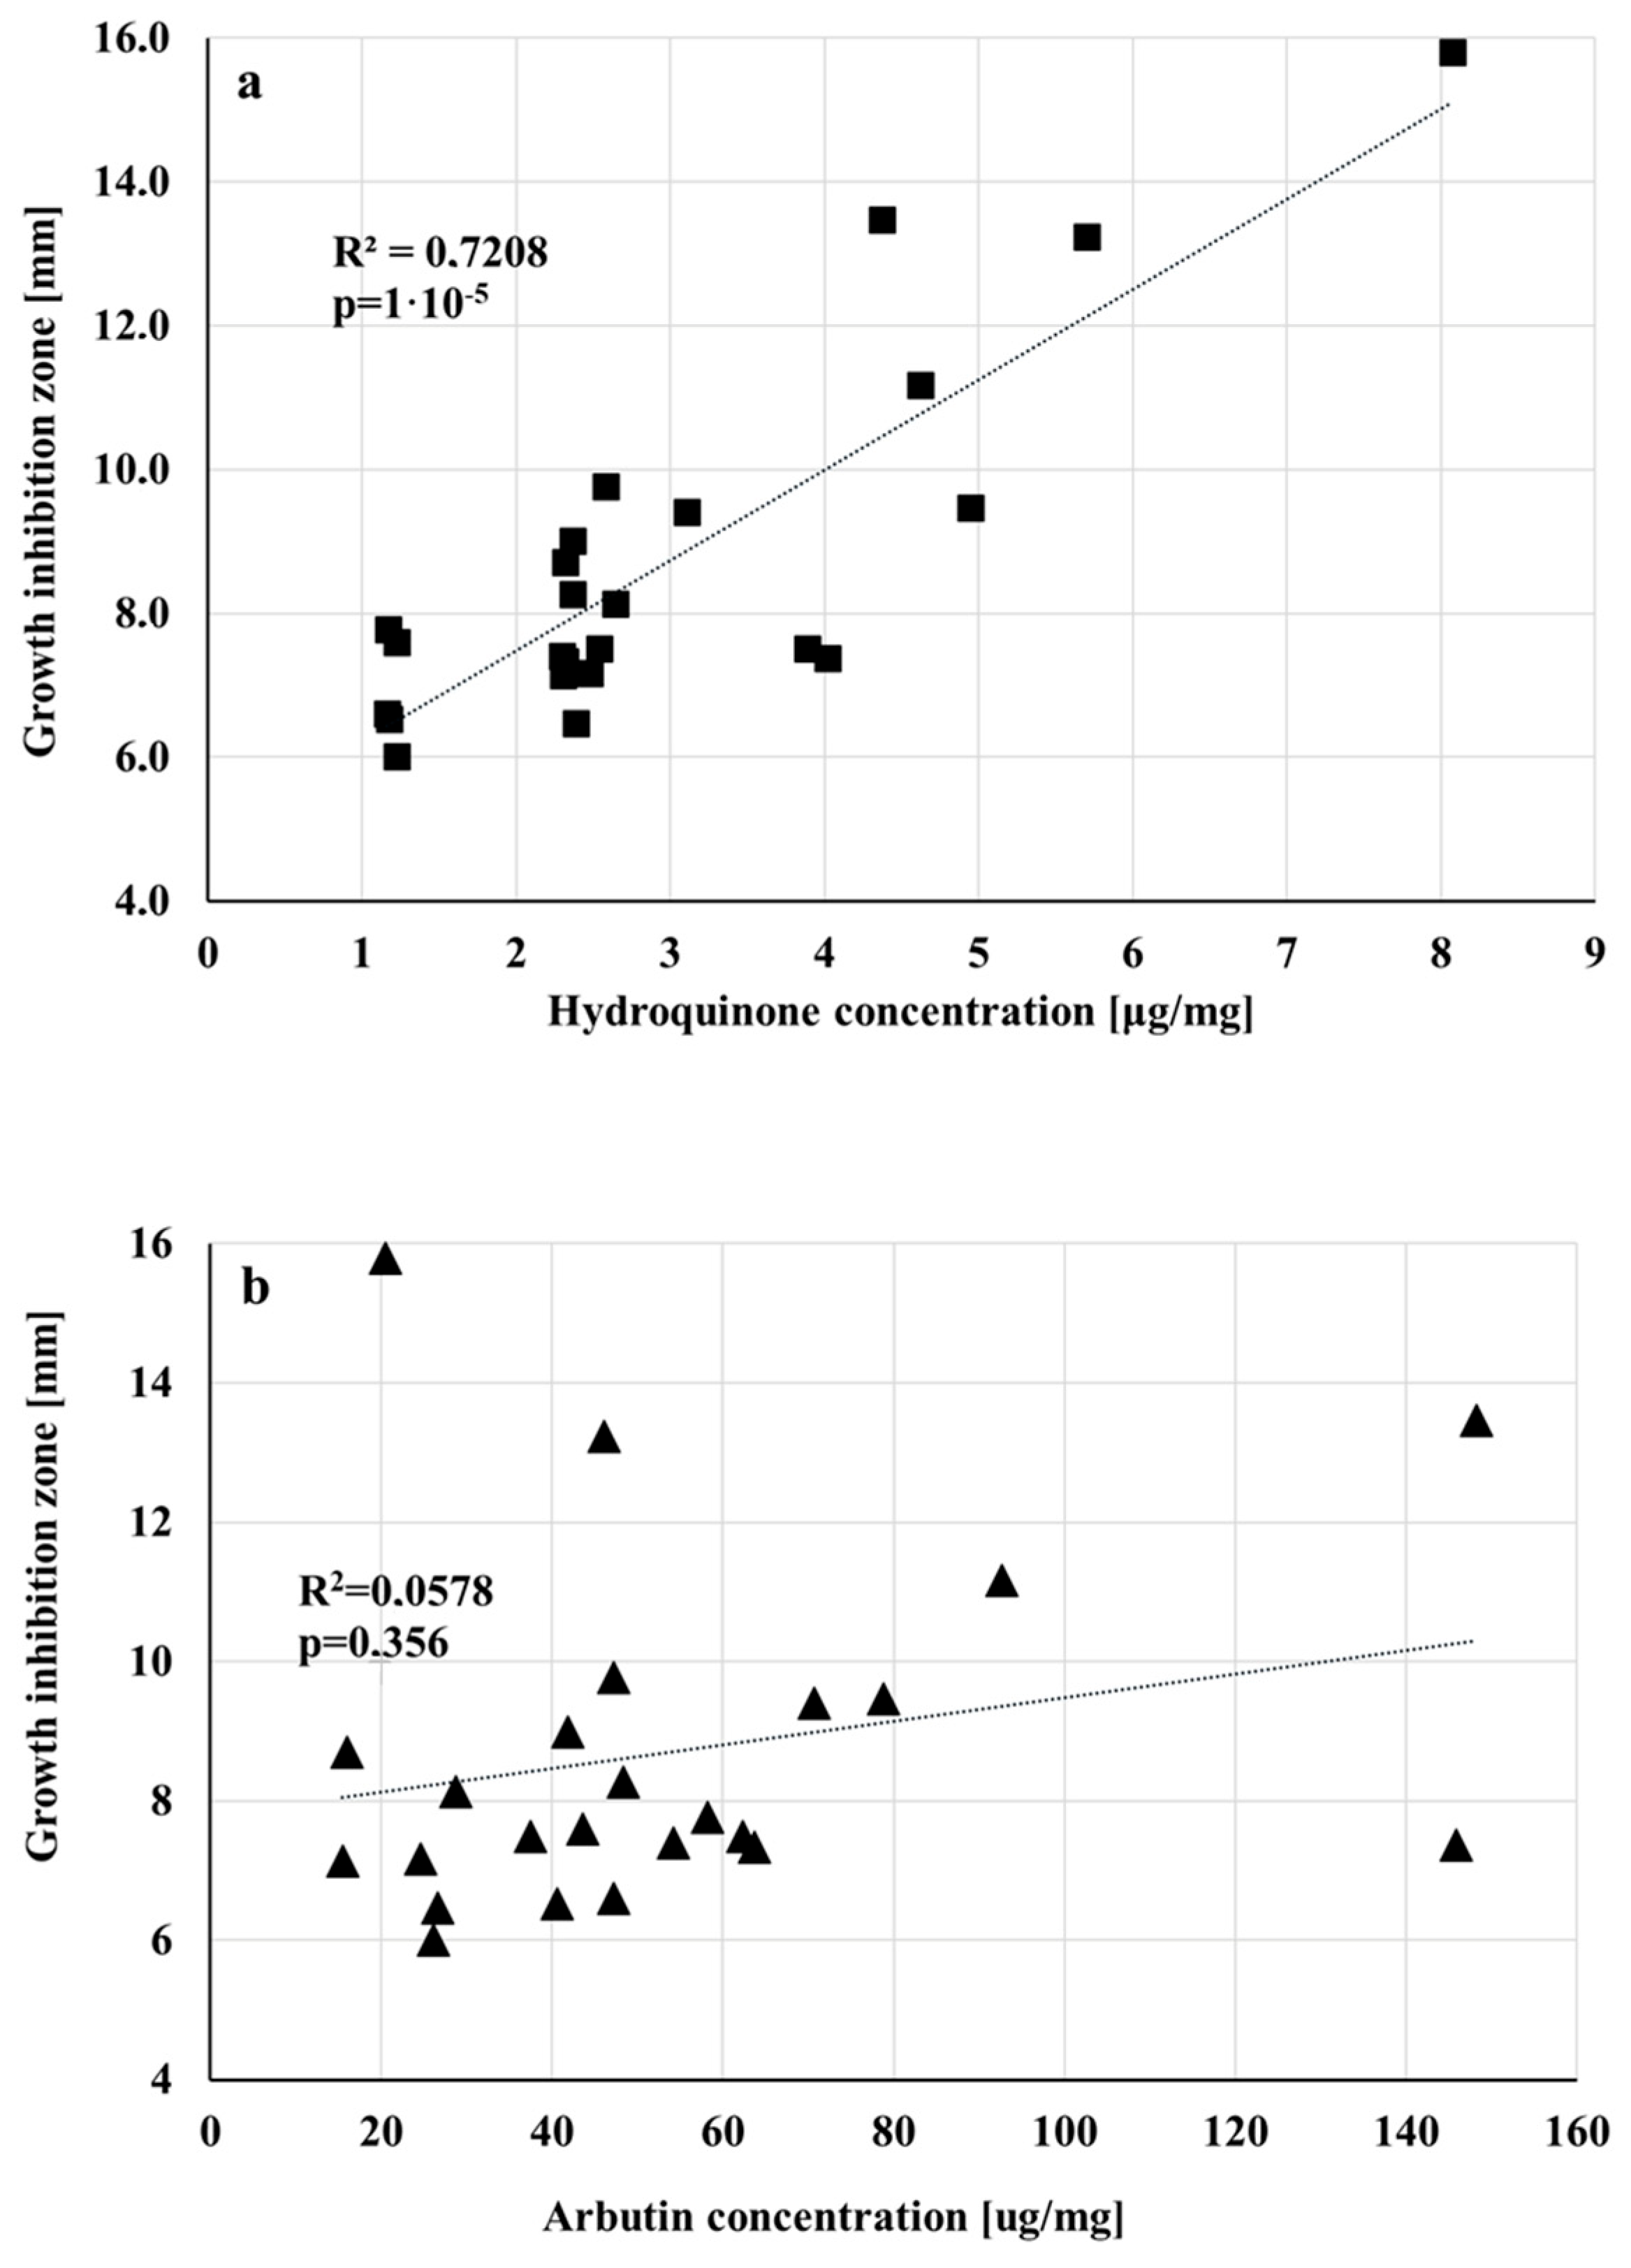
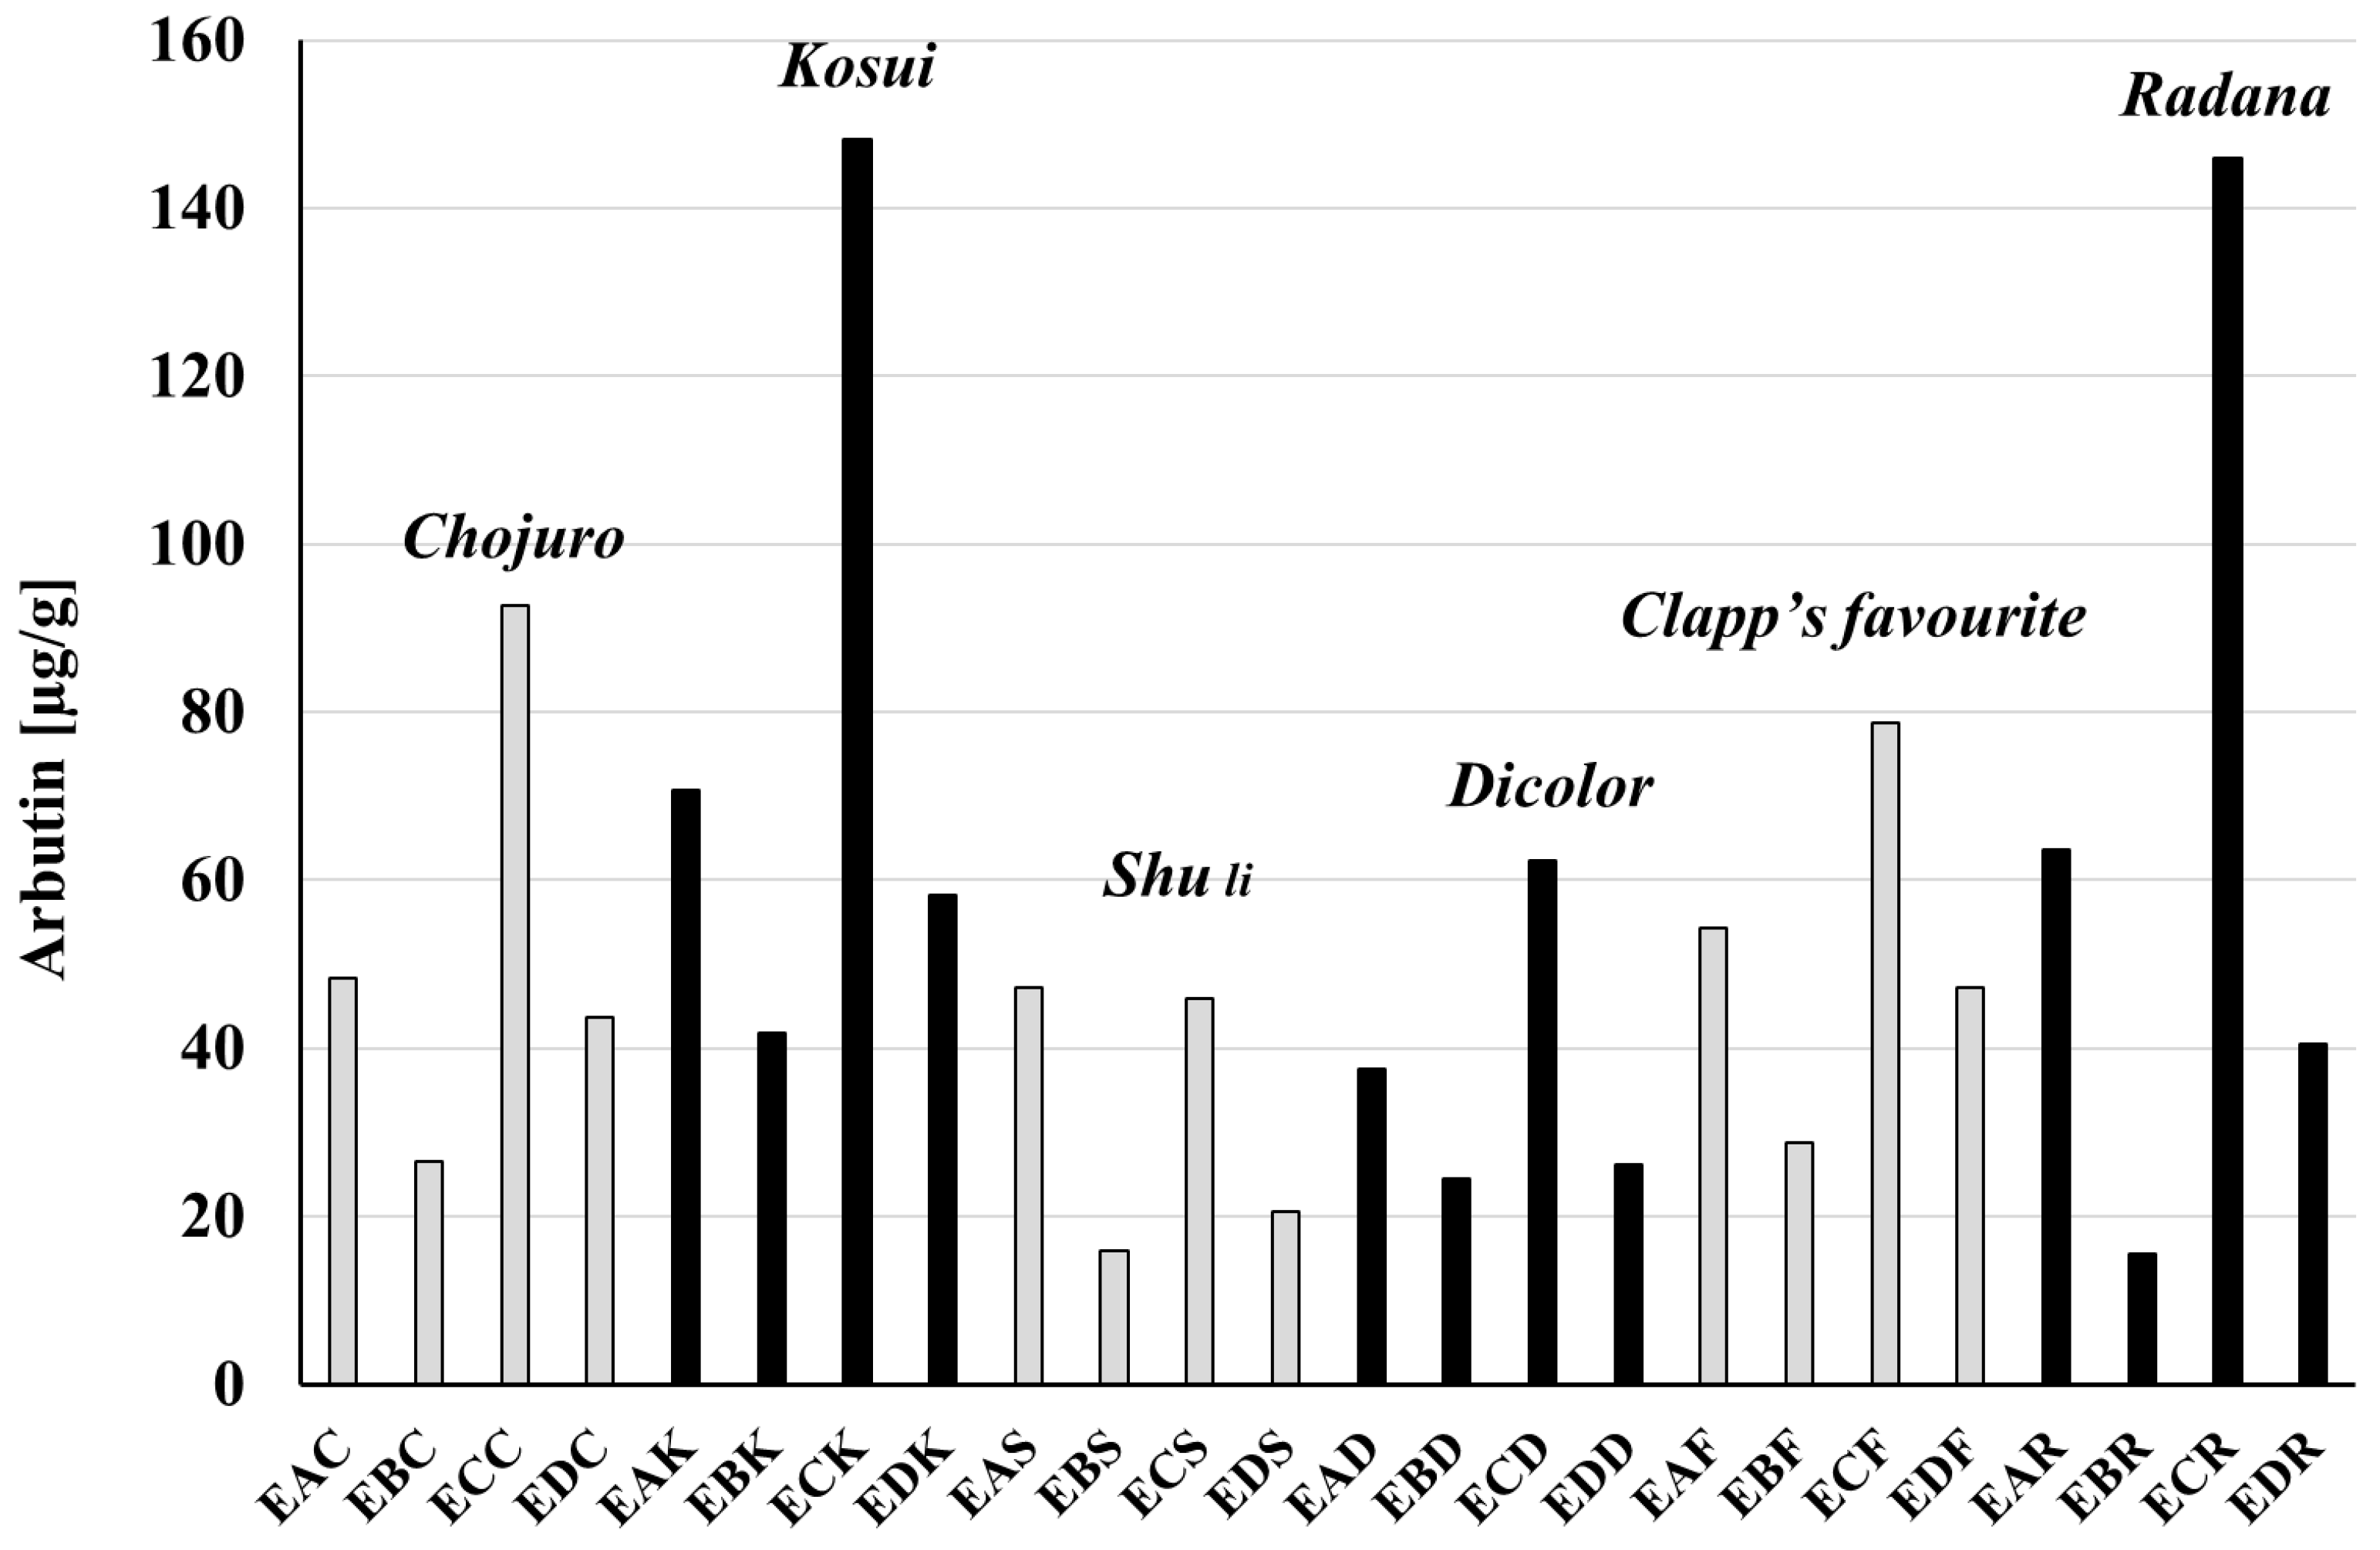
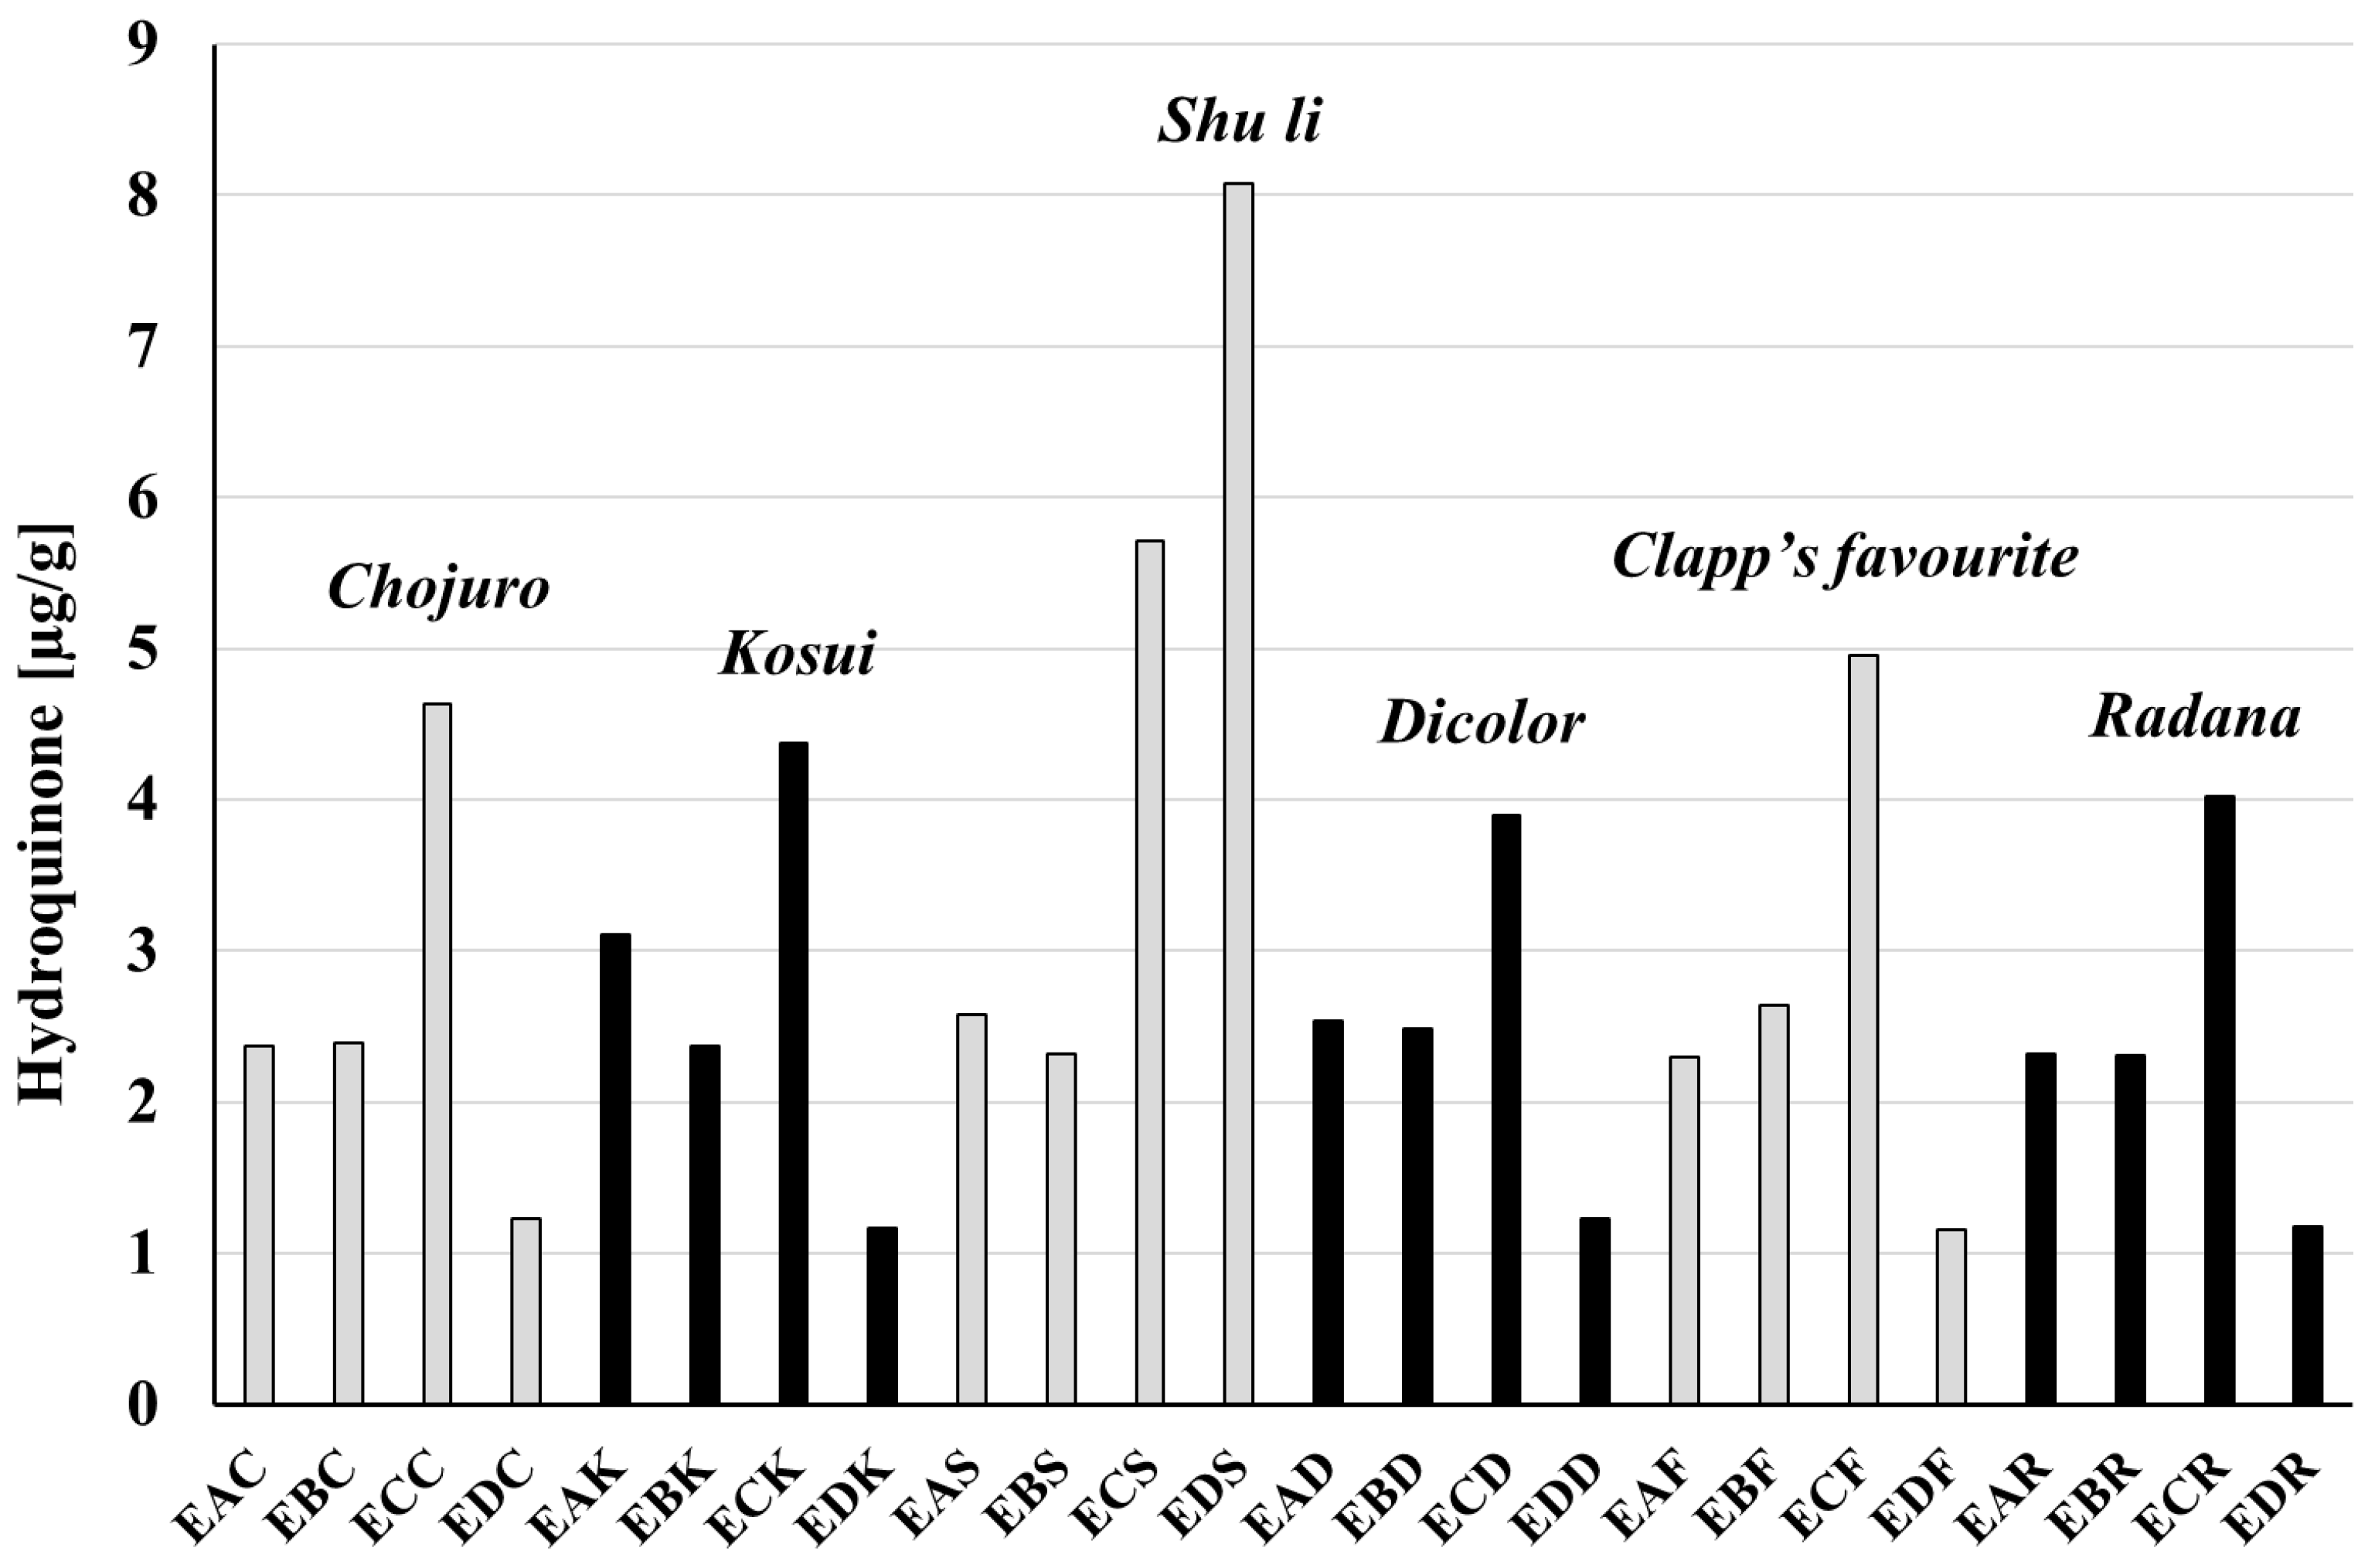
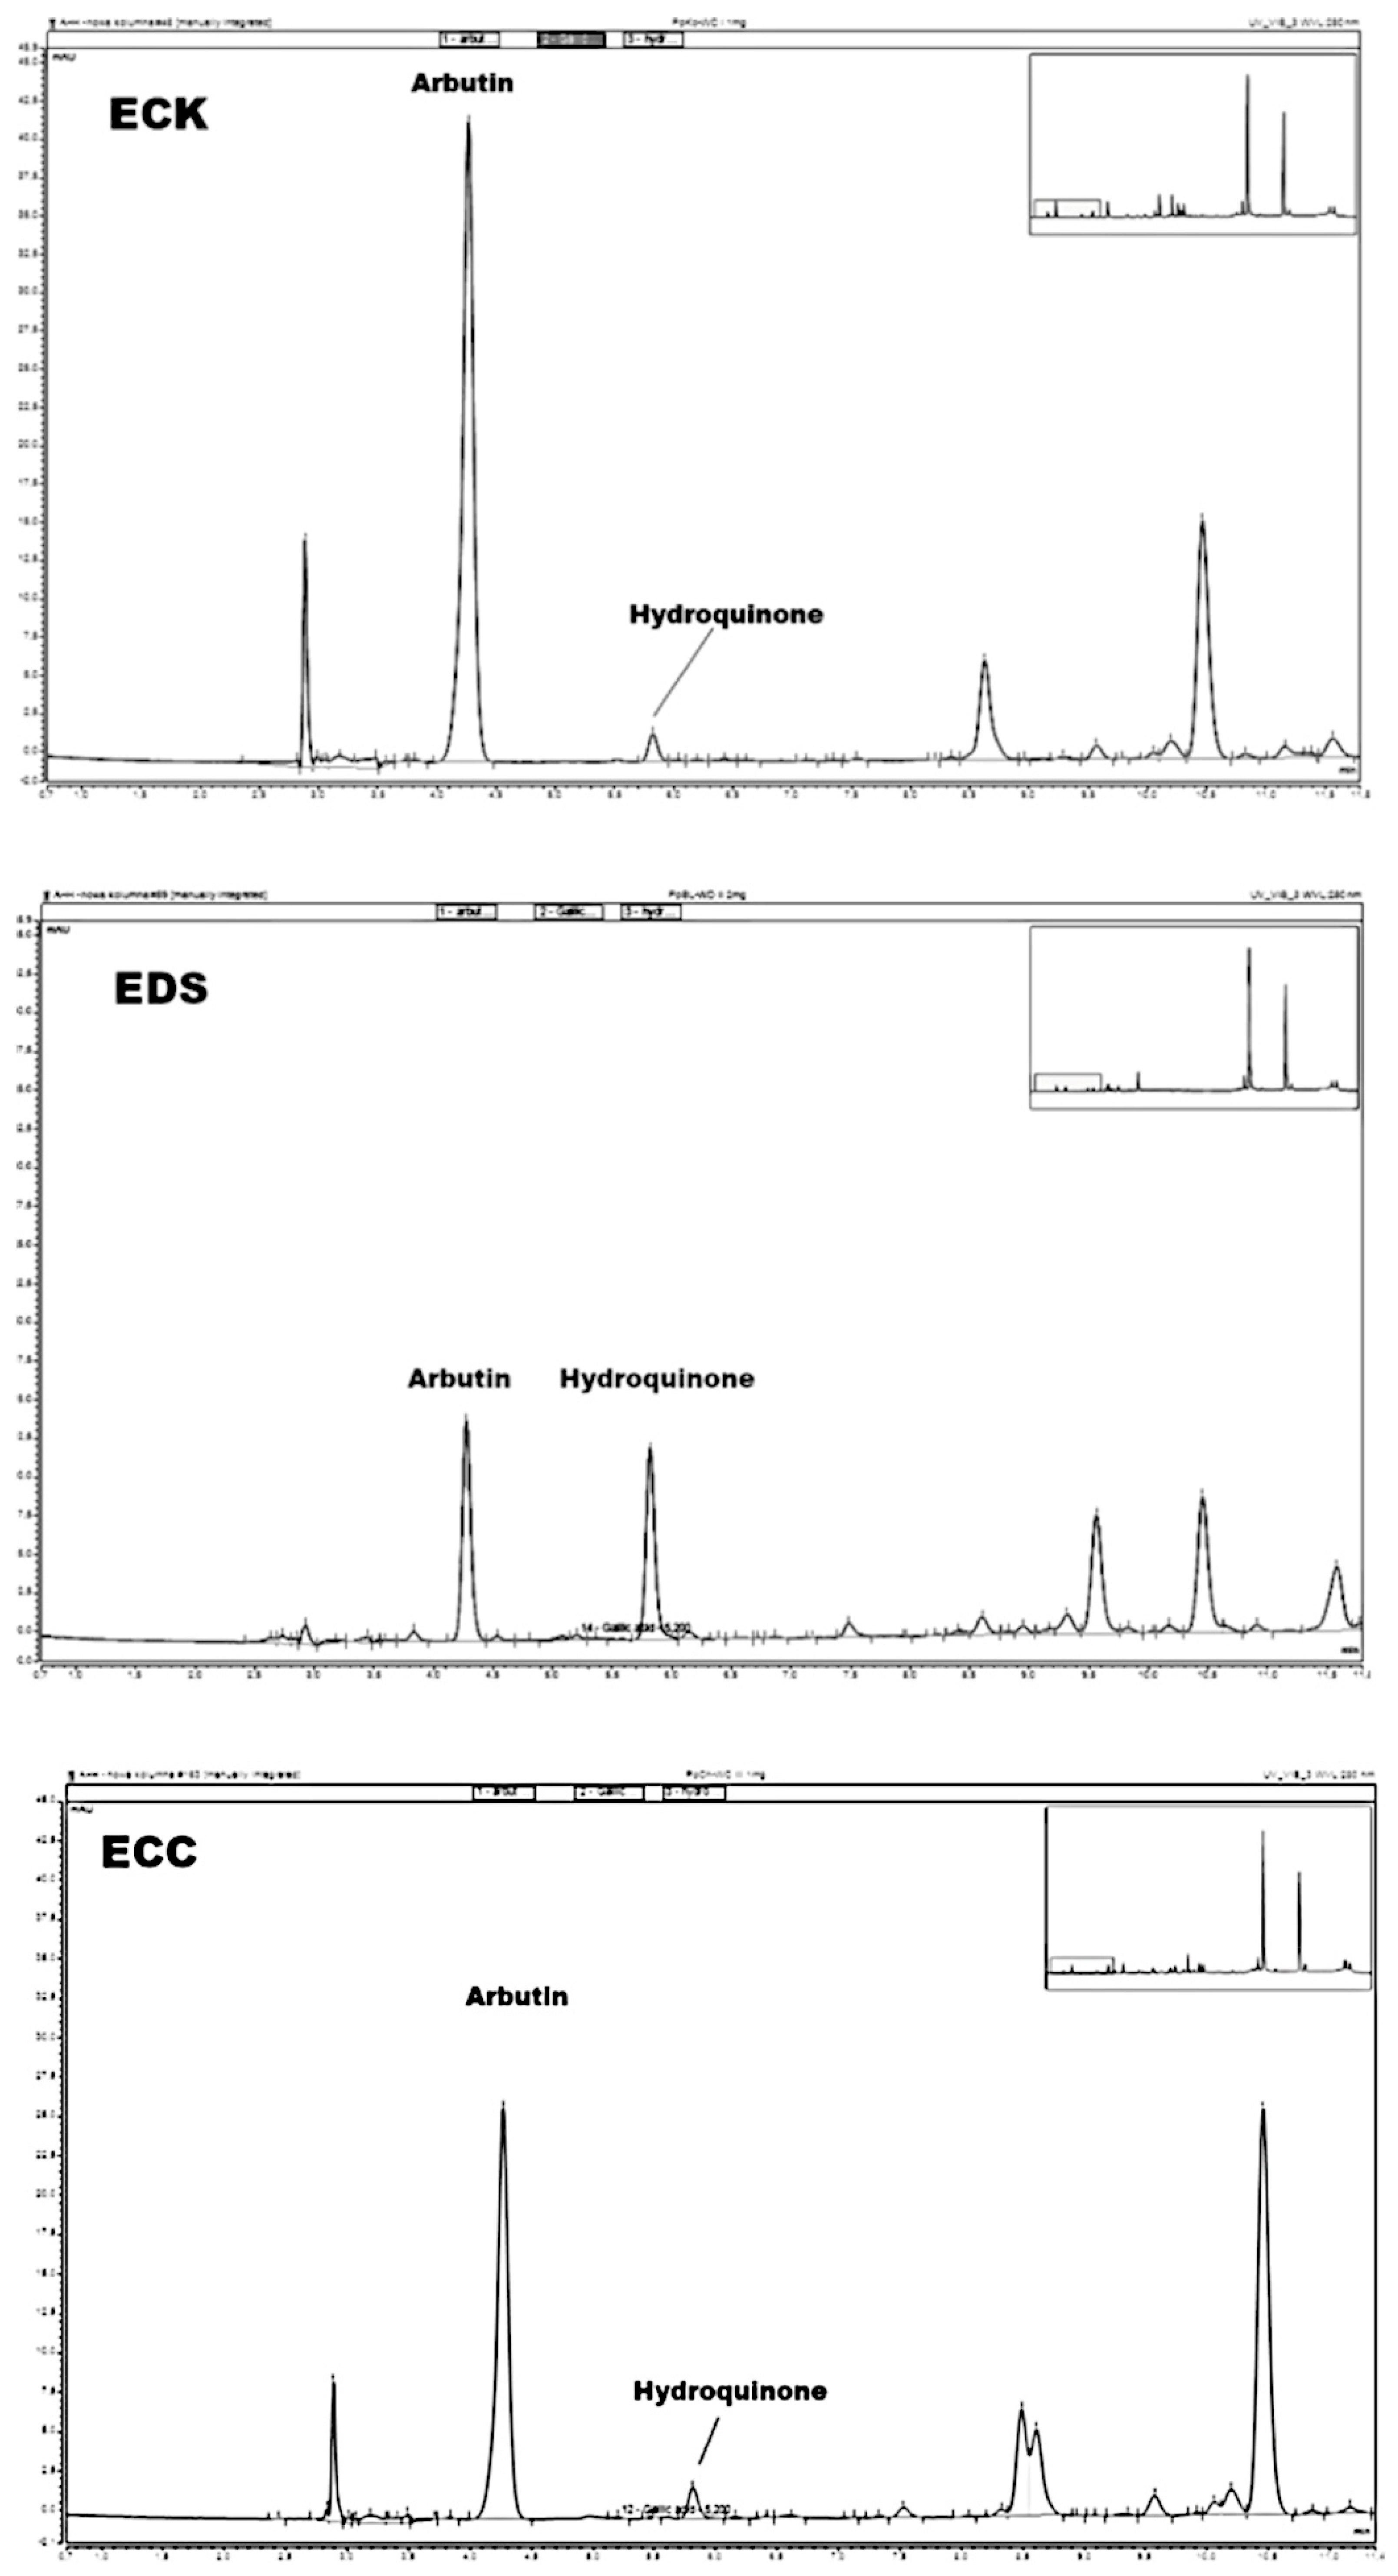
3.4. Amounts of Arbutin and Hydroquinone in Extracts and Raw Materials
4. Discussion
5. Conclusions
Author Contributions
Funding
Institutional Review Board Statement
Informed Consent Statement
Data Availability Statement
Conflicts of Interest
References
- Jadimurthy, R.; Mayegowda, S.B.; Nayak, S.C.; Mohan, C.D.; Rangappa, K.S. Escaping mechanisms of ESKAPE pathogens from antibiotics and their targeting by natural compounds. Biotechnol. Rep. 2022, 34, e00728. [Google Scholar] [CrossRef] [PubMed]
- Nimer, N.A. Nosocomial infection and antibiotic-resistant threat in the Middle East. Infect. Drug. Resist. 2022, 15, 631–639. [Google Scholar] [CrossRef] [PubMed]
- Sahoo, S.; Mohanty, J.N.; Routray, S.P.; Khandia, R.; Das, J.; Shah, S.; Swarnkar, T. Colistin the last resort drug in 21st century antibiotics to combat multidrug resistance superbugs. J. Exp. Biol. Agric. Sci. 2023, 11, 919–929. [Google Scholar] [CrossRef]
- Huy, T.X.N. Overcoming Klebsiella pneumonia antibiotic resistance: New insights into mechanisms and drug discovery. Beni Suef. Univ. J. Basic Appl. Sci. 2024, 13, 13. [Google Scholar] [CrossRef]
- Gauba, A.; Rahman, K.M. Evaluation of antibiotic resistance mechanisms in Gramm-negative bacteria. Antibiotics 2023, 12, 1590. [Google Scholar] [CrossRef] [PubMed]
- Singha, B.; Murmu, S.; Nair, T.; Rawat, R.S.; Sharma, A.K.; Soni, V. Metabolic rewiring of Mycobacterium tuberculosis upon drug treatment and antibiotics resistance. Metabolites 2024, 4, 63. [Google Scholar] [CrossRef]
- Martins-Santana, L.; Rezende, C.P.; Rossi, A.; Martinez-Rossi, N.M.; Almeida, F. AddressingMicrobial ResistanceWorldwide: Challenges over controlling life-threatening fungal infections. Pathogens 2023, 12, 293. [Google Scholar] [CrossRef]
- Aiken, A.M.; Rehman, A.M.; Kraker, M.E.A.D.; Madrid, L.; Kebede, M.; Labi, A.K.; Obeng-Nkrumah, N.; Nyamwaya, B.; Kagucia, E.; Cocker, D.; et al. Mortality associated with third-generation cephalodsporin resistance in Enterobacterales bloodstream infections at eight sub-Saharan African hospitals (MBIRA): A prospective cohort study. Lancet Infect. Dis. 2023, 23, 1280–1290. [Google Scholar] [CrossRef]
- Wheatley, R.M.; Botelho, J. Chasing resistance: Analysing the fight against hospital infections. Lancet Reg. Health Eur. 2023, 34, 100740. [Google Scholar] [CrossRef]
- Nouwen, J.L. Controlling antibiotic use and resistance. Clin. Infect. Dis. 2006, 42, 776–777. [Google Scholar] [CrossRef]
- Del Fiol, F.S. Antibiotic use and resistance. Basic. Clin. Pharmacol. Toxicol. 2014, 114, 439–440. [Google Scholar] [CrossRef] [PubMed]
- Solano, T.R. Antimicrobial resistance and antibiotic use. Anesth. Intensive Care 2010, 38, 987–988. [Google Scholar] [CrossRef] [PubMed]
- Widmer, A.F. Emerging antibiotic resistance: Why we need new antibiotics! Swiss Med. Wkly. 2022, 152, 40032. [Google Scholar] [CrossRef] [PubMed]
- Zazharskyi, W.; Davydenko, P.O.; Kulishenko, M.; Borovik, I.V.; Brygadyrenko, V.V. Antimicrobial activity of 50 plant extracts. Biosyst. Divers. 2019, 27, 163–169. [Google Scholar] [CrossRef]
- Oulahal, N.; Degraeve, P. Phenolic rich plant extracts with antimicrobial activity: An alternative to food preservatives and biocides. Front. Microbiol. 2022, 12, 753518. [Google Scholar] [CrossRef]
- Lee, S.Y.; Gill, C.M.; Nicolau, D.P. Activity of novel β-lactam. β-lactamase inhibitor combinations against serine carbapenemase-producing carbapenem resistant Pseudomonas Aeruginosa. J. Antimicrob. Chemoth. 2023, 78, 2795–2800. [Google Scholar] [CrossRef]
- Lin, D.M.; Koskella, B.; Lin, H.C. Phage therapy: An alternative to antibiotics in the age of multidrug resistance. World J. Gastrointest Pharmacol. Ther. 2017, 8, 162–173. [Google Scholar] [CrossRef]
- Strathdee, S.A.; Hatfull, G.F.; Mutalik, V.K.; Schooley, R.T. Phage therapy: From biological mechanisms to future directions. Cell 2023, 186, 17–31. [Google Scholar] [CrossRef]
- Dorotkiewicz-Jach, A.; Augustyniak, D.; Olszak, T.; Drulis-Kawa, Z. Modern therapeutic approaches against Pseudomonas aeruginosa infections. Curr. Med. Chem. 2015, 22, 1642–1664. [Google Scholar] [CrossRef]
- Maciejewska, B.; Olszak, T.; Drulis-Kawa, Z. Applications of bacteriophages versus phage enzymes to combat and cure bacterial infections: An ambitious and also a realistic application? Appl. Microbiol. Biotechnol. 2018, 102, 2563–2581. [Google Scholar] [CrossRef]
- Wojnicz, D.; Tichaczek-Goska, D.; Korzekwa, K.; Kicia, M.; Hendrich, A.B. Study of the impact of cranberry extract on the virulence factors and biofilm formation by Enterococcus faecalis strains isolated from urinary tract infection. Int. J. Food Sci. Nutr. 2016, 67, 1005–1016. [Google Scholar] [CrossRef] [PubMed]
- Mostafa, A.A.; Al-Askar, A.A.; Almaary, K.S.; Dawoud, T.M.; Sholkamy, E.N.; Bakri, M.M. Antimicrobial activity of some plants extracts against bacterial strains causing food poisoning diseases. Saudi J. Biol. Sci. 2018, 25, 361–366. [Google Scholar] [CrossRef] [PubMed]
- Sathianarayanan, S.; Ammanath, A.V.; Biswas, R.; Anita, B.; Anita Sukumaran, S.; Venkidasamy, B. A new approach against Helicobacter pylori using plants and its constituents: A review study. Microb. Pathog. 2022, 168, 105594. [Google Scholar] [CrossRef] [PubMed]
- Sroka, Z.; Zgórka, G.; Żbikowska, B.; Sowa, A.; Franiczek, R.; Wychowaniec, K.; Krzyżanowska, B. High antimicrobial efficacy, antioxidant activity, and a novel approach to phytochemical analysis of bioactive polyphenols in extracts from leaves Pyrus communis and Pyrus pyrifolia collected during one vegetative season. Microb. Drug Resist. 2019, 25, 582–593. [Google Scholar] [CrossRef]
- Caiati, C.; Stanca, A.; Lepera, M.E. Free radicals and obesity related chronic inflammation contrasted by antioxidants: A new perspective in coronary artery disease. Metabolites 2023, 13, 712. [Google Scholar] [CrossRef]
- Sakaguchi, K.; Yishikawa, M.; Fujita, Y.; Yamamoto, Y.; Ibaraki, T.; Fujioka, N.; Osa, T.; Yamauchi, M.; Ichikawa, H.; Muro, S. Serum free radical scavenging capacity profiles of patients with chronic obstructive pulmonary disease. Int. J. Chronic. Obstr. 2023, 18, 613–624. [Google Scholar] [CrossRef]
- Yang, H.M.; Leng, J.P.; Liu, N.; Huang, L. Editorial: Free radicals and antioxidants in diseases associated with immune dysfunction, inflammatory process, and aberrant metabolism. Front. Endocrinol. 2024, 15, 1363854. [Google Scholar] [CrossRef]
- Chaudhary, P.; Janmeda, P.; Docea, A.O.; Yeskaliyeva, B.; Razis Afa Modu, B.; Calina, D.; Sharifi-Rad, J. Oxidative stress, free radicals and antioxidants: Potential crosstalk in pathophysiology of human diseases. Front. Chem. 2023, 11, 1158198. [Google Scholar] [CrossRef]
- Hajam, Y.A.; Rani, R.; Ganie, S.Y.; Sheikh, T.A.; Javaid, D.; Qadri, S.S.; Pramodh, S.; Alsulimani, A.; Alkhanani, M.; Harakeh, S.; et al. Oxidative stress in human pathology and aging: Molecular mechanisms and perspectives. Cells 2022, 11, 552. [Google Scholar] [CrossRef]
- Ramos-Tovar, E.; Muriel, P. Free radicals, antioxidants, nuclear factor-E2- related factor-2 and liver damage. J. Appl. Toxicol. 2020, 40, 151–168. [Google Scholar] [CrossRef]
- Li, S.; Tan, H.Y.; Wang, N.; Zhang, Z.J.; Lao, L.X.; Wong, C.W.; Feng, Y.B. The role of oxidative stress and antioxidants in liver diseases. Int. J. Mol. Sci. 2015, 16, 26087–26124. [Google Scholar] [CrossRef]
- Juan, C.A.; de la Lastra, J.M.P.; Plou, F.J.; Pérez-Lebeña, E. The chemistry of reactive oxygen species (ROS) revisited: Outlining their role in biological macromolecules (DNA, lipids, and proteins) and induced pathologies. Int. J. Mol. Sci. 2021, 22, 4642. [Google Scholar] [CrossRef] [PubMed]
- Krawczyk, M.; Burzynska-Pedziwiatr, I.; Wozniak, L.A.; Bukowiecka-Matusiak, K. Impact of polyphenols on inflammatory and oxidative stress factors in diabetes mellitus: Nutritional antioxidants and their application in improving antidiabetic therapy. Biomolecules 2023, 13, 1402. [Google Scholar] [CrossRef] [PubMed]
- Yalçin, A.S.; Attaallah, W.; Yilmaz, A.M.; Aktan, A.Ő. Free radicals, whey proteins and colorectal cancers. Marmara Med. J. 2014, 27, 1–6. [Google Scholar] [CrossRef]
- Nielsen, O.H.; Ahnfelt-Ronne, I. Involvement of oxygen-derived free-radicals in the pathogenesis of chronic inflammatory bowel-disease. Klin. Wochenschr. 1991, 69, 995–1000. [Google Scholar] [CrossRef]
- Simpson, D.S.A.; Oliver, P.l.L. ROS generation in microglia: Understanding oxidative stress and inflammation in neurodegenerative disease. Antioxidants 2020, 9, 743. [Google Scholar] [CrossRef]
- El-Kenawi, A.; Ruffell, B. Inflammation, ROS, and mutagenesis. Cancer Cell 2017, 32, 727–729. [Google Scholar] [CrossRef]
- Wang, Y.Q.; Han, D.; Huang, Y.J.; Dai, Y.L.; Wang, Y.; Liu, M.; Wang, N.; Yin, T.Y.; Du, W.Q.; He, K. Oral administration of punicalagin attenuates imiquimod-induced psoriasis by reducing ROS generation and inflammation via MAPK/ERK and NFκB signaling pathways. Phytother. Res. 2024, 38, 713–726. [Google Scholar] [CrossRef] [PubMed]
- Wang, G.; Yang, F.; Zhou, W.; Xiao, N.; Luo, M.; Tang, Z. The initiation of oxidative stress and therapeutic strategies in wound healing. Biomed. Pharmacother. 2023, 157, 114004. [Google Scholar] [CrossRef]
- Nisar, A.; Jagtap, S.; Vyavahare, S.; Deshpande, M.; Harsulkar, A.; Ranjekar, P.; Prakash, O. Phytochemicals in the treatment of inflammation-associated diseases: The journey from preclinical trials to clinical practice. Front. Pharmacol. 2023, 14, 1177050. [Google Scholar] [CrossRef]
- Styrczewska, M.; Kostyn, A.; Kulma, A.; Majkowska-Skrobek, G.; Augustyniak, D.; Prescha, A.; Czuj, T.; Szopa, J. Flax fiber hydrophobic extract inhibits human skin cells inflammation and Causes remodeling of extracellular matrix and wound closure activation. BioMed Res. Int. 2015, 2015, 862391. [Google Scholar] [CrossRef] [PubMed]
- Jyoti, A.; Mishra, N.; Dhas, Y. Ageing consequences of excessive free radicals and inflammation. Curr. Sci. India 2017, 111, 1787–1793. [Google Scholar] [CrossRef]
- Awad, A.M.; Kumar, P.; Ismail-Fitry, M.R.; Jusoh, S.; Ab Aziz, M.F.; Sazili, A.Q. Green extraction of bioactive compounds from plant biomass and their application in meat as natural antioxidant. Antioxidants 2021, 10, 1465. [Google Scholar] [CrossRef] [PubMed]
- Lang, Y.X.; Gao, N.X.; Zang, Z.H.; Meng, X.J.; Lin, Y.; Yang, S.F.; Yang, Y.Y.; Jn, Z.; Li, B. Classification and antioxidant assays of polyphenols: A review. J. Future Foods 2024, 4, 193–204. [Google Scholar] [CrossRef]
- Vaou, N.; Stavropoulou, E.; Voidarou, C.; Tsakris, Z.; Rozos, G.; Tsigalou, C.; Bezirtzoglou, E. Interactions between plant-derived bioactive compounds: Focus on antimicrobial combination effect. Antibiotics 2022, 11, 1014. [Google Scholar] [CrossRef]
- Singh, S.; Verma, R.; Sharma, H. Exploring the therapeutic potential and bioactive compounds in Pyrus species. Pharmacol. Res. -Mod. Chin. Med. 2024, 10, 100342. [Google Scholar] [CrossRef]
- Cho, J.Y.; Park, K.Y.; Lee, K.H.; Lee, H.J.; Lee, S.H.; Cho, J.A.; Kim, W.S.; Shin, S.C.; Park, K.H.; Moon, J.H. Recovery of arbutin in high purity from fruit peals of pear (Pyrus pyrifolia Nakai). Food Sci. Biotechnol. 2011, 20, 801–807. [Google Scholar] [CrossRef]
- Sasaki, C.; Ichitani, M.; Kunimoto, K.K.; Asada, C.; Nakamura, Y. Extraction of arbutin and its comparative content in branches, leaves, stems, and fruits of Japanese pear Pyrus pyrifolia cv. Kousui. Biosci. Biotechnol. Biochem. 2014, 78, 874–877. [Google Scholar] [CrossRef]
- Singleton, V.L.; Rossi, J.A. Colorimetry of total phenolics with phosphomolybdic-phosphotungustic acid reagents. Am. J. Enol. Vitic. 1965, 16, 144–158. [Google Scholar] [CrossRef]
- Folin, O.; Ciocalteu, V. On tyrosine and tryptophane determination in proteins. J. Biol. Chem. 1927, 27, 239–243. [Google Scholar] [CrossRef]
- Folin, O.; Denis, W. Tyrosine in proteins as determined by a new colorimetric method. J. Biol. Chem. 1912, 12, 245–251. [Google Scholar] [CrossRef]
- Christ, B.; Müller, K.H. Zur serienmaessigen Bestimmung des an Flavonol-Derivaten in Drogen. Arch. Pharm. 1960, 293, 1033–1042. [Google Scholar] [CrossRef] [PubMed]
- Re, R.; Pellegrini, N.; Proteggente, A.; Pannala, A.; Yang, M.; Rice-Evans, C. Antioxidant activity applying an improved ABTS radical cation decolorization assay. Free Radic. Bio Med. 1999, 26, 1231–1237. [Google Scholar] [CrossRef] [PubMed]
- Sroka, Z.; Żbikowska, B.; Hładyszowski, J. The antiradical activity of some selected flavones and flavonols. Experimental and quantum mechanical study. J. Mol. Model. 2015, 21, 307. [Google Scholar] [CrossRef]
- Brand-Williams, W.; Cuvelier, M.E.; Berset, C. Use of the free radical method to evaluate antioxidant activity. LWT–Food Sci. Technol. 1995, 28, 25–30. [Google Scholar] [CrossRef]
- Fecka, I.; Włodarczyk, M.; Starzec, A. Isolation and structure elucidation of cistusin: A new ellagitannin from Cistus x incanus L. leaves. Ind. Crops Prod. 2020, 158, 112971. [Google Scholar] [CrossRef]
- Ternhag, A.; Törner, A.; Svensson, Å.; Giesecke, J.; Ekdahl, K. Mortality following Campylobacter infection: A registry-based linkage study. BMC Infect. Dis. 2005, 5, 1–5. [Google Scholar] [CrossRef]
- Contreras, M.; Thiberge, J.M.; Mandrand-Berthelot, M.A.; Labigne, A. Characterization of the roles of NikR, a nickel-responsive pleiotropic autoregulator of Helicobacter Pylori. Mol. Microbiol. 2003, 49, 947–963. [Google Scholar] [CrossRef]
- Sroka, Z.; Żbikowska, B.; Janicki, K.; Franiczek, R.; Krzyżanowska, B.; Dryś, A. Antimicrobial and antiradical activity of extracts obtained from leaves of tree species of the genus Pyrus. Microb. Drug Resist. 2014, 20, 337–343. [Google Scholar]
- Żbikowska, B.; Franiczek, R.; Sowa, A.; Połukord, G.; Krzyżanowska, B.; Sroka, Z. Antimicrobial and antiradical activity of extracts obtained from leaves of five species of the genus Bergenia: Identification of antimicrobial compounds. Microb. Drug Resist. 2017, 23, 771–780. [Google Scholar] [CrossRef]
- Saleh, R.O.; Dheyab, A.S.; Hadi, B.H.; Hasan, R.N.; Jasim, S.A. Effect of ethanolic extract of Syzygium aromaticum plant against Enterococcus faecalis isolated from woman with urinary tract infections. Arch. Clin. Infect. Dis. 2024, 19, 134924. [Google Scholar] [CrossRef]
- Said, M.S.; Tirthani, E.; Lesho, E. Enterococcus infections. In StatPearls [Internet]; StatPearls Publishing: Treasure Island, FL, USA, 2024. Available online: https://www.ncbi.nlm.nih.gov/books/NBK567759/ (accessed on 12 February 2024).
- Sanya, D.R.A.; Onésime, D.; Vizzarro, G.; Jacquier, N. Recent advances in therapeutic targets identification and development of treatment strategies towards Pseudomonas aeruginosa infections. BMC Microbiol. 2023, 23, 86. [Google Scholar] [CrossRef] [PubMed]
- Sathe, N.; Beech, P.; Croft, L.; Suphioglu, C.; Kapat, A.; Athan, E. Pseudomonas aeruginosa: Infections and novel approaches to tratment “Knowing the enemy” the treat of Pseudomonas aeruginosa and exploring novel approaches to treatment. Infect. Med. 2023, 2, 178–194. [Google Scholar] [CrossRef] [PubMed]
- Quin, S.; Xiao, W.; Zhou, C.; Pu, Q.; Deng, X.; Lan, L.; Liang, H.; Song, X.; Wu, M. Pseudomonas aeruginosa: Pathogenesis, virulence factors, antibiotic resistance, interaction with host, technology advances and emerging therapeutics. Signal Transduct. Target. Ther. 2022, 7, 199. [Google Scholar] [CrossRef]
- Monte, D.F.M.; Sellera, F.P.; Lincopan, N.; Landgraf, M. Genome-based diagnostic of MDR Escherichia coli ONT: H19ST10955 causing human gastrointestinal infection. Diagn. Microbiol. Infect. Dis. 2024, 110, 116340. [Google Scholar] [CrossRef]
- Zhou, Y.; Zhou, Z.; Zheng, L.; Gong, Z.; Li, Y.; Jin, Y.; Huang, Y.; Chi, M. Urinary tract infections caused by uropathogenic Escherichia coli: Mechanisms of infection and treatment options. Int. J. Mol. Sci. 2023, 24, 10537. [Google Scholar] [CrossRef]
- Siniagina, M.N.; Markelova, M.I.; Boulygina, E.A.; Laikov, A.V.; Odintsova, A.H.; Abdulkhakov, R.A.; Grigoryeva, T.V. Diversity and adaptations of Escherichia coli strains: Exploring the intestinal community in Crohn’s disease patients and healthy individuals. Microorganisms 2021, 9, 1299. [Google Scholar] [CrossRef]
- Ma, C.; He, N.; Zhao, Y.; Xia, D.; Wei, J.; Kang, W. Antimicrobial mechanism of hydroquinone. Appl. Biochem. Biotechnol. 2019, 189, 1291–1303. [Google Scholar] [CrossRef]
- Sroka, Z.; Kolasa, A. Polish Patent 2011. PL 208366, 29 April 2011. [Google Scholar]
- Santana-Gálvez, J.; Cisneros-Zevallos, L.; Jacobo-Velázquez, D.A. A practical guide for designing effective nutraceutical combinations in the form of foods beverages, and dietary supplements against chronic degenerative diseases. Trends Foods Sci. Technol. 2019, 88, 179–193. [Google Scholar] [CrossRef]
- Pham-Huy, L.A.; He, H.; Pham-Huy, C. Free Radicals, Antioxidants in disease and health. Int. J. Biomed. Sci. 2008, 4, 89–96. [Google Scholar] [CrossRef]
- Nisa, R.U.; Nisa, A.U.; Tantray, A.Y.; Shah, A.H.; Jan, A.T.; Shah, A.A.; Wani, I.A. Plant phenolics with promising therapeutic applications against skin disorders: A miechanistic review. J. Agric. Food Res. 2024, 16, 101090. [Google Scholar] [CrossRef]
- Chen, G.Y.; Tao, Q.W.; Liu, X.Y.; Yan, X.E.; Yu, X.; Liu, Y.; Luo, J. Total flavonoids of rhizoma Drynariae treat osteoarthritis by inhibiting arachidonic acid metabolites through AMPK/NFκB pathway. J. Inflamm. Res. 2023, 16, 4123–4140. [Google Scholar] [CrossRef] [PubMed]
- Wojciechowski, D.; Sroka, Z.; Gamian, A. Investigation of antiradical potential of different kinds of teas and extracts from these teas using antiradical activity units (TAU). Postep. Hig. I Med. Dosw. 2011, 65, 796–803. [Google Scholar] [CrossRef] [PubMed]

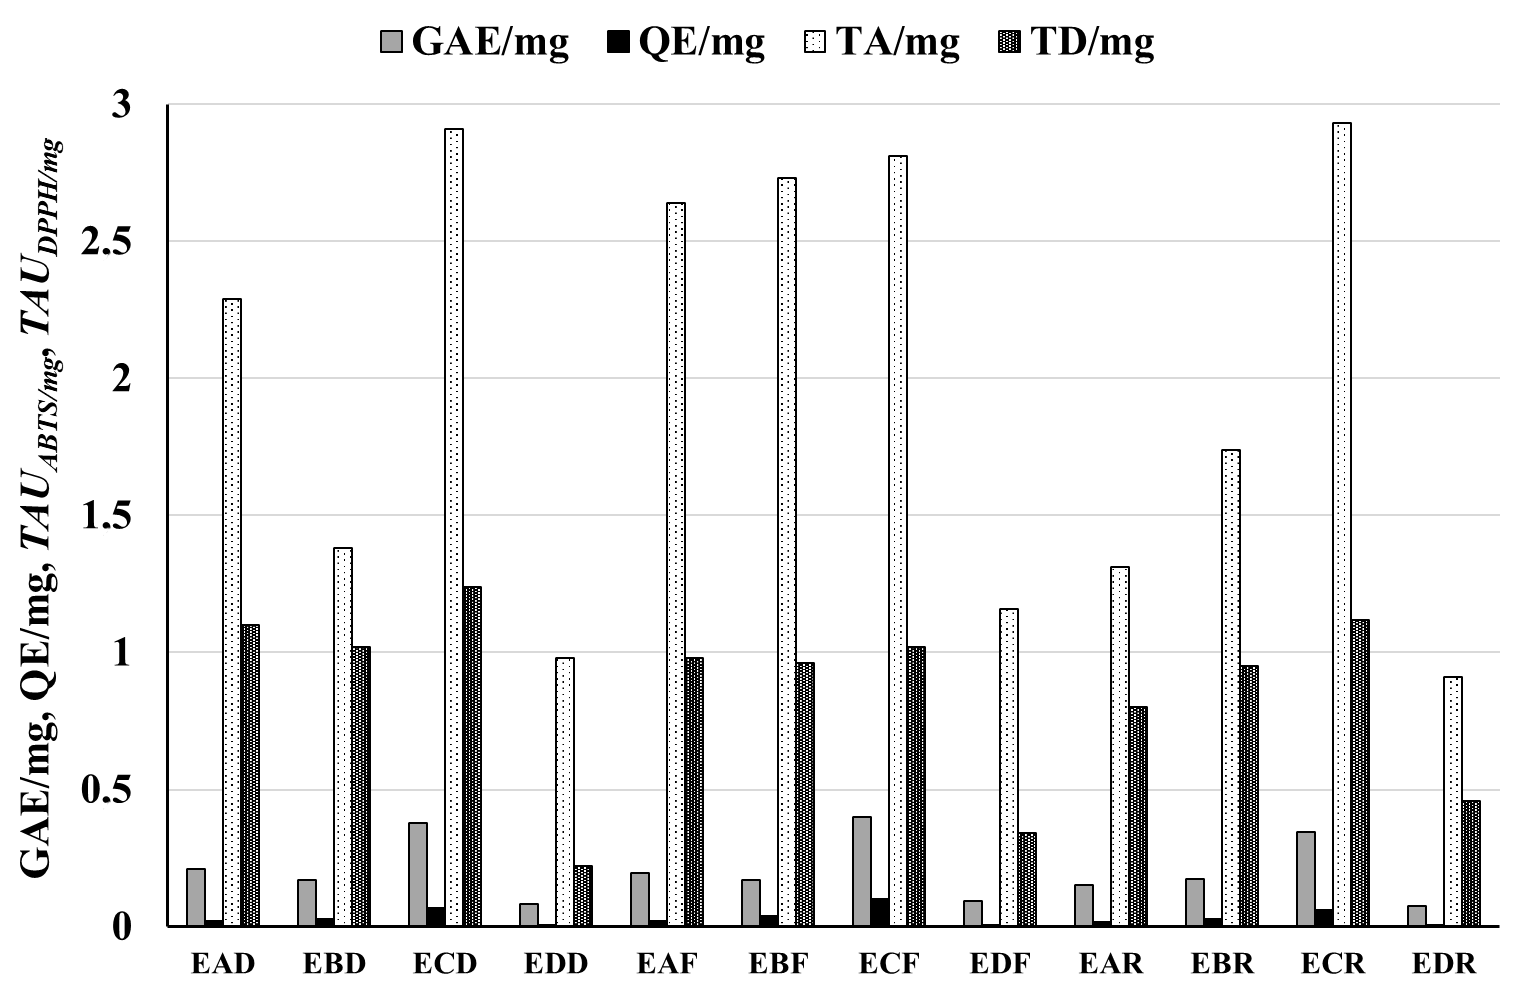
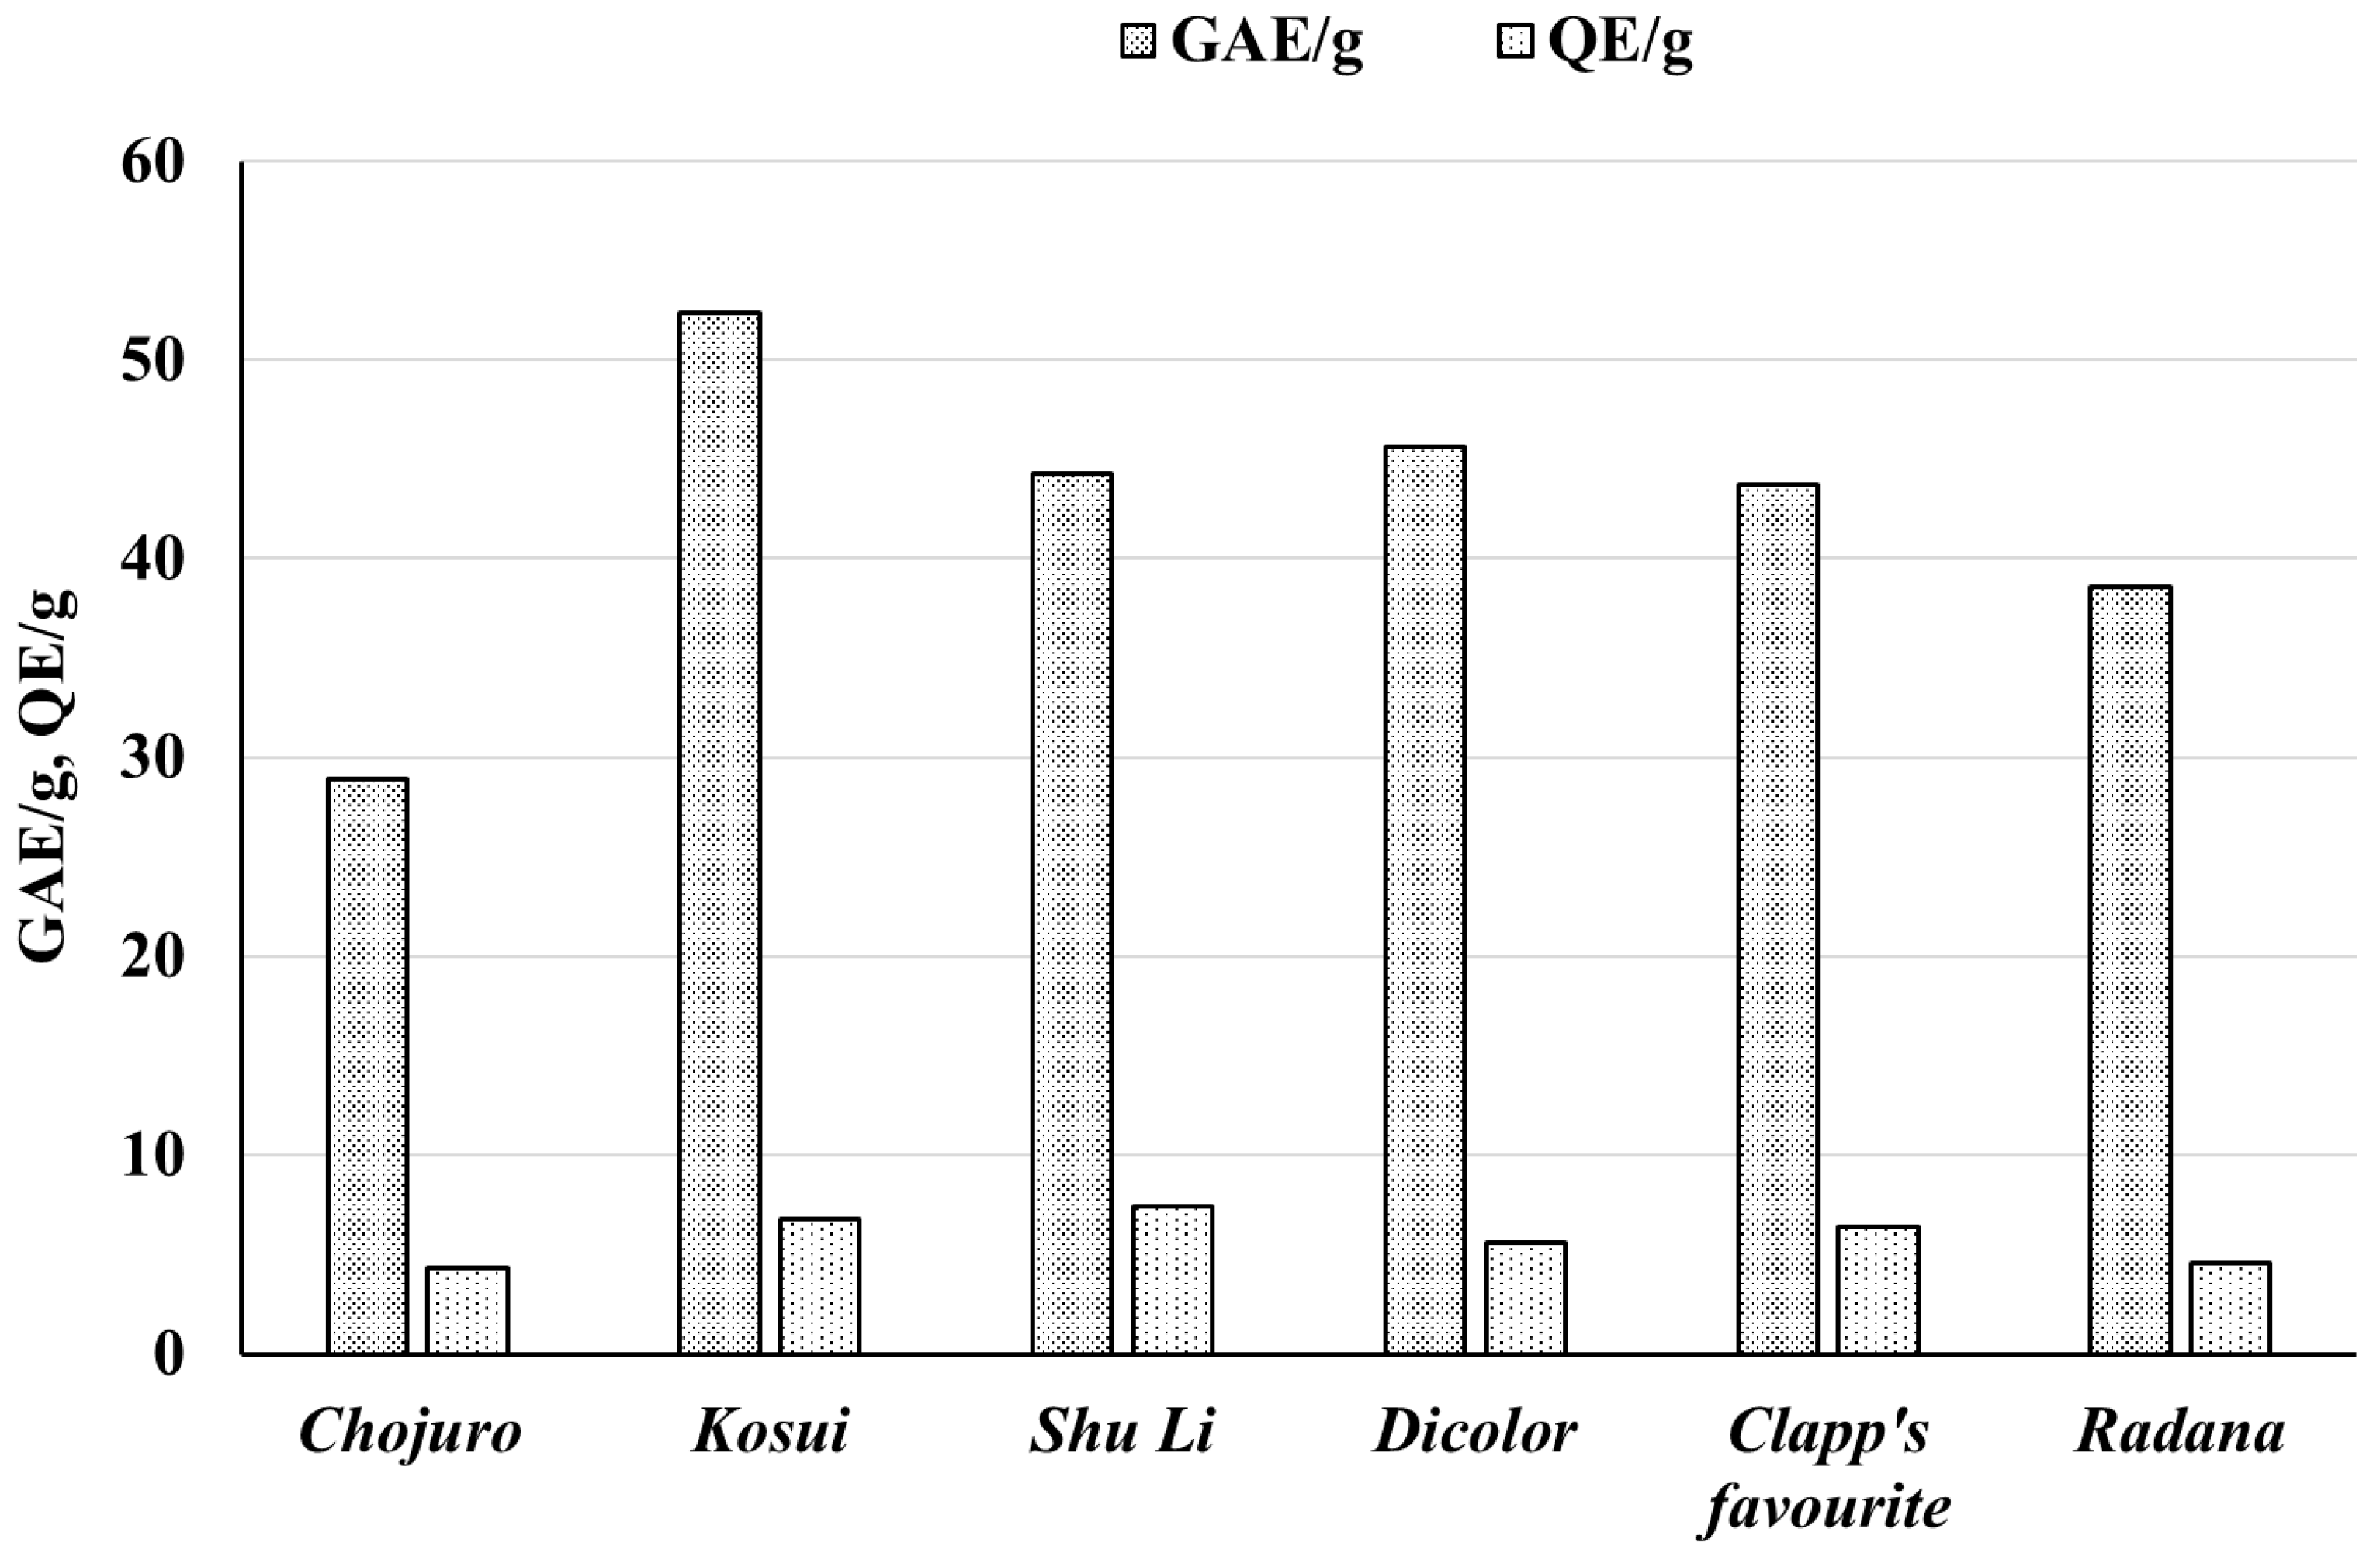
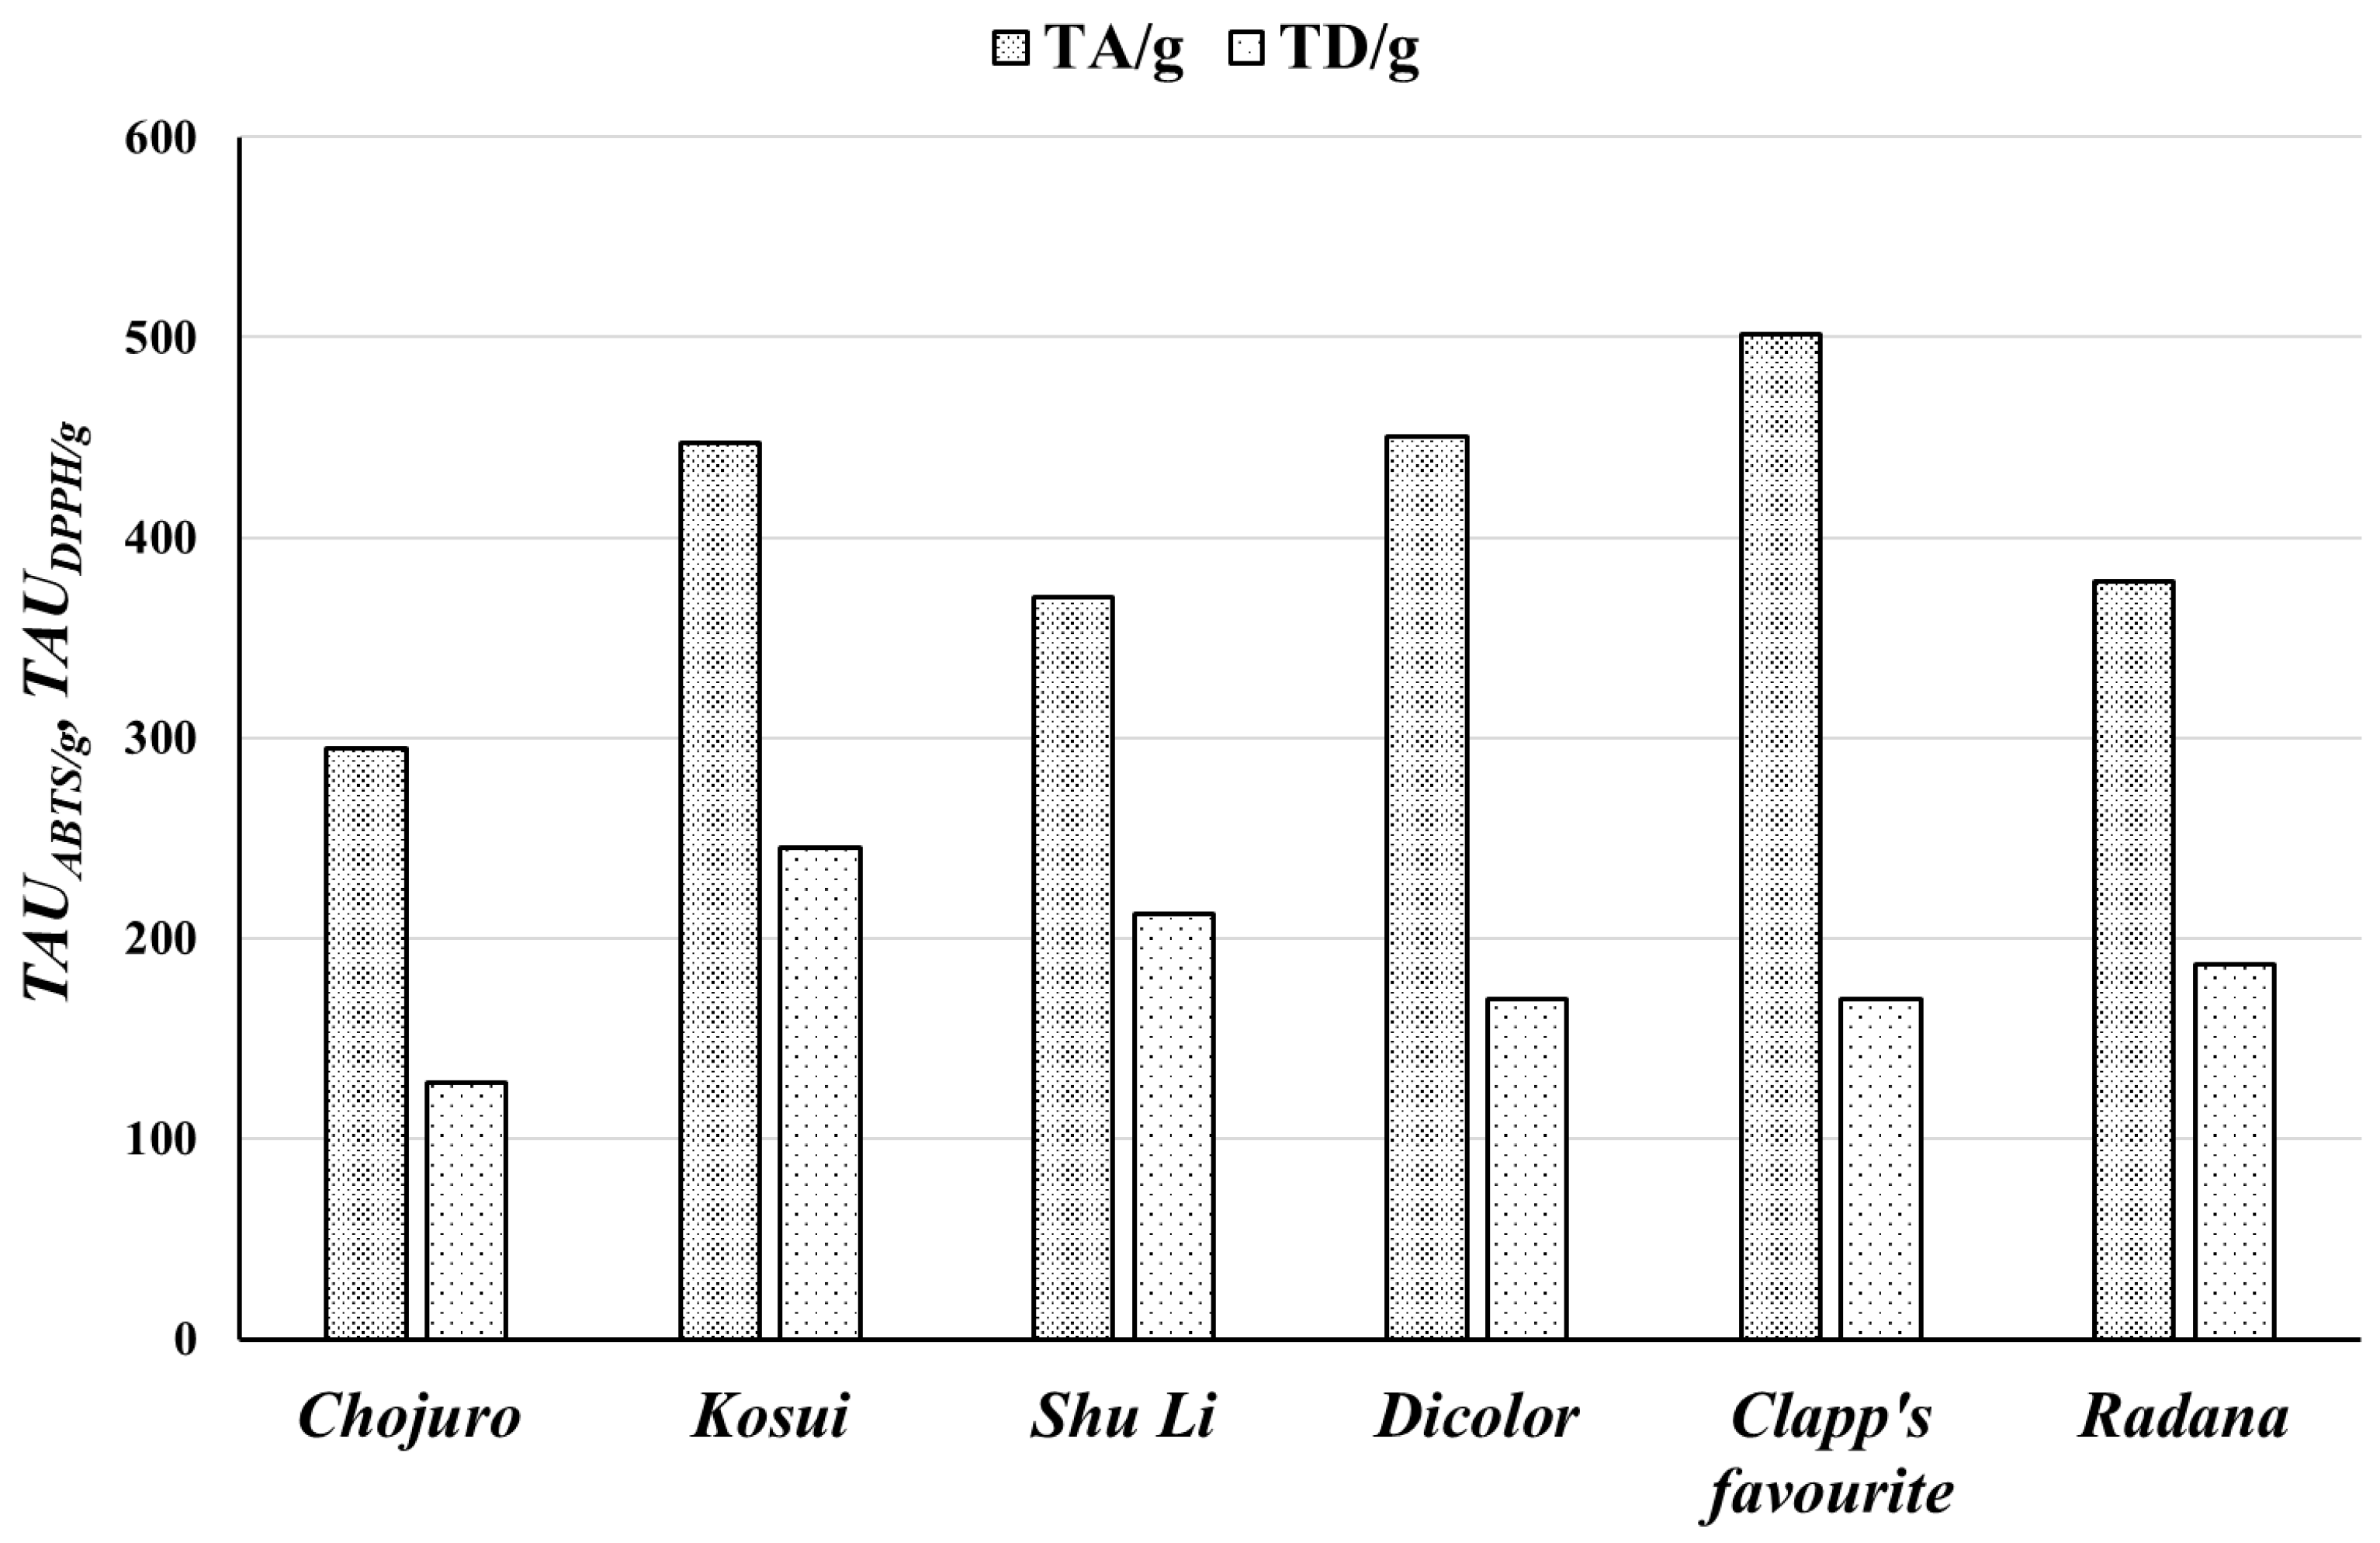
| Raw Material | Extracts | GAE/mg | GAE/g | QE/mg | QE/g | TAUABTS/mg | TAUABTS/g | TAUDPPH/mg | TAUDPPH/g |
|---|---|---|---|---|---|---|---|---|---|
| Pyrus communis “Dicolor” | EAD | 0.211 ± 0.0010 | 45.61 ± 1.16 | 0.019 ± 0.0001 | 5.61 ± 0.08 | 2.29 ± 0.17 | 450.3 ± 35.2 | 1.10 ± 0.06 | 169.4 ± 13.9 |
| EBD | 0.171 ± 0.0018 | 0.028 ± 0.0001 | 1.38 ± 0.07 | 1.02 ± 0.05 | |||||
| ECD | 0.377 ± 0.0019 | 0.068 ± 0.0002 | 2.91 ± 0.17 | 1.24 ± 0.04 | |||||
| EDD | 0.083 ± 0.0004 | 0.006 ± 0.0001 | 0.98 ± 0.04 | 0.22 ± 0.03 | |||||
| Pyrus communis “Clapp’s favourite” | EAF | 0.197 ± 0.0017 | 43.73 ± 2.07 | 0.022 ± 0.0001 | 6.42 ± 0.05 | 2.64 ± 0.14 | 501.6 ± 35.0 | 0.98 ± 0.05 | 169.9 ± 15.4 |
| EBF | 0.170 ± 0.0025 | 0.039 ± 0.0001 | 2.73 ± 0.22 | 0.96 ± 0.05 | |||||
| ECF | 0.401 ± 0.0015 | 0.100 ± 0.0002 | 2.81 ± 0.15 | 1.02 ± 0.04 | |||||
| EDF | 0.092 ± 0.0018 | 0.007 ± 0.0001 | 1.16 ± 0.04 | 0.34 ± 0.04 | |||||
| Pyrus communis “Radana” | EAR | 0.152 ± 0.0010 | 38.58 ± 0.59 | 0.016 ± 0.0001 | 4.57 ± 0.10 | 1.31 ± 0.07 | 378.3 ± 27.9 | 0.80 ± 0.05 | 186.5 ± 11.0 |
| EBR | 0.174 ± 0.0003 | 0.029 ± 0.0002 | 1.74 ± 0.09 | 0.95 ± 0.05 | |||||
| ECR | 0.347 ± 0.0008 | 0.059 ± 0.0003 | 2.93 ± 0.19 | 1.12 ± 0.03 | |||||
| EDR | 0.077 ± 0.0004 | 0.005 ± 0.0001 | 0.91 ± 0.04 | 0.46 ± 0.01 |
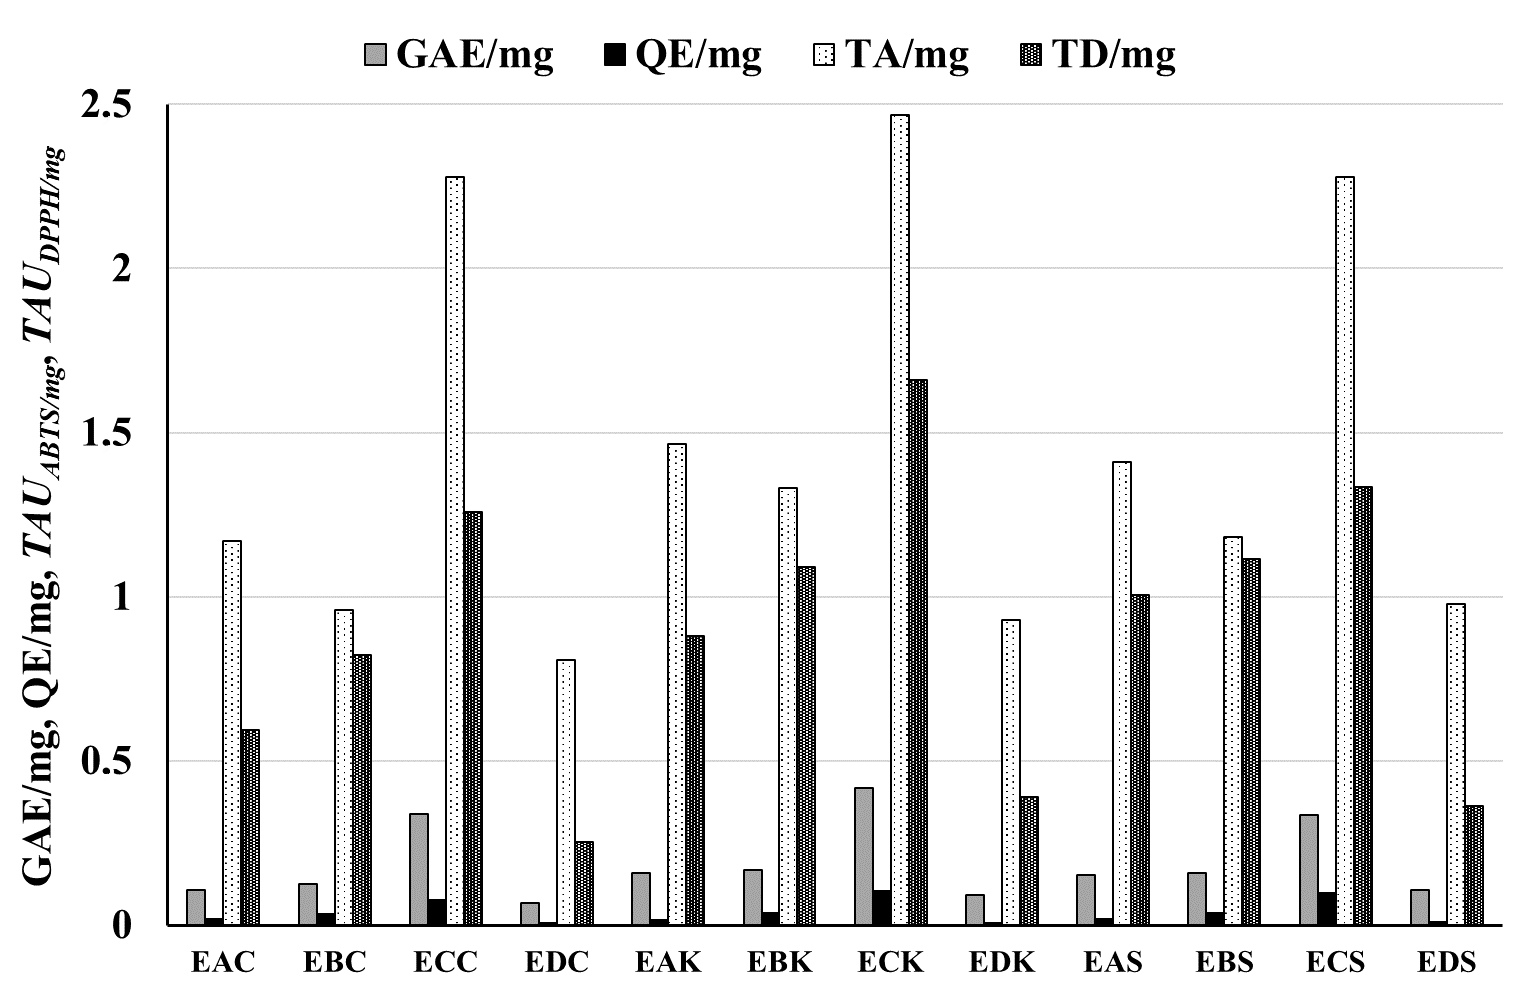
| Raw Material | Extracts | GAE/mg | GAE/g | QE/mg | QE/g | TAUABTS/mg | TAUABTS/g | TAUDPPH/mg | TAUDPPH/g |
|---|---|---|---|---|---|---|---|---|---|
| Pyrus pyrifolia “Chojuro” | EAC | 0.108 ± 0.003 | 28.88 ± 0.77 | 0.017 ± 0.001 | 4.31 ± 0.12 | 1.17 ± 0.07 | 294.7 ± 29.6 | 0.595 ± 0.028 | 127.47 ± 8.95 |
| EBC | 0.126 ± 0.003 | 0.035 ± 0.001 | 0.96 ± 0.070 | 0.821 ± 0.040 | |||||
| ECC | 0.338 ± 0.009 | 0.075 ± 0.002 | 2.277 ± 0.055 | 1.257 ± 0.052 | |||||
| EDC | 0.067 ± 0.002 | 0.006 ± 0.001 | 0.807 ± 0.089 | 0.254 ± 0.013 | |||||
| Pyrus pyrifolia “Kosui” | EAK | 0.159 ± 0.004 | 52.37 ± 1.39 | 0.016 ± 0.001 | 6.81 ± 0.19 | 1.466 ± 0.054 | 447.59 ± 26.79 | 0.881 ± 0.024 | 244.86 ± 12.42 |
| EBK | 0.168 ± 0.005 | 0.036 ± 0.001 | 1.332 ± 0.072 | 1.092 ± 0.034 | |||||
| ECK | 0.416 ± 0.011 | 0.103 ± 0.003 | 2.466 ± 0.095 | 1.661 ± 0.047 | |||||
| EDK | 0.092 ± 0.002 | 0.006 ± 0.001 | 0.929 ± 0.039 | 0.389 ± 0.010 | |||||
| Pyrus pyrifolia “Shu Li” | EAS | 0.154 ± 0.004 | 44.31 ± 1.17 | 0.020 ± 0.001 | 7.39 ± 0.21 | 1.411 ± 0.058 | 369.93 ± 24.94 | 1.006 ± 0.064 | 212.22 ± 14.03 |
| EBS | 0.159 ± 0.004 | 0.037 ± 0.001 | 1.181 ± 0.069 | 1.114 ± 0.034 | |||||
| ECS | 0.334 ± 0.009 | 0.099 ± 0.003 | 2.278 ± 0.115 | 1.334 ± 0.040 | |||||
| EDS | 0.108 ± 0.003 | 0.008 ± 0.001 | 0.977 ± 0.051 | 0.364 ± 0.0010 |
| Extract | S.a.ATCC 25923 | S.a. MRSA | E.c.ATCC 25922 | E.c.ESBL | P.a.ATCC 27853 | P.a. 256 | B.s. | NTHi ATCC 47249 | NTHi6 | H.p. ATCC 43504 | SZD |
|---|---|---|---|---|---|---|---|---|---|---|---|
| EAD | 0 | 0 | 0 | 0 | 0 | 0 | 0 | 0 | 0 | 9.2 ± 0.68 | 9.2 ± 0.68 |
| ECD | 11 ± 0.9 | 0 | 8.7 ± 0.5 | 0 | 9.3 ± 1 | 7.2 ± 0.6 | 8 ± 0.9 | 9.7 ± 0.6 | 8.5 ± 0.6 | 10 ± 0.52 | 72.4 ± 5.62 |
| EAF | 0 | 0 | 0 | 0 | 0 | 0 | 0 | 0 | 0 | 10.5 ± 1.2 | 10.5 ± 1.2 |
| EBF | 0 | 0 | 0 | 0 | 0 | 0 | 0 | 0 | 0 | 8.3 ± 0.52 | 8.3 ± 0.52 |
| ECF | 12.2 ± 0.4 | 0 | 7.1 ± 0.5 | 0 | 9 ± 0.7 | 6.9 ± 0.2 | 7.9 ± 1.4 | 9.2 ± 1 | 7.9 ± 0.9 | 9.3 ± 1.03 | 69.5 ± 6.13 |
| EAR | 0 | 0 | 0 | 0 | 0 | 0 | 0 | 0 | 0 | 8.7 ± 0.93 | 8.7 ± 0.93 |
| EBR | 10.3 ± 0.8 | 0 | 0 | 0 | 0 | 0 | 0 | 0 | 0 | 9.7 ± 1.03 | 20 ± 1.83 |
| ECR | 9.8 ± 1.6 | 0 | 7.6 ± 0.7 | 0 | 8.8 ± 0.8 | 8 ± 0.9 | 7.6 ± 0.5 | 8.7 ± 0.8 | 8.9 ± 0.9 | 10 ± 0.89 | 69.4 ± 7.09 |
| Antibiotic | CPX (16) | CIP(25) | CIP(25) | AMC(16) | CIP(30) | AMC(23) | IMP(25) | DO(31) | |||
| FOX(30) | AMC(25) | SXT(30) | IMP(22) | AMC(23) | C(20) | ||||||
| CIP(27) | SXT(34) | TZP(21) | TZP(22) | SXT(28) | |||||||
| DMSO | 0 | 0 | 0 | 0 | 0 | 0 | 0 | 0 | 0 | 0 |
| Extract | S.a.ATCC 25923 | S.a. MRSA | E.c.ATCC 25922 | E.c.ESBL | P.a.ATCC 27853 | P.a. 256 | B.s. | N.T.H.i. ATCC 47249 | N.T.H.i.6 | H.p. ATCC 43504 | SZD |
|---|---|---|---|---|---|---|---|---|---|---|---|
| EAC | 0 | 0 | 0 | 0 | 0 | 0 | 8.2 ± 0.6 | 0 | 0 | 8.4 ± 0.8 | 16.6 ± 1.4 |
| ECC | 13 ± 2 | 7.6 ± 0.5 | 9 ± 0.9 | 0 | 8.7 ± 1 | 8 ± 0.6 | 11.8 ± 1.5 | 8.9 ± 0.7 | 8.4 ± 0.9 | 8.8 ± 1.6 | 84.2 ± 9.7 |
| EAK | 0 | 0 | 0 | 0 | 0 | 0 | 9.8 ± 0.8 | 0 | 0 | 7.9 ± 0.8 | 17.7 ± 1.6 |
| EBK | 0 | 0 | 0 | 0 | 0 | 0 | 8.5 ± 1.2 | 0 | 0 | 11 ± 1.7 | 19.5 ± 2.9 |
| ECK | 14.4 ± 3 | 0 | 7.3 ± 0.9 | 0 | 7.4 ± 0.5 | 7.7 ± 0.8 | 12.1 ± 0.8 | 9.8 ± 0.8 | 9.4 ± 0.5 | 10.0 ± 1.6 | 78.1 ± 8.9 |
| EAS | 0 | 0 | 0 | 0 | 0 | 0 | 0 | 0 | 0 | 9.2 ± 0.29 | 9.2 ± 0.29 |
| EBS | 0 | 0 | 0 | 0 | 0 | 0 | 8.8 ± 1.2 | 0 | 0 | 10 ± 3.5 | 18.8 ± 4.7 |
| ECS | 11.2 ± 1 | 0 | 0 | 0 | 8.6 ± 1.1 | 7.8 ± 0.7 | 8.7 ± 0.7 | 9.1 ± 0.5 | 8.8 ± 0.8 | 11 ± 0.8 | 65.2 ± 5.6 |
| EDS | 11.4 ± 2 | 0 | 0 | 0 | 0 | 0 | 11.5 ± 1 | 9.3 ± 0.8 | 9.8 ± 0.3 | 7.6 ± 0.4 | 40.4 ± 4.5 |
| Cultivar | Extract | Hydrochinon [μg/mg Dry Weight] | Arbutin [μg/mg dr Weight] | Hydroquinone [mg/g Raw Material] | Arbutin [mg/g Raw Material] |
|---|---|---|---|---|---|
| Dicolor | EAD | 2.54 ± 0.004 | 37.48 ± 0.141 | 0.565 ± 0.014 | 9.849 ± 0.213 |
| EBD | 2.48 ± 0.007 | 24.56 ± 0.111 | |||
| ECD | 3.89 ± 0.033 | 62.34 ± 0.034 | |||
| EDD | 1.23 ± 0.005 | 26.14 ± 0.031 | |||
| Clapp’s favourite | EAF | 2.30 ± 0.013 | 54.26 ± 0.076 | 0.542 ± 0.013 | 14.361 ± 0.314 |
| EBF | 2.64 ± 0.026 | 28.71 ± 0.108 | |||
| ECF | 4.95 ± 0.020 | 78.79 ± 0.163 | |||
| EDF | 1.16 ± 0.004 | 47.27 ± 0.093 | |||
| Radana | EAR | 2.32 ± 0.001 | 63.73 ± 0.204 | 0.536 ± 0.014 | 16.717 ± 0.369 |
| EBR | 2.31 ± 0.012 | 15.49 ± 0.126 | |||
| ECR | 4.03 ± 0.045 | 145.91 ± 0.112 | |||
| EDR | 1.18 ± 0.009 | 40.57 ± 0.091 |
| Cultivar | Extract | Hydrochinon [μg/mg Extract] | Arbutin [μg/mg Extract] | Hydroquinone [mg/g Raw Material] | Arbutin [mg/g Raw Material] |
|---|---|---|---|---|---|
| Chojuro | EAC | 2.37 ± 0.005 | 48.30 ± 0.509 | 0.461 ± 0.012 | 11.899 ± 0.260 |
| EBC | 2.39 ± 0.025 | 26.59 ± 0.085 | |||
| ECC | 4.63 ± 0.014 | 92.68 ± 0.161 | |||
| EDC | 1.23 ± 0.017 | 43.62 ± 0.014 | |||
| Kosui | EAK | 3.11 ± 0.016 | 70.69 ± 0.188 | 0.753 ± 0.021 | 24.754 ± 0.533 |
| EBK | 2.37 ± 0.018 | 41.85 ± 0.132 | |||
| ECK | 4.37 ± 0.040 | 148.24 ± 0.144 | |||
| EDK | 1.17 ± 0.009 | 58.21 ± 0.051 | |||
| Shu Li | EAS | 2.59 ± 0.030 | 47.17 ± 0.150 | 1.519 ± 0.061 | 9.502 ± 0.216 |
| EBS | 2.32 ± 0.010 | 15.94 ± 0.081 | |||
| ECS | 5.71 ± 0.041 | 46.05 ± 0.192 | |||
| EDS | 8.08 ± 0.204 | 20.50 ± 0.016 |
Disclaimer/Publisher’s Note: The statements, opinions and data contained in all publications are solely those of the individual author(s) and contributor(s) and not of MDPI and/or the editor(s). MDPI and/or the editor(s) disclaim responsibility for any injury to people or property resulting from any ideas, methods, instructions or products referred to in the content. |
© 2025 by the authors. Licensee MDPI, Basel, Switzerland. This article is an open access article distributed under the terms and conditions of the Creative Commons Attribution (CC BY) license (https://creativecommons.org/licenses/by/4.0/).
Share and Cite
Żbikowska, B.; Kotowska, M.; Gamian, A.; Patek, K.; Matuła, K.; Augustyniak, D.; Korzekwa, K.; Sroka, Z. Antimicrobial and Antiradical Activity of Extracts from Leaves of Various Cultivars of Pyrus communis and Pyrus pyrifolia. Biomolecules 2025, 15, 821. https://doi.org/10.3390/biom15060821
Żbikowska B, Kotowska M, Gamian A, Patek K, Matuła K, Augustyniak D, Korzekwa K, Sroka Z. Antimicrobial and Antiradical Activity of Extracts from Leaves of Various Cultivars of Pyrus communis and Pyrus pyrifolia. Biomolecules. 2025; 15(6):821. https://doi.org/10.3390/biom15060821
Chicago/Turabian StyleŻbikowska, Beata, Magdalena Kotowska, Andrzej Gamian, Katarzyna Patek, Katarzyna Matuła, Daria Augustyniak, Kamila Korzekwa, and Zbigniew Sroka. 2025. "Antimicrobial and Antiradical Activity of Extracts from Leaves of Various Cultivars of Pyrus communis and Pyrus pyrifolia" Biomolecules 15, no. 6: 821. https://doi.org/10.3390/biom15060821
APA StyleŻbikowska, B., Kotowska, M., Gamian, A., Patek, K., Matuła, K., Augustyniak, D., Korzekwa, K., & Sroka, Z. (2025). Antimicrobial and Antiradical Activity of Extracts from Leaves of Various Cultivars of Pyrus communis and Pyrus pyrifolia. Biomolecules, 15(6), 821. https://doi.org/10.3390/biom15060821