

Serum Npas-4 and Nptx-2 Levels in Alzheimer’s Disease: Potential Biomarkers of Synaptic Dysfunction in a Cross-Sectional Study


Abstract
1. Introduction
2. Materials and Methods
2.1. Research Sample
2.2. Procedure
2.3. Biochemical Analysis
2.4. Statistical Analysis
3. Results
4. Discussion
5. Conclusions
Author Contributions
Funding
Institutional Review Board Statement
Informed Consent Statement
Data Availability Statement
Conflicts of Interest
References
- 2021 Alzheimer’s Disease Facts and Figures. Alzheimer’s Dement. 2021, 17, 327–406. [CrossRef] [PubMed]
- Jack, C.R., Jr.; Albert, M.; Knopman, D.S.; Mckhann, G.M.; Sperling, R.A.; Carillo, M.; Thies, W.; Phelps, C.H. Introduction to Revised Criteria for the Diagnosis of Alzheimer’s Disease: National Institute on Aging and the Alzheimer Association Workgroups. Alzheimer Dement. 2011, 7, 257–262. [Google Scholar] [CrossRef] [PubMed]
- Mangalmurti, A.; Lukens, J.R. How Neurons Die in Alzheimer’s Disease: Implications for Neuroinflammation. Curr. Opin. Neurobiol. 2022, 75, 102575. [Google Scholar] [CrossRef] [PubMed]
- Heneka, M.T.; Carson, M.J.; El Khoury, J.; Landreth, G.E.; Brosseron, F.; Feinstein, D.L.; Jacobs, A.H.; Wyss-Coray, T.; Vitorica, J.; Ransohoff, R.M.; et al. Neuroinflammation in Alzheimer’s Disease. Lancet Neurol. 2015, 14, 388–405. [Google Scholar] [CrossRef]
- Gill, L.; Jonathan, H.; Andrew, S.; David, A.; Clive, B.; Sube, B.; Carol, B.; Alistair, B.; Cohen-Mansfield, J.; Cooper, C.; et al. Dementia Prevention, Intervention, and Care: 2020 Report of the Lancet Commission. Lancet 2020, 396, 413–446. [Google Scholar]
- Prince, M.; Wimo, A.; Guerchet, M.; Ali, G.-C.; Wu, Y.-T.; Prina, M. World Alzheimer Report 2015. The Global Impact of Dementia: An Analysis of Prevalence, Incidence, Cost and Trends. Alzheimer’s Disease International. 2015. Available online: https://www.alzint.org/u/WorldAlzheimerReport2015.pdf (accessed on 26 May 2025).
- Tanzi, R.E. The Genetics of Alzheimer Disease. Cold Spring Harb. Perspect. Med. 2012, 2, 1–10. [Google Scholar] [CrossRef]
- Jack, C.R., Jr.; Bennett, D.A.; Blennow, K.; Carrillo, M.C.; Dunn, B.; Haeberlein, S.B.; Holtzman, D.M.; Jagust, W.; Jessen, F.; Karlawish, J.; et al. SRC NIA-AA Research Framework: Toward a Biological Definition of Alzheimer’s Disease. Alzheimers Dement. 2018, 14, 535–562. [Google Scholar] [CrossRef]
- Selkoe, D.J. Alzheimer’s Disease Is a Synaptic Failure. Science 2002, 298, 789–791. [Google Scholar] [CrossRef]
- Chapman, G.; Shanmugalingam, U.; Smith, P.D. The Role of Neuronal Pentraxin 2 (NP2) in Regulating Glutamatergic Signaling and Neuropathology. Front. Cell. Neurosci. 2020, 13, 1–6. [Google Scholar] [CrossRef]
- Hu, H.; Gan, J.; Jonas, P. Fast-Spiking, Parvalbumin+ GABAergic Interneurons: From Cellular Design to Microcircuit Function. Science 2014, 345, 1255263. [Google Scholar] [CrossRef]
- Chang, M.C.; Park, J.M.; Pelkey, K.A.; Grabenstatter, H.L.; Xu, D.; Linden, D.J.; Sutula, T.P.; McBain, C.J.; Worley, P.F. Narp Regulates Homeostatic Scaling of Excitatory Synapses on Parvalbumin-Expressing Interneurons. Nat. Neurosci. 2010, 13, 1090–1097. [Google Scholar] [CrossRef] [PubMed]
- Lodato, S.; Arlotta, P. Generating Neuronal Diversity in the Mammalian Cerebral Cortex. Annu. Rev. Cell Dev. Biol. 2015, 31, 699–720. [Google Scholar] [CrossRef] [PubMed]
- Cuttler, K.; Hassan, M.; Carr, J.; Cloete, R.; Bardien, S. Emerging Evidence Implicating a Role for Neurexins in Neurodegenerative and Neuropsychiatric Disorders. Open Biol. 2021, 11, 210091. [Google Scholar] [CrossRef] [PubMed]
- Stevens, B.; Allen, N.J.; Vazquez, L.E.; Howell, G.R.; Christopherson, K.S.; Nouri, N.; Micheva, K.D.; Mehalow, A.K.; Huberman, A.D.; Stafford, B.; et al. The Classical Complement Cascade Mediates CNS Synapse Elimination. Cell 2007, 131, 1164–1178. [Google Scholar] [CrossRef]
- Lin, Y.; Bloodgood, B.L.; Hauser, J.L.; Lapan, A.D.; Koon, A.C.; Kim, T.K.; Hu, L.S.; Malik, A.N.; Greenberg, M.E. Activity-Dependent Regulation of Inhibitory Synapse Development by Npas4. Nature 2008, 30, 1198–1204. [Google Scholar] [CrossRef]
- Palop, J.J.; Mucke, L. Amyloid-β–induced neuronal dysfunction in Alzheimer’s disease: From synapses toward neural networks. Nat. Neurosci. 2010, 13, 812–818. [Google Scholar] [CrossRef]
- Bloodgood, B.L.; Sharma, N.; Browne, H.A.; Trepman, A.Z.; Greenberg, M.E. The Activity-Dependent Transcription Factor NPAS4 Regulates Domain-Specific Inhibition. Nature 2013, 7, 121–125. [Google Scholar] [CrossRef]
- Spiegel, I.; Mardinly, A.R.; Gabel, H.W.; Bazinet, J.E.; Couch, C.H.; Tzeng, C.P.; Harmin, D.A.; Greenberg, M.E. Npas4 Regulates Excitatory-Inhibitory Balance within Neural Circuits through Cell-Type-Specific Gene Programs. Cell 2014, 22, 1216–1229. [Google Scholar] [CrossRef]
- Choy, F.C.; Klarić, T.S.; Koblar, S.A.; Lewis, M.D. The Role of the Neuroprotective Factor Npas4 in Cerebral Ischemia. Int. J. Mol. Sci. 2015, 16, 29011–29028. [Google Scholar] [CrossRef]
- Wolozin, B. Cholesterol and the Biology of Alzheimer’s Disease. Neuron 2004, 41, 7–10. [Google Scholar] [CrossRef]
- American Psychiatric Association. Diagnostic and Statistical Manual of Mental Disorders, 5th ed.; American Psychiatric Association: Arlington, VA, USA, 2013; Available online: https://repository.poltekkes-kaltim.ac.id/657/1/Diagnostic%20and%20statistical%20manual%20of%20mental%20disorders%20_%20DSM-5%20(%20PDFDrive.com%20).pdf (accessed on 26 May 2025).
- Albert, M.S.; DeKosky, S.T.; Dickson, D.; Dubois, B.; Feldman, H.H.; Fox, N.C.; Gamst, A.; Holtzman, D.M.; Jagust, W.J.; Petersen, R.C.; et al. The Diagnosis of Mild Cognitive Impairment Due to Alzheimer’s Disease: Recommendations from the National Institute on Aging-Alzheimer’s Association Workgroups on Diagnostic Guidelines for Alzheimer’s Disease. Alzheimers Dement. 2011, 7, 270–279. [Google Scholar] [CrossRef] [PubMed]
- Folstein, M.F.; Folstein, S.E.; McHugh, P.R. “Mini-Mental State”. A Practical Method for Grading the Cognitive State of Patients for the Clinician. J. Psychiatr. Res. 1975, 12, 189–198. [Google Scholar] [CrossRef] [PubMed]
- Güngen, C.; Ertan, T.; Eker, E.; Yaşar, R.; Engin, F. Reliability and Validity of the Standardized Mini Mental State Examination in the Diagnosis of Mild Dementia in Turkish Population. Turk. Psikiyatr. Derg. 2002, 13, 273–281. [Google Scholar]
- George, D.; Mallery, P. SPSS for Windows Step by Step: A Simple Guide and Reference. 17.0 Update, 10th ed.; Pearson: Boston, MA, USA, 2010. [Google Scholar]
- Leitch, B. Parvalbumin Interneuron Dysfunction in Neurological Disorders: Focus on Epilepsy and Alzheimer’s Disease. Int. J. Mol. Sci. 2024, 25, 5549. [Google Scholar] [CrossRef] [PubMed]
- Choy, F.C.; Klarić, T.S.; Leong, W.K.; Koblar, S.A.; Lewis, M.D. Reduction of the Neuroprotective Transcription Factor Npas4 Results in Increased Neuronal Necrosis, Inflammation and Brain Lesion Size Following Ischaemia. J. Cereb. Blood Flow. Metab. 2016, 36, 1449–1463. [Google Scholar] [CrossRef]
- Shepard, R.; Heslin, K.; Coutellier, L. The Transcription Factor Npas4 Contributes to Adolescent Development of Prefrontal Inhibitory Circuits, and to Cognitive and Emotional Functions: Implications for Neuropsychiatric Disorders. Neurobiol. Dis. 2017, 99, 36–46. [Google Scholar] [CrossRef]
- Ooe, N.; Motonaga, K.; Kobayashi, K.; Saito, K.; Kaneko, H. Functional Characterization of Basic Helix-Loop-Helix-PAS Type Transcription Factor NXF in Vivo Putative Involvement in an “on Demand” Neuroprotection System. J. Biol. Chem. 2009, 284, 1057–1063. [Google Scholar] [CrossRef]
- Zhang, Z.; Fei, P.; Mu, J.; Li, W.; Song, J. Hippocampal Expression of Aryl Hydrocarbon Receptor Nuclear Translocator 2 and Neuronal PAS Domain Protein 4 in a Rat Model of Depression. Neurol. Sci. 2014, 35, 277–282. [Google Scholar] [CrossRef]
- Coutellier, L.; Gilbert, V.; Shepard, R. Npas4 Deficiency Increases Vulnerability to Juvenile Stress in Mice. Behav. Brain Res. 2015, 295, 17–25. [Google Scholar] [CrossRef]
- Klarić, T.S.; Jaehne, E.J.; Koblar, S.A.; Baune, B.T.; Lewis, M.D. Alterations in Anxiety and Social Behaviour in Npas4 Deficient Mice Following Photochemically-Induced Focal Cortical Stroke. Behav. Brain Res. 2017, 316, 29–37. [Google Scholar] [CrossRef]
- Gu, S.; Li, X.; Zhao, L.; Ren, H.; Pei, C.; Li, W.; Mu, J.; Song, J.; Zhang, Z. Decreased Npas4 Expression in Patients with Post-Stroke Depression. J. Neurorestoratol. 2019, 7, 101–108. [Google Scholar] [CrossRef]
- Drouet, J.B.; Peinnequin, A.; Faure, P.; Denis, J.; Fidier, N.; Maury, R.; Buguet, A.; Cespuglio, R.; Canini, F. Stress-Induced Hippocampus Npas4 MRNA Expression Relates to Specific Psychophysiological Patterns of Stress Response. Brain Res. 2018, 1679, 75–83. [Google Scholar] [CrossRef] [PubMed]
- Lleó, A.; Carmona-Iragui, M.; Videla, L.; Fernández, S.; Benejam, B.; Pegueroles, J.; Barroeta, I.; Altuna, M.; Valldeneu, S.; Xiao, M.F.; et al. VAMP-2 Is a Surrogate Cerebrospinal Fluid Marker of Alzheimer-Related Cognitive Impairment in Adults with Down Syndrome. Alzheimer’s Res. Ther. 2021, 13, 119. [Google Scholar] [CrossRef] [PubMed]
- Xiao, M.F.; Xu, D.; Craig, M.T.; Pelkey, K.A.; Chien, C.C.; Shi, Y.; Zhang, J.; Resnick, S.; Pletnikova, O.; Salmon, D.; et al. NPTX2 and Cognitive Dysfunction in Alzheimer’s Disease. Elife 2017, 6, e23798. [Google Scholar] [CrossRef]
- Zhao, J.K.; Hou, S.J.; Zhao, J.W.; Yu, H.L.; Duan, S.R. An Interventional Study of Baicalin on Neuronal Pentraxin-1, Neuronal Pentraxin-2, and C-Reactive Protein in Alzheimer’s Disease Rat Model. Transl. Neurosci. 2023, 14, 20220298. [Google Scholar] [CrossRef]
- Pelkey, K.A.; Barksdale, E.; Craig, M.T.; Yuan, X.; Vargish, G.A.; Mitchell, R.M.; Wyeth, M.S.; Ronald, S.; Chittajallu, R.; Karlsson, R.; et al. Pentraxins Coordinate Excitatory Synapse Maturation and Circuit Integration of Parvalbumin Interneurons. Neuron 2016, 85, 1257–1272. [Google Scholar] [CrossRef]
- Page, C.E.; Alexander, J.; Shepard, R.; Coutellier, L. Npas4 Deficiency Interacts with Adolescent Stress to Disrupt Prefrontal GABAergic Maturation and Adult Cognitive Flexibility. Genes. Brain Behav. 2018, 17, e12459. [Google Scholar] [CrossRef]
- Kim, J.M.; Stewart, R.; Shin, I.S.; Yoon, J.S. Low Cholesterol, Cognitive Function and Alzheimer s Disease in a Community Population with Cognitive Impairment. J. Nutr. Health Aging 2002, 6, 320–323. [Google Scholar]
- Shobab, L.A.; Hsiung, G.Y.; Feldman, H.H. Cholesterol in Alzheimer’s Disease. Lancet Neurol. 2005, 12, 841–852. [Google Scholar] [CrossRef]
- Michikawa, M. The Role of Cholesterol in the Pathogenesis of Alzheimer’s Disease. Nippon. Nogeikagaku Kaishi 2003, 77, 1124–1126. [Google Scholar] [CrossRef]
- Notkola, I.L.; Sulkava, R.; Pekkanen, J.; Erkinjuntti, T.; Ehnholm, C.; Kivinen, P.; Tuomilehto, J.; Nissinen, A. Serum Total Cholesterol, Apolipoprotein E Ε4 Allele, and Alzheimer’s Disease. Neuroepidemiology 1998, 17, 14–20. [Google Scholar] [CrossRef]

| Patient Group n = 63 | Control Group n = 56 | t | Effect Size | p | |
|---|---|---|---|---|---|
| Mean ± SD | Mean ± SD | ||||
| Age (year) | 77.70 ± 5.48 | 76.13 ± 5.57 | −1.552 | 0.123 | |
| BMI (kg/m2) | 25.27 ± 3.22 | 25.35 ± 2.71 | 0.140 | 0.889 | |
| SMMT | 15.22 ± 4.73 | 25.75 ± 1.32 | 16.925 | 3.03 | <0.001 |
| Triglyceride (mg/dL) | 135.21 ± 56.60 | 146.71 ± 49.38 | 1.175 | 0.242 | |
| HDL Cholesterol (mg/dL) | 42.55 ± 10.87 | 45.05 ± 8.05 | 1.436 | 0.154 | |
| LDL Cholesterol (mg/dL) | 121.37 ± 36.19 | 137.50 ± 32.81 | 2.536 | 0.47 | 0.013 |
| Total Cholesterol (mg/dL) | 173.24 ± 41.01 | 203.50 ± 31.91 | 4.452 | 0.82 | <0.001 |
| NPAS-4 (ng/dL) | 2.12 ± 0.82 | 2.81 ± 0.89 | 4.387 | 0.81 | <0.001 |
| NPTX-2 (ng/dL) | 2.35 ± 1.24 | 3.08 ± 1.11 | 3.337 | 0.62 | 0.001 |
| Mild Cognitive Impairment n = 15 | Moderate Cognitive Impairment n = 38 | Severe Cognitive Impairment n = 10 | F | p | |
|---|---|---|---|---|---|
| Mean ± SD | Mean ± SD | Mean ± SD | |||
| Age (year) | 74.20 ± 3.51 a | 78.24 ± 5.74 b | 80.90 ± 4.41 bc | 5.698 | 0.005 |
| BMI (kg/m2) | 24.06 ± 3.18 | 25.83 ± 3.01 | 24.95 ± 3.83 | 1.716 | 0.189 |
| Triglyceride (mg/dL) | 141.80 ± 59.28 | 135.21 ± 57.67 | 125.30 ± 52.42 | 0.249 | 0.781 |
| HDL Cholesterol (mg/dL) | 45.02 ± 12.53 | 42.75 ± 10.09 | 38.13 ± 10.89 | 1.231 | 0.299 |
| LDL Cholesterol (mg/dL) | 124.47 ± 31.32 | 123.29 ± 39.43 | 109.40 ± 30.29 | 0.648 | 0.527 |
| Total Cholesterol (mg/dL) | 174.13 ± 46.20 | 177.95 ± 39.19 | 154.00 ± 38.02 | 1.371 | 0.262 |
| NPAS-4 (ng/dL) | 2.06 ± 0.85 | 2.07 ± 0.73 | 2.38 ± 1.12 | 0.597 | 0.553 |
| NPTX-2 (ng/dL) | 2.37 ± 1.45 | 2.24 ± 0.94 | 2.75 ± 1.85 | 0.686 | 0.508 |
| 1 | 2 | 3 | 4 | 5 | 6 | 7 | 8 | 9 | ||
|---|---|---|---|---|---|---|---|---|---|---|
| Age | r | 1 | ||||||||
| p | ||||||||||
| BMI | r | −0.082 | 1 | |||||||
| p | 0.520 | |||||||||
| SMMT | r | −0.527 | −0.147 | 1 | ||||||
| p | 0.000 | 0.250 | ||||||||
| TG | r | −0.105 | −0.140 | 0.111 | 1 | |||||
| p | 0.413 | 0.273 | 0.388 | |||||||
| HDL | r | −0.096 | 0.029 | 0.211 | −0.141 | 1 | ||||
| p | 0.453 | 0.820 | 0.097 | 0.269 | ||||||
| LDL | r | 0.090 | 0.045 | 0.082 | 0.486 | 0.167 | 1 | |||
| p | 0.483 | 0.728 | 0.525 | 0.000 | 0.191 | |||||
| TC | r | 0.009 | −0.010 | 0.144 | 0.442 | 0.479 | 0.787 | 1 | ||
| p | 0.946 | 0.940 | 0.262 | 0.000 | 0.000 | 0.000 | ||||
| NPAS-4 | r | −0.042 | −0.219 | −0.055 | 0.210 | −0.096 | 0.064 | −0.008 | 1 | |
| p | 0.747 | 0.085 | 0.668 | 0.098 | 0.455 | 0.617 | 0.951 | |||
| NPTX-2 | r | −0.036 | −0.131 | −0.060 | 0.205 | 0.015 | 0.033 | 0.109 | 0.783 | 1 |
| p | 0.782 | 0.306 | 0.643 | 0.107 | 0.907 | 0.800 | 0.395 | 0.000 | ||
| Risk Factors | B | S.E. | p | Exp(B) | 95% C.I. for EXP(B) | ||
|---|---|---|---|---|---|---|---|
| Lower | Upper | ||||||
| Step 1 a | Age | 0.054 | 0.037 | 0.146 | 1.056 | 0.981 | 1.136 |
| Gender(1) | −0.242 | 0.449 | 0.590 | 0.785 | 0.325 | 1.894 | |
| BMI | −0.128 | 0.076 | 0.090 | 0.880 | 0.759 | 1.020 | |
| NPAS-4 | −1.150 | 0.380 | 0.003 | 0.317 | 0.150 | 0.668 | |
| NPTX-2 | −0.022 | 0.243 | 0.929 | 0.979 | 0.608 | 1.575 | |
| Constant | 2.090 | 3.55 | 0.556 | 8.086 | |||
| Step 4 a | BMI | −0.121 | 0.073 | 0.096 | 0.886 | 0.768 | 1.022 |
| NPAS-4 | −1.163 | 0.297 | 0.000 | 0.313 | 0.175 | 0.559 | |
| Constant | 6.002 | 2.224 | 0.007 | 404.286 | |||
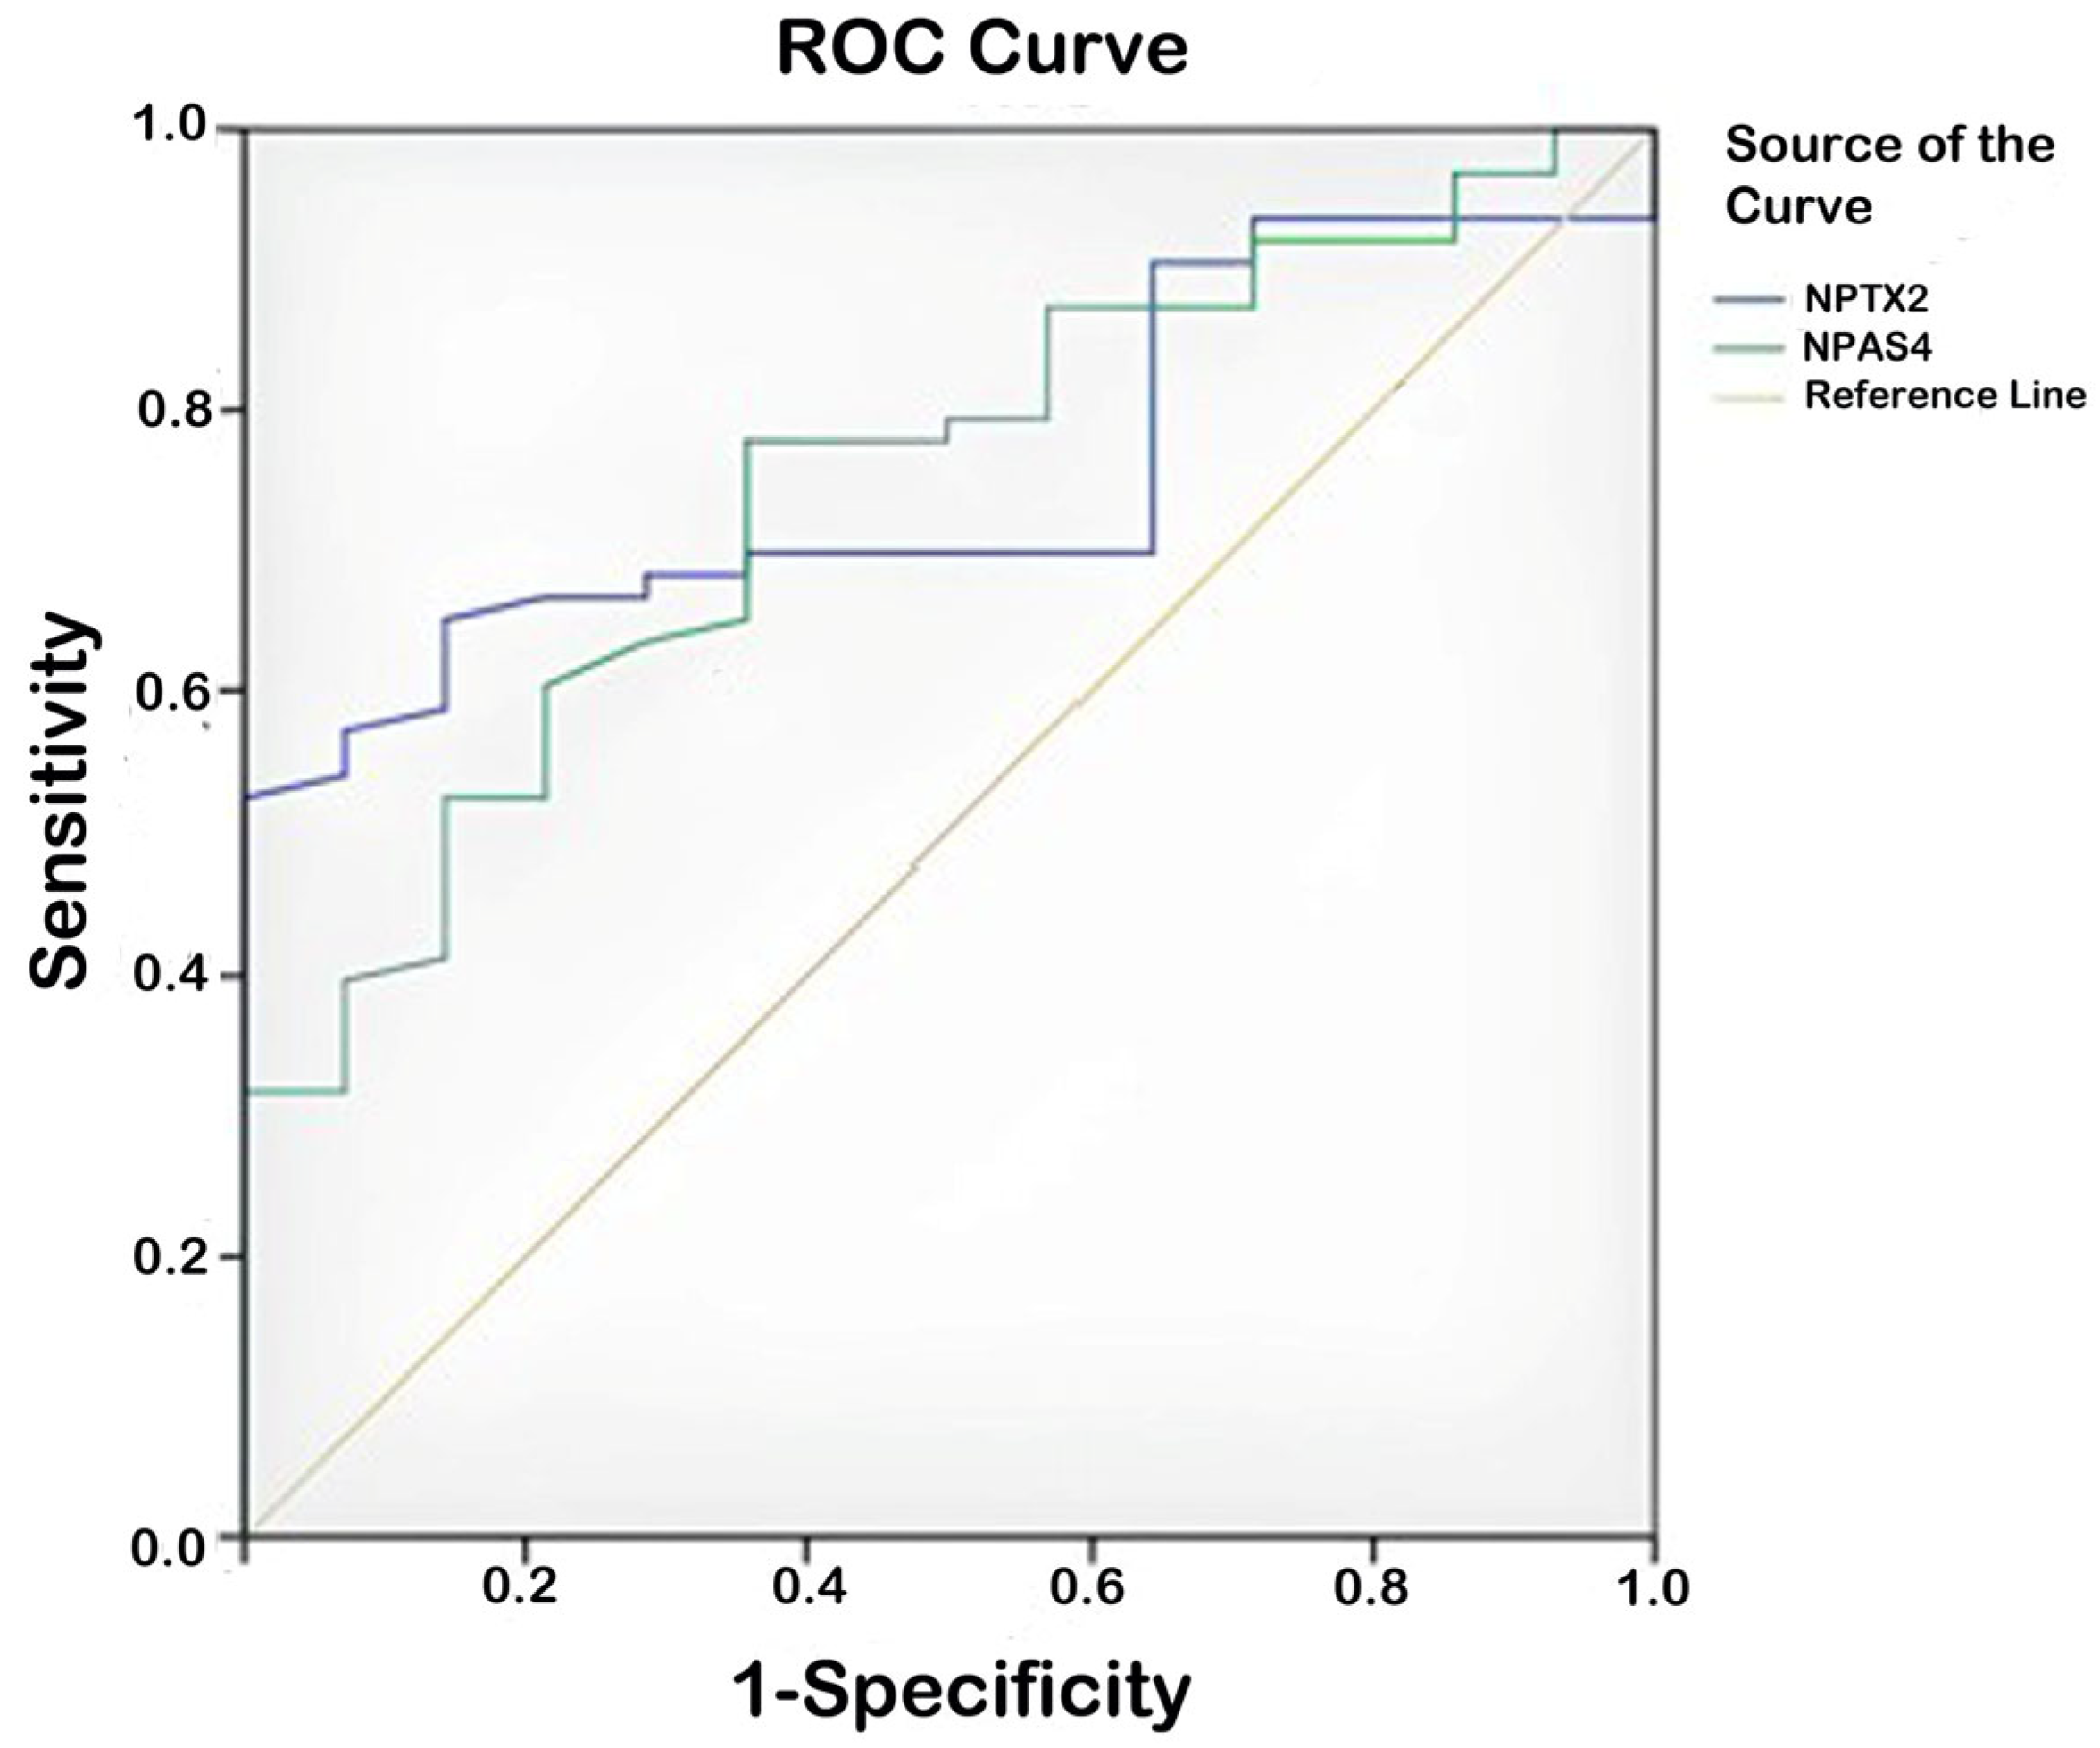
| Test Result Variable(s) | Area | Std. Error a | Asymptotic Sig. b | Asymptotic 95% Confidence Interval | ||
|---|---|---|---|---|---|---|
| Lower Bound | Upper Bound | |||||
| Patient group–control group | NPAS-4 | 0.744 | 0.045 | 0.000 | 0.656 | 0.831 |
| NPTX-2 | 0.755 | 0.046 | 0.000 | 0.665 | 0.845 | |
Disclaimer/Publisher’s Note: The statements, opinions and data contained in all publications are solely those of the individual author(s) and contributor(s) and not of MDPI and/or the editor(s). MDPI and/or the editor(s) disclaim responsibility for any injury to people or property resulting from any ideas, methods, instructions or products referred to in the content. |
© 2025 by the authors. Licensee MDPI, Basel, Switzerland. This article is an open access article distributed under the terms and conditions of the Creative Commons Attribution (CC BY) license (https://creativecommons.org/licenses/by/4.0/).
Share and Cite
Lazoglu Ozkaya, A.; Gürbüzer, N.; Mercantepe, T.; Mercantepe, F. Serum Npas-4 and Nptx-2 Levels in Alzheimer’s Disease: Potential Biomarkers of Synaptic Dysfunction in a Cross-Sectional Study. Biomolecules 2025, 15, 795. https://doi.org/10.3390/biom15060795
Lazoglu Ozkaya A, Gürbüzer N, Mercantepe T, Mercantepe F. Serum Npas-4 and Nptx-2 Levels in Alzheimer’s Disease: Potential Biomarkers of Synaptic Dysfunction in a Cross-Sectional Study. Biomolecules. 2025; 15(6):795. https://doi.org/10.3390/biom15060795
Chicago/Turabian StyleLazoglu Ozkaya, Alev, Nilifer Gürbüzer, Tolga Mercantepe, and Filiz Mercantepe. 2025. "Serum Npas-4 and Nptx-2 Levels in Alzheimer’s Disease: Potential Biomarkers of Synaptic Dysfunction in a Cross-Sectional Study" Biomolecules 15, no. 6: 795. https://doi.org/10.3390/biom15060795
APA StyleLazoglu Ozkaya, A., Gürbüzer, N., Mercantepe, T., & Mercantepe, F. (2025). Serum Npas-4 and Nptx-2 Levels in Alzheimer’s Disease: Potential Biomarkers of Synaptic Dysfunction in a Cross-Sectional Study. Biomolecules, 15(6), 795. https://doi.org/10.3390/biom15060795