
Sex Differences in Brain Transcriptomes of Juvenile Cynomolgus Macaques

 , , ,
, , ,
Abstract
1. Introduction
2. Materials and Methods
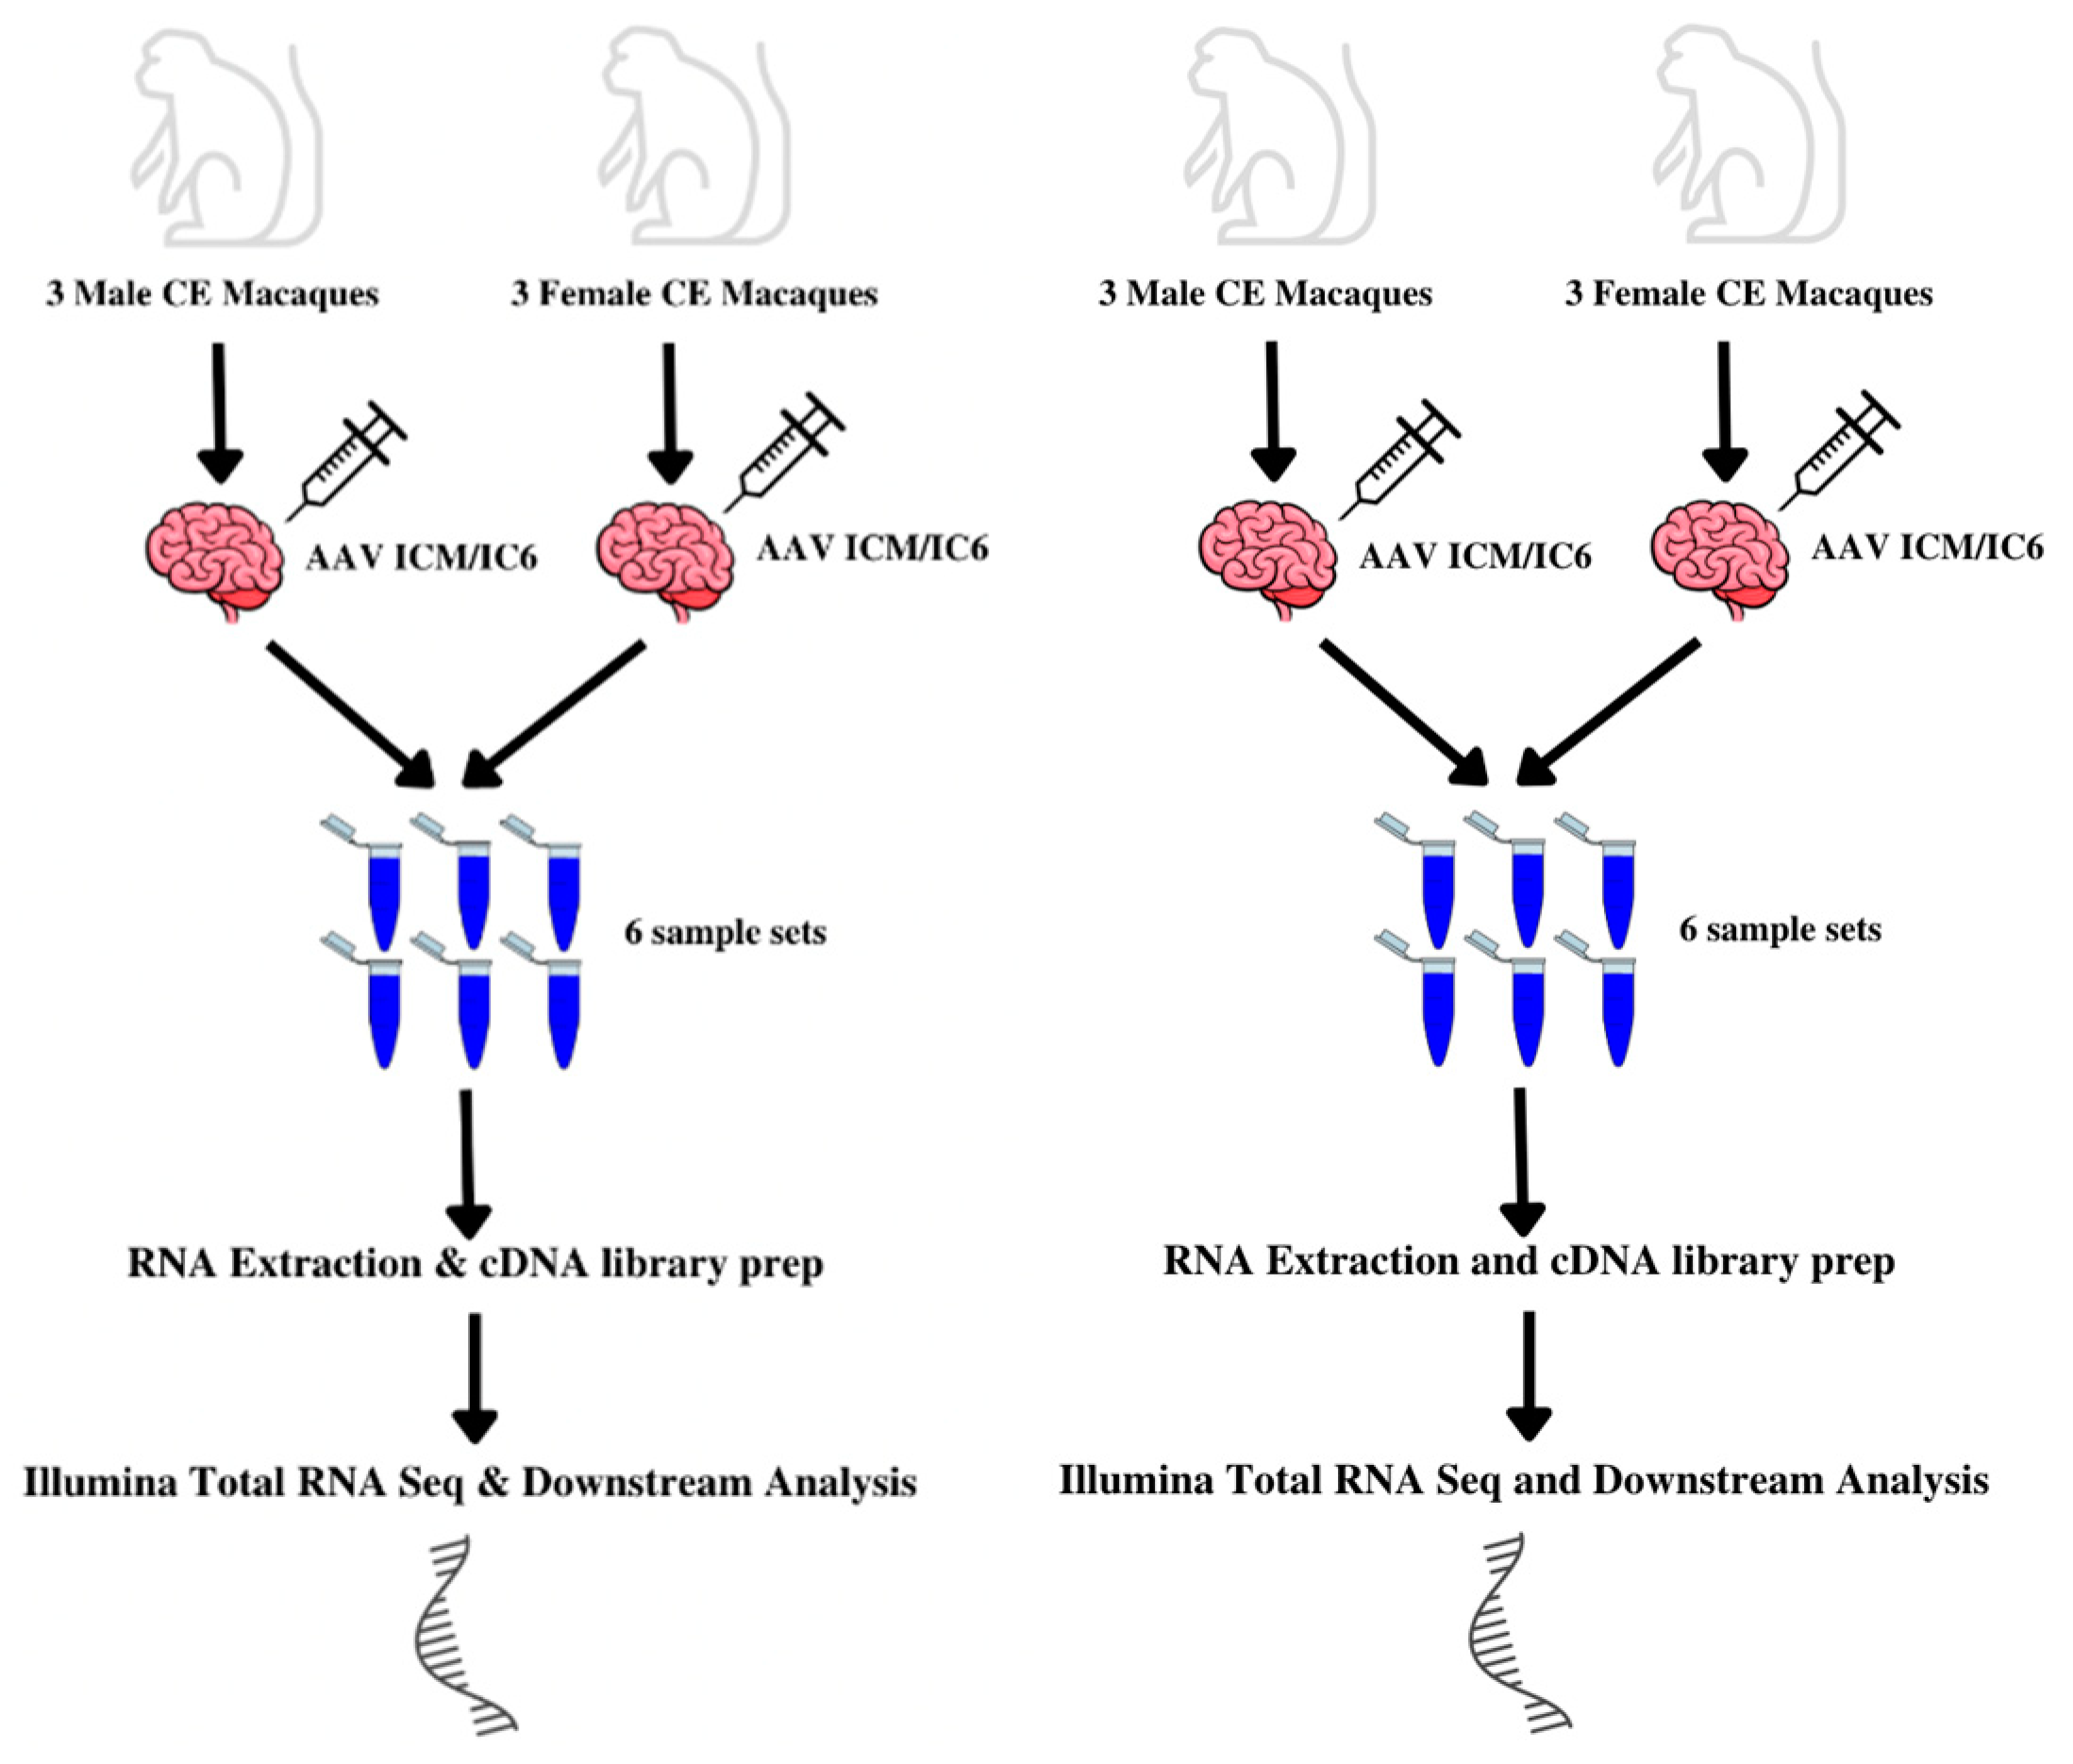
2.1. Animal Care, Brain Dissection, and Sample Processing
2.2. RNA Extraction and cDNA Library Preparation
2.3. RNAseq Processing, Quality Control, and Normalization
2.4. Gene Ontology Enrichment Analysis and Pathway Analysis
3. Results
4. Discussion
Perspectives and Significance
5. Conclusions
Author Contributions
Funding
Institutional Review Board Statement
Informed Consent Statement
Data Availability Statement
Conflicts of Interest
Abbreviations
| RNA | Ribonucleic acid |
| AAV | Adeno-associated virus |
| NHP | Non-human primate |
| MRI | Magnetic Resonance Imaging |
| MM | Rhesus macaques or M. mulatta |
| CE | Cynomolgus macaques or M. fascicularis |
| IACUC | Institutional Animal Care and Use Committee |
| DNA | Deoxyribonucleic acid |
| ICBR | Interdisciplinary Center for Biotechnology Research |
| NGS | NextGen DNA Sequencing |
| BP | Biological Processes |
| MF | Molecular Function |
| HP | Human Phenotype |
| CC | Cellular Components |
| GO | Gene Ontology |
| BLAST | Basic Local Alignment Search Tool |
| RPS4Y1 | Ribosomal Protein S4 Y-linked 1 |
| RPS4Y2 | Ribosomal Protein S4 Y-linked 2 |
| EIF1AY | Eukaryotic Initiation Factor 1A Y-linked |
| AVP | Arginine Vasopressin |
| IRAK3 | Interleukin 1 Receptor-Associated Kinase 3 |
| ACKR1 | Atypical Chemokine Receptor 1 |
| ICAM1 | Intercellular Adhesion Molecule 1 |
| MAFB | MafB Zip transcription factor |
| JUN | Transcription factor AP-1 |
| ASS1 | Arginosuccinate Synthase 1 |
| ALDH4A | 1 Aldehyde Dehydrogenase 4 family member A1 |
| NLGN4Y | Neuroligin 4 Y-linked |
| NLGN4X | Neuroligin 4 X-linked |
| NIH | National Institutes of Health |
| NINDS | National Institutes of Neurological Disorders and Stroke |
References
- Chan, A.W. Progress and prospects for genetic modification of nonhuman primate models in biomedical research. ILAR J. 2013, 54, 211–223. [Google Scholar] [CrossRef] [PubMed]
- Janecka, J.E.; Miller, W.; Pringle, T.H.; Wiens, F.; Zitzmann, A.; Helgen, K.M.; Springer, M.S.; Murphy, W.J. Molecular and genomic data identify the closest living relative of primates. Science 2007, 318, 792–794. [Google Scholar] [CrossRef]
- Rhesus Macaque Genome Sequencing and Analysis Consortium; Gibbs, R.; Rogers, J.; Katze, M.G.; Bumgarner, R.; Weinstock, G.M.; Mardis, E.R.; Remington, K.A.; Strausberg, R.L.; Venter, J.C.; et al. Evolutionary and biomedical insights from the rhesus macaque genome. Science 2007, 316, 222–234. [Google Scholar] [CrossRef]
- Goulas, A.; Bastiani, M.; Bezgin, G.; Uylings, H.B.M.; Roebroeck, A.; Stiers, P. Comparative analysis of the macroscale structural connectivity in the macaque and human brain. PLoS Comput. Biol. 2014, 10, e1003529. [Google Scholar] [CrossRef] [PubMed]
- Sacher, J.; Neumann, J.; Okon-Singer, H.; Gotowiec, S.; Villringer, A. Sexual dimorphism in the human brain: Evidence from neuroimaging. Magn. Reson. Imaging 2013, 31, 366–375. [Google Scholar] [CrossRef] [PubMed]
- Nopoulos, P.; Flaum, M.; O’leary, D.; Andreasen, N.C. Sexual dimorphism in the human brain: Evaluation of tissue volume, tissue composition and surface anatomy using magnetic resonance imaging. Psychiatry Res. 2000, 98, 1–13. [Google Scholar] [CrossRef]
- Knickmeyer, R.C.; Styner, M.; Short, S.J.; Lubach, G.R.; Kang, C.; Hamer, R.; Coe, C.L.; Gilmore, J.H. Maturational trajectories of cortical brain development through the pubertal transition: Unique species and sex differences in the monkey revealed through structural magnetic resonance imaging. Cereb. Cortex 2010, 20, 1053–1063. [Google Scholar] [CrossRef]
- Franklin, M.S.; Kraemer, G.W.; Shelton, S.E.; Baker, E.; Kalin, N.H.; Uno, H. Gender differences in brain volume and size of corpus callosum and amygdala of rhesus monkey measured from MRI images. Brain Res. 2000, 852, 263–267. [Google Scholar] [CrossRef]
- Hecht, E.E.; Reilly, O.T.; Benítez, M.E.; Phillips, K.A.; Brosnan, S.F. Sex differences in the brains of capuchin monkeys (Sapajus [Cebus] apella). J. Comp. Neurol. 2021, 529, 327–339. [Google Scholar] [CrossRef]
- Lowe, R.; Shirley, N.; Bleackley, M.; Dolan, S.; Shafee, T. Transcriptomics technologies. PLoS Comput. Biol. 2017, 13, e1005457. [Google Scholar] [CrossRef]
- Yin, S.; Lu, K.; Tan, T.; Tang, J.; Wei, J.; Liu, X.; Hu, X.; Wan, H.; Huang, W.; Fan, Y.; et al. Transcriptomic and open chromatin atlas of high-resolution anatomical regions in the rhesus macaque brain. Nat. Commun. 2020, 11, 474. [Google Scholar] [CrossRef]
- DeCasien, A.R.; Chiou, K.L.; Testard, C.; Mercer, A.; Valle, J.E.N.-D.; Surratt, S.E.B.; González, O.; Stock, M.K.; Ruiz-Lambides, A.V.; Martínez, M.I.; et al. Evolutionary and biomedical implications of sex differences in the primate brain transcriptome. Cell Genom. 2024, 4, 100589. [Google Scholar] [CrossRef] [PubMed] [PubMed Central]
- Dubbelaar, M.; Misrielal, C.; Bajramovic, J.; Burm, S.; Zuiderwijk-Sick, E.; Brouwer, N.; Grit, C.; Kooistra, S.; Shinjo, S.; Marie, S.; et al. Transcriptional profiling of macaque microglia reveals an evolutionary preserved gene expression program. Brain Behav. Immun. Health 2021, 15, 100265. [Google Scholar] [CrossRef]
- Kondratov, O.; Kondratova, L.; Mandel, R.J.; Coleman, K.; Savage, M.A.; Gray-Edwards, H.L.; Ness, T.J.; Rodriguez-Lebron, E.; Bell, R.D.; Rabinowitz, J.; et al. A comprehensive study of a 29-capsid AAV library in a non-human primate central nervous system. Mol Ther. 2021, 29, 2806–2820. [Google Scholar] [CrossRef] [PubMed] [PubMed Central]
- Ewels, P.; Magnusson, M.; Lundin, S.; Käller, M. MultiQC: Summarize analysis results for multiple tools and samples in a single report. Bioinformatics 2016, 32, 3047–3048. [Google Scholar] [CrossRef] [PubMed]
- Bolger, A.M.; Lohse, M.; Usadel, B. Trimmomatic: A flexible trimmer for Illumina sequence data. Bioinformatics 2014, 30, 2114–2120. [Google Scholar] [CrossRef]
- Dobin, A.; Davis, C.A.; Schlesinger, F.; Drenkow, J.; Zaleski, C.; Jha, S.; Batut, P.; Chaisson, M.; Gingeras, T.R. STAR: Ultrafast universal RNA-seq aligner. Bioinformatics 2013, 29, 15–21. [Google Scholar] [CrossRef]
- Li, B.; Dewey, C.N. RSEM: Accurate transcript quantification from RNA-Seq data with or without a reference genome. BMC Bioinform. 2011, 12, 323. [Google Scholar] [CrossRef]
- Love, M.I.; Huber, W.; Anders, S. Moderated estimation of fold change and dispersion for RNA-seq data with DESeq2. Genome Biol. 2014, 15, 550. [Google Scholar] [CrossRef]
- Nguyen, T.A.; Lehr, A.W.; Roche, K.W. Neuroligins and Neurodevelopmental Disorders: X-Linked Genetics. Front. Synaptic Neurosci. 2020, 12, 33. [Google Scholar] [CrossRef]
- Nguyen, T.A.; Wu, K.; Pandey, S.; Lehr, A.W.; Li, Y.; Bemben, M.A.; Badger, J.D.; Lauzon, J.L.; Wang, T.; Zaghloul, K.A.; et al. A Cluster of Autism-Associated Variants on X-Linked NLGN4X Functionally Resemble NLGN4Y. Neuron 2020, 106, 759–768.e7. [Google Scholar] [CrossRef] [PubMed]
- Trabzuni, D.; Ramasamy, A.; Imran, S.; Walker, R.; Smith, C.; Weale, M.E.; Hardy, J.; Ryten, M. Widespread sex differences in gene expression and splicing in the adult human brain. Nat. Commun. 2013, 4, 2771. [Google Scholar] [CrossRef] [PubMed]
- Gahete, M.D.; Rubio, A.; Durán-Prado, M.; Avila, J.; Luque, R.M.; Castaño, J.P. Expression of Somatostatin, cortistatin, and their receptors, as well as dopamine receptors, but not of neprilysin, are reduced in the temporal lobe of Alzheimer’s disease patients. J. Alzheimers Dis. 2010, 20, 465–475. [Google Scholar] [CrossRef]
- Chen, E.Y.; Tan, C.M.; Kou, Y.; Duan, Q.; Wang, Z.; Meirelles, G.V.; Clark, N.R.; Ma’Ayan, A. Enrichr: Interactive and collaborative HTML5 gene list enrichment analysis tool. BMC Bioinform. 2013, 14, 128. [Google Scholar] [CrossRef]
- Kuleshov, M.V.; Jones, M.R.; Rouillard, A.D.; Fernandez, N.F.; Duan, Q.; Wang, Z.; Koplev, S.; Jenkins, S.L.; Jagodnik, K.M.; Lachmann, A.; et al. Enrichr: A comprehensive gene set enrichment analysis web server 2016 update. Nucleic Acids Res. 2016, 44, W90–W97. [Google Scholar] [CrossRef] [PubMed]
- Supek, F.; Bosnjak, M.; Skunca, N.; Smuc, T. REVIGO summarizes and visualizes long lists of gene ontology terms. PLoS ONE 2011, 6, e21800. [Google Scholar] [CrossRef]
- Xie, Z.; Bailey, A.; Kuleshov, M.V.; Clarke, D.J.B.; Evangelista, J.E.; Jenkins, S.L.; Lachmann, A.; Wojciechowicz, M.L.; Kropiwnicki, E.; Jagodnik, K.M.; et al. Gene Set Knowledge Discovery with Enrichr. Curr. Protoc. 2021, 1, e90. [Google Scholar] [CrossRef]
- Chaudhuri, J.; Si, K.; Maitra, U. Function of eukaryotic translation initiation factor 1A (eIF1A) (formerly called eIF-4C) in initiation of protein synthesis. J. Biol. Chem. 1997, 272, 7883–7891. [Google Scholar] [CrossRef]
- Godfrey, A.K.; Naqvi, S.; Chmátal, L.; Chick, J.M.; Mitchell, R.N.; Gygi, S.P.; Skaletsky, H.; Page, D.C. Quantitative analysis of Y-Chromosome gene expression across 36 human tissues. Genome Res. 2020, 30, 860–873. [Google Scholar] [CrossRef]
- Wang, J.; Lan, Y.; He, L.; Tang, R.; Li, Y.; Huang, Y.; Liang, S.; Gao, Z.; Price, M.; Yue, B.; et al. Sex-specific gene expression in the blood of four primates. Genomics 2021, 113, 2605–2613. [Google Scholar] [CrossRef]
- Duan, M.-J.; Yan, M.-L.; Wang, Q.; Mao, M.; Su, D.; Sun, L.-L.; Li, K.-X.; Qu, Y.; Sun, Q.; Zhang, X.-Y.; et al. Overexpression of miR-1 in the heart attenuates hippocampal synaptic vesicle exocytosis by the posttranscriptional regulation of SNAP-25 through the transportation of exosomes. Cell Commun. Signal 2018, 16, 91. [Google Scholar] [CrossRef]
- Lopes, A.M.; Miguel, R.N.; Sargent, C.A.; Ellis, P.J.; Amorim, A.; Affara, N.A. The human RPS4 paralogue on Yq11.223 encodes a structurally conserved ribosomal protein and is preferentially expressed during spermatogenesis. BMC Mol. Biol. 2010, 11, 33. [Google Scholar] [CrossRef]
- Klein, S.L.; Flanagan, K.L. Sex differences in immune responses. Nat. Rev. Immunol. 2016, 16, 626–638. [Google Scholar] [CrossRef] [PubMed]
- Englmeier, L.; Subburayalu, J. What’s happening where when SARS-CoV-2 infects: Are TLR7 and MAFB sufficient to explain patient vulnerability? Immun. Ageing 2022, 19, 6. [Google Scholar] [CrossRef] [PubMed]
- Vega, M.A.; Simón-Fuentes, M.; de la Aleja, A.G.; Nieto, C.; Colmenares, M.; Herrero, C.; Domínguez-Soto, Á.; Corbí, Á.L. MAFB and MAF Transcription Factors as Macrophage Checkpoints for COVID-19 Severity. Front. Immunol. 2020, 11, 603507. [Google Scholar] [CrossRef] [PubMed]
- Gao, Y.-D.; Ding, M.; Dong, X.; Zhang, J.-J.; Azkur, A.K.; Azkur, D.; Gan, H.; Sun, Y.-L.; Fu, W.; Li, W.; et al. Risk factors for severe and critically ill COVID-19 patients: A review. Allergy 2020, 76, 428–455. [Google Scholar] [CrossRef]
- Grasselli, G.; Greco, M.; Zanella, A.; Albano, G.; Antonelli, M.; Bellani, G.; Bonanomi, E.; Cabrini, L.; Carlesso, E.; Castelli, G.; et al. Risk Factors Associated With Mortality Among Patients With COVID-19 in Intensive Care Units in Lombardy, Italy. JAMA Intern. Med. 2020, 180, 1345–1355. [Google Scholar] [CrossRef]
- Hunter, P. Viral diseases and the brain: Long COVID puts the spotlight on how viral infections affect the brain: Long COVID puts the spotlight on how viral infections affect the brain. EMBO Rep. 2022, 23, e54342. [Google Scholar] [CrossRef]
- Thompson, R.R.; George, K.; Walton, J.C.; Orr, S.P.; Benson, J. Sex-specific influences of vasopressin on human social communication. Proc. Natl. Acad. Sci. USA 2006, 103, 7889–7894. [Google Scholar] [CrossRef]
- Rigney, N.; Whylings, J.; Mieda, M.; de Vries, G.J.; Petrulis, A. Sexually Dimorphic Vasopressin Cells Modulate Social Investigation and Communication in Sex-Specific Ways. eNeuro 2019, 6, ENEURO.0415-18.2019. [Google Scholar] [CrossRef] [PubMed] [PubMed Central]
- Terranova, J.I.; Ferris, C.F.; Albers, H.E. Sex Differences in the Regulation of Offensive Aggression and Dominance by Arginine-Vasopressin. Front. Endocrinol. 2017, 8, 308. [Google Scholar] [CrossRef] [PubMed]
- Aspesi, D.; Choleris, E. Neuroendocrine underpinning of social recognition in males and females. J. Neuroendocrinol. 2022, 34, e13070. [Google Scholar] [CrossRef] [PubMed]

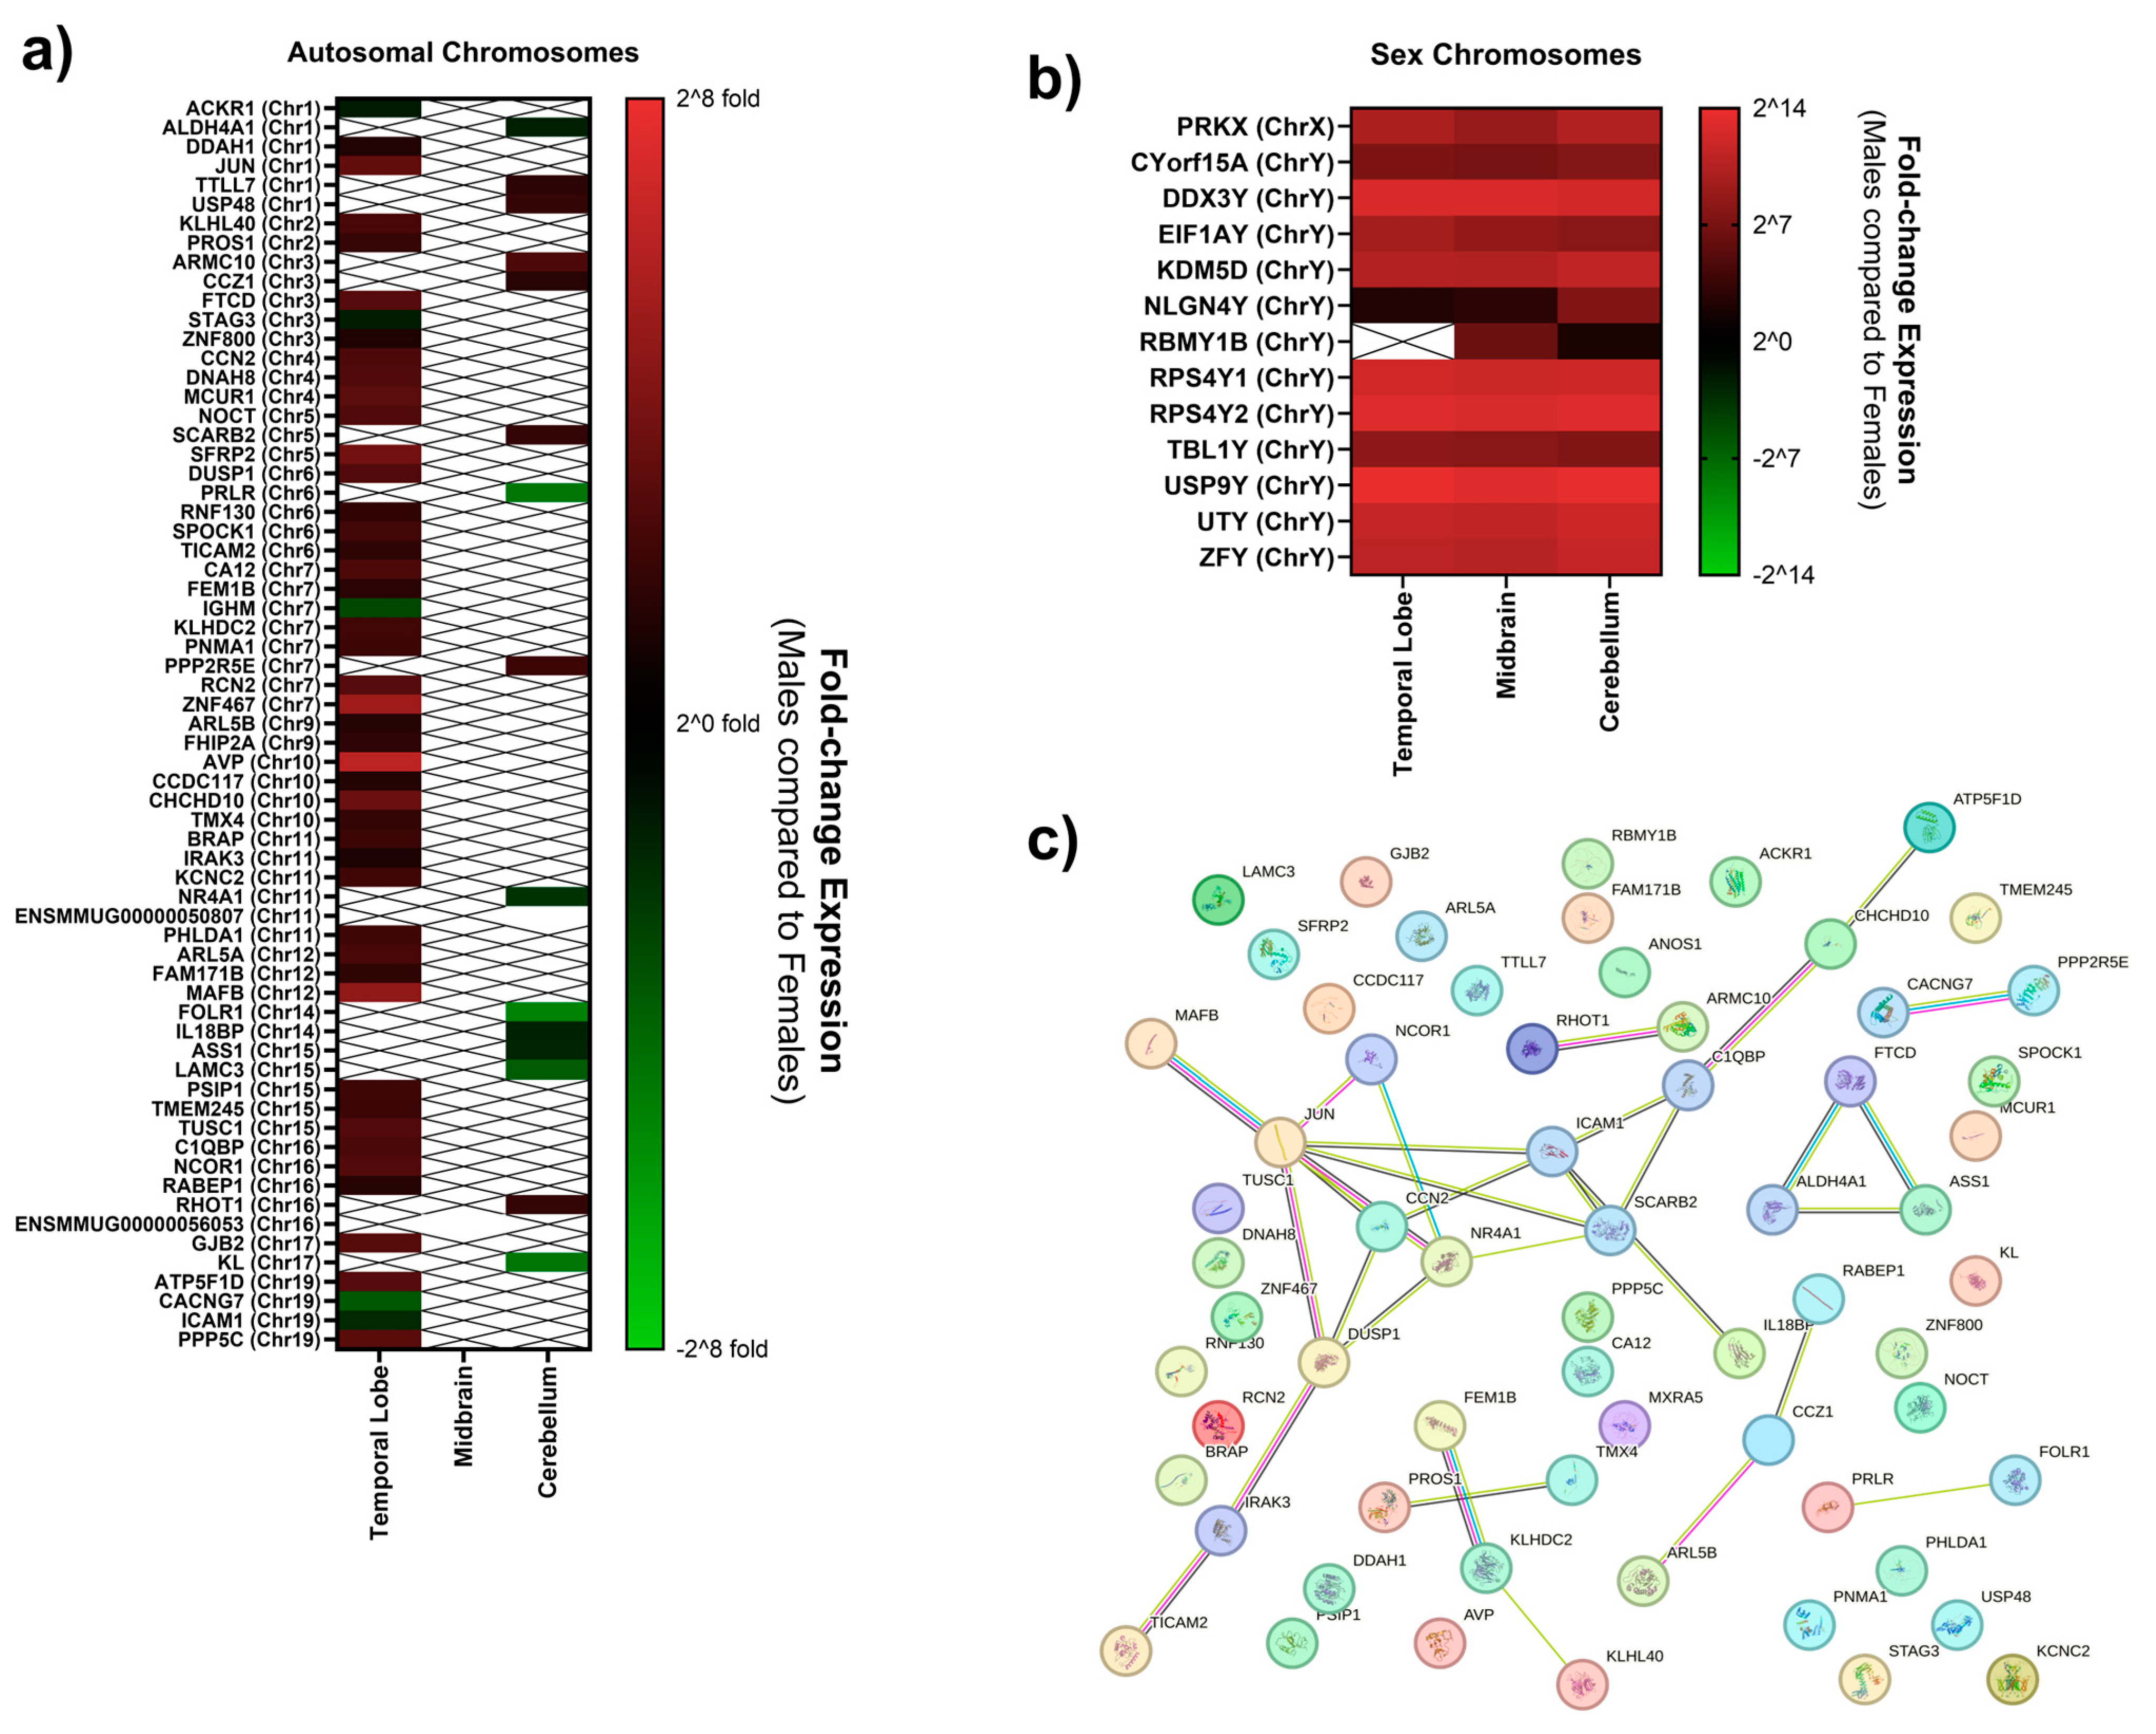
| Gene Symbol | Gene Name | Chromosome Location | Log2 (FC) | −Log (p-Value) |
|---|---|---|---|---|
| USP9Y | ubiquitin-specific peptidase 9, Y-linked | Y | 13.71905899 | 6.50266 × 1025 |
| RPS4Y2 | Ribosomal Protein S4, Y-linked 2 | Y | 13.10653319 | 9.8653 × 10²³ |
| DDX3Y | DEAD-box helicase 3 Y-linked | Y | 12.64835585 | 4.51949 × 10²¹ |
| RPS4Y1 | Ribosomal Protein S4 Y-linked | Y | 12.11459869 | 2.51384 × 10¹⁹ |
| UTY | Ubiquitously transcribed tetratricopeptide repeat containing, Y-linked | Y | 11.3635802 | 7.46989 × 10¹⁷ |
| ZFY | Zinc Finger Protein Y-linked | Y | 10.92233302 | 1.05005 × 10¹⁴ |
| KDM5D | lysine demethylase 5D | Y | 10.46017162 | 8.09787 × 10¹⁴ |
| PRKX | cAMP-dependent protein kinase catalytic subunit PRKX | X | 10.02681145 | 3.47977 × 10¹² |
| EIF1AY | Eukaryotic Initiation Factor 1AY | Y | 9.560043266 | 4.51949 × 10²¹ |
| TBL1Y | transducin beta-like 1 Y-linked | Y | 8.251471122 | 3.63009 × 10⁷ |
| CYorf15A | Chromosome Y Open Reading Frame 15A | Y | 7.266208729 | 0.00042528 |
| AVP | Vasopressin-neurophysin 2-copeptin | 10 | 6.303191895 | 0.029333155 |
| ZNF467 | Zinc Finger Protein 467 | 7 | 5.246107131 | 0.015446581 |
| MAFB | MAF bZIP transcription factor B | 12 | 4.754125701 | 0.00011165 |
| SFRP2 | Secreted frizzled-related protein 2 | 5 | 3.834735022 | 0.004961535 |
| CHCHD10 | Coiled-coil-helix-coiled-coil-helix domain-containing protein 10, mitochondrial | 10 | 3.536977542 | 0.003289907 |
| JUN | Transcription factor AP-1 | 1 | 3.297279849 | 0.001233038 |
| MCUR1 | mitochondrial calcium uniporter regulator 1 | 4 | 3.062017972 | 0.011472793 |
| PPP5C | Serine/threonine-protein phosphatase 5 | 19 | 3.025384368 | 4.55417 × 10⁵ |
| GJB2 | Gap junction beta-2 protein | 17 | 2.959247277 | 2.38261 × 10⁵ |
| RCN2 | reticulocalbin 2 | 7 | 2.917966017 | 0.028275537 |
| FTCD | formimidoyltransferase cyclodeaminase | 3 | 2.909467024 | 0.048848313 |
| ATP5F1D | ATP synthase subunit delta, mitochondrial | 19 | 2.908590716 | 0.037687724 |
| DUSP1 | Dual specificity protein phosphatase 1 | 6 | 2.844496222 | 0.002164976 |
| NCOR1 | Nuclear receptor corepressor 1 | 16 | 2.819544283 | 0.003434749 |
| TUSC1 | tumor suppressor candidate 1 | 15 | 2.805361398 | 0.02291493 |
| ANOS1 | Anosmin 1 | X | 2.757610957 | 0.013726134 |
| DNAH8 | Dynein axonemal heavy chain 8 | 4 | 2.742246473 | 9.42881 × 10⁵ |
| NOCT | Nocturnin | 5 | 2.733568645 | 0.005494721 |
| CCN2 | cellular communication network factor 2 | 4 | 2.652254082 | 0.010661883 |
| CA12 | Carbonic anhydrase 12 | 7 | 2.64452723 | 0.008978305 |
| C1QBP | Complement C1Q Binding Protein | 16 | 2.499674658 | 0.018091751 |
| KLHL40 | Kelch-like protein 40 | 2 | 2.490703418 | 0.032617475 |
| ARL5A | ADP-ribosylation factor-like protein 5A | 12 | 2.481455264 | 0.010661883 |
| NLGN4Y | Neuroligin-4, Y-linked | Y | 2.303917734 | 3.43641 × 10⁹ |
| SPOCK1 | SPARC (osteonectin), cwcv- and kazal-like domains proteoglycan 1 | 6 | 2.296600371 | 0.037687724 |
| KCNC2 | Potassium voltage-gated channel subfamily C member 2 | 11 | 2.25107452 | 0.048848313 |
| KLHDC2 | Kelch domain-containing protein 2 | 7 | 2.231606579 | 0.002213669 |
| PSIP1 | PC4 and SFRS1 interacting protein 1 | 15 | 2.183075899 | 0.042711587 |
| PHLDA1 | Pleckstrin homology-like domain family A | 11 | 2.151384308 | 0.029512147 |
| PNMA1 | Paraneoplastic antigen Ma1 | 7 | 2.145699785 | 0.017094243 |
| TMEM245 | Transmembrane protein 245 | 15 | 2.07936194 | 0.001884686 |
| BRAP | BRCA1-associated protein | 11 | 2.038348427 | 0.040753462 |
| PROS1 | Protein S | 2 | 1.923748541 | 0.017094243 |
| TMX4 | Thioredoxin-related transmembrane protein 4 | 10 | 1.822929354 | 0.003130618 |
| RNF130 | E3 ubiquitin-protein ligase RNF130 | 6 | 1.724726953 | 0.042631739 |
| TICAM2 | TIR domain-containing adapter molecule 2 | 6 | 1.687826371 | 0.015446581 |
| FAM171B | Protein FAM171B | 12 | 1.684187452 | 0.015203882 |
| FHIP2A | FHF complex subunit HOOK interacting protein 2A | 9 | 1.655411608 | 0.047315236 |
| FEM1B | fem-1 homolog B | 7 | 1.563853061 | 0.049277464 |
| RABEP1 | rabaptin, RAB GTPase binding effector protein 1 | 16 | 1.469789211 | 0.02291493 |
| ARL5B | ADP ribosylation factor like GTPase 5B | 9 | 1.442835309 | 0.048848313 |
| CCDC117 | Coiled-coil domain-containing protein 117 | 10 | 1.395598027 | 0.015488608 |
| DDAH1 | N(G),N(G)-dimethylarginine dimethylaminohydrolase 1 | 1 | 1.304359376 | 0.013726134 |
| ZNF800 | Zinc Finger Protein 800 | 3 | 1.264760526 | 0.010661883 |
| IRAK3 | Interleukin 1 Receptor-Associated Kinase 3 | 11 | 1.137212821 | 0.015446581 |
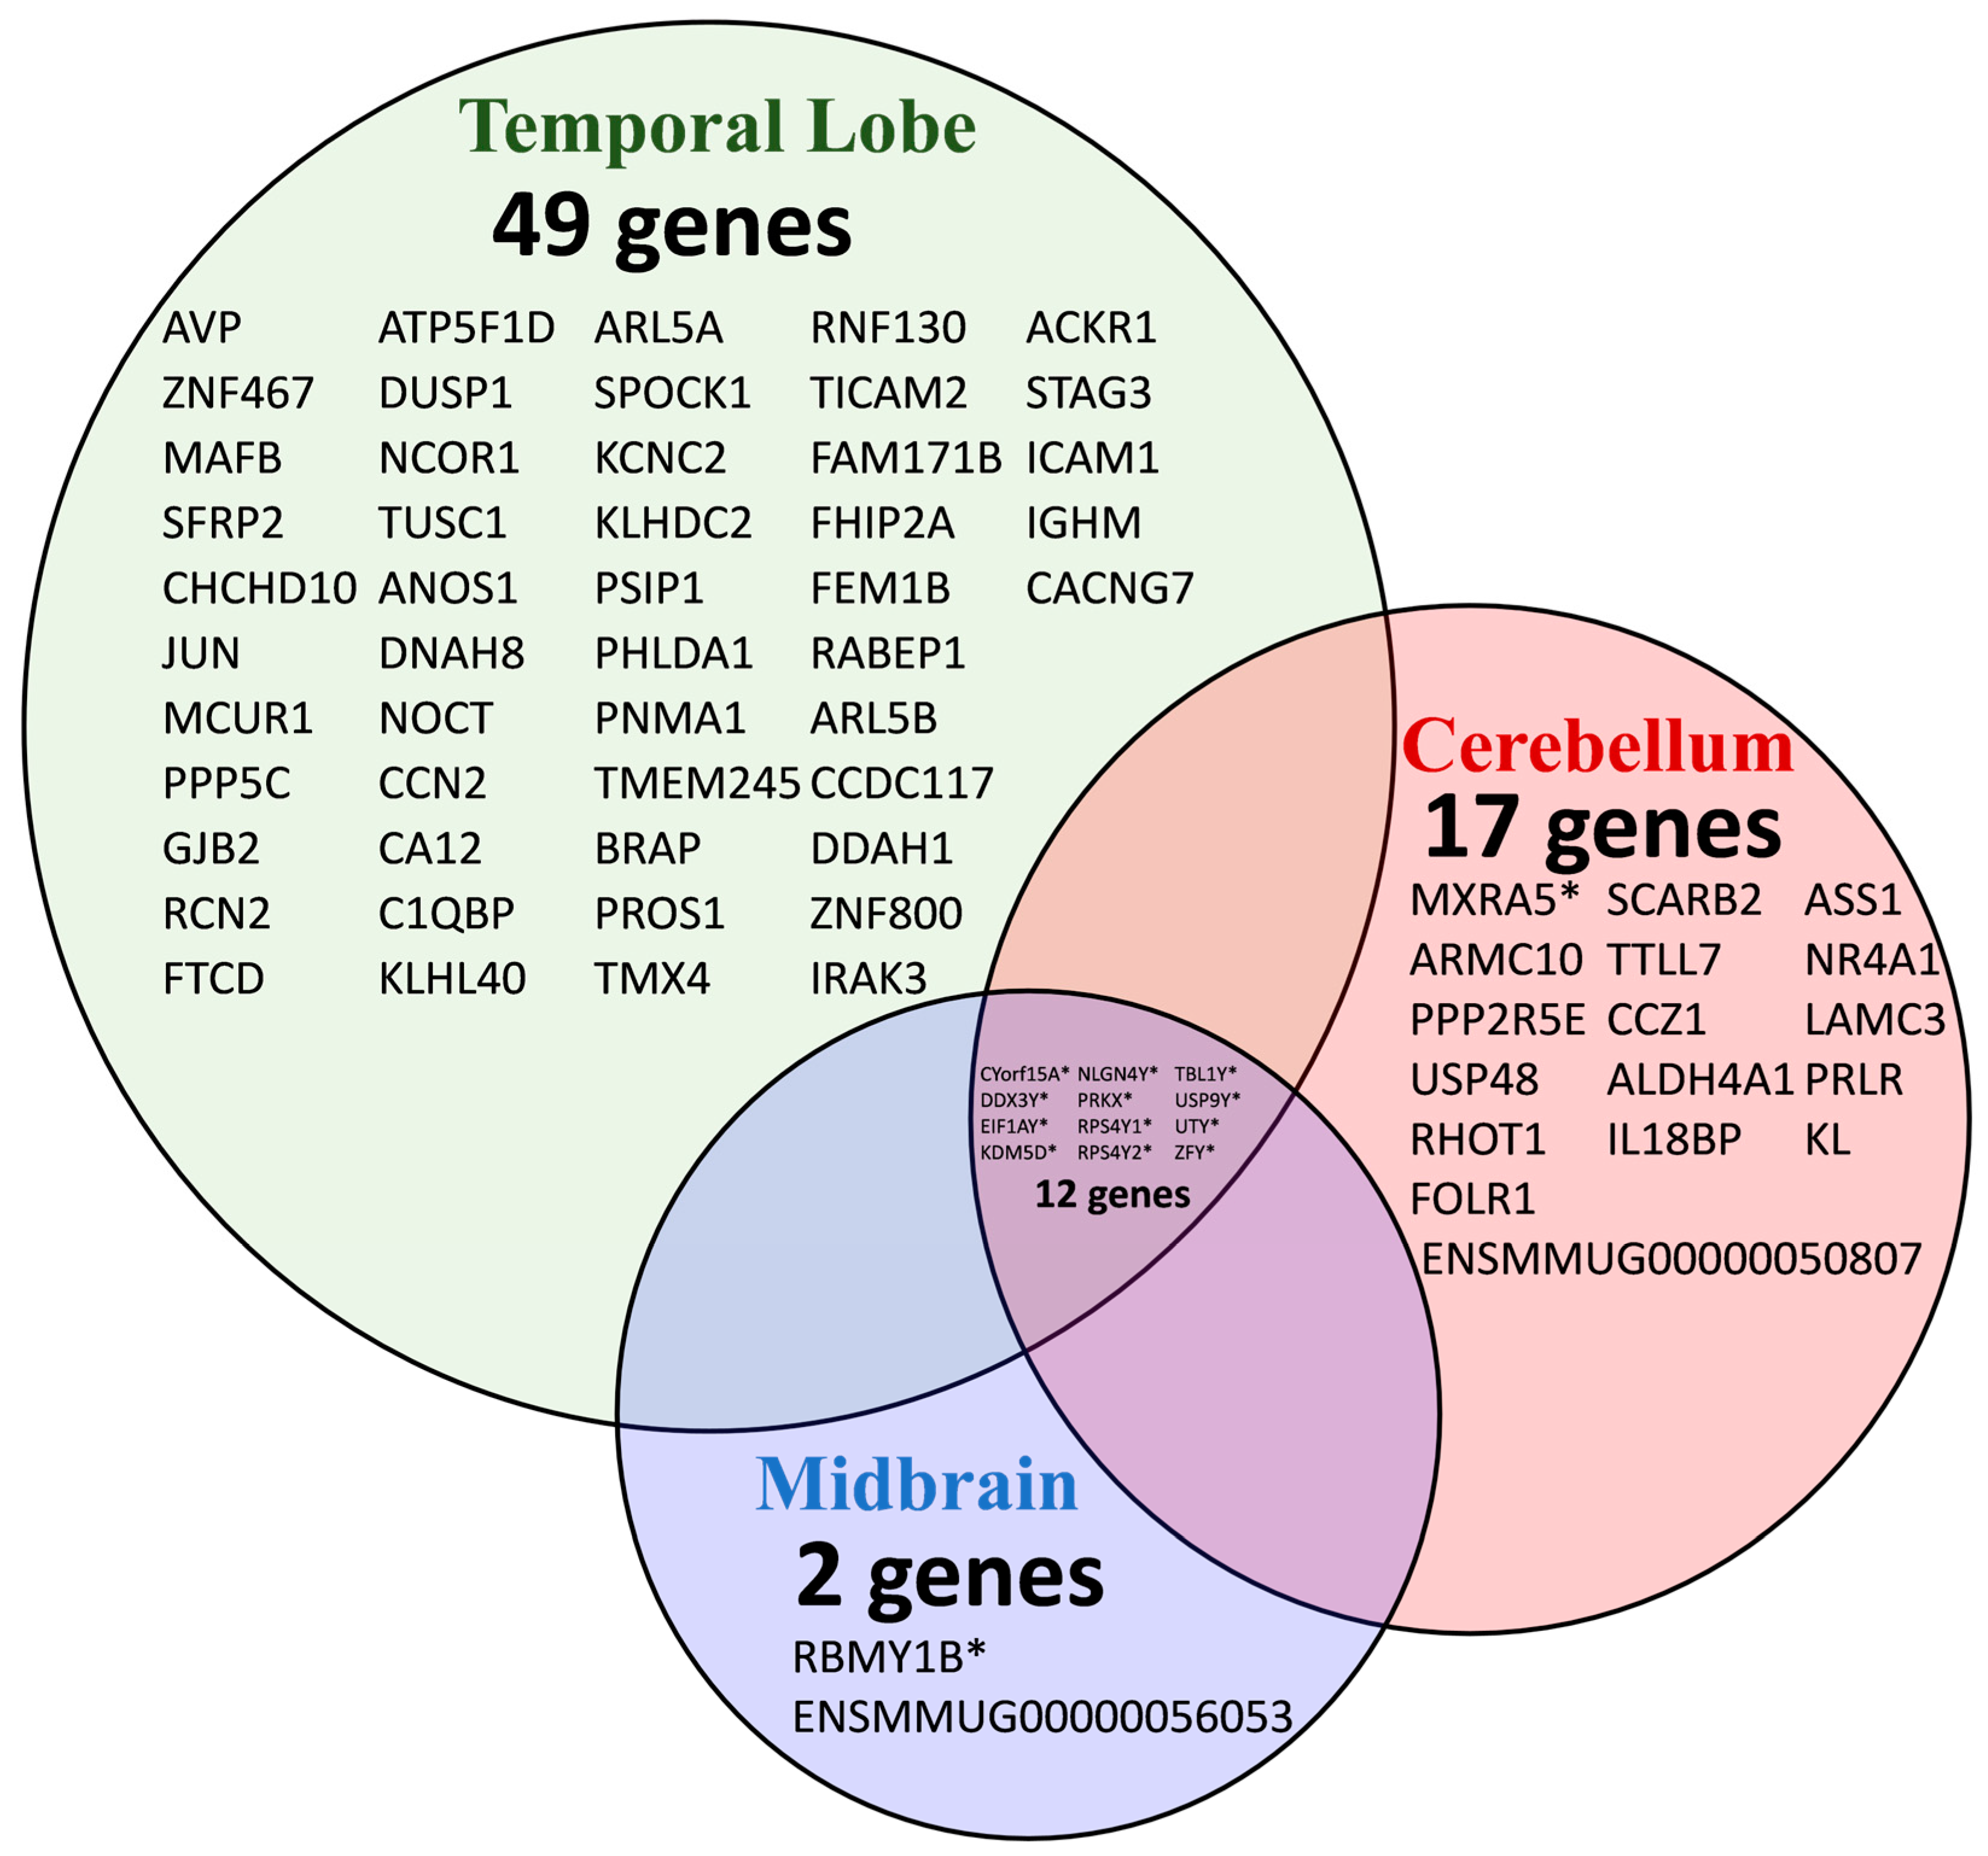
| ACKR1 | Atypical Chemokine Receptor 1 | 1 | −1.285715044 | 0.042631739 |
| STAG3 | STAG3 cohesin complex component | 3 | −1.33655274 | 0.047315236 |
| ICAM1 | Intercellular Adhesion Molecule 1 | 19 | −1.765898547 | 0.028275537 |
| IGHM | Immunoglobulin heavy constant mu | 7 | −2.870128518 | 0.007092621 |
| CACNG7 | calcium voltage-gated channel auxiliary subunit gamma 7 | 19 | −3.423844655 | 0.019990396 |
| Gene Symbol | Gene Name | Chromosome Location | Log2 (FC) | −Log (p-Value) |
|---|---|---|---|---|
| USP9Y | ubiquitin-specific peptidase 9 Y-linked | Y | 13.10632061 | 7.79953 × 10²³ |
| DDX3Y | ubiquitin-specific peptidase 9 Y-linked | Y | 12.64865658 | 3.39235 × 10²¹ |
| RPS4Y2 | Ribosomal Protein S4, Y-linked 2 | Y | 12.61650867 | 1.31892 × 10²⁰ |
| RPS4Y1 | Ribosomal Protein S4, Y-linked 1 | Y | 11.86763536 | 1.58552 × 10¹⁷ |
| UTY | Ubiquitously transcribed tetratricopeptide repeat containing, Y-linked | Y | 11.26290341 | 2.01041 × 10¹⁶ |
| ZFY | Zinc Finger Protein Y-linked | Y | 10.64300771 | 1.04026 × 10¹⁴ |
| KDM5D | lysine demethlyase 5D | Y | 10.40639548 | 9.19827 × 10¹⁴ |
| PRKX | cAMP-dependent protein kinase catalytic subunit PRKX | X | 8.806541644 | 1.18975 × 10⁸ |
| EIF1AY | Eukaryotic Initiation Factor 1A Y-linked | Y | 8.580239692 | 6.16063 × 1029 |
| TBL1Y | transducin beta-like 1 Y-linked | Y | 7.939914094 | 2.44015 × 10⁶ |
| CYorf15A | Chromosome Y Open Reading Frame 15A | Y | 6.946916081 | 0.000634637 |
| RBMY1B | RNA-binding motif protein, Y chromosome, family 1 member B-like | Y | 6.253240916 | 0.015123427 |
| NLGN4Y | Neuroligin-4, Y-linked | Y | 2.818620993 | 1.58552 × 10¹⁷ |
| ENSMMUG00000056053 | Unknown | 16 | −8.061325309 | 0.00587965 |
| Gene Symbol | Gene Name | Chromosome Location | Log2 (FC) | −Log (p-Value) |
|---|---|---|---|---|
| USP9Y | ubiquitin-specific peptidase 9 Y-linked | Y | 13.53358026 | 1.69166 × 1024 |
| RPS4Y2 | Ribosomal Protein S4, Y-linked 2 | Y | 13.05561903 | 4.36744 × 10²² |
| DDX3Y | ubiquitin-specific peptidase 9 Y-linked | Y | 12.24246642 | 2.65269 × 10²¹ |
| RPS4Y1 | Ribosomal Protein S4, Y-linked 1 | Y | 11.98614904 | 6.36374 × 10¹⁸ |
| UTY | Ubiquitously transcribed tetratricopeptide repeat containing, Y-linked | Y | 11.90810859 | 1.99374 × 10¹⁸ |
| ZFY | Zinc Finger Protein Y-linked | Y | 11.53537061 | 1.54245 × 10¹⁷ |
| KDM5D | lysine demethlyase 5D | Y | 11.21577309 | 3.18329 × 10¹⁶ |
| PRKX | cAMP-dependent protein kinase catalytic subunit PRKX | X | 10.42609013 | 8.28047 × 10¹³ |
| EIF1AY | Eukaryotic Initiation Factor 1A Y-linked | Y | 7.937725996 | 2.13809 × 1032 |
| CYorf15A | Chromosome Y Open Reading Frame 15A | Y | 7.648642346 | 3.52159 × 10⁵ |
| MXRA5 | Matrix Remodeling-Associated Protein 5 | Y | 7.535908795 | 1.73413 × 10⁷ |
| TBL1Y | transducin beta-like 1 Y-linked | Y | 7.463601541 | 1.86266 × 10⁵ |
| ARMC10 | armadillo repeat containing 10 | 3 | 2.622782332 | 0.015667643 |
| PPP2R5E | protein phosphatase 2 regulatory subunit B’epsilon | 7 | 2.132210121 | 0.04670821 |
| NLGN4Y | neuroligin 4, Y-linked | Y | 1.951104573 | 5.15756 × 10⁸ |
| USP48 | ubiquitin-specific peptidase 48 | 1 | 1.889296185 | 0.027143557 |
| RHOT1 | ras homolog family member | 16 | 1.85772343 | 0.035628187 |
| SCARB2 | scavenger receptor class B member 2 | 5 | 1.798621645 | 0.021182753 |
| TTLL7 | tubulin tyrosine ligase like | 1 | 1.614680379 | 0.028528043 |
| CCZ1 | Vacuolar Protein Trafficking and Biogenesis Associated | 3 | 1.508827318 | 0.020455655 |
| ALDH4A1 | Aldehyde Dehydrogenase 4 family member A1 | 1 | −1.438885962 | 0.03303172 |
| IL18BP | interleukin 18 binding protein | 14 | −1.507517697 | 0.014251736 |
| ASS1 | Argininosuccinate synthase | 15 | −1.629165355 | 0.034521802 |
| NR4A1 | Nuclear receptor subfamily 4 group A member 1 | 11 | −2.100052055 | 0.00555242 |
| LAMC3 | Laminin Subunit Gamma 3 | 15 | −3.588868028 | 2.58109 × 10⁸ |
| PRLR | prolactin receptor | 6 | −4.548855035 | 0.03946567 |
| KL | Klotho | 17 | −4.572208799 | 0.00555242 |
| FOLR1 | Folate receptor alpha | 14 | −4.999557377 | 0.009471893 |
| ENSMMUG00000050807 | Unknown | 11 | −22.10508155 | 0.000187717 |
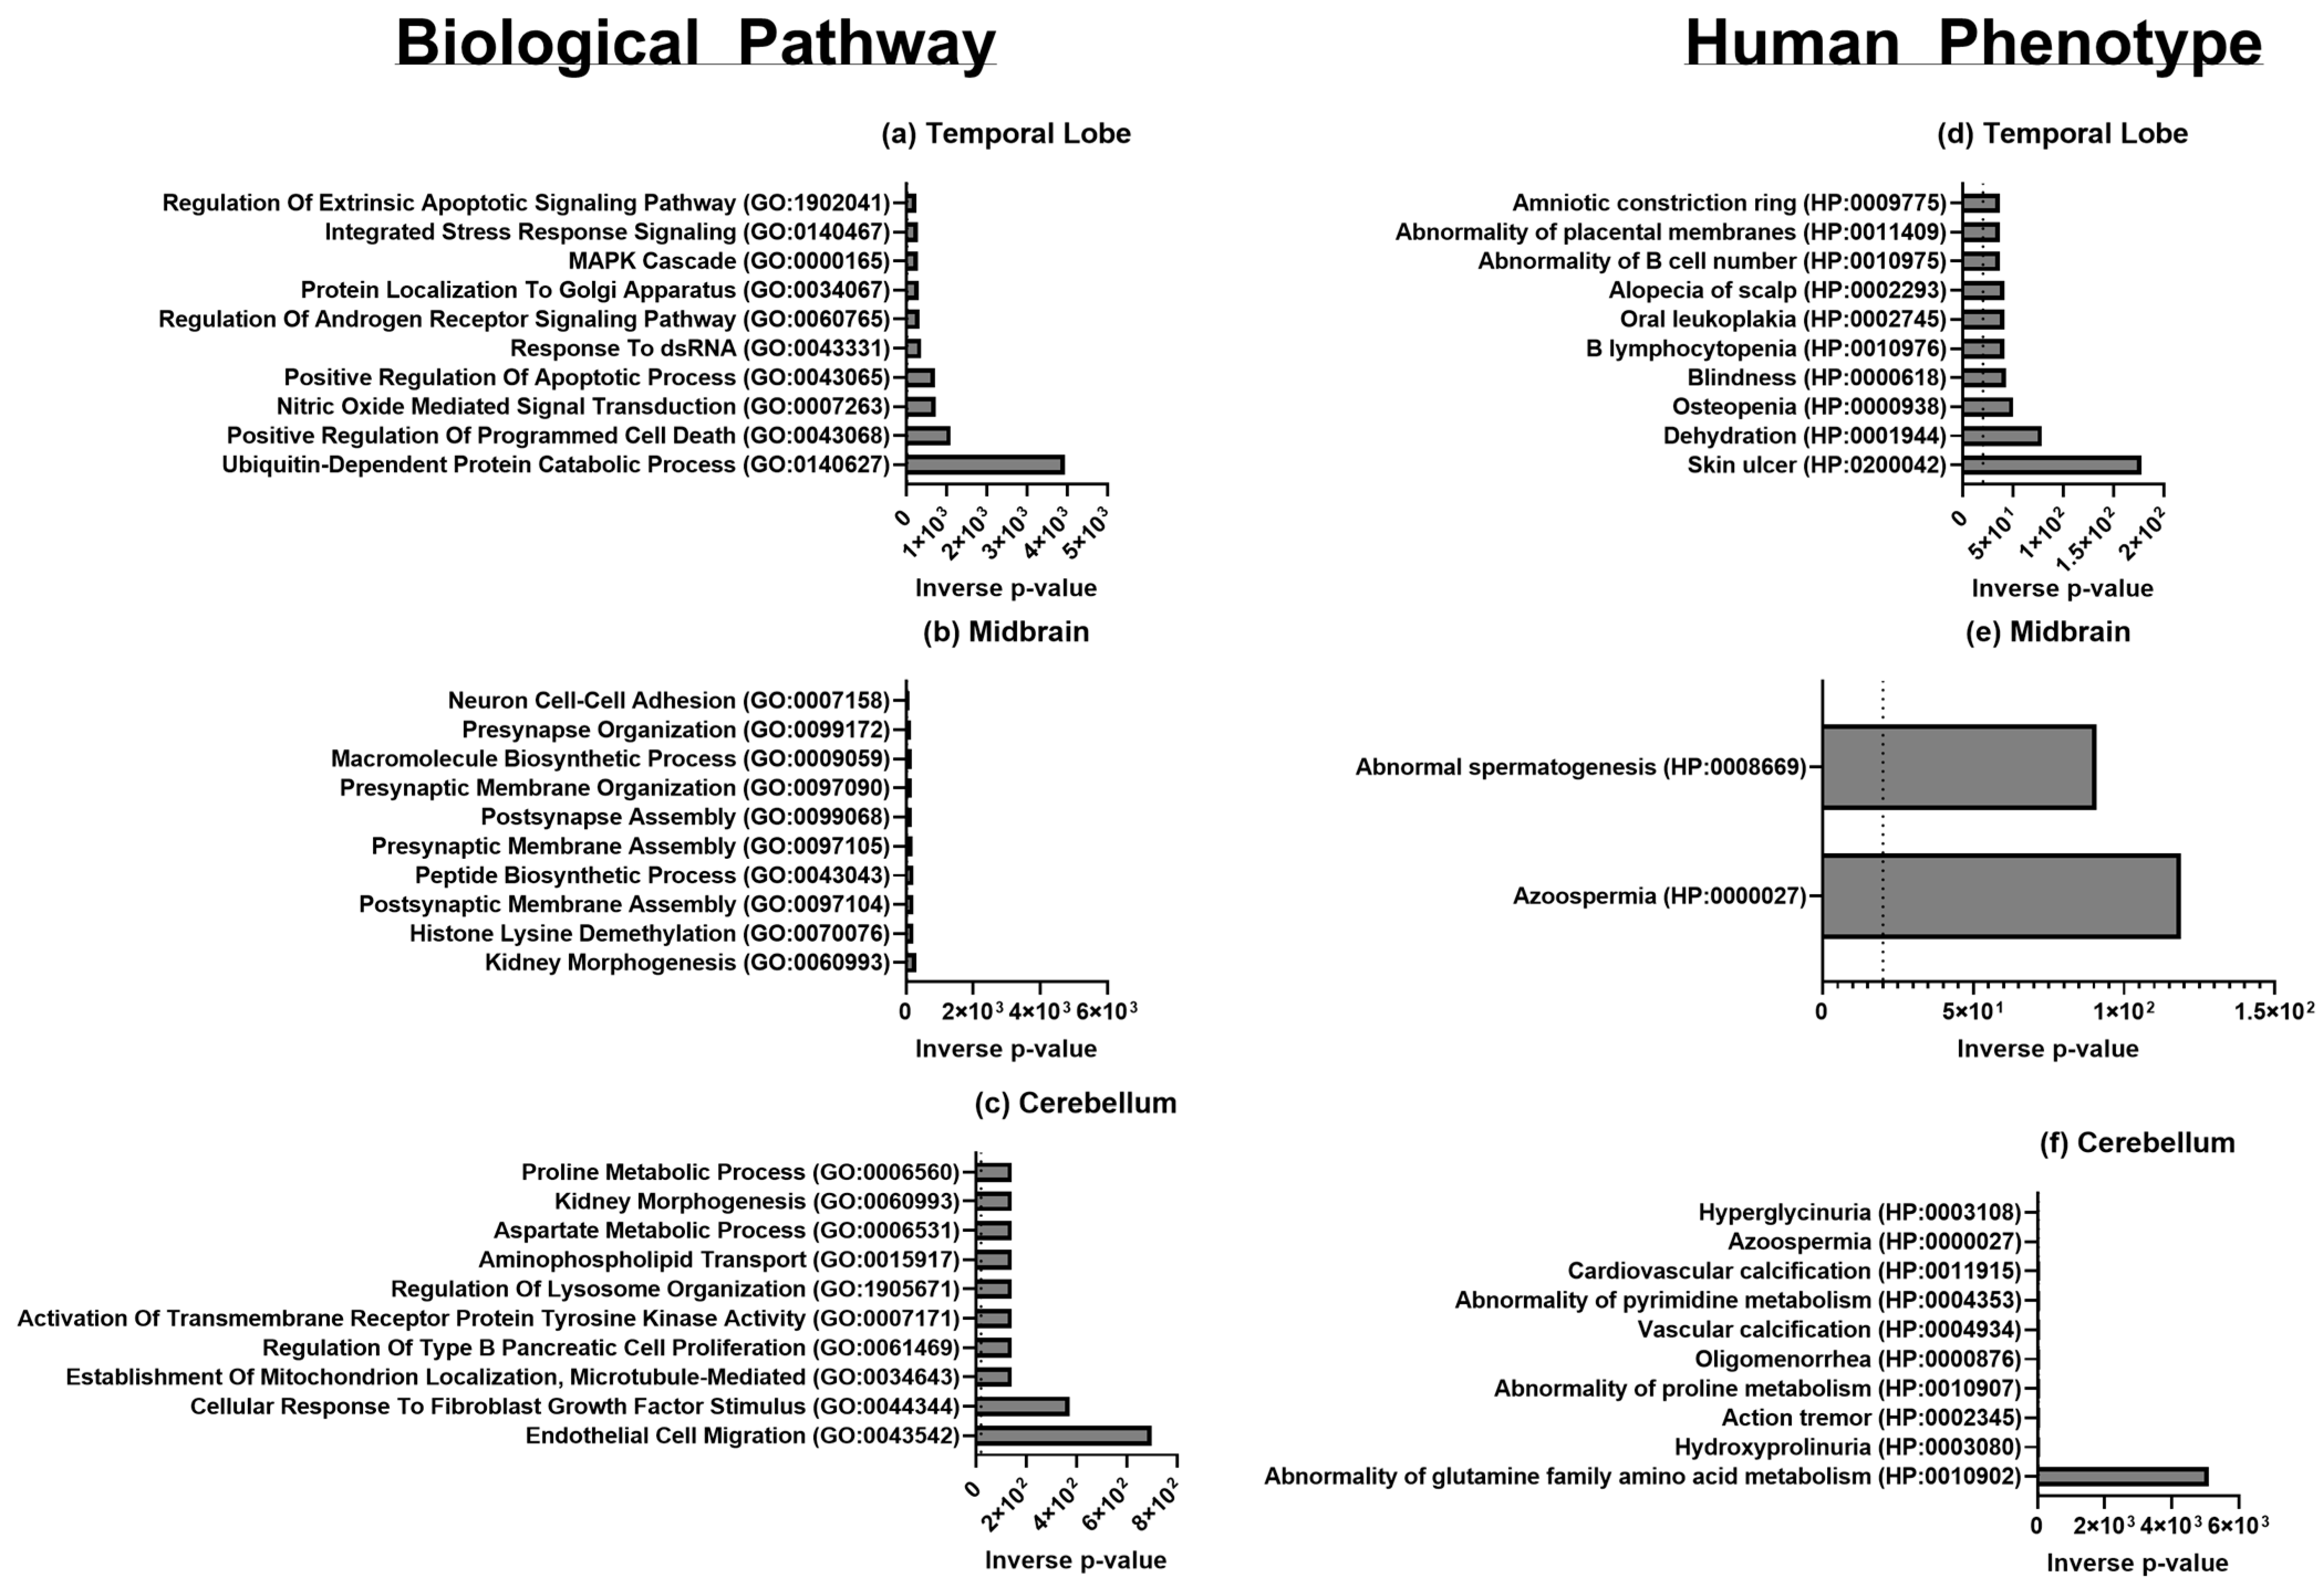
| Brain Region | GO Term and ID | Upregulated/Downregulated | Associated Process |
|---|---|---|---|
| Temporal Lobe, Cerebellum, Midbrain | translation (GO: 0006412) | Upregulated | Translation |
| Temporal Lobe, Midbrain | peptide biosynthetic process (GO: 0043043) | Upregulated | Translation |
| Temporal Lobe | SRP-dependent co-translational protein targeting to the membrane (GO: 0006614) | Upregulated | Translation |
| Temporal Lobe | large ribosomal subunit (GO: 0015934) | Upregulated | Translation |
| Temporal Lobe, Cerebellum, Midbrain | small ribosomal subunit (GO: 0015935) | Upregulated | Translation |
| Temporal Lobe, Midbrain | RNA binding (GO: 0003723) | Upregulated | Transcription |
| Temporal Lobe | histone lysine demethylation (GO: 0070076) | Upregulated | Transcription |
| Temporal Lobe | histone H3-K27 demethylation (GO: 0071557) | Upregulated | Transcription |
| Temporal Lobe | gene expression (GO: 0010467) | Upregulated | Transcription |
| Temporal Lobe | phosphatase activity (GO: 0016791) | Upregulated | Post-translational Modifications |
| Temporal Lobe | peptidyl-serine dephosphorylation (GO: 0070262) | Upregulated | Post-translational Modifications |
| Temporal Lobe | peptidyl-threonine dephosphorylation (GO: 0035970) | Upregulated | Post-translational Modifications |
| Temporal Lobe | CAMP-dependent protein kinase activity (GO: 0004691) | Upregulated | Post-translational Modifications |
| Temporal Lobe | ubiquitin protein ligase activity (GO: 0061630) | Upregulated | Post-translational Modifications |
| Temporal Lobe | regulation of complement activation (GO: 0030449) | Upregulated | Immunity |
| Temporal Lobe | regulation of immune effector process (GO: 0002697) | Upregulated | Immunity |
| Temporal Lobe | positive regulation of leukocyte chemotaxis (GO: 0002690) | Upregulated | Immunity |
| Temporal Lobe | regulation of humoral immune response (GO: 0002920) | Upregulated | Immunity |
| Temporal Lobe | regulation of androgen receptor signaling pathway (GO: 0060765) | Upregulated | Brain Development and Behavior |
| Temporal Lobe | dopamine neurotransmitter receptor activity (GO: 0004952) | Upregulated | Brain Development and Behavior |
| Temporal Lobe | asymmetric synapse (GO: 0032279) | Upregulated | Synaptic Cellular Components |
| Temporal Lobe | asymmetric glutamatergic, excitatory synapse (GO: 0098985) | Upregulated | Synaptic Cellular Components |
| Temporal Lobe | symmetric synapse (GO: 0032280) | Upregulated | Synaptic Cellular Components |
| Temporal Lobe | inhibitory synapse (GO: 0060077) | Upregulated | Synaptic Cellular Components |
| Cerebellum, Midbrain | cytosolic small ribosomal subunit (GO: 0022627) | Upregulated | Translation |
| Cerebellum | histone demethylase activity (GO: 0032452) | Upregulated | Translation |
| Cerebellum | debiquitinase activity (GO: 0101005) | Upregulated | Translation |
| Cerebellum | cellular response to fibroblast growth factor stimulus (GO: 0044344) | Downregulated | Growth Factors and Receptor Binding |
| Cerebellum | glucocorticoid receptor binding (GO: 0035259) | Downregulated | Growth Factors and Receptor Binding |
| Cerebellum | fibroblast growth factor binding (GO: 0017134) | Downregulated | Growth Factors and Receptor Binding |
| Cerebellum | growth factor receptor binding (GO: 0070851) | Downregulated | Growth Factors and Receptor Binding |
| Cerebellum | nuclear receptor binding (GO: 0016922) | Downregulated | Growth Factors and Receptor Binding |
| Midbrain | aspartate metabolic process (GO: 0006531) | Downregulated | Citric Acid and Urea Cycle |
| Midbrain | tricarboxylic acid metabolic process (GO: 0072350) | Downregulated | Citric Acid and Urea Cycle |
| Midbrain | arginine metabolic process (GO: 0006525) | Downregulated | Citric Acid and Urea Cycle |
| Midbrain | citrulline metabolic process (GO: 0000052) | Downregulated | Citric Acid and Urea Cycle |
| Midbrain | urea cycle (GO: 0000050) | Downregulated | Citric Acid and Urea Cycle |
| Midbrain | kidney morphogenesis (GO: 0060993) | Upregulated | Development and Cell Proliferation |
| Midbrain | determination of pancreatic left/right asymmetry (GO: 0035469) | Upregulated | Development and Cell Proliferation |
| Midbrain | determination of liver left/right asymmetry (GO: 0071910) | Upregulated | Development and Cell Proliferation |
| Midbrain | determination of digestive tract left/right symmetry (GO: 0071907) | Upregulated | Development and Cell Proliferation |
| Midbrain | ureter development (GO: 0072189) | Upregulated | Development and Cell Proliferation |
| Midbrain | cardiac atrium development (GO: 0003230) | Upregulated | Development and Cell Proliferation |
| Midbrain | nuclear androgen receptor binding (GO: 0050681) | Upregulated | Development and Cell Proliferation |
| Midbrain | regulation of Wnt, planar cell polarity pathway (GO: 2000095) | Upregulated | Development and Cell Proliferation |
Disclaimer/Publisher’s Note: The statements, opinions and data contained in all publications are solely those of the individual author(s) and contributor(s) and not of MDPI and/or the editor(s). MDPI and/or the editor(s) disclaim responsibility for any injury to people or property resulting from any ideas, methods, instructions or products referred to in the content. |
© 2025 by the authors. Licensee MDPI, Basel, Switzerland. This article is an open access article distributed under the terms and conditions of the Creative Commons Attribution (CC BY) license (https://creativecommons.org/licenses/by/4.0/).
Share and Cite
Kabbej, N.; Ashby, F.J.; Riva, A.; Gamlin, P.D.; Mandel, R.J.; Kunta, A.; Rouse, C.J.; Heldermon, C.D. Sex Differences in Brain Transcriptomes of Juvenile Cynomolgus Macaques. Biomolecules 2025, 15, 671. https://doi.org/10.3390/biom15050671
Kabbej N, Ashby FJ, Riva A, Gamlin PD, Mandel RJ, Kunta A, Rouse CJ, Heldermon CD. Sex Differences in Brain Transcriptomes of Juvenile Cynomolgus Macaques. Biomolecules. 2025; 15(5):671. https://doi.org/10.3390/biom15050671
Chicago/Turabian StyleKabbej, Nadia, Frederick J. Ashby, Alberto Riva, Paul D. Gamlin, Ronald J. Mandel, Aishwarya Kunta, Courtney J. Rouse, and Coy D. Heldermon. 2025. "Sex Differences in Brain Transcriptomes of Juvenile Cynomolgus Macaques" Biomolecules 15, no. 5: 671. https://doi.org/10.3390/biom15050671
APA StyleKabbej, N., Ashby, F. J., Riva, A., Gamlin, P. D., Mandel, R. J., Kunta, A., Rouse, C. J., & Heldermon, C. D. (2025). Sex Differences in Brain Transcriptomes of Juvenile Cynomolgus Macaques. Biomolecules, 15(5), 671. https://doi.org/10.3390/biom15050671