Article

Serum Brevican as a Biomarker of Cerebrovascular Disease in an Elderly Cognitively Impaired Cohort

by
Rachel S. L. Chia
1,2,
Karolina Minta
1,3,
Liu-Yun Wu
1,2,
Kaung H. T. Salai
1,
Yuek Ling Chai
1,2,
Saima Hilal
1,2,4,5,
Narayanaswamy Venketasubramanian
6,
Christopher P. Chen
1,2,
Joyce R. Chong
1,2,* and
Mitchell K. P. Lai
1,2,*
1
Department of Pharmacology, Yong Loo Lin School of Medicine, National University of Singapore, Singapore 117600, Singapore
2
Memory Aging and Cognition Centre, National University Health System, Singapore 117600, Singapore
3
Future Health Technologies, Singapore–ETH Centre, Campus for Research Excellence and Technological Enterprise (CREATE), Singapore 138602, Singapore
4
Saw Swee Hock School of Public Health, National University of Singapore, Singapore 117597, Singapore
5
Departments of Epidemiology and Radiology & Nuclear Medicine, Erasmus University Medical Center, 3015 GD Rotterdam, The Netherlands
6
Raffles Neuroscience Centre, Raffles Hospital, Singapore 188770, Singapore
*
Authors to whom correspondence should be addressed.
Biomolecules 2024, 14(1), 75; https://doi.org/10.3390/biom14010075
Submission received: 30 November 2023 / Revised: 23 December 2023 / Accepted: 5 January 2024 / Published: 7 January 2024
(This article belongs to the Collection Feature Papers in Section Molecular Medicine)

Abstract

:
In the brain, the extracellular matrix (ECM) composition shapes the neuronal microenvironment and can undergo substantial changes with cerebral pathology. Brevican is integral to the formation of the ECM’s neuroprotective perineuronal nets (PNNs). Decreased brevican levels were reported in vascular dementia (VaD) but not in Alzheimer’s disease (AD). However, the status of brevican in clinical cohorts with high concomitance of AD pathological burden and cerebrovascular disease (CeVD) is unclear. In this study, 32 non-cognitively impaired (NCI), 97 cognitively impaired no dementia (CIND), 46 AD, and 23 VaD participants recruited from memory clinics based in Singapore underwent neuropsychological and neuroimaging assessments, together with measurements of serum brevican. Association analyses were performed between serum brevican and neuroimaging measures of CeVDs, including white matter hyperintensities (WMHs), lacunes, cortical infarcts, and cerebral microbleeds. Using an aggregated score for CeVD burden, only CIND participants showed lower brevican levels with higher CeVD compared to those with lower CeVD burden (p = 0.006). Among the CeVD subtypes assessed, only elevated WMH burden was associated with lower brevican levels (OR = 2.7; 95% CI = 1.3–5.5). Our findings suggest that brevican deficits may play a role in early cerebrovascular damage in participants at risk of developing dementia.

1. Introduction

The top two most common causes of dementia in the elderly are Alzheimer’s disease (AD) and vascular dementia (VaD). AD is a progressive neurodegenerative condition characterised by cortical deposition of beta-amyloid (Aβ) plaques and neurofibrillary tangles (NFTs). In contrast, VaD is associated with cerebrovascular diseases (CeVD) and falls under the spectrum of vascular cognitive impairment (VCI). Interestingly, magnetic resonance imaging (MRI) markers of CeVD, including white matter lesions, lacunes, cortical infarcts, and cerebral microbleeds, are also frequently observed in AD brains [1,2,3]. Indeed, the processes of AD and CeVD-associated pathologies are often found together as mixed dementia and share comorbidities and overlapping pathophysiological mechanisms including neurodegeneration, synaptopathology, neuroinflammation, and extracellular matrix (ECM) alterations [4,5,6,7,8,9,10]. Accumulating evidence suggests that these pathophysiological processes may interact in an additive or synergistic manner to exacerbate cognitive impairments [6,11,12]. Interestingly, concomitant AD and CeVD prevalence may be higher in populations from certain geographical regions, such as Asia [6,13], and constitutes an unmet need for clinically useful biomarkers and therapeutic targets. In this context, blood-based markers have the potential to be highly sensitive, specific, and convenient measurements for detecting and monitoring AD and CeVD pathologies [14,15,16].
Brevican is a central nervous system (CNS)-specific chondroitin sulphate proteoglycan (CSPG) primarily expressed in astrocytes and neurons [17], and is an integral component of highly organised ECM structures called perineuronal nets (PNNs) [18]. The lattice-like PNNs enwrap CNS parvalbumin-positive (PV+) neurons and regulate the balance between structural stabilisation and synaptic remodelling, which is in turn crucial for maintaining neuronal and synaptic functions [19,20,21]. Any ECM dysfunction may alter ECM remodelling and disrupt the brain’s structural integrity [22]. Since brevican is highly involved in PNNs, it is hypothesised that a brevican deficit may contribute to ECM dysfunction, leading to the progression of brain pathologies [23,24].
Recent clinical studies showed decreased brevican in the cerebrospinal fluid (CSF) of VaD, but not AD [25,26,27,28], highlighting its potential associations with CeVD. However, the status of peripheral brevican in AD patients with and without concomitant CeVD is currently unclear. In this study, we measured serum brevican in a Singaporean memory clinic cohort and studied its associations with neuroimaging measurements of amyloid pathology and CeVD [6,13].

2. Materials and Methods

2.1. Study Population

A case–control study design was adopted, with cross-sectional analyses performed on the data. A total of 217 participants from the National University Hospital memory clinic and community in Singapore were recruited as part of the amyloid brain and retinal imaging (ABRI) study cohort (see Supplementary Data S1 for details). Demographic data, imaging, and serum biomarker measurements are presented in Table 1. Informed consent was obtained from patients or their caregivers before study recruitment. Participants underwent detailed medical histories, physical, clinical, and neuropsychological assessments, and neuroimaging. Among the 217 participants, 198 had serum available for brevican measurements and were included in this study. Clinical diagnoses of cognitive impairment, AD, and VaD were based on standardised tests, including a comprehensive neuropsychological test battery, as well as consensus criteria, as previously described [29].

2.2. Demographic and Risk Factor Assessments

A detailed questionnaire was administered to collect relevant demographic (age, gender, race, and years of education) and medical information for all participants. Data collected for medical information included risk factors such as hypertension, hyperlipidaemia, diabetes mellitus, and cardiovascular diseases and were classified as present or absent. Hypertension was defined as systolic blood pressure of 140 mm Hg or more and/or diastolic blood pressure of 90 mm Hg or more or a history of antihypertensive medication use. Diabetes mellitus was defined as glycated haemoglobin (HbA1c) of 6.5% or more or being on diabetic medication. Hyperlipidaemia was defined as total cholesterol levels of 4.14 mM or more or being on lipid-lowering medication. Cardiovascular disease was classified as positive medical history of atrial fibrillation, congestive heart failure, and myocardial infarction. Genotyping for apolipoprotein E (APOE) ε4 carrier status (presence of at least one APOE ε4 allele) was performed as previously described [7].

2.3. Neuroimaging

2.3.1. Amyloid PET-MRI Acquisition and Quantification

Amyloid PET imaging was performed at the Clinical Imaging Research Centre of the National University of Singapore using either the [11C]Pittsburgh Compound B (PiB) or [18F]Flutafuranol amyloid tracer radioligands. A total of 217 subjects underwent a 30 min brain PET scan on an mMR synchronous PET/MR scanner 40 min after intravenous injection of 370 (+/−15%) MBq of [11C]PiB or a 20 min brain PET scan on an mCT PET-CT scanner (Siemens Healthineers GmbH, Erlanger, Germany) 50 min after intravenous injection of 185MBq of [18F]Flutafuranol (range 166–203 MBq). All images were reconstructed using ordinary Poissonordered subsets expectation maximisation with all corrections applied. Amyloid PET images were independently visually interpreted by three raters blinded to the clinical diagnosis of each subject and following the criteria described previously [30,31]. Using individual parcellated MRI as reference and target region definition based on an in-house developed automated pipeline [32], a global standardised uptake value ratio (SUVr) was derived from the [11C]PiB scans. On top of that, cortical Aβ status as binary criteria was derived by merging the equivocal scans with the positive Aβ scans [31].

2.3.2. Brain Atrophy and CeVD MRI Markers

MRI scans were performed on a 3T Siemens Magnetom Trio Tim scanner using a 32–channel head coil at CIRC, NUS. As described previously, the sequences included T1–weighted, fluid-attenuated inversion recovery (FLAIR), and T2–weighted imaging sequences [33] (see Supplementary Data S2 for details). The image preprocessing and tissue classification algorithms used have been previously described [34]. The detection of white matter hyperintensity (WMH, as an indicator for white matter lesions) was achieved using an adapted threshold technique based on the tissue segmentation method where a k-nearest-neighbour classifier was used to classify voxels into CSF, grey matter, and normal-appearing white matter, and subsequently, WMH volume was calculated from these measurements [35]. Brain atrophy was indicated by two parameters: (a) hippocampal volumes which were calculated for the right and left hemispheres, with average volumes measured in millilitres and (b) global cortical thickness which was measured as the shortest distance between the grey/white matter boundary and pial surface at each vertex.
Lacunes were defined as 3–15 mm in diameter lesions, with a low signal on the T1–weighted image and FLAIR, a high signal on the T2–weighted image, and a hyperintense rim with a centre following CSF intensity on FLAIR. Cortical infarcts were defined as focal lesions involving cortical grey matter, a signal following CSF intensity, a hyperintense rim on FLAIR images, and tissue loss of variable magnitude, with prominent adjacent sulci and ipsilateral ventricular enlargement [7]. Using the Brain Observer Microbleed Scale to grade cerebral microbleeds, CMBs were defined as focal, rounded areas of hypointensity (2–10 mm in diameter), with blooming on SWI. CMBs found in the lobar and deep regions were recorded and used as the total number of CMBs [32,36].
MRI markers of CeVD were transformed into binary variables and recorded as the presence/absence of ≥2 lacunes, ≥1 cortical infarct, and ≥2 CMBs. The presence of elevated WMH volume was defined at the cut-off of the 50th percentile (median) of WMH volume. “Higher CeVD burden” (CeVD+) was defined as the presence of cortical infarct and/or presence of ≥2 lacunes and/or presence of ≥2 CMBs and/or higher than the 50th percentile of WMH volume. If a participant did not have ≥2 lacunes, ≥2 CMBs or ≥1 cortical infarct and below median WMH volume, they were considered to have “Lower CeVD burden” (CeVD−).

2.4. Serum Brevican Measurements

Non-fasting blood was drawn from study participants into serum separator tubes (SST) and processed by centrifugation at 2000× g for 10 min at 4 °C, then stored at −80 °C until use. All samples were subject to only one freeze–thaw cycle. The concentration of serum brevican was measured in duplicate by evaluators blinded to clinical information at the National University of Singapore (NUS). Serum brevican concentrations were measured using the brevican ELISA assay kit (Raybiotech Life, Inc., Peachtree Corners, GA, USA). The minimum detectable concentration of serum brevican is 0.041 ng/mL, with intra- and inter-assay CV% of <10% and <12%, respectively.

2.5. Statistical Analyses

Statistical analyses were performed with IBM SPSS version 26 (IBM Co., Armonk, NY, USA). Group comparisons of continuous demographic variables were performed using one-way analysis of variance (ANOVA) with Bonferroni or Fisher’s least significant difference (LSD) post hoc tests for normally distributed data, and the Kruskal–Wallis test with Dunn’s procedure for skewed distribution data. Chi-square tests were used for categorical variables. Correlation analyses were performed using Spearman’s rank correlation. Serum brevican levels were multiplied by ten before being logarithmically transformed due to the skewed distribution for further analyses. To assess the association between each dichotomous neuroimaging variable (WMH volume, lacune counts, cortical infarct counts, cerebral microbleed counts, and amyloid PET reading) with serum brevican, binary logistic regressions with odds ratios (ORs) and 95% confidence intervals (CI)s were computed. The regression models were performed independently for each neuroimaging variable. Significance was set at p < 0.05.

3. Results

3.1. Participant Characteristics

Among the 198 study participants, 32 (16.2%) individuals were NCI controls, 97 (49.0%) were CIND, 46 (23.2%) were AD, and 23 (11.6%) were VaD patients. Demographic data, neuroimaging, and serum brevican measurements of the study participants are reported in Table 1. Patients with AD and VaD had lower education levels (p < 0.001) compared to those with NCI. Patients with AD had higher APOE ε4 carrier frequency (p = 0.01) and positive Aβ PET read (p < 0.001) compared to those with NCI. The prevalence of CeVD was also significantly higher in patients with CIND and VaD (p < 0.001) compared to those with NCI. AD patients showed the highest PiB-PET SUVR values (p < 0.001) among the diagnostic groups. No significant difference was observed in the prevalence of vascular risk factors (hypertension, diabetes, hyperlipidemia, and cardiovascular diseases) and in serum brevican levels among the groups (Table 1). Serum brevican was not correlated with age (rho = −0.010, p = 0.885), years of education (rho = 0.008, p = 0.914), WMH volume (rho = −0.106, p = 0.138), hippocampal volume (rho = −0.024, p = 0.756), global cortical thickness (rho = −0.092, p = 0.236), and PiB-PET SUVR (rho = 0.130, p = 0.094).

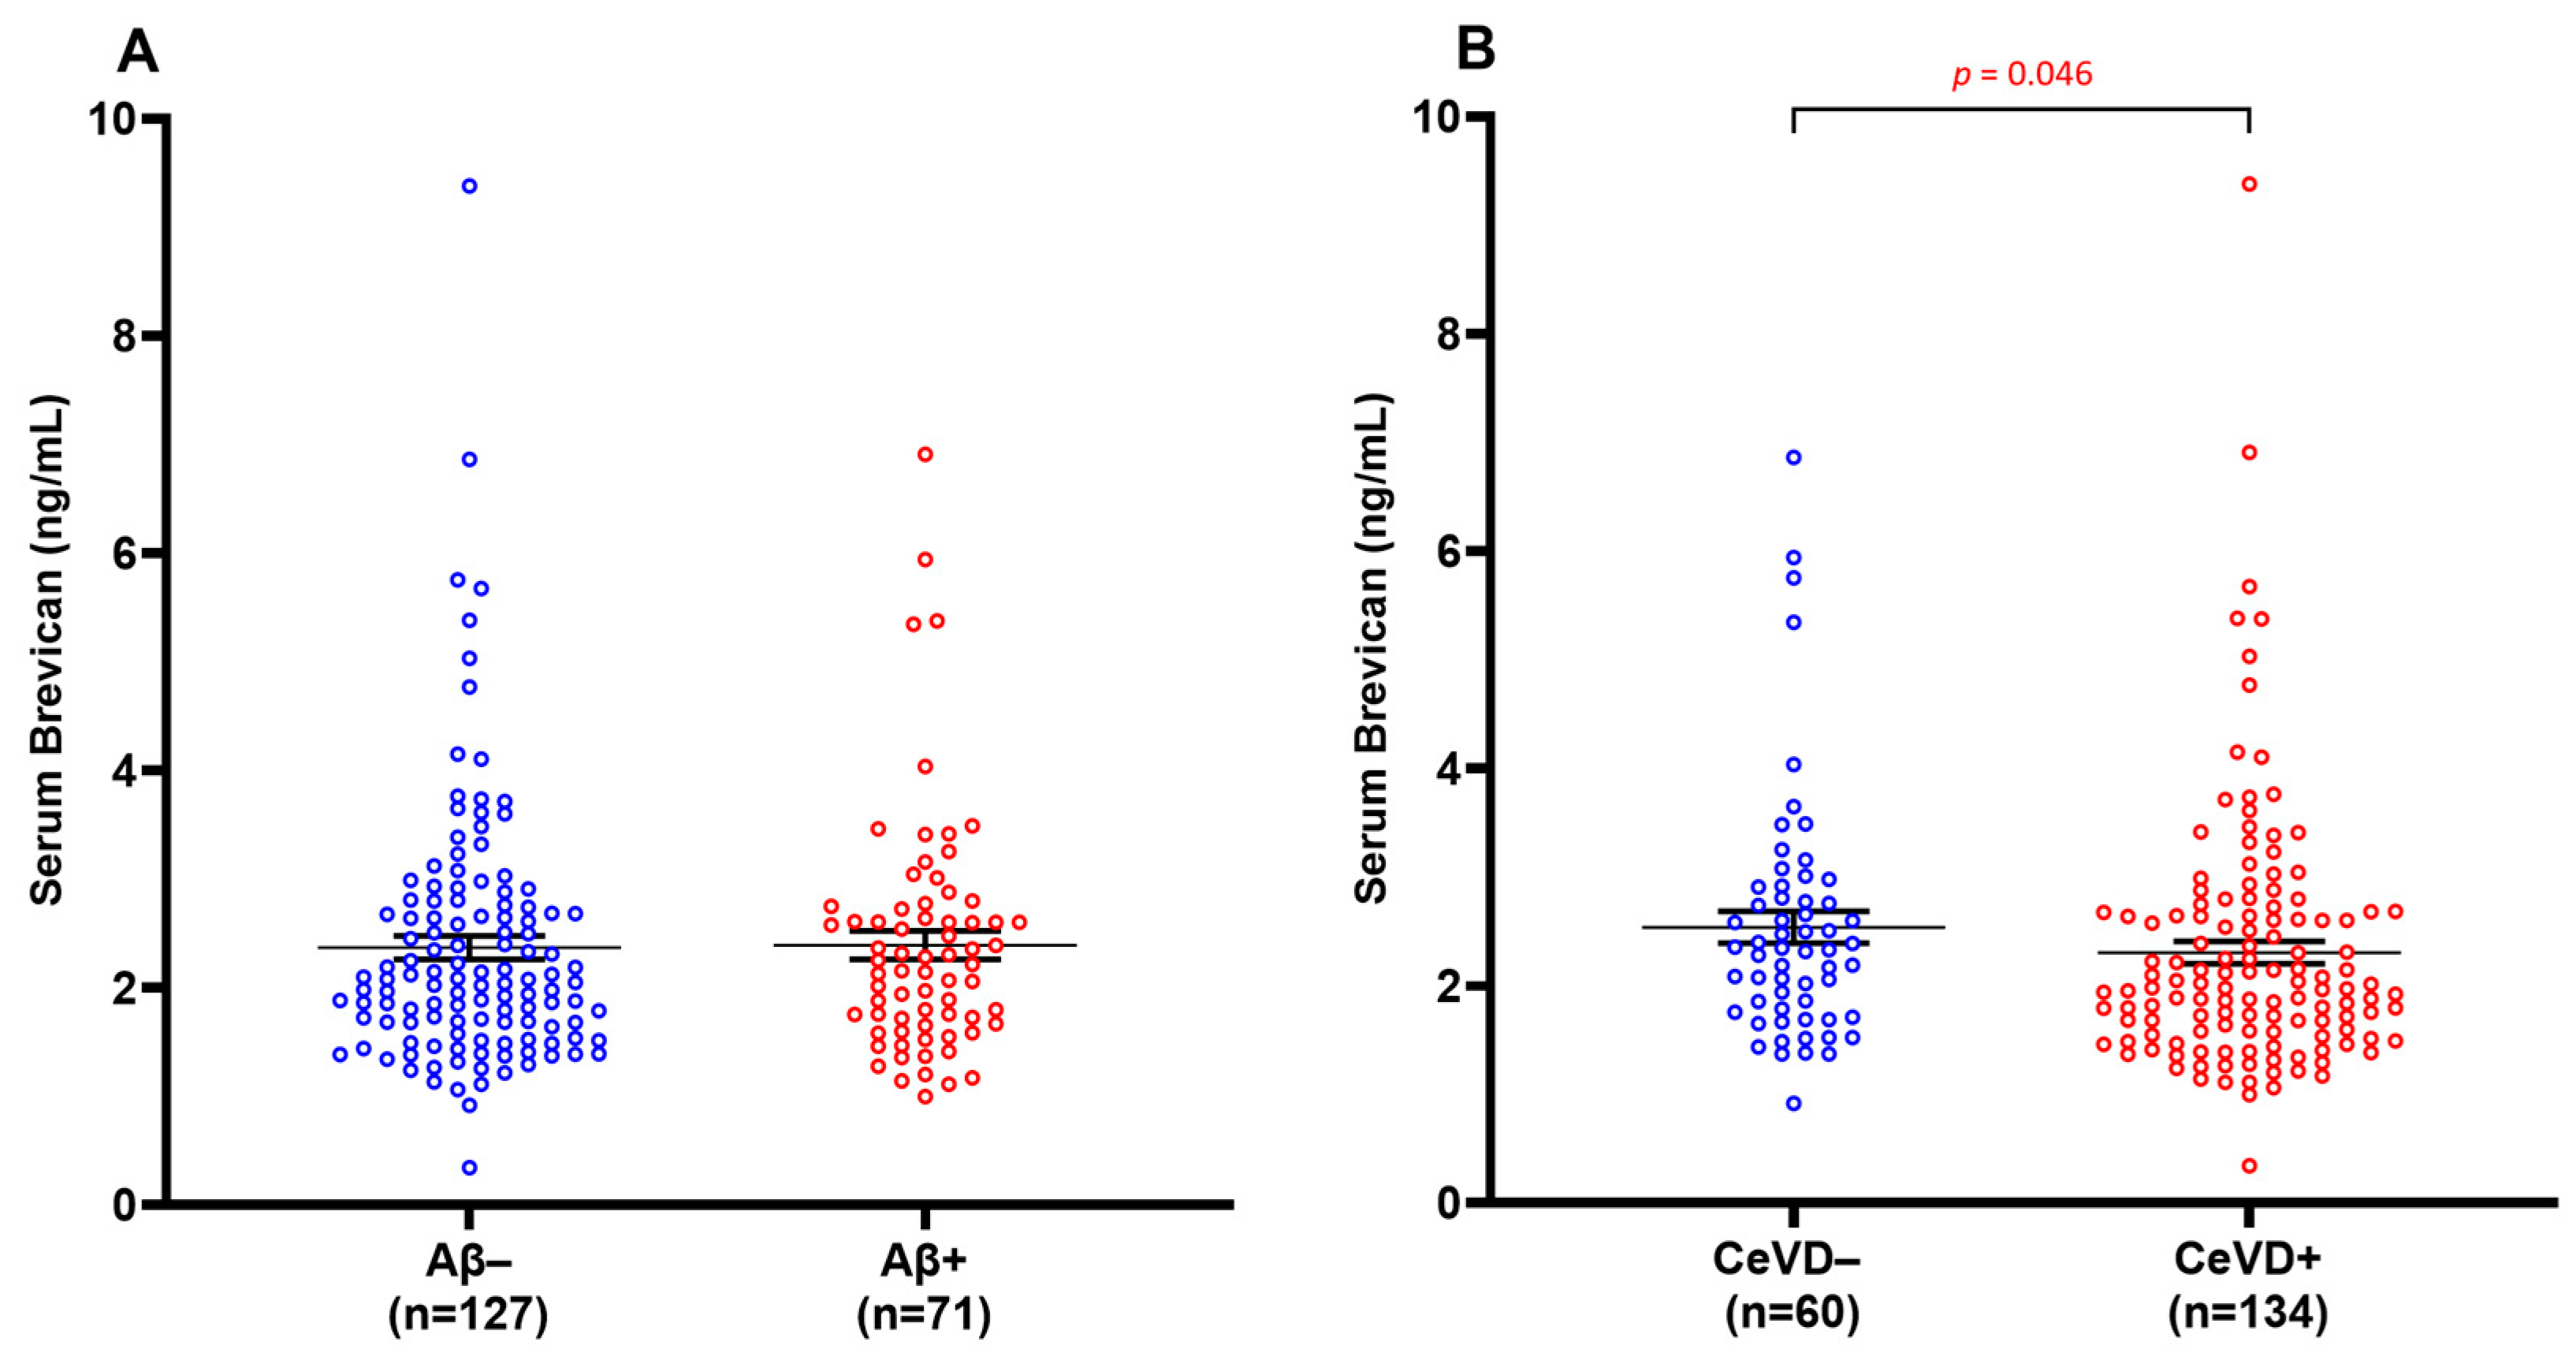
3.2. Serum Brevican Concentrations in a Clinical Cohort Stratified by Aβ and CeVD Burden

Groups were dichotomised into β-amyloid negative (Aβ−) and β-amyloid positive (Aβ+) groups, and similarly for CeVD− vs. CeVD+. No significant difference in serum brevican levels was observed between the Aβ− and Aβ+ groups (Figure 1A) (p > 0.05). Serum brevican was also not related to APOE ε4 status (p > 0.05). However, there was a significant reduction in serum brevican levels in CeVD+ compared to CeVD− participants (Figure 1B) (p = 0.046).

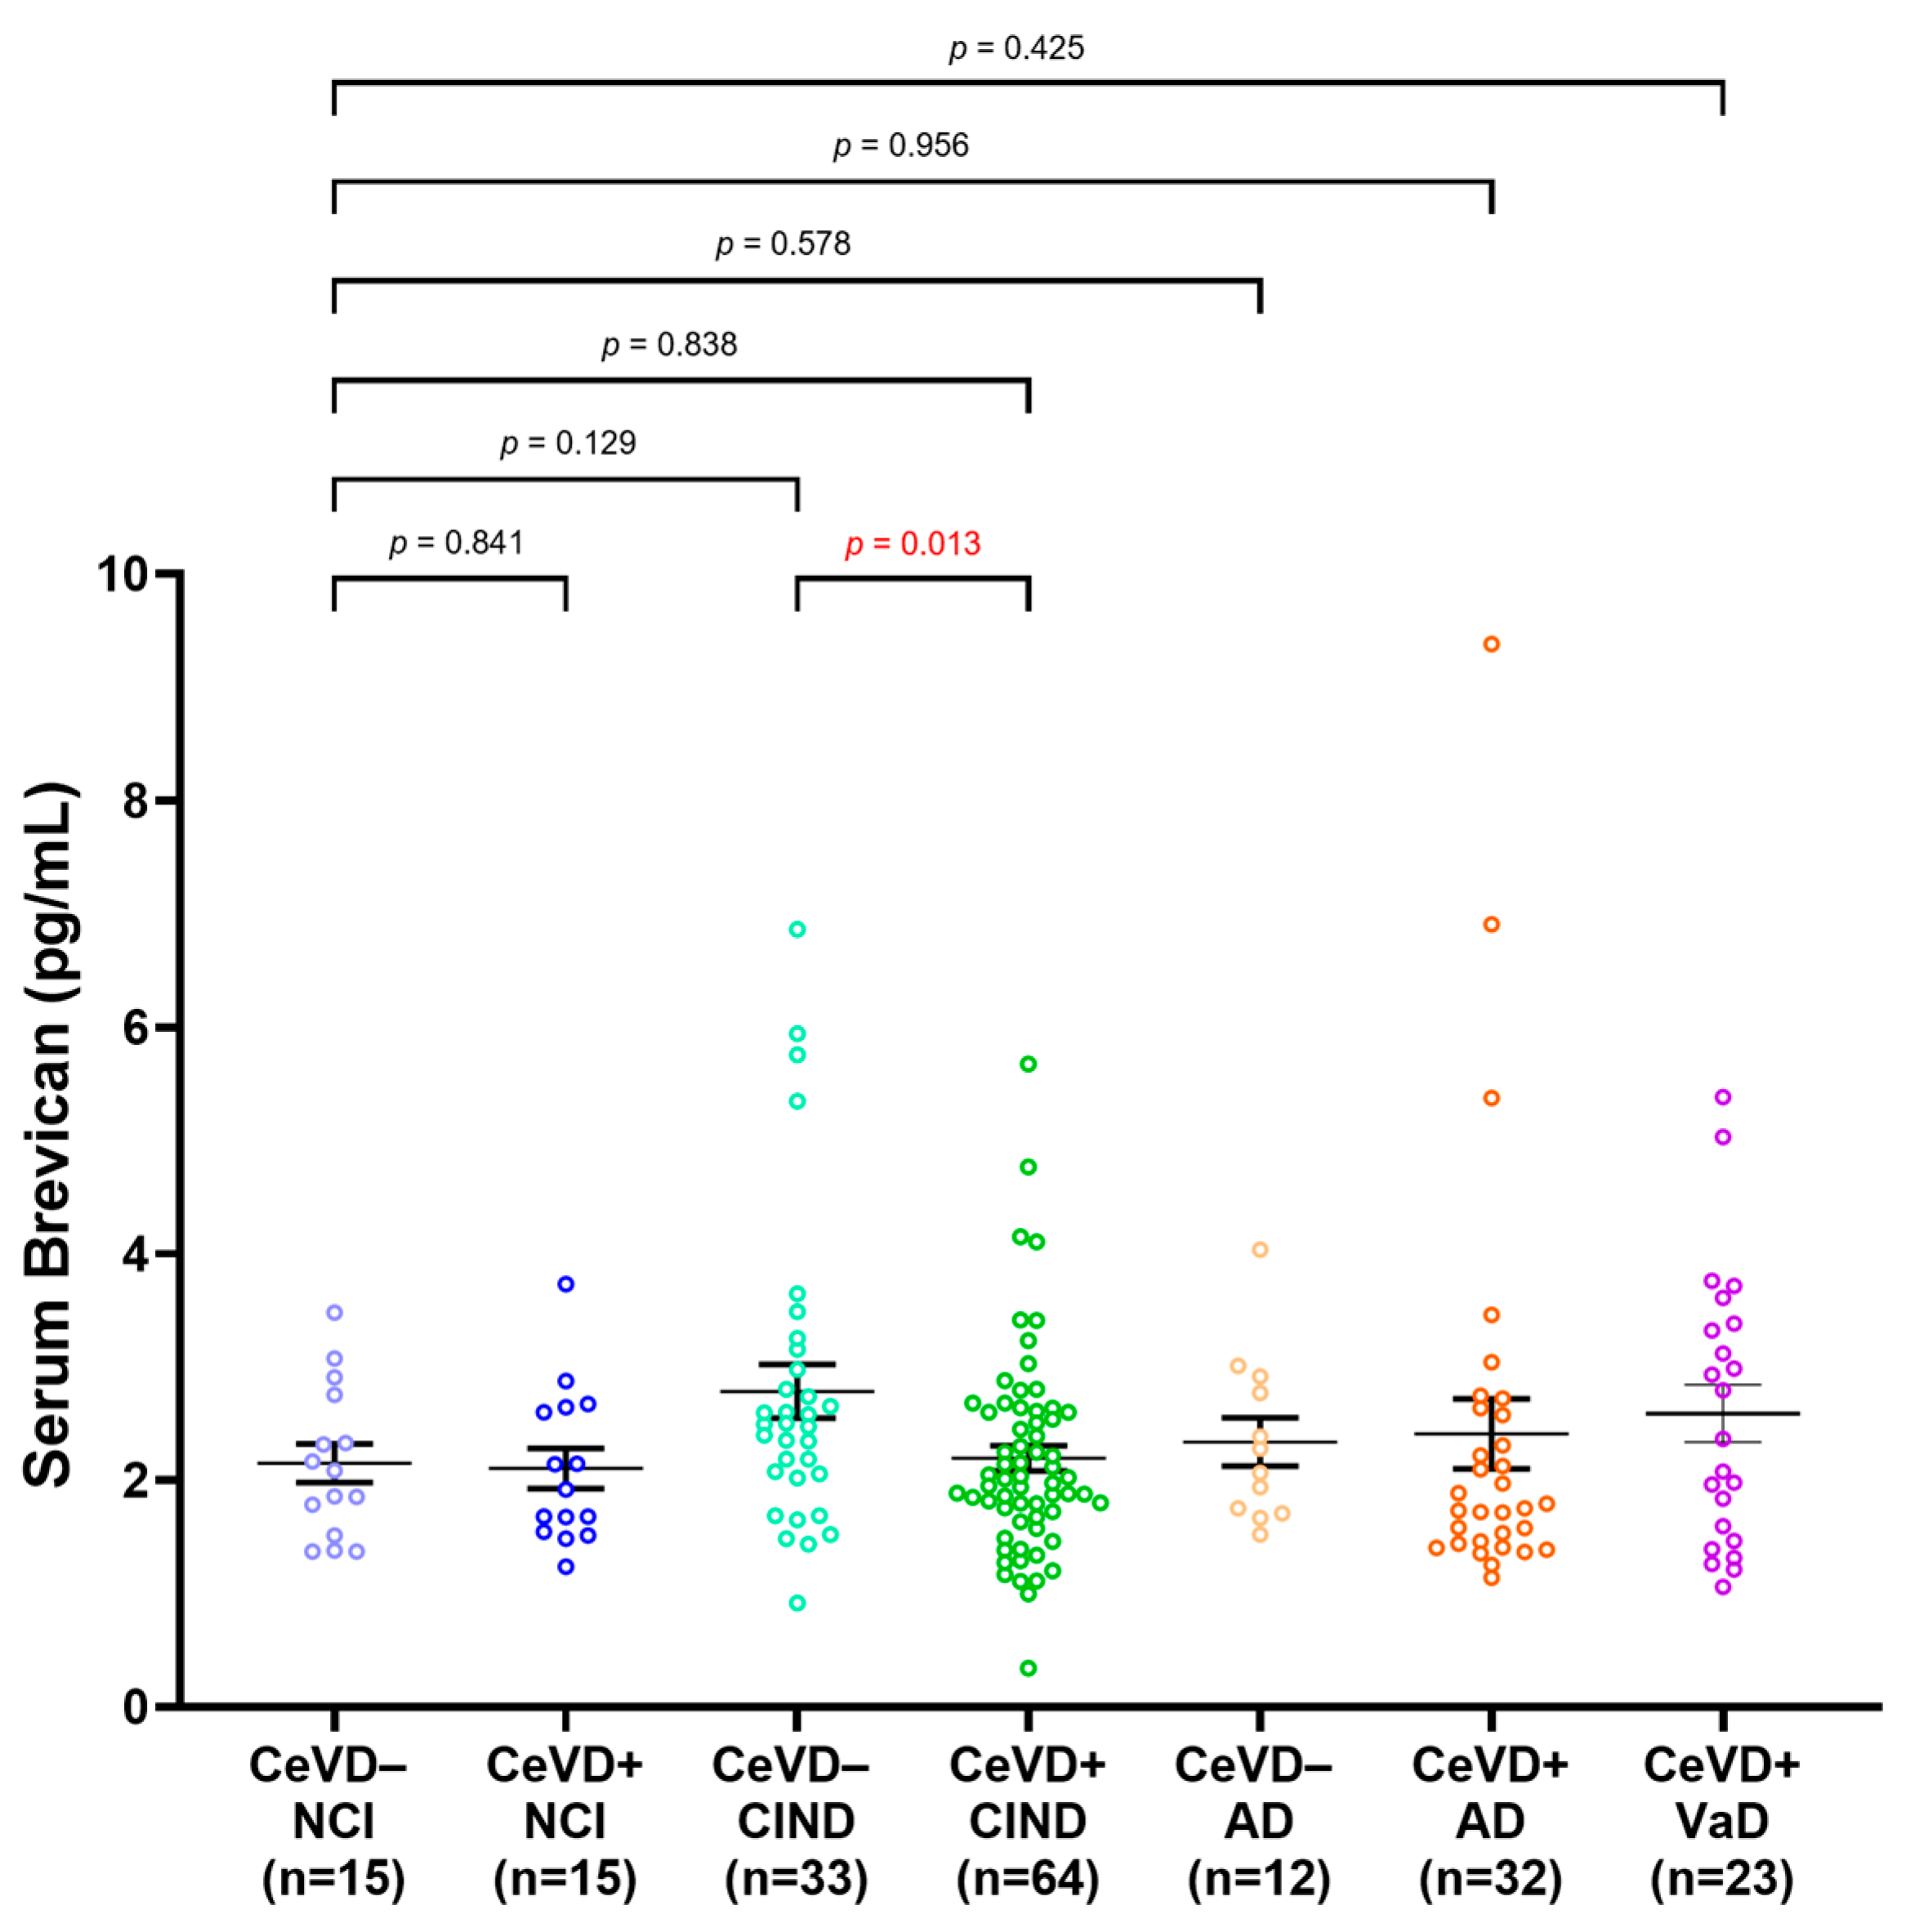
3.3. Serum Brevican Concentrations in a Clinical Cohort Stratified by Clinical Diagnosis and CeVD

Serum brevican was next compared among participants stratified by clinical diagnoses and CeVD burden (Figure 2). No significant difference was observed in serum brevican among the groups compared to NCI CeVD−. Serum brevican was significantly lower in the CIND CeVD+ subgroup compared to the CIND CeVD− group (p = 0.013), whilst NCI ± CeVD and AD ± CeVD subgroups showed similar, albeit non-significant, trends towards lower brevican in the presence of higher CeVD. The significance was retained within the CIND ± CeVD subgroups after adjustments for age and gender (p < 0.05).

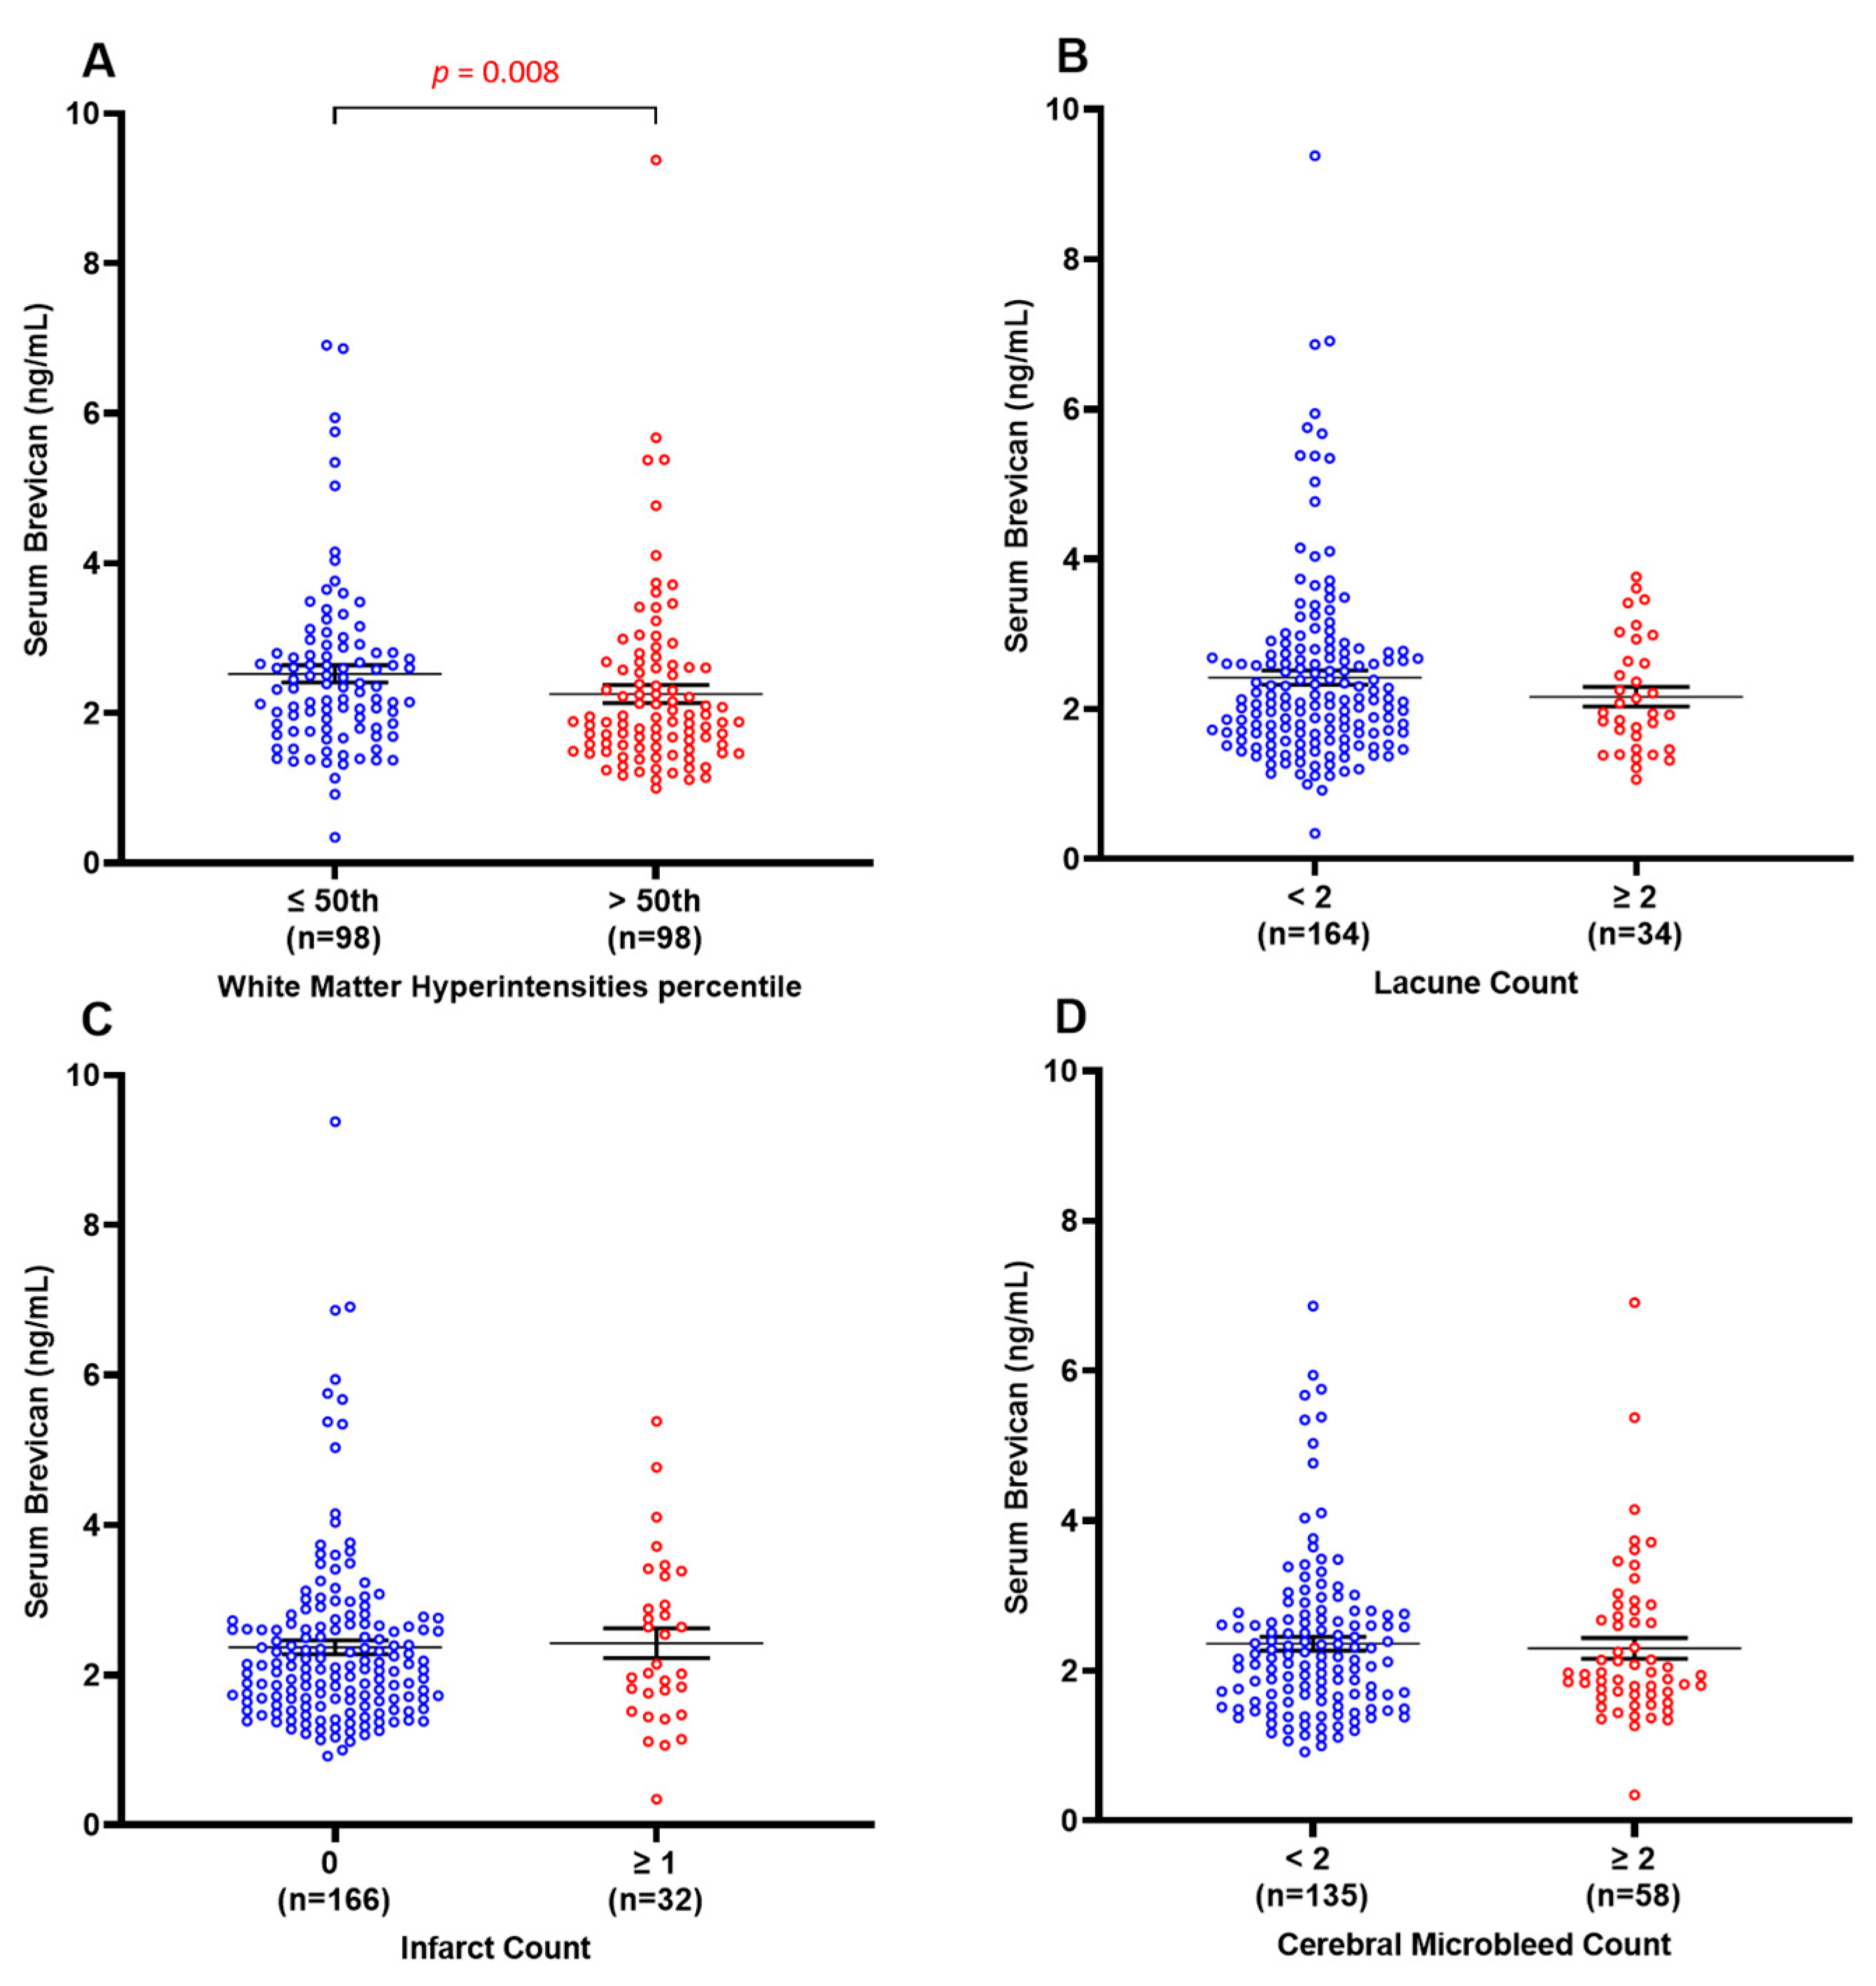
3.4. Decreased Serum Brevican Is Associated Specifically with Elevated White Matter Hyperintensities

Further analyses explored potential associations between the measured serum brevican levels and various MRI markers of CeVD, including WMH, lacunes, infarcts, and CMBs. Figure 3 shows that serum brevican concentrations were significantly lower in subjects with elevated WMH volume (>50th percentile) (p = 0.008) but not for the other three neuroimaging features (lacune, infarct, and cerebral microbleed count) (p > 0.05 for all). Binary logistic regression models in Table 2 similarly showed significant associations between lower levels of serum brevican (p = 0.005; OR = 2.8; 95% CI = 1.4–5.8) and elevated WMH volume in the entire clinical cohort. After adjusting for age, gender, vascular risk factors (i.e., hypertension, diabetes, hyperlipidaemia, and cardiovascular diseases), and the other three neuroimaging features (lacune, infarct, and cerebral microbleed count), a significant association with elevated WMH volume remained for lower serum brevican (p = 0.005; OR = 3.0; 95% CI = 1.4–6.4). Serum brevican was not associated with lacune, infarct, and cerebral microbleed counts (p > 0.05 for all).

3.5. ROC Analyses of Serum Brevican as a Possible Biomarker of Early Vascular Damage

Using receiver operating characteristic (ROC) curve analyses, the utility of serum brevican in distinguishing between CeVD burden in the extant cohort and within CIND participants was assessed. The unadjusted ROC analyses showed an area under the ROC curve (AUC) of 0.590 (sensitivity = 54%; specificity = 67%; 95% CI = 0.5–0.7) for distinguishing CeVD+ from CeVD− individuals in the whole cohort at a cut-off 2.05 ng/mL for serum brevican levels. In contrast, within the CIND subgroup, unadjusted ROC analyses showed an AUC of 0.646 (sensitivity = 55%; specificity = 76%; 95% CI = 0.5–0.8) in distinguishing between CIND CeVD+ and CIND CeVD− groups at a cut-off 2.05 ng/mL for serum brevican levels. These results suggest that serum brevican only has moderate utility in identifying CIND individuals with CeVD.

4. Discussion

Using data from a Singaporean elderly cohort who underwent comprehensive neuropsychological and neuroimaging assessments, we explored potential associations of brain amyloid and CeVD with serum brevican. Our main findings are as follows: (1) decreased serum brevican levels were found in CeVD+ compared to CeVD− participants; (2) subgroup analyses showed that the significantly lower serum brevican levels in CeVD+ compared to CeVD− was specifically found in CIND participants; (3) decreased serum brevican levels were specifically associated with white matter hyperintensities. Our study builds upon previous research showing decreased CSF brevican in VaD patients compared to those with NCI [26,28] and extends these findings by reporting a significant association between lower levels of peripheral circulating brevican and elevated WMH volume. However, unlike previous CSF-based studies, we did not detect significant serum brevican alterations in VaD. Possible reasons for the discrepancy include cohort, sampling, and measurement differences. It is also possible that in contrast to CSF, serum brevican is more sensitive to early cerebrovascular changes prior to the sequela of VaD.
In agreement with previous studies reporting no brevican alteration in AD serum or the brain [28,37], the current study did not detect significant differences in serum brevican levels in groups stratified by amyloid status. Taken together with the above-described findings in CeVD subgroups, our results suggest that lower serum brevican levels may reflect vascular pathologies independent of AD pathology. Although the exact mechanisms underlying serum brevican decreases have not been fully elucidated, they likely reflect the upregulation of vascular remodelling. Indeed, the occurrence of CeVD in predementia stages (i.e., CIND) may lead to increased proteolytic activity, resulting in the cleavage and subsequent release of brevican fragments into the bloodstream. For example, brevican is a known substrate of ECM proteases such as a disintegrin and metalloproteinase with thrombospondin motifs (ADAMTS) as well as matrix metalloproteinases (MMPs) [38], which in turn are known to be dysregulated in the presence of vascular pathology [5,39,40,41]. Therefore, proteolytic cleavage and subsequent degradation of ECM proteins including brevican may reduce the integrity of the brain ECM which supports structural plasticity. Furthermore, the dysregulation of ECM proteases may contribute to other CeVD-related pathophysiological processes including neuroinflammation and endothelial or perycytic damage, thereby exacerbating CeVD-initiated synaptic dysfunction and neurodegeneration, resulting in dementia [42,43]. In line with this postulate, brevican-deficient mouse models showed impaired forms of hippocampal long-term potentiation [44], altered function of PV+ interneurons [45], and impaired hippocampus-dependent spatial or contextual acquisition learning [46], while senescence-accelerated mouse strains showed reduced brevican-positive PNNs [47]. Taken together, these findings indicate the possible involvement of brevican in cognitive functions.
Interestingly, amongst the CeVDs assessed (WMH, lacunes, cortical infarcts, and CMBs), serum brevican was negatively associated only with WMH, which is a neuroimaging marker of white matter lesions. As white matter lesions represent early small vessel disease preceding lacunes and infarcts, but which is nevertheless associated with long-term risks of vascular cognitive impairment and dementia [48], our findings support the involvement of brevican alterations in early stages of cerebrovascular pathology, as well as the postulate of brevican replacement as a potential therapeutic strategy. However, further studies are required to understand the mechanisms underlying brevican’s role in cerebrovascular health and disease.
The strengths of the current study include the following: (1) the use of comprehensive neuropsychological assessments to diagnose cognitive impairment and dementia properly; (2) the use of well-established neuroimaging measurements for amyloid and CeVD pathology; and (3) the inclusion of covariates such as age, gender, education, and APOE ε4 carrier. However, our study also has several limitations. Firstly, the study size was relatively small, leading to small subgroup numbers, especially when the clinical cohort was stratified by clinical diagnosis and CeVD, leading to non-significant trends in some of the observations. Furthermore, the cross-sectional design of the study did not allow for the examination of temporal associations between serum brevican and the progression of WMH burden or cognitive impairment, giving rise to the need for follow-up longitudinal studies. Also, potential confounding effects of other ECM proteins, such as MMPs, ADAMTS, and tissue inhibitors of metalloproteinases (TIMPs), were not addressed in this study. Since TIMPs are known to be inhibitors of MMPs and ADAMTS and are associated with VaD [49,50], it would be of interest to assess the potential roles of TIMPs and other ECM components in cerebrovascular disease pathogenesis. As this study focuses on cerebral vascular disease and the importance of brevican on the cerebral extracellular matrix, future studies investigating MRI assessments of intracerebral haemorrhages, dilated perivascular spaces, or BBB leakage and their association with serum brevican would strengthen the observations made in this study. In this study, the median cut-off for WMH volume was performed to separate participants into ‘elevated’ and ‘low’ WMH loads, as there is no current consensus on established cut-offs for WMH volume [8]. Although this method has been used in multiple publications [7,8], the exact cut-off values may differ across cohorts. Finally, while this study shows that serum brevican is a possible biomarker for early CeVD pathology in predementia groups, the moderate ROC values obtained suggest a need for additional studies to evaluate ECM or other biomarkers that can complement brevican in a multi-marker panel in improving sensitivity and specificity.

5. Conclusions

Our findings suggest that decreased serum brevican may be associated with early cerebrovascular damage (i.e., white matter lesions) in an elderly predementia (CIND) group. Further assessments would be required to assess the role of brevican in cerebrovascular health and disease, as well as the clinical utility of serum brevican in identifying predementia patients with CeVD.

Supplementary Materials

The following supporting information can be downloaded at: https://www.mdpi.com/article/10.3390/biom14010075/s1, Supplementary Data S1: Flowchart of Study Participants; Supplementary Data S2: Details for MRI protocol.

Author Contributions

M.K.P.L. and C.P.C. have full access to all of the data in the study and take responsibility for the integrity of the data and the accuracy of the data analysis. Concept and design: R.S.L.C., K.M., J.R.C. and M.K.P.L. Acquisition, analysis, or interpretation of data: R.S.L.C., K.M., S.H., N.V. and C.P.C. Drafting of the manuscript: R.S.L.C. and M.K.P.L. Critical revision of the manuscript for important intellectual content: all authors. Statistical analyses: R.S.L.C., J.R.C., Y.L.C., L.-Y.W. and K.H.T.S. R.S.L.C. prepared the figures. Supervision: M.K.P.L. and C.P.C. All authors have read and agreed to the published version of the manuscript.

Funding

This study was supported by the National Medical Research Council (MOH-000707-01 and NMRC/CG/M006/2017 to C.P.C. and M.K.P.L.) and the NUS Healthy Longevity Translational Research Programme (HLTRP/2022/PS-01 to M.K.P.L.). Y.L.C. is the recipient of a Post-Doctoral Fellowship from the Yong Loo Lin School of Medicine (NUSMED/2021/PDF/05).

Institutional Review Board Statement

This study was conducted in accordance with the Declaration of Helsinki, and approval was given by the Singapore National Healthcare Group Domain–Specific Review Board (NHG–DSRB) (reference: 2010/00017; study protocol number: DEM4233).

Informed Consent Statement

Participants or their caregivers gave informed consent to participate in this study before taking part.

Data Availability Statement

Anonymised data derived from this study may be provided by the corresponding author upon reasonable request.

Acknowledgments

We acknowledge all of the Memory Aging and Cognition Centre, National University Hospital, coordinators for their contribution to recruitment and data acquisition. We acknowledge Boon Yeow Tan, St Luke’s Hospital, for contributing to patient recruitment.

Conflicts of Interest

The authors declare no conflicts of interest.

References

  1. McAleese, K.E.; Alafuzoff, I.; Charidimou, A.; De Reuck, J.; Grinberg, L.T.; Hainsworth, A.H.; Hortobagyi, T.; Ince, P.; Jellinger, K.; Gao, J.; et al. Post-mortem assessment in vascular dementia: Advances and aspirations. BMC Med. 2016, 14, 129. [Google Scholar] [CrossRef] [PubMed]
  2. Jellinger, K.A. Alzheimer disease and cerebrovascular pathology: An update. J. Neural Transm. 2002, 109, 813–836. [Google Scholar] [CrossRef] [PubMed]
  3. Kim, S.E.; Kim, H.J.; Jang, H.; Weiner, M.W.; DeCarli, C.; Na, D.L.; Seo, S.W. Interaction between Alzheimer’s Disease and Cerebral Small Vessel Disease: A Review Focused on Neuroimaging Markers. Int. J. Mol. Sci. 2022, 23, 10490. [Google Scholar] [CrossRef] [PubMed]
  4. Chai, Y.L.; Lee, J.H.; Chong, J.R.; Ballard, C.; Francis, P.T.; Kennedy, B.K.; Arumugam, T.V.; Chen, C.P.; Aarsland, D.; Lai, M.K.P. Inflammatory panel cytokines are elevated in the neocortex of late-stage Alzheimer’s disease but not Lewy body dementias. J. Neuroinflamm. 2023, 20, 111. [Google Scholar] [CrossRef] [PubMed]
  5. Chai, Y.L.; Rajeev, V.; Poh, L.; Selvaraji, S.; Hilal, S.; Chen, C.P.; Jo, D.G.; Koo, E.H.; Arumugam, T.V.; Lai, M.K. Chronic cerebral hypoperfusion alters the CypA-EMMPRIN-gelatinase pathway: Implications for vascular dementia. J. Cereb. Blood Flow. Metab. 2023, 43, 722–735. [Google Scholar] [CrossRef] [PubMed]
  6. Chen, C.; Homma, A.; Mok, V.C.; Krishnamoorthy, E.; Alladi, S.; Meguro, K.; Abe, K.; Dominguez, J.; Marasigan, S.; Kandiah, N.; et al. Alzheimer’s disease with cerebrovascular disease: Current status in the Asia-Pacific region. J. Intern. Med. 2016, 280, 359–374. [Google Scholar] [CrossRef] [PubMed]
  7. Chong, J.R.; Ashton, N.J.; Karikari, T.K.; Tanaka, T.; Saridin, F.N.; Reilhac, A.; Robins, E.G.; Nai, Y.H.; Vrooman, H.; Hilal, S.; et al. Plasma P-tau181 to Aβ42 ratio is associated with brain amyloid burden and hippocampal atrophy in an Asian cohort of Alzheimer’s disease patients with concomitant cerebrovascular disease. Alzheimer’s Dement. J. Alzheimer’s Assoc. 2021, 17, 1649–1662. [Google Scholar] [CrossRef]
  8. Chong, J.R.; Hilal, S.; Ashton, N.J.; Karikari, T.K.; Reilhac, A.; Vrooman, H.; Schöll, M.; Zetterberg, H.; Blennow, K.; Chen, C.P.; et al. Brain atrophy and white matter hyperintensities are independently associated with plasma neurofilament light chain in an Asian cohort of cognitively impaired patients with concomitant cerebral small vessel disease. Alzheimer’s Dement. 2023, 15, e12396. [Google Scholar] [CrossRef]
  9. Iadecola, C. The overlap between neurodegenerative and vascular factors in the pathogenesis of dementia. Acta Neuropathol. 2010, 120, 287–296. [Google Scholar] [CrossRef]
  10. Sun, Y.; Xu, S.; Jiang, M.; Liu, X.; Yang, L.; Bai, Z.; Yang, Q. Role of the Extracellular Matrix in Alzheimer’s Disease. Front. Aging Neurosci. 2021, 13, 707466. [Google Scholar] [CrossRef]
  11. Schneider, J.A.; Arvanitakis, Z.; Bang, W.; Bennett, D.A. Mixed brain pathologies account for most dementia cases in community-dwelling older persons. Neurology 2007, 69, 2197–2204. [Google Scholar] [CrossRef]
  12. Agrawal, S.; Schneider, J.A. Vascular pathology and pathogenesis of cognitive impairment and dementia in older adults. Cereb. Circ. Cogn. Behav. 2022, 3, 100148. [Google Scholar] [CrossRef] [PubMed]
  13. Lam, B.Y.K.; Yiu, B.; Ampil, E.; Chen, C.L.; Dikot, Y.; Dominguez, J.C.; Ganeshbhai, P.V.; Hilal, S.; Kandiah, N.; Kim, S.; et al. High burden of cerebral white matter lesion in 9 Asian cities. Sci. Rep. 2021, 11, 11587. [Google Scholar] [CrossRef] [PubMed]
  14. Chong, J.R.; Ashton, N.J.; Karikari, T.K.; Tanaka, T.; Schöll, M.; Zetterberg, H.; Blennow, K.; Chen, C.P.; Lai, M.K.P. Blood-based high sensitivity measurements of beta-amyloid and phosphorylated tau as biomarkers of Alzheimer’s disease: A focused review on recent advances. J. Neurol. Neurosurg. Psychiatry 2021, 92, 1231–1241. [Google Scholar] [CrossRef] [PubMed]
  15. Hosoki, S.; Hansra, G.K.; Jayasena, T.; Poljak, A.; Mather, K.A.; Catts, V.S.; Rust, R.; Sagare, A.; Kovacic, J.C.; Brodtmann, A.; et al. Molecular biomarkers for vascular cognitive impairment and dementia. Nat. Rev. Neurol. 2023, 19, 737–753. [Google Scholar] [CrossRef] [PubMed]
  16. Teunissen, C.E.; Verberk, I.M.W.; Thijssen, E.H.; Vermunt, L.; Hansson, O.; Zetterberg, H.; van der Flier, W.M.; Mielke, M.M.; Del Campo, M. Blood-based biomarkers for Alzheimer’s disease: Towards clinical implementation. Lancet Neurol. 2022, 21, 66–77. [Google Scholar] [CrossRef] [PubMed]
  17. Dzyubenko, E.; Gottschling, C.; Faissner, A. Neuron-Glia Interactions in Neural Plasticity: Contributions of Neural Extracellular Matrix and Perineuronal Nets. Neural Plast. 2016, 2016, 5214961. [Google Scholar] [CrossRef] [PubMed]
  18. Brakebusch, C.; Seidenbecher, C.I.; Asztely, F.; Rauch, U.; Matthies, H.; Meyer, H.; Krug, M.; Bockers, T.M.; Zhou, X.; Kreutz, M.R.; et al. Brevican-deficient mice display impaired hippocampal CA1 long-term potentiation but show no obvious deficits in learning and memory. Mol. Cell. Biol. 2002, 22, 7417–7427. [Google Scholar] [CrossRef]
  19. Cox, T.R.; Erler, J.T. Remodeling and homeostasis of the extracellular matrix: Implications for fibrotic diseases and cancer. Dis. Model. Mech. 2011, 4, 165–178. [Google Scholar] [CrossRef]
  20. Morawski, M.; Bruckner, M.K.; Riederer, P.; Bruckner, G.; Arendt, T. Perineuronal nets potentially protect against oxidative stress. Exp. Neurol. 2004, 188, 309–315. [Google Scholar] [CrossRef]
  21. Martin-de-Saavedra, M.D.; del Barrio, L.; Canas, N.; Egea, J.; Lorrio, S.; Montell, E.; Verges, J.; Garcia, A.G.; Lopez, M.G. Chondroitin sulfate reduces cell death of rat hippocampal slices subjected to oxygen and glucose deprivation by inhibiting p38, NFkappaB and iNOS. Neurochem. Int. 2011, 58, 676–683. [Google Scholar] [CrossRef] [PubMed]
  22. Soles, A.; Selimovic, A.; Sbrocco, K.; Ghannoum, F.; Hamel, K.; Moncada, E.L.; Gilliat, S.; Cvetanovic, M. Extracellular Matrix Regulation in Physiology and in Brain Disease. Int. J. Mol. Sci. 2023, 24, 7049. [Google Scholar] [CrossRef] [PubMed]
  23. Miyata, S.; Kitagawa, H. Formation and remodeling of the brain extracellular matrix in neural plasticity: Roles of chondroitin sulfate and hyaluronan. Biochim. Biophys. Acta Gen. Subj. 2017, 1861, 2420–2434. [Google Scholar] [CrossRef] [PubMed]
  24. Haddock, G.; Cross, A.K.; Allan, S.; Sharrack, B.; Callaghan, J.; Bunning, R.A.; Buttle, D.J.; Woodroofe, M.N. Brevican and phosphacan expression and localization following transient middle cerebral artery occlusion in the rat. Biochem. Soc. Trans. 2007, 35, 692–694. [Google Scholar] [CrossRef] [PubMed]
  25. Hohn, L.; Hussler, W.; Richter, A.; Smalla, K.H.; Birkl-Toeglhofer, A.M.; Birkl, C.; Vielhaber, S.; Leber, S.L.; Gundelfinger, E.D.; Haybaeck, J.; et al. Extracellular Matrix Changes in Subcellular Brain Fractions and Cerebrospinal Fluid of Alzheimer’s Disease Patients. Int. J. Mol. Sci. 2023, 24, 5532. [Google Scholar] [CrossRef]
  26. Minta, K.; Brinkmalm, G.; Portelius, E.; Johansson, P.; Svensson, J.; Kettunen, P.; Wallin, A.; Zetterberg, H.; Blennow, K.; Andreasson, U. Brevican and Neurocan Peptides as Potential Cerebrospinal Fluid Biomarkers for Differentiation between Vascular Dementia and Alzheimer’s Disease. J. Alzheimer’s Dis. 2021, 79, 729–741. [Google Scholar] [CrossRef]
  27. Minta, K.; Portelius, E.; Janelidze, S.; Hansson, O.; Zetterberg, H.; Blennow, K.; Andreasson, U. Cerebrospinal Fluid Concentrations of Extracellular Matrix Proteins in Alzheimer’s Disease. J. Alzheimer’s Dis. 2019, 69, 1213–1220. [Google Scholar] [CrossRef]
  28. Jonesco, D.S.; Karsdal, M.A.; Henriksen, K. The CNS-specific proteoglycan, brevican, and its ADAMTS4-cleaved fragment show differential serological levels in Alzheimer’s disease, other types of dementia and non-demented controls: A cross-sectional study. PLoS ONE 2020, 15, e0234632. [Google Scholar] [CrossRef]
  29. Hilal, S.; Chai, Y.L.; Ikram, M.K.; Elangovan, S.; Yeow, T.B.; Xin, X.; Chong, J.Y.; Venketasubramanian, N.; Richards, A.M.; Chong, J.P.; et al. Markers of cardiac dysfunction in cognitive impairment and dementia. Medicine 2015, 94, e297. [Google Scholar] [CrossRef]
  30. Ng, S.; Villemagne, V.L.; Berlangieri, S.; Lee, S.T.; Cherk, M.; Gong, S.J.; Ackermann, U.; Saunder, T.; Tochon-Danguy, H.; Jones, G.; et al. Visual assessment versus quantitative assessment of 11C-PIB PET and 18F-FDG PET for detection of Alzheimer’s disease. J. Nucl. Med. Off. Publ. Soc. Nucl. Med. 2007, 48, 547–552. [Google Scholar] [CrossRef]
  31. Yamane, T.; Ishii, K.; Sakata, M.; Ikari, Y.; Nishio, T.; Ishii, K.; Kato, T.; Ito, K.; Senda, M.; Group, J.A.S. Inter-rater variability of visual interpretation and comparison with quantitative evaluation of 11C-PiB PET amyloid images of the Japanese Alzheimer’s Disease Neuroimaging Initiative (J-ADNI) multicenter study. Eur. J. Nucl. Med. Mol. Imaging 2017, 44, 850–857. [Google Scholar] [CrossRef] [PubMed]
  32. Saridin, F.N.; Hilal, S.; Villaraza, S.G.; Reilhac, A.; Gyanwali, B.; Tanaka, T.; Stephenson, M.C.; Ng, S.L.; Vrooman, H.; van der Flier, W.M.; et al. Brain amyloid β, cerebral small vessel disease, and cognition. Neurology 2020, 95, e2845–e2853. [Google Scholar] [CrossRef] [PubMed]
  33. van Veluw, S.J.; Hilal, S.; Kuijf, H.J.; Ikram, M.K.; Xin, X.; Yeow, T.B.; Venketasubramanian, N.; Biessels, G.J.; Chen, C. Cortical microinfarcts on 3T MRI: Clinical correlates in memory-clinic patients. Alzheimer’s Dement. J. Alzheimer’s Assoc. 2015, 11, 1500–1509. [Google Scholar] [CrossRef] [PubMed]
  34. Vrooman, H.A.; Cocosco, C.A.; van der Lijn, F.; Stokking, R.; Ikram, M.A.; Vernooij, M.W.; Breteler, M.M.; Niessen, W.J. Multi-spectral brain tissue segmentation using automatically trained k-Nearest-Neighbor classification. Neuroimage 2007, 37, 71–81. [Google Scholar] [CrossRef] [PubMed]
  35. de Boer, R.; Vrooman, H.A.; Ikram, M.A.; Vernooij, M.W.; Breteler, M.M.; van der Lugt, A.; Niessen, W.J. Accuracy and reproducibility study of automatic MRI brain tissue segmentation methods. Neuroimage 2010, 51, 1047–1056. [Google Scholar] [CrossRef] [PubMed]
  36. Gyanwali, B.; Shaik, M.A.; Venketasubramanian, N.; Chen, C.; Hilal, S. Mixed-Location Cerebral Microbleeds: An Imaging Biomarker for Cerebrovascular Pathology in Cognitive Impairment and Dementia in a Memory Clinic Population. J. Alzheimer’s Dis. JAD 2019, 71, 1309–1320. [Google Scholar] [CrossRef] [PubMed]
  37. Morawski, M.; Bruckner, G.; Jager, C.; Seeger, G.; Matthews, R.T.; Arendt, T. Involvement of perineuronal and perisynaptic extracellular matrix in Alzheimer’s disease neuropathology. Brain Pathol. 2012, 22, 547–561. [Google Scholar] [CrossRef]
  38. Mayer, J.; Hamel, M.G.; Gottschall, P.E. Evidence for proteolytic cleavage of brevican by the ADAMTSs in the dentate gyrus after excitotoxic lesion of the mouse entorhinal cortex. BMC Neurosci. 2005, 6, 52. [Google Scholar] [CrossRef]
  39. Wang, X.; Khalil, R.A. Matrix Metalloproteinases, Vascular Remodeling, and Vascular Disease. Adv. Pharmacol. 2018, 81, 241–330. [Google Scholar] [CrossRef]
  40. Raffetto, J.D.; Khalil, R.A. Matrix metalloproteinases and their inhibitors in vascular remodeling and vascular disease. Biochem. Pharmacol. 2008, 75, 346–359. [Google Scholar] [CrossRef]
  41. Hobeika, M.J.; Thompson, R.W.; Muhs, B.E.; Brooks, P.C.; Gagne, P.J. Matrix metalloproteinases in peripheral vascular disease. J. Vasc. Surg. 2007, 45, 849–857. [Google Scholar] [CrossRef] [PubMed]
  42. Toledo, J.B.; Arnold, S.E.; Raible, K.; Brettschneider, J.; Xie, S.X.; Grossman, M.; Monsell, S.E.; Kukull, W.A.; Trojanowski, J.Q. Contribution of cerebrovascular disease in autopsy confirmed neurodegenerative disease cases in the National Alzheimer’s Coordinating Centre. Brain 2013, 136, 2697–2706. [Google Scholar] [CrossRef] [PubMed]
  43. Lendahl, U.; Nilsson, P.; Betsholtz, C. Emerging links between cerebrovascular and neurodegenerative diseases—A special role for pericytes. EMBO Rep. 2019, 20, e48070. [Google Scholar] [CrossRef] [PubMed]
  44. Dityatev, A.; Schachner, M.; Sonderegger, P. The dual role of the extracellular matrix in synaptic plasticity and homeostasis. Nat. Rev. Neurosci. 2010, 11, 735–746. [Google Scholar] [CrossRef]
  45. Favuzzi, E.; Marques-Smith, A.; Deogracias, R.; Winterflood, C.M.; Sanchez-Aguilera, A.; Mantoan, L.; Maeso, P.; Fernandes, C.; Ewers, H.; Rico, B. Activity-Dependent Gating of Parvalbumin Interneuron Function by the Perineuronal Net Protein Brevican. Neuron 2017, 95, 639–655.e610. [Google Scholar] [CrossRef] [PubMed]
  46. Morellini, F.; Sivukhina, E.; Stoenica, L.; Oulianova, E.; Bukalo, O.; Jakovcevski, I.; Dityatev, A.; Irintchev, A.; Schachner, M. Improved reversal learning and working memory and enhanced reactivity to novelty in mice with enhanced GABAergic innervation in the dentate gyrus. Cereb. Cortex 2010, 20, 2712–2727. [Google Scholar] [CrossRef] [PubMed]
  47. Ueno, H.; Takahashi, Y.; Murakami, S.; Wani, K.; Miyazaki, T.; Matsumoto, Y.; Okamoto, M.; Ishihara, T. Component-specific reduction in perineuronal nets in senescence-accelerated mouse strains. IBRO Neurosci. Rep. 2023, 14, 111–121. [Google Scholar] [CrossRef] [PubMed]
  48. Chutinet, A.; Rost, N.S. White matter disease as a biomarker for long-term cerebrovascular disease and dementia. Curr. Treat. Options Cardiovasc. Med. 2014, 16, 292. [Google Scholar] [CrossRef]
  49. Bjerke, M.; Zetterberg, H.; Edman, A.; Blennow, K.; Wallin, A.; Andreasson, U. Cerebrospinal fluid matrix metalloproteinases and tissue inhibitor of metalloproteinases in combination with subcortical and cortical biomarkers in vascular dementia and Alzheimer’s disease. J. Alzheimer’s Dis. JAD 2011, 27, 665–676. [Google Scholar] [CrossRef]
  50. Lorenzl, S.; Buerger, K.; Hampel, H.; Beal, M.F. Profiles of matrix metalloproteinases and their inhibitors in plasma of patients with dementia. Int. Psychogeriatr. IPA 2008, 20, 67–76. [Google Scholar] [CrossRef]
Figure 1. Serum brevican concentrations in a cohort of cognitively impaired participants and those with dementia stratified by (A) Aβ positivity and (B) CeVD burden. Graph shows mean ± SEM concentration values in ng/mL, with coloured dots indicating individual measurements. CeVD data were missing for four participants. Abbreviations: Aβ, beta-amyloid; CeVD, cerebrovascular disease; SEM, standard error of the mean.
Biomolecules 14 00075 g001
Figure 2. Serum brevican concentrations in a cohort of cognitively impaired participants and those with dementia stratified by clinical diagnoses and CeVD status. Graph shows mean ± SEM concentration values in ng/mL, with coloured dots indicating individual measurements. CeVD data were missing for 2 NCI and 2 AD participants. The group differences were assessed with univariate general linear model using log-transformed serum brevican levels, adjusted for age and sex, with p-values representing ANOVA post hoc LSD tests for pairwise group comparisons. Abbreviations: AD, Alzheimer’s disease; Aβ, beta-amyloid; CeVD, cerebrovascular disease; CIND, cognitive impairment, no dementia; NCI, no cognitive impairment; SEM, standard error of the mean.
Biomolecules 14 00075 g002
Figure 3. Serum brevican concentrations in a cohort of cognitively impaired participants and those with dementia stratified by the presence of specific CeVD markers. Graph shows mean ± SEM concentration values in ng/mL, with coloured dots indicating individual measurements, stratified by (A) WMH volume, (B) lacune count, (C) infarct count, and (D) cerebral microbleeds count. WMH data were missing for two participants. CMBs data were missing for 4 participants. Abbreviations: CeVD, cerebrovascular disease; CMBS, cerebral microbleeds; SEM, standard error of the mean; WMHs, white matter hyperintensities.
Biomolecules 14 00075 g003
Table 1. Baseline demographics and disease factors of study participants.
NCICINDADVaDp-Value
Demographics
Maximum n32974623
Age, y, mean (SD)76 (4)76 (6)77 (8)75 (9)0.767
Female, n (%)21 (66)49 (51)36 (78) g8 (35) h0.001
Education, y, mean (SD)11 (5)8 (5)5 (5) a,b4 (4) a<0.001
APOE ε4 carrier, n (%)3 (9)25 (26)20 (44) f7 (30)0.01
Hypertension, n (%)23 (72)73 (75)35 (76)21 (91)0.349
Diabetes, n (%)5 (16)32 (33)10 (22)9 (39)0.126
Hyperlipidaemia, n (%)26 (81)70 (72)29 (63)19 (83)0.213
Cardiovascular diseases, n (%)1 (3)10 (11)1 (2)3 (14)0.162
Neuroimaging
Presence of ≥2 lacunes, n (%)2 (6)16 (17)3 (7) g13 (57) f,g,h<0.001
Presence of cortical infarct, n (%)2 (6)15 (16)6 (13)9 (39) f0.009
Presence of ≥2 CMBs, n (%)10 (33)24 (25)17 (40)7 (30)0.348
Higher 50th WMH, n (%)8 (25)49 (51)26 (58) f15 (68) f0.007
WMH volume, median (IQR), mL1.4 (3.9)3.7 (11.0) c5.3 (10.7) c14.6 (21.6) c0.001
Hippocampal volume, median (IQR), mL7.1 (0.9)6.3 (1.8)5.0 (1.0) c,d6.0 (1.1) c,e<0.001
Global cortical thickness, median (IQR), mm2.4 (0.2)2.3 (0.1)2.2 (0.2) c,d2.3 (0.2)<0.001
Positive Aβ PET read, n (%)4 (13)32 (33)31 (67) f,g4 (17) h<0.001
PiB-PET SUVR, median (IQR)1.1 (0.1)1.2 (0.4)1.9 (0.7)1.2 (0.3)<0.001
Elevated CeVD, n (%)15 (50)64 (66)32 (73)23 (100) f,g0.001
Serum brevican, median (IQR), ng/mL2.0 (1.1)2.2 (0.9)2.0 (1.2)2.4 (1.9)0.476
Bold, red font denotes significant p-values from Chi-square tests (gender, APOE status, and neuroimaging markers for white matter hyperintensities, lacunes, and infarct) for categorical variables and from one-way ANOVA (age and education) or Kruskal–Wallis tests (WMH volume, PiB-PET SUVR, and serum brevican) for normally distributed or skewed continuous variables, respectively. White matter hyperintensity data were missing for 1 AD and 1 VaD participant. Diabetes data were missing for 1 AD participant. Cardiovascular disease data were missing for 3 CIND and 1 VaD participants. CeVD data were missing for 1 AD participant. CMBs data were missing for 2 NCI and 3 AD participants. Hippocampal volume and cortical thickness data were missing for 16 NCI, 1 CIND, 11 AD, and 3 VaD participants. PiB-PET SUVR data were missing for 16 NCI, 11 AD, and 4 VaD participants. Abbreviations: Aβ, amyloid beta; AD, Alzheimer’s disease; CeVD, cerebrovascular disease; CIND, cognitive impairment, no dementia; CMBs, cerebral microbleeds; NCI, no cognitive impairment; SD, standard deviation; SUVR, standardised uptake value ratio; VaD, vascular dementia. a Significantly different from NCI (one-way ANOVA with post hoc Bonferroni tests p < 0.05). b Significantly different from CIND (one-way ANOVA with post hoc Bonferroni tests p < 0.05). c Significantly different from NCI (Kruskal–Wallis with post hoc Dunn’s test p < 0.05). d Significantly different from CIND (Kruskal–Wallis with post hoc Dunn’s test p < 0.05). e Significantly different from AD (Kruskal–Wallis with post hoc Dunn’s test p < 0.05). f Significantly different from NCI (Chi-square t-tests p < 0.05). g Significantly different from CIND (Chi-square t-tests p < 0.05). h Significantly different from AD (Chi-square t-tests p < 0.05).
Table 2. Associations of serum brevican with specific CeVD neuroimaging markers.
CeVD Binary Outcome Variables Using Binary Logistic Regression
Serum Brevican
(Tertiles)
WMH (>50th
Percentile)
(n = 196)
Presence of ≥2 Lacunes
(n = 198)
Presence of Cortical
Infarcts
(n = 198)
Presence of ≥2 CMBs
(n = 194)
OR (95% CI)pOR (95% CI)pOR (95% CI)pOR (95% CI)p
Model 1
Lowest2.8 (1.4–5.8)0.0051.3 (0.5–3.3)0.6260.5 (0.2–1.3)0.1641.0 (0.4–2.1)0.907
Middle1.5 (0.8–3.1)0.2351.3 (0.5–3.4)0.5500.6 (0.2–1.4)0.2071.0 (0.5–2.2)0.926
Highest1 1 1 1
Model 2
Lowest2.8 (1.4–5.8)0.0061.4 (0.5–3.7)0.5220.5 (0.2–1.4)0.1921.0 (0.4–2.1)0.958
Middle1.5 (0.8–3.1)0.2231.4 (0.5–3.7)0.4790.6 (0.2–1.5)0.2481.0 (0.5–2.2)0.909
Highest1 1 1 1
Model 3
Lowest3.0 (1.4–6.4)0.0051.1 (0.4–3.2)0.8530.4 (0.1–1.2)0.0990.8 (0.3–1.8)0.522
Middle1.6 (0.8–3.5)0.1971.4 (0.5–4.1)0.5180.3 (0.1–1.0)0.0500.9 (0.4–2.1)0.743
Highest1 1 1 1
Associations between serum brevican and specific CeVD neuroimaging markers (WMH, lacune, cortical infarcts, and CMBs) are expressed as OR values with 95% CI. Bold, red fonts denote statistically significant associations derived from binary logistic regression at p < 0.05. WMH data were missing for 2 participants. CMBs data were missing for 4 participants. Model 1: Unadjusted; Model 2: Adjusted for age and gender; Model 3: Adjusted for age, gender, hypertension, diabetes, hyperlipidaemia, cardiovascular diseases, and the other three MRI markers. Interpretation: when OR > 1 (p < 0.05), each 2-fold (1 unit of Log2 [serum brevican]) decrease in serum brevican level was associated with OR times higher likelihood of obtaining the respective cognitive outcome. Abbreviations: CeVD, cerebrovascular disease; CI, confidence interval; CMBs, cerebral microbleeds; OR, odds ratio; WMHs, white matter hyperintensities.
Disclaimer/Publisher’s Note: The statements, opinions and data contained in all publications are solely those of the individual author(s) and contributor(s) and not of MDPI and/or the editor(s). MDPI and/or the editor(s) disclaim responsibility for any injury to people or property resulting from any ideas, methods, instructions or products referred to in the content.

