Article

Effects of the Combination of the C1473G Mutation in the Tph2 Gene and Lethal Yellow Mutations in the Raly-Agouti Locus on Behavior, Brain 5-HT and Melanocortin Systems in Mice

by
Polyna D. Komleva
1,
Ghofran Alhalabi
2,
Arseniy E. Izyurov
3,
Nikita V. Khotskin
2 and
Alexander V. Kulikov
2,*
1
Department of Psychoneuropharmacology, Federal Research Center Institute of Cytology and Genetic Siberian Branch of Russian Academy of Sciences, 630090 Novosibirsk, Russia
2
Department of Genetic Collections of Neural Disorders, Federal Research Center Institute of Cytology and Genetic Siberian Branch of Russian Academy of Sciences, 630090 Novosibirsk, Russia
3
Department of Genetics of Industrial Microorganisms, Federal Research Center Institute of Cytology and Genetic Siberian Branch of Russian Academy of Sciences, 630090 Novosibirsk, Russia
*
Author to whom correspondence should be addressed.
Biomolecules 2023, 13(6), 963; https://doi.org/10.3390/biom13060963
Submission received: 4 April 2023 / Revised: 26 May 2023 / Accepted: 5 June 2023 / Published: 8 June 2023
(This article belongs to the Special Issue Recent Advances in Neuropharmacology and Brain Physiology)

Abstract

:
Tryptophan hydroxylase 2 (TPH2) is the key and rate-limited enzyme of serotonin (5-HT) synthesis in the brain. The C1473G mutation in the Tph2 gene results in a two-fold decrease in enzyme activity in the mouse brain. The lethal yellow (AY) mutation in the Raly-Agouti locus results in the overexpression of the Agouti gene in the brain and causes obesity and depressive-like behavior in mice. Herein, the possible influences of these mutations and their combination on body mass, behavior, brain 5-HT and melanocortin systems in mice of the B6-1473CC/aa. B6-1473CC/AYa, B6-1473GG/aa are investigated. B6-1473GG/AYa genotypes were studied. The 1473G and AY alleles increase the activity of TPH2 and the expression of the Agouti gene, respectively, but they do not alter 5-HT and 5-HIAA levels or the expression of the genes Tph2, Maoa, Slc6a4, Htr1a, Htr2a, Mc3r and Mc4r in the brain. The 1473G allele attenuates weight gain and depressive-like immobility in the forced swim test, while the AY allele increases body weight gain and depressive-like immobility. The combination of these alleles results in hind limb dystonia in the B6-1473GG/AYa mice. This is the first evidence for the interaction between the C1473G and AY mutations.

1. Introduction

The enzyme tryptophan hydroxylase 2 (TPH2) hydroxylates L-tryptophan to 5-hydroxy tryptophan as the first and rate-limited stage of serotonin (5-HT) synthesis in the mammalian brain [1,2]. Tph2 gene knockout [3,4,5] or the TPH2 inhibitor p-chlorophenylalanine [6] dramatically reduce the brain’s 5-HT level. The C1473G mutation in the Tph2 gene, which results in the P447R substitution in the enzyme molecule, causes a two-fold decrease in TPH2 activity in the mouse brain [7,8,9]. Taking into account the association between mutations affecting TPH2 activity and the risk of psychiatric diseases (see reviews [10,11]), it seems surprising that the 1473G allele does not appear to produce any visible effect on adaptive behavior in laboratory mice [12,13]. However, a high (wild-type) TPH2 activity seems to be important for mouse adaptation, since mice carrying the mutant 1473G allele, which decreases the activity of TPH2, are absent in wild mouse populations [14]. Mutations reducing the activities of aromatic amino acid hydroxylases are associated with dystonia [15]. In our preliminary study, we observed hind limb dystonia in young, 4-week-old mice of the 1473GG genotype. However, this movement disorder disappeared in adult 12-week-old mice (see the Supplementary Table S1).
The lethal yellow (AY) mutation is a large deletion in the Raly-Agouti locus that deletes the Raly gene-coding domain and puts the Agouti gene under the control of the Raly gene promoter [16,17]. It results in an ectopic expression of the agouti protein in the brain [18,19,20]. The agouti protein is a natural inhibitor of the MC3R and MC4R melanocortin receptors [21,22]. It is hypothesized that blockade of these receptors in the hypothalamus by the agouti protein causes obesity in heterozygous AY/a mice [17,23]. Moreover, the AY allele increased depressive-like immobility in the forced swim and tail suspension tests [24]. It can be expected that the combination of the C1473G and AY alleles will increase the severity of the behavioral disorders caused by each of these mutations separately.
The aim of the present study is to compare the effects of the C1473G and AY mutations in combination with the separate effects of each mutation on the behavior, brain 5-HT and melanocortin systems in mice. For this purpose, we compare the body mass, behavior, 5-HT metabolism and expression of the 5-HT-related (Tph2, Maoa, Slc6a4, Htr1a, Htr2a) and melanocortin-related (Agouti, Mc3r, Mc4r) genes in the brains of B6-1473CC/aa, B6-1473CC/AYa, B6-1473GG/aa and B6-1473GG/AYa mice.

2. Materials and Methods

2.1. Animals

The study was conducted in strict accordance with the recommendations of Directive 2010/63/EU of the European Parliament and of the Council of 22 September 2010 on the protection of animals used for scientific purposes and was approved by the Committee on the Ethics of Animal Experiments of the Russian National Center of Genetic Resources of Laboratory Animals of Institute of Cytology and Genetics, Siberian Branch of the Russian Academy of Sciences. The mice were bred in the Collective Centre of Animal Genetic Resources (supported by the basic research projects No. FWNR-2022-0023 and RFMEFI62117X0015).
The experiments were carried out on SPF-state 12-week-old males of the B6-1473CC/aa (n = 8), B6-1473CC/AYa (n = 8), B6-1473GG/aa (n = 8) and B6-1473GG/AYa (n = 8) genotypes. The B6-1473CC/aa (50%) and B6-1473CC/AYa (50%) genotypes were bred by crossing B6-1473CC/aa females and B6-1473CC/AYa males. The B6-1473GG/aa and B6-1473GG/AYa genotypes were bred in two steps. In the first step, the B6-1473GC/AYa (50%) and B6-1473GC/aa (50%) genotypes were bred by crossing B6-1473GG/aa females and B6-1473CC/AYa males. In the second step, the B6-1473CG/ AYa males were crossed with B6-1473GG/aa females, and consequently, the B6-1473GG/aa (25%), B6-1473GG/AYa (25%), B6-1473CG/aa (25%) and B6-1473CG/AYa (25%) genotypes were received. The B6-1473CC/aa, B6-1473CC/AYa, B6-1473GG/aa and B6-1473GG/AYa mice used in this experiment have similar genetic backgrounds (C57BL/6) and differ only in the 1473C, 1473G, a and AY alleles. The aa and AY/a genotypes were detected by the color of their fur, which is yellow in AY/a mice and black in a/a mice [17]. The 1473C and 1473G alleles were detected via PCR with the allele-specific primers (see Section 2.6).
After weaning, males of the same genotype were kept in groups of four per cage (Optimice, Animal Care Systems, Inc., Centennial, CO, USA) at a temperature of 24 ± 2 °C, humidity of 45–50%, and an artificial 14:10 (day/night) photoperiod with daybreak and sunset at 01:00 and 15:00, respectively. The mice were fed with sterile food and water ad libitum. The mice were tested at 12 weeks of age. Two days before the first test, the animals were isolated in cages of the same type and size to reduce group effect. We used a rapid test battery with 1-day intervals between tests [25]. The test sequence in these batteries was the following: open field, elevated plus maze, forced swim and tail suspension tests [26].
Two days after the tail suspension test, the animals were euthanized via carbon dioxide asphyxiation followed by decapitation. The hypothalamus, frontal cortex, hippocampus, striatum and midbrain were rapidly dissected, frozen in liquid nitrogen, and stored at −80 °C.

2.2. Open Field Test

The open field test was carried out on a brightly illuminated, white, opaque plastic arena 60 cm in diameter with a 30 cm wall. We used transmitted (inverted) lighting to maximize the mouse/arena contrast [27]. The light from two 12 W halogen lamps, each placed 60 cm beneath the semitransparent floor, was transmitted through the arena to a web camera. The mouse was placed at the wall, and its movements were automatically tracked for 5 min [27]. The EthoStudio software automatically calculates two behavioral traits: the distance travelled during the test (m), and the time (%) spent in the round part that is 30 cm in diameter (the center) [27]. At the same time, the numbers of vertical postures and grooming bouts were recorded by an experienced rater [27]. The arena was cleaned with wet and dry napkins after each test.

2.3. Elevated Plus-Maze Test

The elevated plus-maze test was carried out in an apparatus made of gray plastic with two closed and two open arms (length 30 cm and width 5 cm). The closed arms were boarded with plastic walls measuring 15 cm. The apparatus was elevated 65 cm above the floor and dimly illuminated with diffuse lighting. A mouse was placed in the apparatus center, facing a closed arm, and its movement was automatically tracked for 5 min using the Microsoft Kinect 1 3D sensor. Depth data from the sensor contain the distances (m) from each pixel of the object and each pixel of the maze to the sensor. The height threshold algorithm marks pixels higher or lower than the threshold, associated with the animal (1) or background (0), respectively [24,28]. The main advantage of the 3 D sensor over standard digital video is that the former can track an animal of any color and in any part of the maze (including the closed arms). The EthoStudio software automatically calculates three traits: the distance travelled during the test (m) and the time (%) spent in the closed and open arms, based on the rates of the number of animal-associated pixels in these parts to the total number of animal-associated pixels in the maze. The apparatus was cleaned with wet and dry napkins after each test.

2.4. Forced Swim Test

The mice were placed in a clear glass tank (diameter, 18 cm; height, 30 cm) filled up to 2/3 of its volume with water at a temperature of 25 °C for 6 min. The water tank was placed on a semitransparent platform and brightly illuminated (300 lx) with two halogen lamps (35 W) placed 40 cm below the platform [29]. Behavior in the FS test was evaluated for the last four minutes of the test using the immobility time (%). The water was changed after each test.

2.5. Tail Suspension Test

In the present study, the tail suspension test was used to measure the number and accumulated time of hind limb clasping [30]. Using adhesive tape, mice were fixed by their tails and hooked onto a horizontal bar placed 30 cm above the table surface. The number and accumulated time of hind limb clasping were registered by an experienced rater.

2.6. Genotyping for C1473G Polymorphism

Using protease K treatment for 1.5 h, followed by a phenol–chloroform extraction, samples of DNA were isolated from the tail tips of the mice and diluted to a concentration of 10 ng/μL. The DNA samples were genotyped according to the published protocol [7,8,9] with two positive control primers (5′-TTTGACCCAAAGACGACCTGCTTGCA and 5′-TGCATGCTTACTAGCCAACCATGAGACA) providing a 523 bp PCR product and with either 1473C (5′-CAGAATTTCAATGCTCTGCGTGTGGG)- or 1473G allele (5′-CAGAATTTCAATGCTXTGCGTGTGGC)-specific primers providing a 307 bp PCR product [9,10]. The PCR products were resolved via electrophoresis in 2% agarose gel, stained with ethidium bromide and photographed with a digital camera.

2.7. Tissue Preparation

We used the same brain samples for the total RNA extraction and for the assays of serotonin (5-HT) and 5-hydroxyindoleacetic acid (5-HIAA) levels and theTPH2 activity. For these purposes, the structure was homogenized in 250 μL (hypothalamus), 300 μL (cortex and striatum) or 400 μL (hippocampus and midbrain) of 50 mM Tris HCl, pH 7.6, and 1 mM dithiotreitol, using a motor-driven grinder (Z359971, Sigma-Aldrich, Darmstadt, Germany). One aliquot of 50 μL of the homogenate was mixed with 150 μL of 0.6 M HClO4 for the 5-HT and 5-HIAA extractions (see Section 2.8). Another aliquot of 100 μL of the homogenate was mixed with Trizol reagent (Bio Rad, Hercules, CA, USA) for the total RNA extraction (see Section 2.10). The rest of the homogenate was spun for 15 min at 12,700 rpm (+4 °C). The clear supernatant was transferred into a clear tube and stored at −80 °C until the TPH2 activity assay (see Section 2.9).

2.8. Assay of 5-HT and 5-HIAA Levels

The mix of 50 μL of homogenate with 150 μL of 0.6 M HClO4 (see Section 2.7) was spun for 15 min at 12,700 rpm (+4 °C). The pellet was dissolved in 1 mL of 0.1 M NaOH and used for protein determination via the Bradford method (Bio Rad, USA). The clear supernatant was diluted twofold with ultrapure water, and the levels of 5-HT and 5-HIAA were assayed in the diluted supernatant on a Luna C18(2) column (5 μm particle size, L × I.D. length 100 mm and diameter 4.6 mm, Phenomenex, Torrance, CA, USA) via electrochemical detection (750 mV, DECADE II™ Electrochemical Detector; Antec, Alphen aan den Rijn, The Netherlands), the glassy carbon flow cell (VT-03 cell 3mm GC sb; Antec, The Netherlands), a CBM-20 A system controller, the LC-20AD solvent delivery unit, a SIL-20 A autosampler and a DGU-20A5R degasser (Shimadzu Corporation, Kyoto, Japan). The mobile phase (pH = 3.2) contained 6.53 g of KH2PO4, 100 μL of 0.5M Na2EDTA, 150 mg of 1-octanesulfonic acid sodium salt (Sigma, Burlington, MA, USA) and methanol (13% volume; Vektor Ltd., Moscow, Russia) [24].
The standard mixes containing 1, 2 and 3 ng of 5-HT and 5-HIAA were repeatedly assayed throughout the entire procedure and used to plot the calibration curves for each substance. The peak areas were estimated using LabSolution LG/GC software, version 5.54 (Shimadzu Corporation, Kyoto, Japan), and calibrated against calibrated curves for the corresponding standards. The 5-HT and 5-HIAA contents were expressed in ng/mg protein, as assayed via the Bradford method and described elsewhere [23]. All data are the means of three replications.

2.9. Assay of TPH Activity

A 15 μL aliquot of pure supernatant (see Section 2.7) was incubated for 15 min at 37 °C in the presence of L-tryptophan (Sigma-Aldrich, Darmstadt, Germany) (0.4 mM), cofactor 6-methyl-5,6,7,8-tetrahydropteridine (Sigma-Aldrich, Darmstadt, Germany) (0.3 mM), decarboxylase inhibitor m-hydroxybenzylhydrazine (Sigma-Aldrich, Darmstadt, Germany) (0.3 mM), catalase (Sigma-Aldrich, Darmstadt, Germany) (5 μ) and 1 mM dithiothreitol in a final volume of 25 μL. The reaction was stopped with 75 μL 0.6 M HClO4 and centrifuged for 15 min at 12700 rpm. The clear supernatant was diluted twofold with ultrapure water, and the 5-HTP concentration was determined in the diluted supernatant via high performance liquid chromatography (see Section 2.8), using standards of 25, 50 and 100 pmoles of 5-HTP (Sigma, USA). Another 10 μL aliquot of supernatant was mixed with 90 μL of 0.1 M NaOH for protein quantitation via the Bradford method (Bio Rad, Hercules, CA, USA), according to the manufacturer’s protocol. The TPH activity was expressed as pmoles 5-HTP formed per minute per mg of protein, measured according to the Bradford method.

2.10. mRNA Level Assay by qPCR

The total mRNA was extracted from the mixture of homogenate and Trizol reagent (see Section 2.7) according to the manufacturer’s protocol and treated with RNAase-free DNAase (Promega, Madison, WI, USA) according to the manufacturer’s protocol. Its concentration was assayed with a Nanodrop 2000 (Waltham, MA, USA) and it was diluted to a final concentration of 125 ng/μL. The cDNA was synthesized using a random hexanucleotide primer and an R01 Kit (Biolabmix, Novosibirsk, Russia). The mRNA levels of the target genes were assayed via qPCR, using the set of selective primers (Table 1) and an R401 Kit (Sintol, Moscow, Russia) according to the protocol of the manufacturer (95 °C 5 min; (95 °C, 15 s; annealing temperature, 60 s; 82 °C, 2 s; fluorescence registration) × 40 cycles). The threshold cycles were calibrated with the external standards containing 25, 50, 100, 200, 400, 800, 1600, 3200 and 6400 copies of genomic DNA extracted from a C57BL/6 mouse liver. The gene expression was presented as a relative number of cDNA copies calculated on 100 copies of Polr2 cDNA as an internal standard [24,31,32].

2.11. Statistics

All data were tested using Kolmogorov’s test and met the assumption of normality. Data were presented as the mean ± SEM, and they were analyzed via one-way ANOVA. If the one-way ANOVA detected an intergroup difference, the data were reanalyzed using a two-way ANOVA with “C1473G” and “AY” as independent factors, including their interaction. Post hoc analyses were carried out using Fisher’s LSD multiple comparison test when appropriate. Statistical significance was set at p < 0.05.

3. Results

3.1. Effects of C1473G and AY Mutations on Body Mass

The males of the four genotypes differed in body mass (F(3,28) = 9.56, p < 0.001). The two-way ANOVA revealed the effects of the “C1473G” (F(1,28) = 8.9, p = 0.006) and “AY” (F(1,28) = 19.69, p < 0.001) factors but not of their interaction (F(1,28) < 1). The AY allele increases the body mass in B6-1473CC/AYa and B6-1473GG/AYa mice compared to the B6-1473CC/aa and B6-1473GG/aa mice, while the 1473G allele decreases the body mass in B6-1473GG/aa mice compared to B6-1473CC/aa mice (p = 0.023) (Figure 1).

3.2. Effects of C1473G and AY Mutations on Mouse Behavior in the Open Field Test

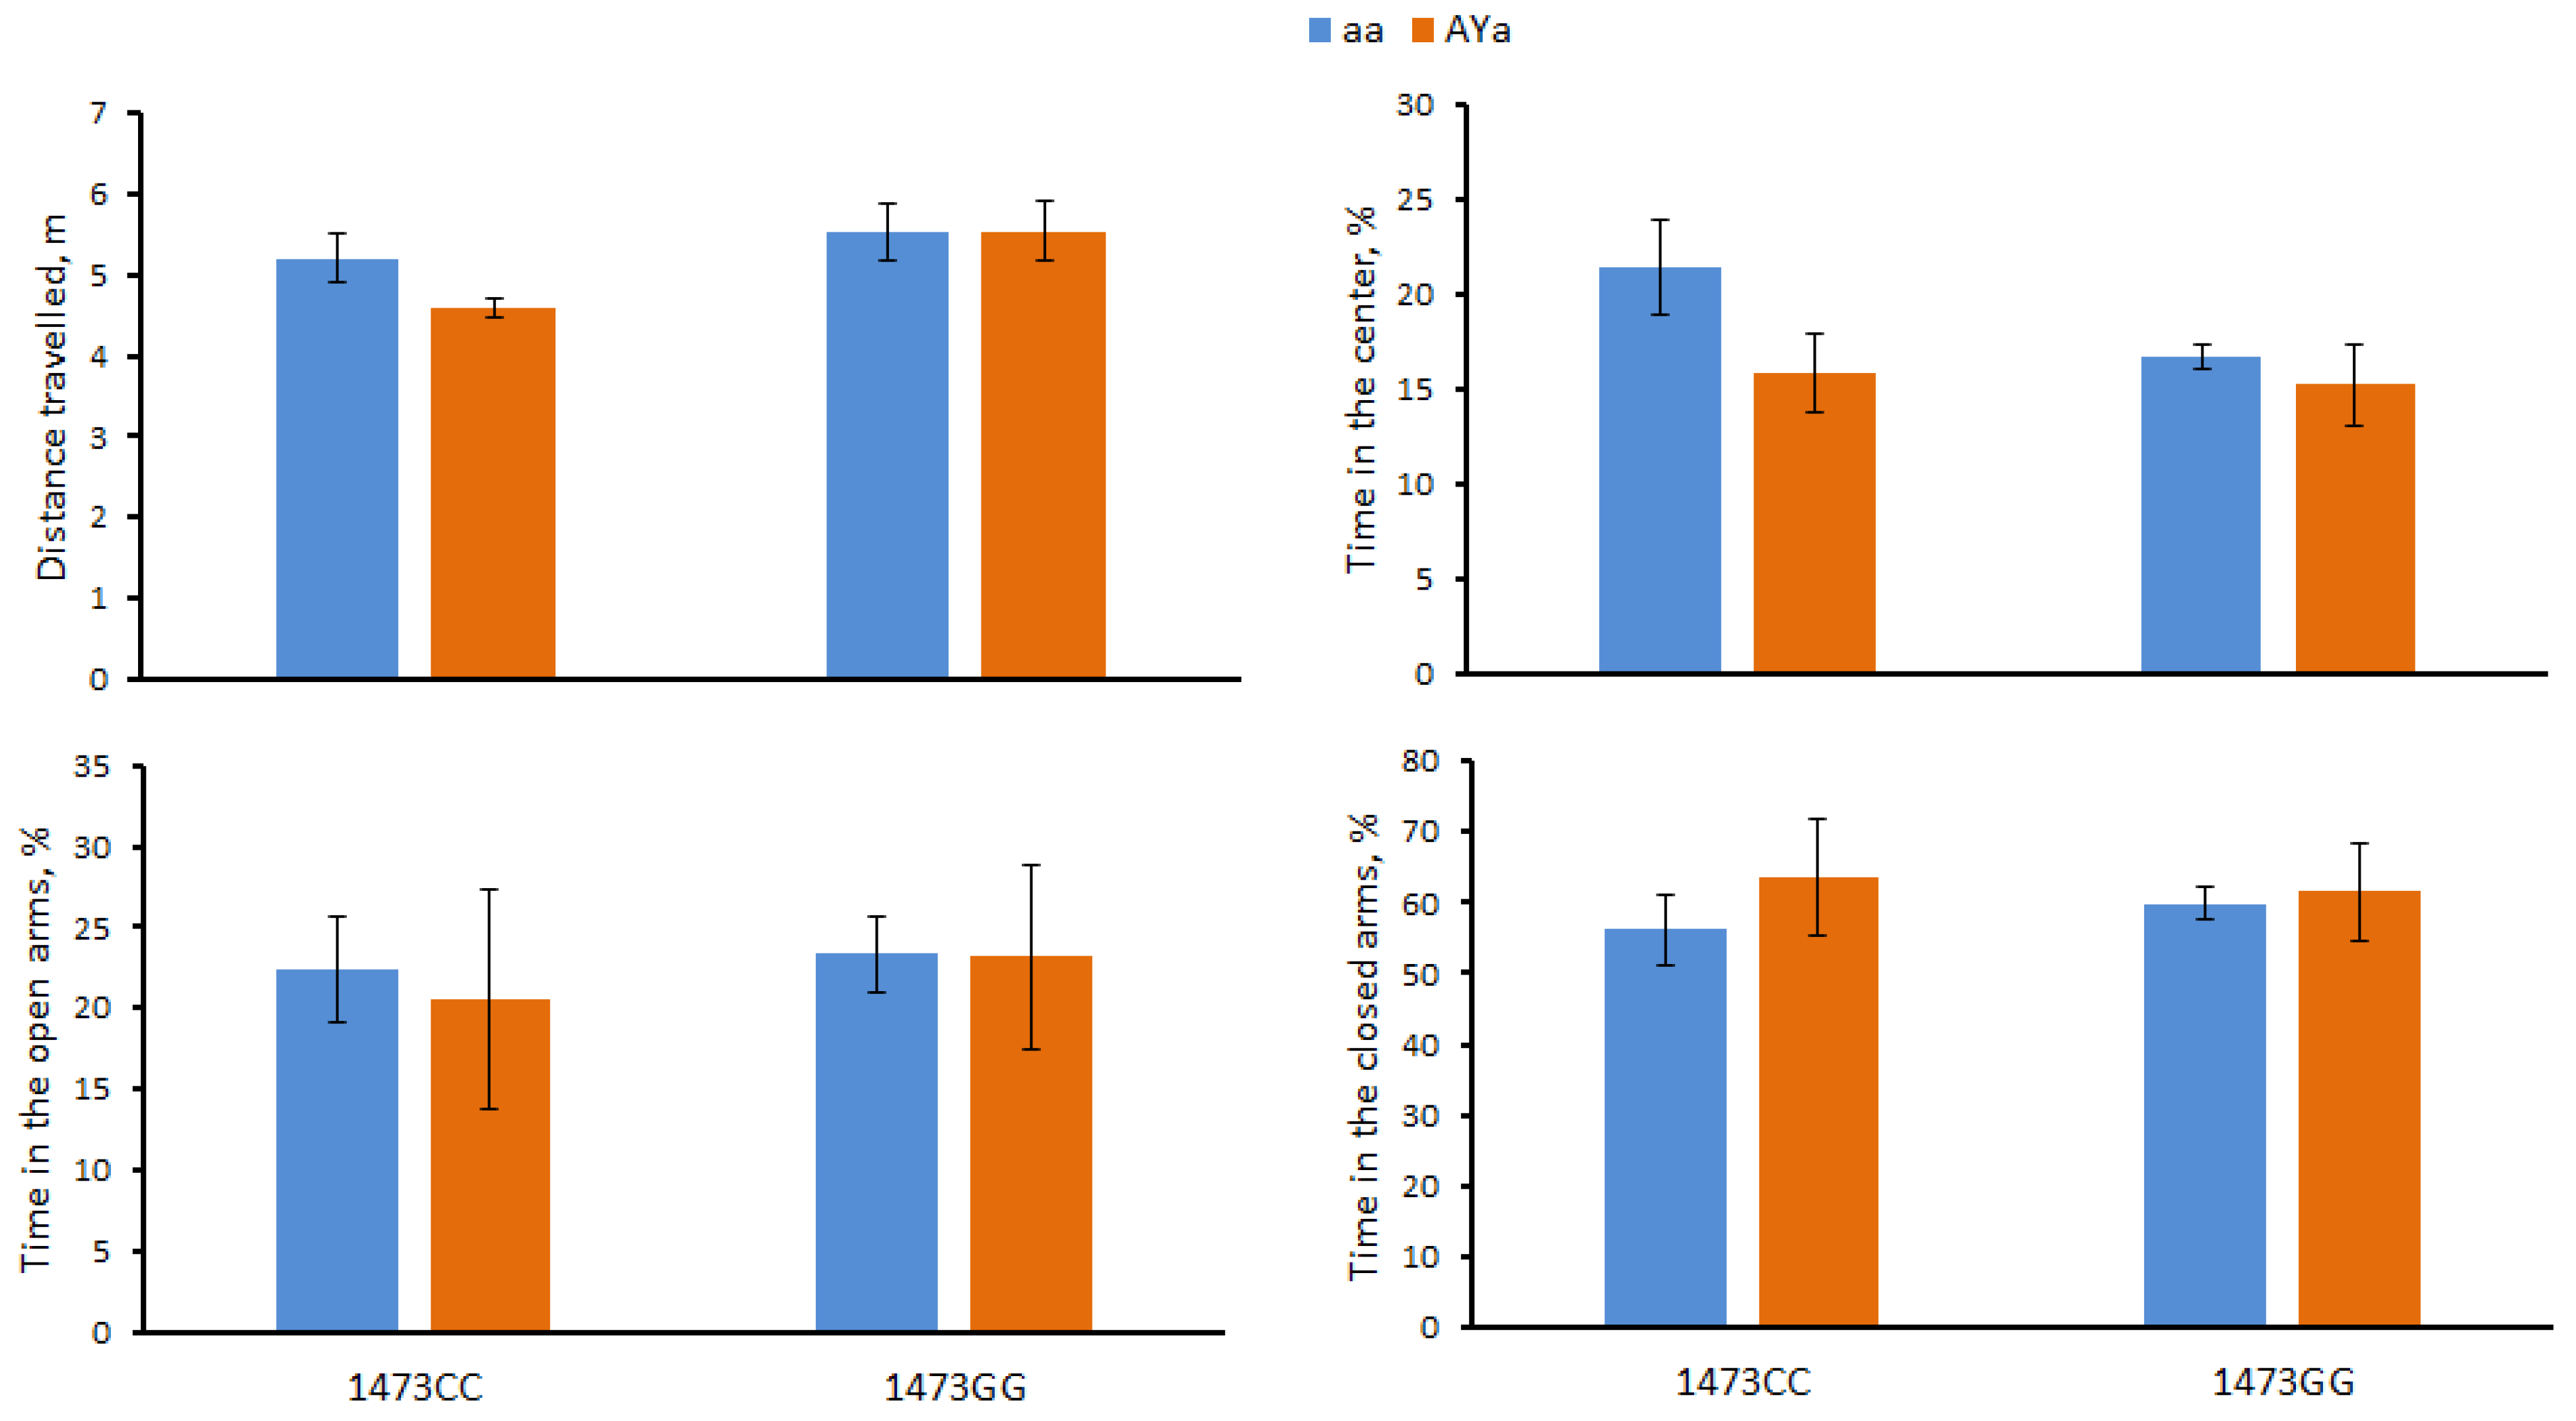
The males of the four genotypes differed in the distance travelled (F(3,28) = 3.04, p = 0.045) and the amount of fecal boli (F(3,28) = 2.95, p = 0.05) but not in the time spent in the center (F(3,28) < 1) or the number of vertical postures (F(3,28) = 1.54, p = 0.23). The two-way ANOVA revealed the effects of the “C1473G” factor (F(1,28) = 8.52, p = 0.007) but not of the “AY” factor (F(1,28) < 1) or of the factors’ interaction (F(1,28) < 1) on the distance travelled: the 1473GG mice ran more distance compared to the 1473CC mice (Figure 2). Regarding a marked effect of the “AY” factor (F(1,28) = 6.33, p = 0.018) but not of the “C1473G” factor (F(1,28) = 2.28, p = 0.14) and of their interaction (F(1,28) < 1) on the amount of fecal boli, the AY allele increased this trait expression (Figure 2).

3.3. Effects of C1473G and AY Mutations on Mouse Behavior in the Elevated Plus-Maze Test

The males of the four genotypes did not differ in the distance travelled (F(3,28) = 2.2, p = 0.11), time spent in the center (F(3,28) = 2.02, p = 0.13), in open arms (F(3,28) < 1) and in closed (F(3,28) < 1) arms in the elevated plus-maze test (Figure 3).

3.4. Effects of C1473G and AY Mutations on Mouse Behavior in the Forced Swim Test

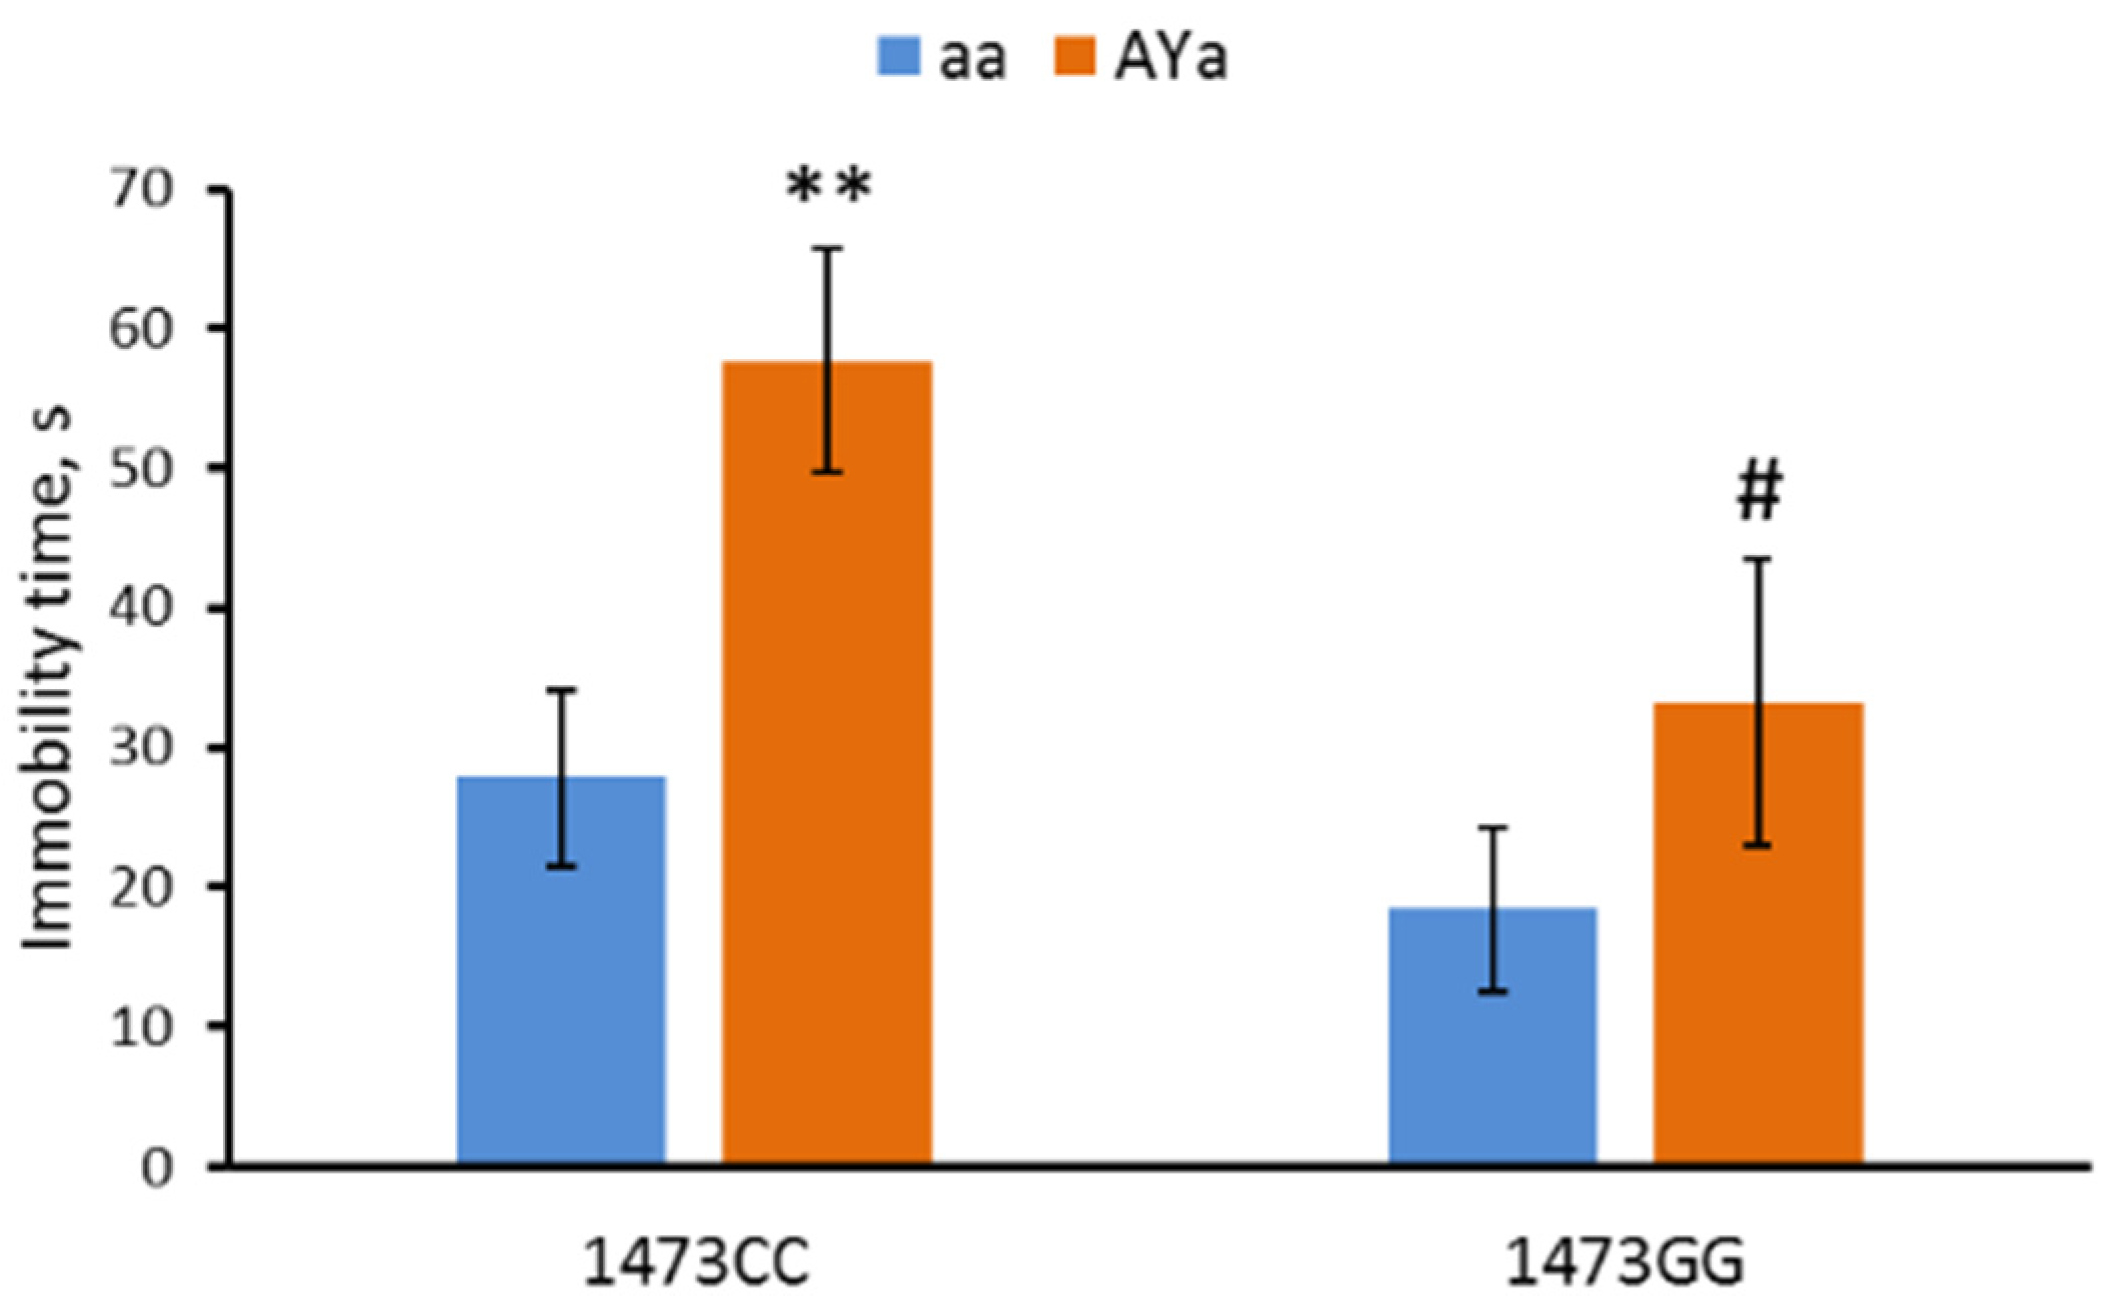
The males of the four genotypes differed in immobility time (F(3,28) = 4.6, p = 0.01) in the forced swim test. Marked effects of the “C1473G” (F(1,28) = 4.68, p = 0.04) and “AY” (F(1,28) = 8.19, p = 0.008) factors, but not of their interaction (F(1,28) < 1), on this trait were revealed. The C1473G mutation decreases the immobility time, while the AY mutation increases the immobility time (Figure 4).

3.5. Effects of C1473G and AY Mutations on the Hind Limb Clasping in the Tail Suspension Test

The males of the four genotypes differed in the amount of hind limb clasping (F(3,28) = 5.29, p = 0.005) and the accumulated time spent hind limb clasping (F(3,28) = 4.09, p = 0.015) in the tail suspension test. The two-way ANOVA revealed marked effects of the interaction of the “C1473G” factor (amount, F(1,28) = 8.98, p = 0.0023; time, F(1,28) = 8.32, p = 0.0031) and “C1473G” × “AY” factors (amount, F(1,28) = 6.49, p = 0.008; time, F(1,28) = 3.15, p = 0.048) on these traits. The combination of these two mutations dramatically increases both the amount of hind limb clasping and the accumulated time spent hind limb clasping in the B6-1473GG/AYa mice (Figure 5).

3.6. Effects of C1473G and AY Mutations on 5-HT, 5-HIAA Levels and the 5-HIAA/5-HT Turnover Rate in the Brain

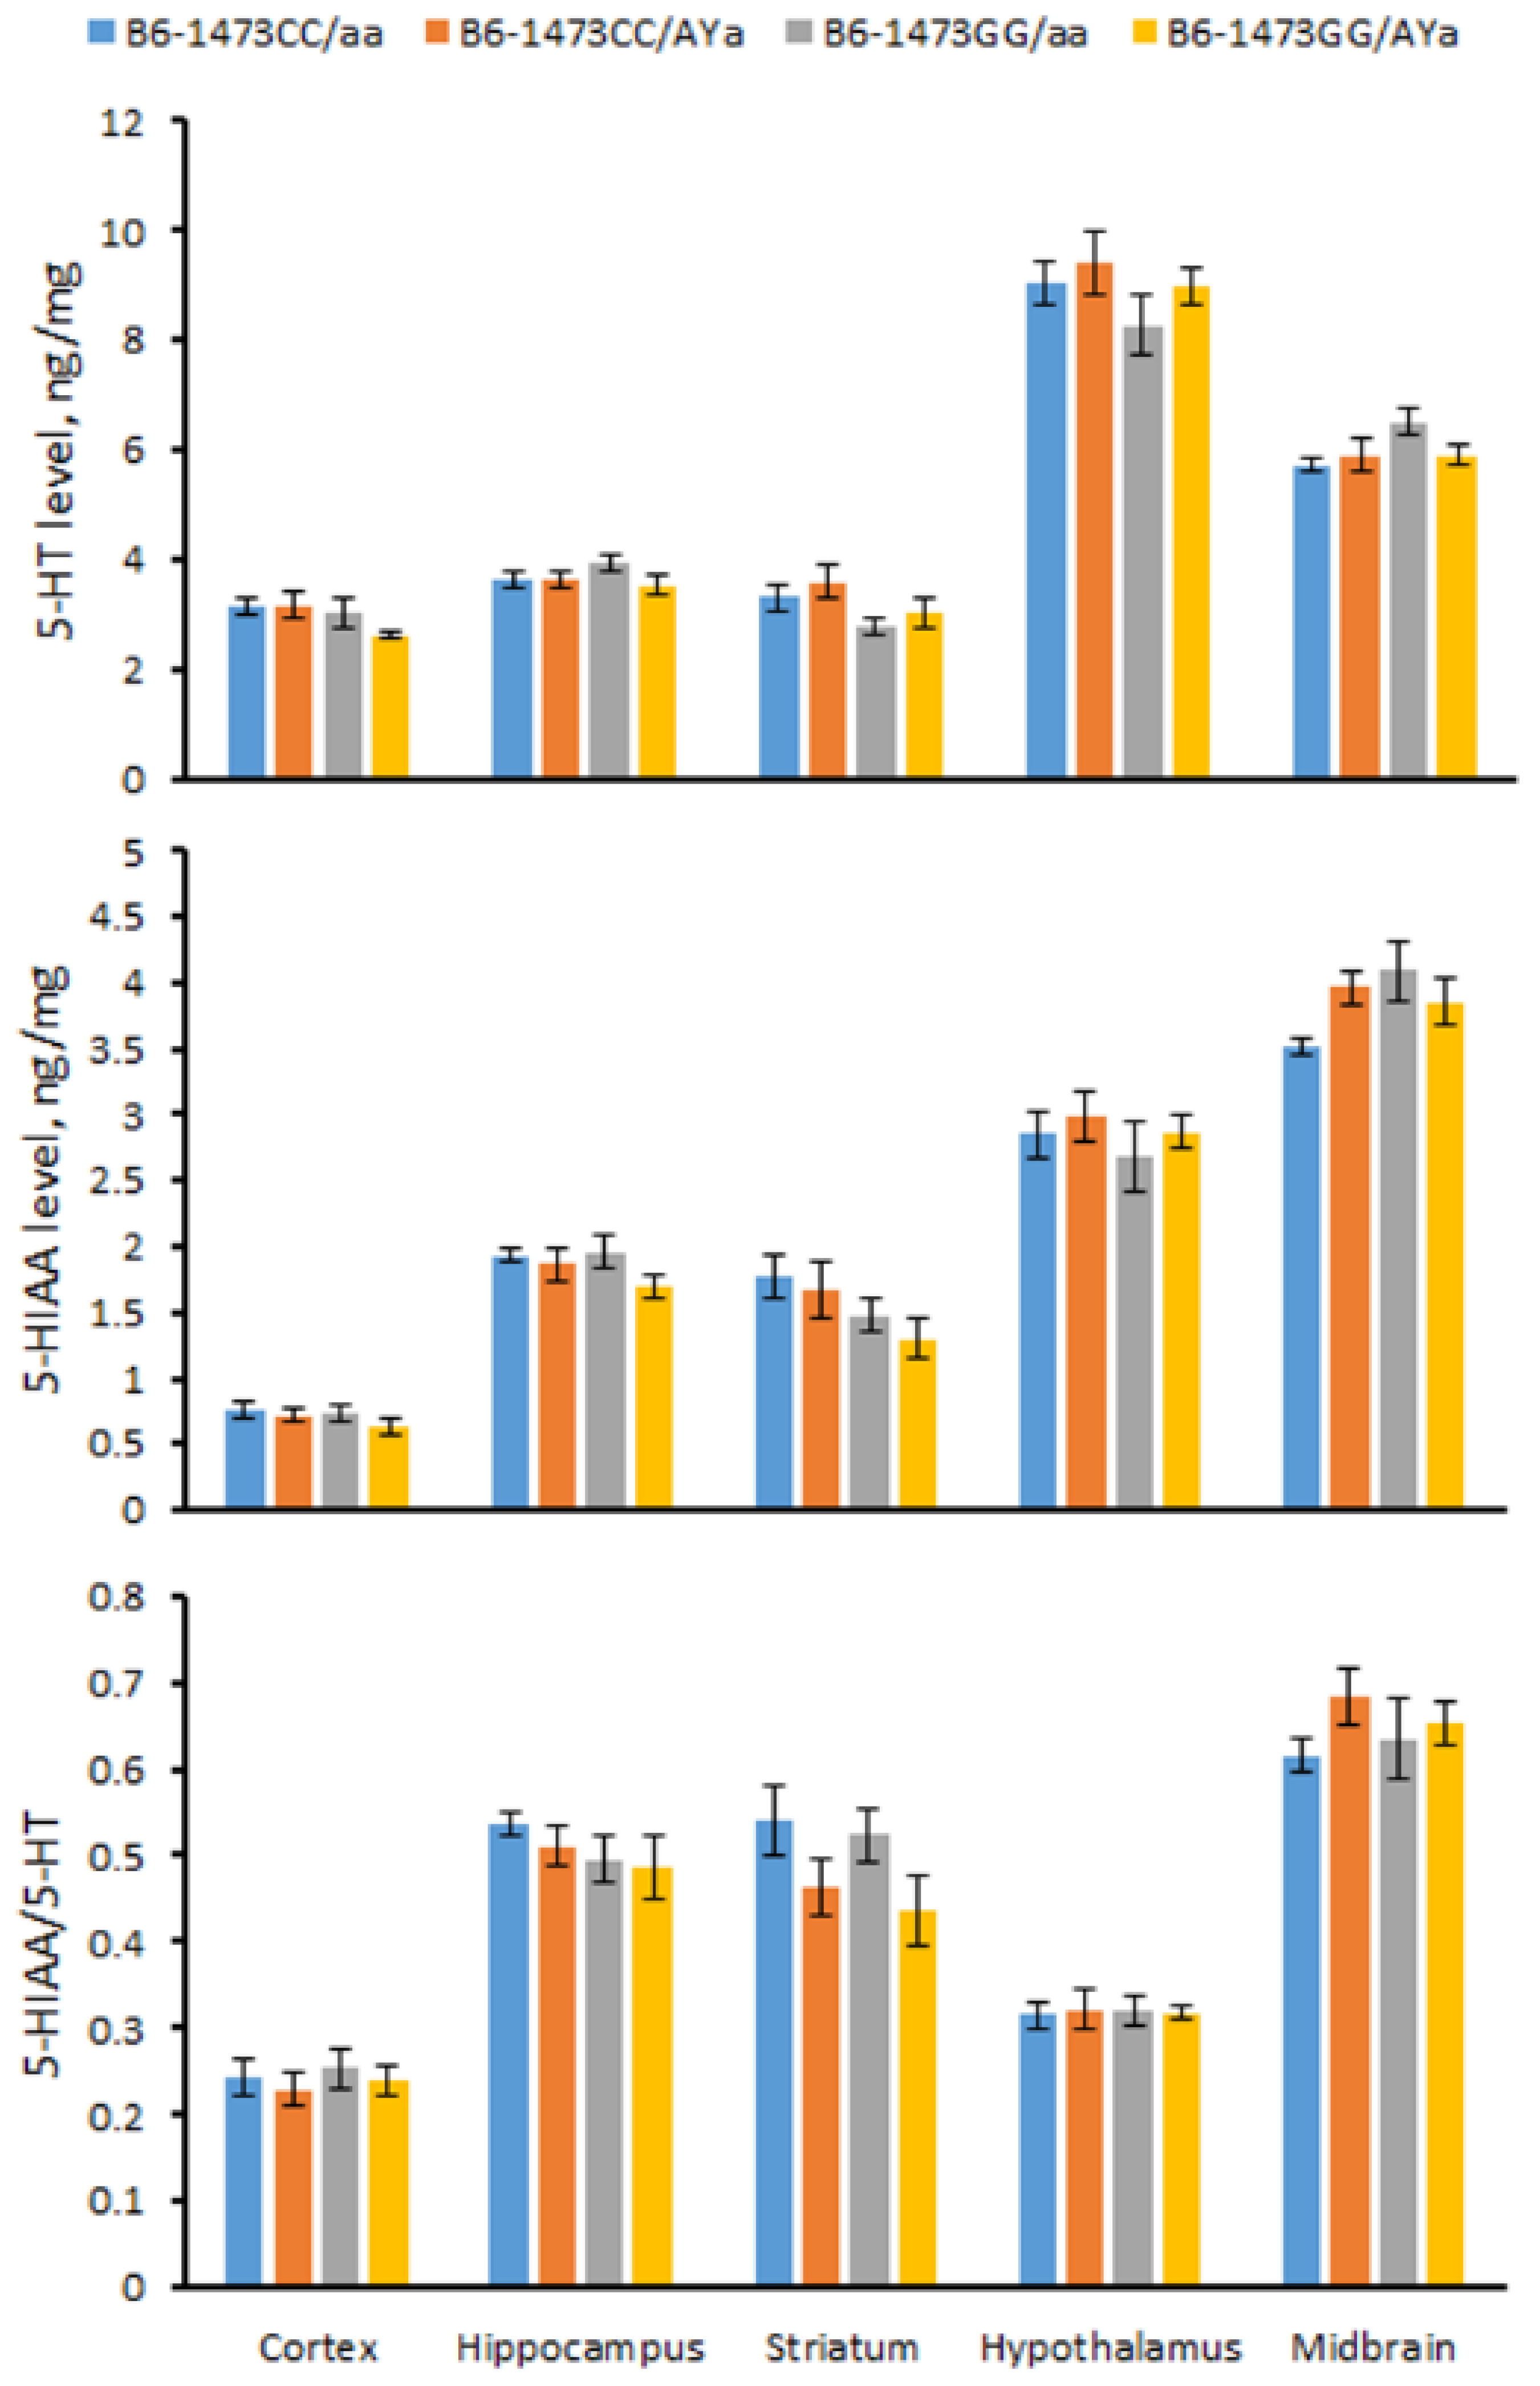
The males of the four genotypes did not differ in 5-HT, 5-HIAA levels and the turnover rate of 5-HIAA/5-HT in the cortex (5-HT, F(3,28) = 1.86, p = 0.16; 5-HIAA, F(3,28) < 1; 5-HIAA/5-HT, F(3,28) < 1), hippocampus (5-HT, F(3,28) = 1.28, p = 0.30; 5-HIAA, F(3,28) = 1.37, p = 0.27; 5-HIAA/5-HT, F(3,28) < 1), striatum (5-HT, F(3,28) = 2.07, p = 0.13; 5-HIAA, F(3,28) = 1.67, p = 0.20; 5-HIAA/5-HT, F(3,28) = 1.84, p = 0.16), hypothalamus (5-HT, F(3,28) = 1.04, p = 0.39; 5-HIAA, F(3,28) < 1; 5-HIAA/5-HT, F(3,28) < 1) and midbrain (5-HT, F(3,28) = 2.26, p = 0.10; 5-HIAA, F(3,28) = 2.24, p = 0.11; 5-HIAA/5-HT, F(3,28) < 1) (Figure 6).

3.7. Effects of C1473G and AY Mutations on the TPH2 Activity in the Brain

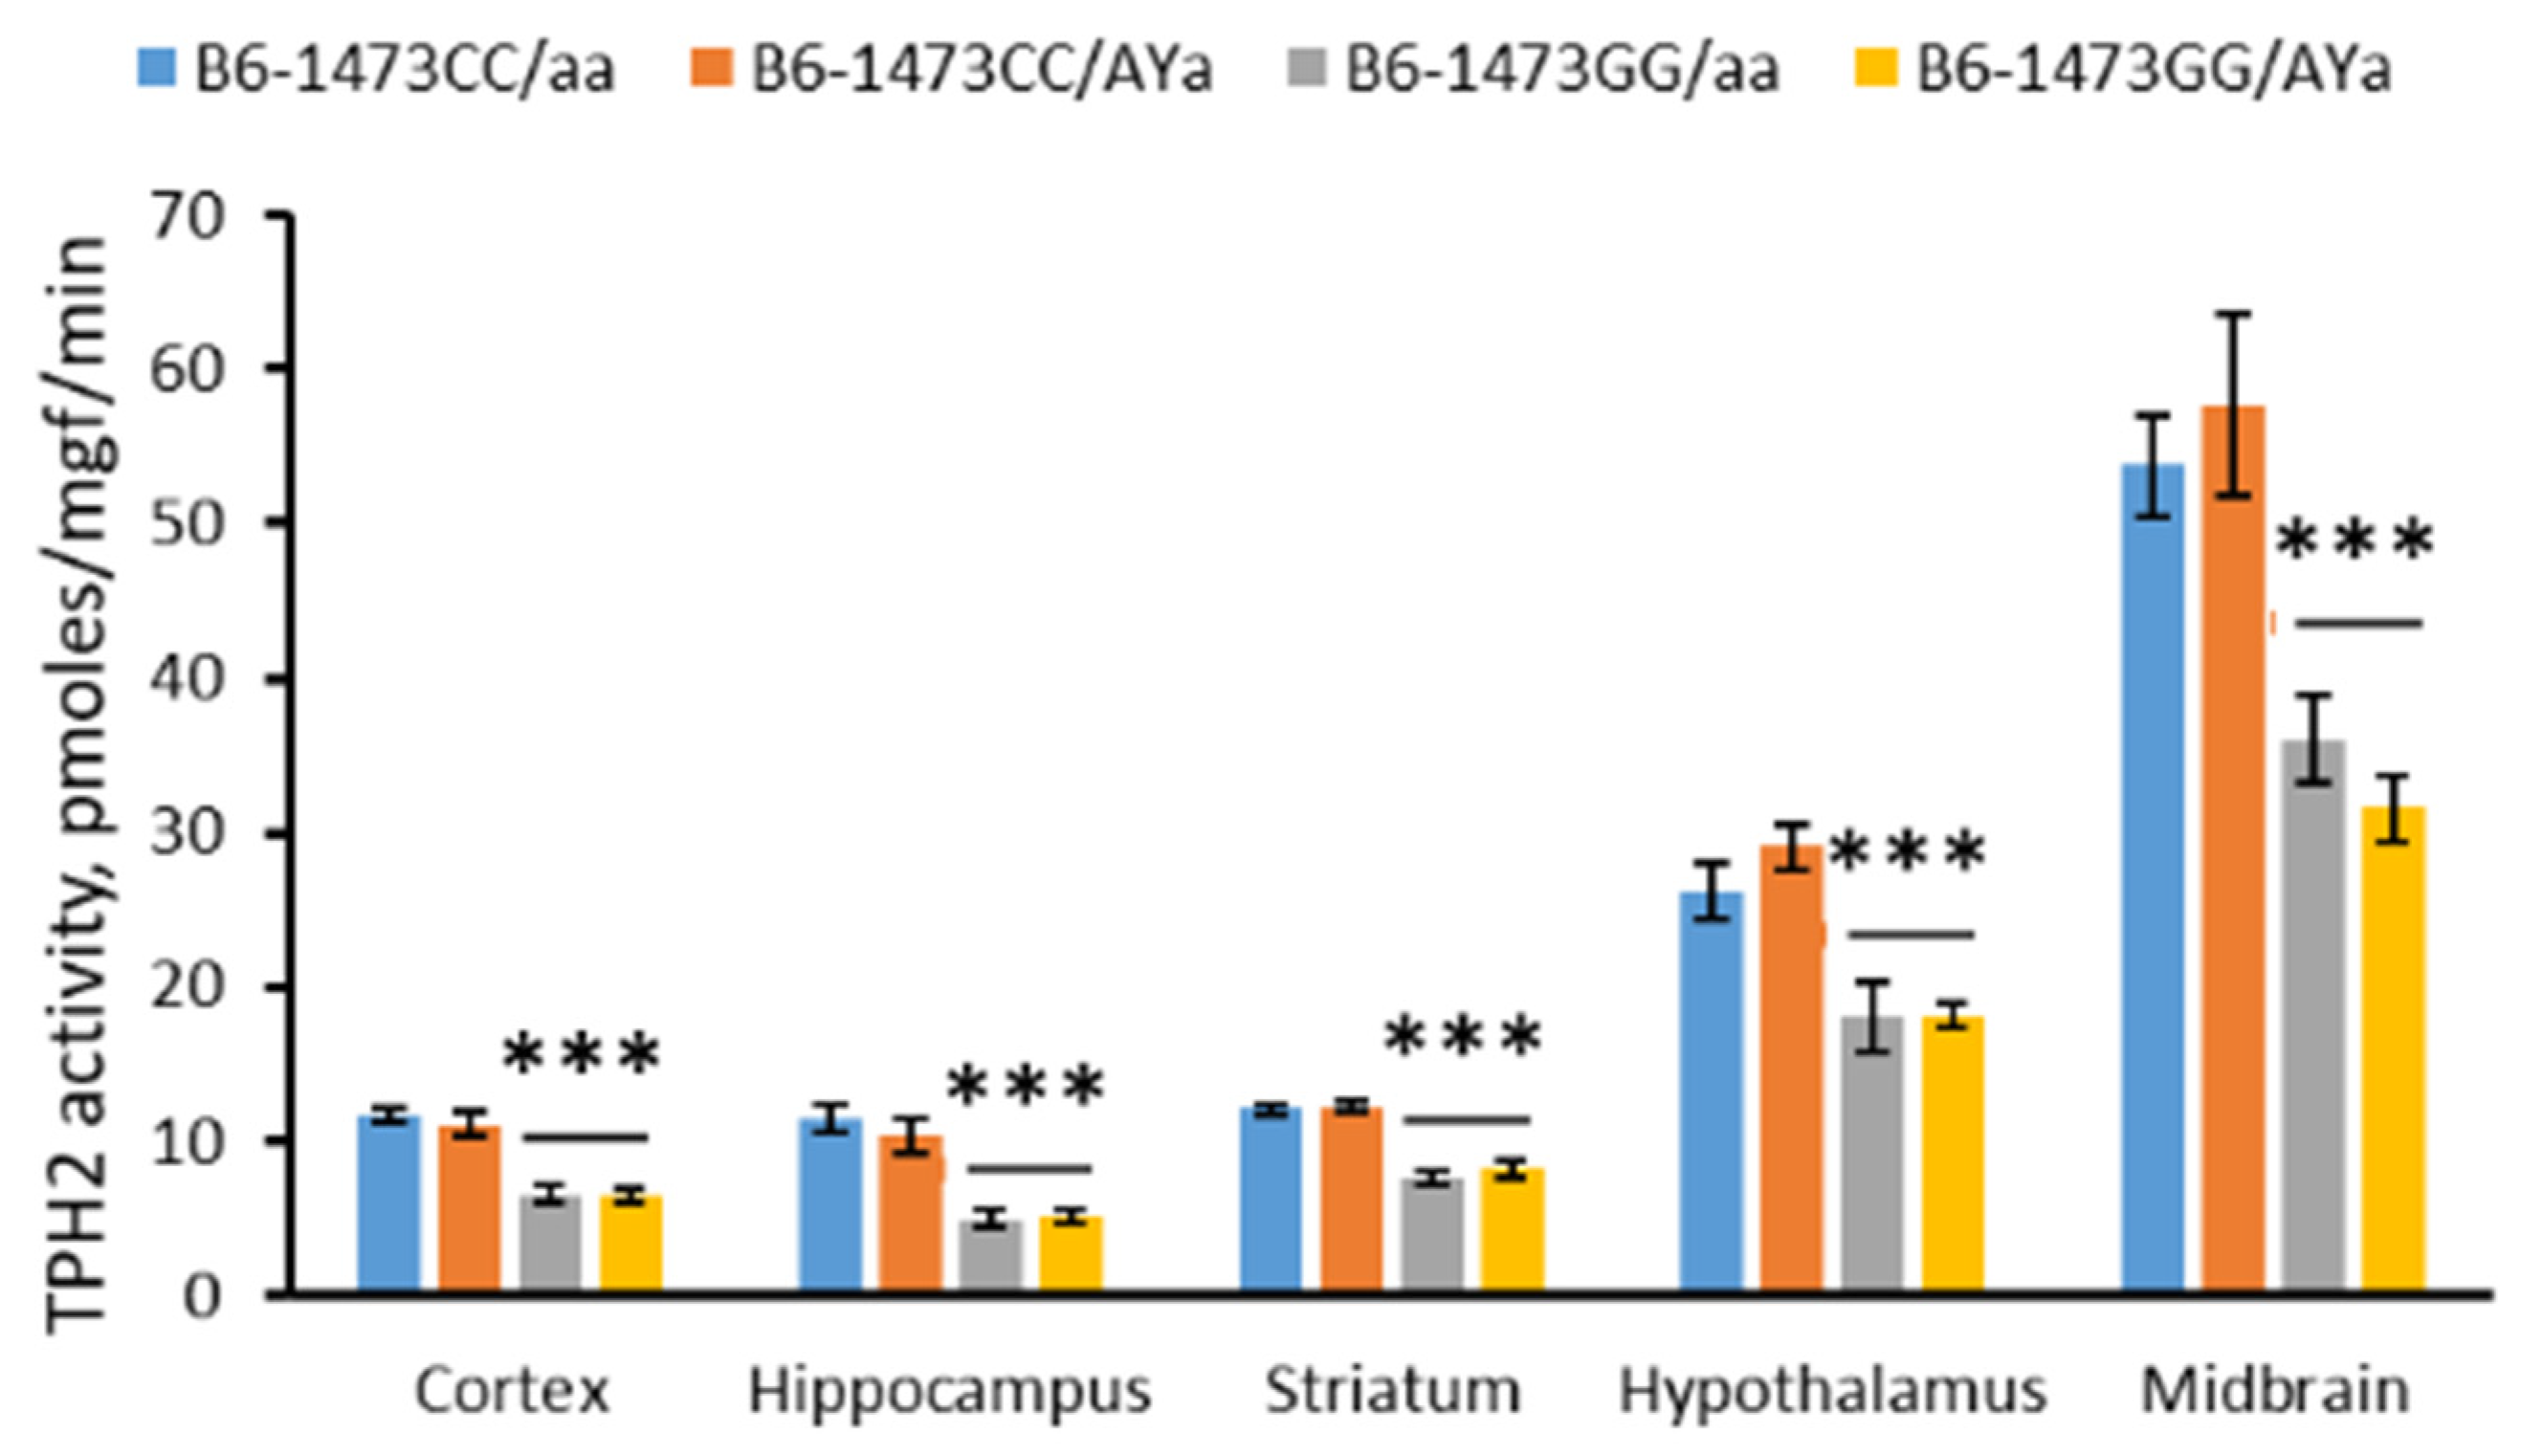
The males of the four genotypes differed in TPH2 activity in cortex (F(3,28) = 23.28, p < 0.001), hippocampus (F(3,28) = 18.37, p < 0.001), striatum (F(3,28) = 33.81, p < 0.001), hypothalamus (F(3,28) = 11.44, p < 0.001) and midbrain (F(3,28) = 11.3, p < 0.001). The two-way ANOVA revealed a marked effect of the “C1473G” factor on the enzyme activity in the cortex (F(1,28) = 69.22, p < 0.001), hippocampus (F(1,28) = 54.2, p < 0.001), striatum (F(1,28) = 100.29, p < 0.001), hypothalamus (F(1,28) = 32.94, p < 0.001) and midbrain (F(1,28) = 32.16, p < 0.001). The TPH2 activity in these structures in mice with the 1473CC genotype was higher compared to mice with the 1473GG genotype (Figure 7). At the same time, no effects of the “AY” factor (F(1,28) < 1) or the factors’ interaction (F(1,28) < 1) were shown.

3.8. Effects of C1473G and AY Mutations on mRNA Levels of Tph2, Maoa, Slc6a4, Htr1a, Htr2a, Agouti, Mc3r and Mc4r Genes in the Brain

The males of the four genotypes did not differ in mRNA levels of Tph2, Maoa, Slc6a4, Htr1a, Htr2a, Mc3r and Mc4r genes in the cortex, hippocampus, striatum, hypothalamus, and midbrain (Table 2). At the same time, significant intergroup differences in the Agouti genes’ mRNA levels in these structures were shown (Table 2). The two-way ANOVA revealed a significant effect of the “AY” factor on Agouti gene expression in the cortex (F(1,28) = 20.54, p < 0.001), hippocampus (F(1,28) = 121.84, p < 0.001), striatum (F(1,28) = 92.79, p < 0.001), hypothalamus (F(1,28) = 72.11, p < 0.001) and midbrain (F(1,28) = 242.62, p < 0.001). This gene expression in these structures in mice with the AYa genotype was higher compared to mice with the aa genotype (Table 2). At the same time, no effects of the “C1473G” factor (F(1,28) < 1) or the factors’ interaction (F(1,28) < 1) on Agouti gene expression in these structures were shown.

4. Discussion

The AY mutation increases the body mass [17,23,24] and depressive-like immobility in the forced swim test [24,33,34]. However, this mutation did not affect the brain 5-HT system [24]. The C1473G mutation decreases brain TPH2 activity [8,9], but it does not seem to affect the behavior of mice in the widely used laboratory tests such as the open field, elevated plus-maze, and forced swim tests [12,13,35]. Recently this mutation was associated with an increase in hind limb dystonia in young, but not adult, B6-1473GG mice (Supplementary Table S1). It is hypothesized that the combination of the C1473G and AY mutations will increase the severity of behavioral disorders caused by each of these mutations separately.
The main aim of the present study was to compare the effects of the combination of the C1473G and AY mutations on body mass, behavior and the 5-HT and melanocortin systems in the brain with the effects of each of the two mutations. For this purpose, the four congenic mouse lines of the B6-1473CC/aa, B6-1473CC/AYa, B6-1473GG/aa and B6-1473GG/AYa genotypes were bred. It was confirmed that the AY mutation caused the ectopic overexpression of the Agouti gene in the brain [20] and increased body mass and depressive-like behavior in the forced swim test [24].
A new result of this study is that the 1473G allele decreases body mass and depressive-like immobility in the forced swim test. In other words, the 1473G and AY alleles have opposite effects on these traits. Moreover, no statistically significant effect of the interaction of these alleles on body mass and depressive-like immobility was shown. Therefore, the 1473G and AY alleles regulate these traits by means of different and independent molecular mechanisms.
The α-, β- and γ- melanocyte-stimulating hormones receptors stimulate energy expenditure and reduce eating via the hypothalamic melanocortin 3 and 4 (MC3R and MC4R) [36,37,38,39,40]. The agouti protein is a natural inhibitor of the MC3R and MC4R receptors [20,21]. Usually, this protein is not expressed in the brain; however, the AY mutation puts the Agouti gene under the promoter of the ubiquitously expressing Rally gene [17] and causes its ectopic overexpression in the brain [18,19,20] and this study. The agouti protein inhibits the hypothalamic MC3R and MC4R receptors and reduces energy expenditure and increases eating [17].
5-HT increases eating via the 5-HT1A and 5-HT2B receptors on arcuate neurons [41]. The Tph2 gene knockout that dramatically decreases brain 5-HT level reduces body mass in Tph2Ko mice compared to wild-type mice [4,5,42,43]. Moreover, the Tph2 gene knockout increases the expression of the Mc4r gene in the hypothalamus [41], which can also reduce eating and body weight gain. Here, it was found that the 1473G allele also reduces body mass. Although the reduction in TPH2 activity caused by the 1473G allele is more moderate and is not accompanied with any alterations to the Mc3r and Mc4r receptors in the hypothalamus, it seems to be sufficient to reduce body weight gain.
There is an association between obesity and depressive disorders [44,45,46,47]. It can be hypothesized that obesity is the cause of the increase in depressive-like immobility observed in the forced swim test in AY/a mice [24]. Indeed, some authors report that the obesity caused by the leptin receptor gene (Lepr) knockout increases depressive-like immobility in Leprdb/Leprdb mice [48,49]. However, a relationship between obesity and depression seems to be more complex, and other authors do not show any increase in depressive-like behavior in these mice [50].
The relationship between TPH2 activity and depressive-like behavior is obscure. There are two commonly used indexes positively correlating to depressive-like behavior: the duration of immobility in the forced swim and tail suspension tests [51]. The effects of the TPH2 deficiency on these indexes are rather contradictory [12]: the Tph2 gene knockout can both increase [52] and decrease [4] the immobility time, and the 1473G allele can both decrease [9] and have no effect on [13] the immobility time in the forced swim test. The G1449A mutation in the Tph2 gene, which reduces the TPH2 activity by 80%, increases immobility time in the tail suspension test [53,54,55]. However, other authors did not report this trait alteration in Tph2 gene knockout mice [52] and in mice homozygous for the 1473G allele [35]. In the present study, the 1473G allele not only decreases immobility time in the forced swim test but also attenuates the increase in this trait caused by the AY mutation.
Dystonia is a symptom of the tyrosine hydroxylase deficiency. Hind limb clasping in mice suspended by the tail is a model of dystonia [30]. Hind limb clasping was recently also found in 3–4-week-old B6-1473GG mice, while adult mice of this genotype do not show hind limb dystonia (Supplement Table S1). The most intriguing finding in the present study is the statistically significant effect of the “C1473G” and “AY” factors’ interaction on the hind limb clasping rate and duration. Although the 1473G and AY alleles separately did not show hind limb dystonia, the combination of these combination resulted in a high level of expression of this trait in adult B6-1473GG/AYa mice. Therefore, the AY mutation can aggravate the negative effect (dystonia) of the C1473G mutation. At the present time, the molecular mechanism of the interaction of these two mutations unknown: no alterations in the brain 5-HT system distinguishing the B6-1473GG/AYa and B6-1473GG/aa mice have been found. As previously mentioned, possible causes of hind limb dystonia could be deficiencies in tyrosine hydroxylase or its natural cofactor, 5,6,7,8-tetrahydrobiopterin [30]. Therefore, alterations in the tyrosine hydroxylase activity and/or 5,6,7,8-tetrahydrobiopterin availability may be expected in mice heterozygous for the AY allele. However, this hypothesis requires additional experimental verification.
The 1473G allele is eliminated from wild mouse populations by the forces of natural selection [14]. The present study provides one hypothetical mechanism for this elimination. Although the 1473G allele in the SPF conditions does not alter physiological functions and behavior, in extremal conditions or in combinations with other adverse mutations (for example AY), this allele causes hind limb dystonia that can decrease mouse adaptation in wild populations.

5. Conclusions

The present work is a logical development of studies concerning the effects of the AY [24] and C1473G [11] mutations in the Raly-Agouti locus and the Tph2 gene, respectively, on the mouse brain and behavior. Here, the effects of the combination of these mutations on body mass, behavior and the brain 5-HT and melanocortin systems in B6-1473GG/AYa mice were compared to the effects of each of these mutations separately in B6-1473CC/aa, B6-1473CC/AYa and B6-1473GG/aa mice. The following results were obtained:
  • As expected, the AY allele increased body mass and depressive-like immobility in the forced swim test.
  • The 1473G allele decreased body mass and depressive-like immobility and increased locomotor activity in the open field test.
  • No effect of the AY allele on the 5-HT system and no effect of the 1473G allele on the melanocortin system in the brain were observed.
  • A marked effect of the combination of the AY and 1473G alleles on hind limb dystonia was revealed. Although these alleles do not cause hind limb dystonia separately, their combination results in a high level of expression of this trait in adult B6-1473GG/AYa mice.
This result is the first evidence for the interaction between the C1473G and AY mutations.

Supplementary Materials

The following supporting information can be downloaded at: https://www.mdpi.com/article/10.3390/biom13060963/s1, Table S1. Hind limbs clasping in young and adult males B6-1473CC and B6-1473GG mice.

Author Contributions

Conceptualization, A.V.K. and N.V.K.; methodology, A.V.K.; validation, A.V.K., N.V.K. and P.D.K.; formal analysis, A.V.K.; investigation, N.V.K., P.D.K., G.A. and A.E.I.; data curation, N.V.K.; writing—original draft preparation, A.V.K.; writing—review and editing, N.V.K. and P.D.K.; visualization, N.V.K. and P.D.K.; supervision, A.V.K.; project administration, A.V.K.; funding acquisition, A.V.K. All authors have read and agreed to the published version of the manuscript.

Funding

Russian Science Foundation: grant N 21-15-00035.

Institutional Review Board Statement

The study was conducted in accordance with the Directive 2010/63/EU of the European Parliament and of the Council of 22 September 2010 on the protection of animals used for scientific purposes, and approved by the Institutional Ethics Committee of the Institute of Cytology and Genetics Russian Academy of Sciences (protocol N 98 of 3 November 2021).

Informed Consent Statement

Not applicable.

Data Availability Statement

Not applicable.

Conflicts of Interest

The authors declare no conflict of interest.

References

  1. Walther, D.J.; Peter, J.U.; Bashammakh, S.; Hörtnagl, H.; Voits, M.; Fink, H.; Bader, M. Synthesis of serotonin by a second tryptophan hydroxylase isoform. Science 2003, 299, 76. [Google Scholar] [CrossRef] [PubMed]
  2. Walther, D.J.; Bader, M. A unique central tryptophan hydroxylase isoform. Biochem. Pharmacol. 2003, 66, 1673–1680. [Google Scholar] [CrossRef] [PubMed]
  3. Gutknecht, L.; Waider, J.; Kraft., S.; Kriegebaum, C.; Holtmann, B.; Reif, A.; Schmitt, A.; Lesch, K.P. Deficiency of brain 5-HT synthesis but serotonergic neuron formation in Tph2 knockout mice. J. Neural. Transm. 2008, 115, 1127–1132. [Google Scholar] [CrossRef]
  4. Savelieva, K.V.; Zhao, S.; Pogorelov, V.M.; Rajan, I.; Yang, Q.; Cullinan, E.; Lanthorn, T.H. Genetic disruption of both tryptophan hydroxylase genes dramatically reduces serotonin and affects behavior in models sensitive to antidepressants. PLoS ONE 2008, 3, e3301. [Google Scholar] [CrossRef] [PubMed] [Green Version]
  5. Alenina, N.; Kikic, D.; Todiras, M.; Mosienko, V.; Qadri, F.; Plehm, R.; Boyé, P.; Vilianovitch, L.; Sohr, R.; Tenner, K.; et al. Growth retardation and altered autonomic control in mice lacking brain serotonin. Proc. Natl. Acad. Sci. USA 2009, 106, 10332–10337. [Google Scholar] [CrossRef] [Green Version]
  6. Kulikov, A.V.; Osipova, D.V.; Naumenko, V.S.; Terenina, E.; Mormède, P.; Popova, N.K. A pharmacological evidence of positive association between mouse intermale aggression and brain serotonin metabolism. Behav. Brain Res. 2012, 233, 113–119. [Google Scholar] [CrossRef]
  7. Zhang, X.; Beaulieu, J.M.; Sotnikova, T.D.; Gainetdinov, R.R.; Caron, M.G. Tryptophan hydroxylase-2 controls brain serotonin synthesis. Science 2004, 305, 217. [Google Scholar] [CrossRef] [PubMed]
  8. Kulikov, A.V.; Osipova, D.V.; Naumenko, V.S.; Popova, N.K. Association between Tph2 gene polymorphism, brain tryptophan hydroxylase activity and aggressiveness in mouse strains. Genes Brain Behav. 2005, 4, 482–485. [Google Scholar] [CrossRef]
  9. Osipova, D.V.; Kulikov, A.V.; Popova, N.K. C1473G polymorphism in mouse tph2 gene is linked to tryptophan hydroxylase-2 activity in the brain, intermale aggression, and depressive-like behavior in the forced swim test. J. Neurosci. Res. 2009, 87, 1168–1174. [Google Scholar] [CrossRef]
  10. Popova, N.K.; Kulikov, A.V. Targeting tryptophan hydroxylase 2 in affective disorder. Expert Opin. Ther. Targets 2010, 14, 1259–1271. [Google Scholar] [CrossRef]
  11. Ottenhof, K.W.; Sild, M.; Lévesque, M.L.; Ruhé, H.G.; Booij, L. TPH2 polymorphisms across the spectrum of psychiatric morbidity: A systematic review and meta-analysis. Neurosci. Biobehav. Rev. 2018, 92, 29–42. [Google Scholar] [CrossRef] [PubMed]
  12. Kulikova, E.A.; Kulikov, A.V. Tryptophan hydroxylase 2 as a therapeutic target for psychiatric disorders: Focus on animal models. Expert Opin. Ther. Targets 2019, 23, 655–667. [Google Scholar] [CrossRef]
  13. Koshimizu, H.; Hirata, N.; Takao, K.; Toyama, K.; Ichinose, T.; Furuya, S.; Miyakawa, T. Comprehensive behavioral analysis and quantification of brain free amino acids of C57BL/6J congenic mice carrying the 1473G allele in tryptophan hydroxylase-2. Neuropsychopharmacol. Rep. 2019, 39, 56–60. [Google Scholar] [CrossRef] [PubMed]
  14. Osipova, D.V.; Kulikov, A.V.; Mekada, K.; Yoshiki, A.; Moshkin, M.P.; Kotenkova, E.V.; Popova, N.K. Distribution of the C1473G polymorphism in tryptophan hydroxylase 2 gene in laboratory and wild mice. Genes Brain Behav. 2010, 9, 537–543. [Google Scholar] [CrossRef] [PubMed]
  15. Calvo, A.C.; Scherer, T.; Pey, A.L.; Ying, M.; Winge, I.; McKinney, J.; Haavik, J.; Thöny, B.; Martinez, A. Effect of pharmacological chaperones on brain tyrosine hydroxylase and tryptophan hydroxylase 2. J. Neurochem. 2010, 114, 853–863. [Google Scholar] [CrossRef]
  16. Perry, W.L.; Copeland, N.G.; Jenkins, N.A. The molecular basis for dominant yellow agouti coat color mutations. BioEssays 1994, 16, 705–707. [Google Scholar] [CrossRef]
  17. Boston, B.A.; Blaydon, K.M.; Varnerin, J.; Cone, R.D. Independent and additive effects of central POMC and leptin pathways on murine obesity. Science 1997, 278, 1641–1644. [Google Scholar] [CrossRef]
  18. Miller, M.W.; Duhl, D.M.; Vrieling, H.; Cordes, S.P.; Ollmann, M.M.; Winkes, B.M.; Barsh, G.S. Cloning of the mouse agouti gene predicts a secreted protein ubiquitously expressed in mice carrying the lethal yellow mutation. Genes Dev. 1993, 7, 454–467. [Google Scholar] [CrossRef] [Green Version]
  19. Klebig, M.L.; Wilkinson, J.E.; Geisler, J.G.; Woychik, R.P. Ectopic expression of the agouti gene in transgenic mice causes obesity, features of type II diabetes, and yellow fur. Proc. Natl. Acad. Sci. USA 1995, 92, 4728–4732. [Google Scholar] [CrossRef] [Green Version]
  20. Izyurov, A.E.; Plyusnina, A.V.; Kulikova, E.A.; Kulikov, A.V.; Khotskin, N.V. Lethal yellow mutation causes anxiety, obsessive-compulsive behavior and affects the brain melanocortin system in males and females of mice. Curr. Protein Pept. Sci. 2023, 24, 329–338. [Google Scholar] [CrossRef]
  21. Lu, D.; Willard, D.; Patel, I.R.; Kadwell, S.; Overton, L.; Kost, T.; Luther, M.; Chen, W.; Woychik, R.P.; Wilkison, W.O.; et al. Agouti protein is an antagonist of the melanocyte-stimulating-hormone receptor. Nature 1994, 371, 799–802. [Google Scholar] [CrossRef] [PubMed]
  22. Sohn, J.W. Network of hypothalamic neurons that control appetite. BMB Rep. 2015, 48, 229–233. [Google Scholar] [CrossRef] [PubMed]
  23. Bazhan, N.M.; Yakovleva, T.V.; Kazantseva, A.Y.; Makarova, E.N. Exaggerated anorexigenic response to restraint stress in A(y) mice is associated with elevated CRFR2 mRNA expression in the hypothalamus. Physiol. Behav. 2013, 120, 19–25. [Google Scholar] [CrossRef]
  24. Khotskin, N.V.; Plyusnina, A.V.; Kulikova, E.A.; Bazhenova, E.Y.; Fursenko, D.V.; Sorokin, I.E.; Kolotygin, I.; Mormede, P.; Terenina, E.E.; Shevelev, O.B.; et al. On association of the lethal yellow (AY) mutation in the agouti gene with the alterations in mouse brain and behavior. Behav. Brain Res. 2019, 359, 446–456. [Google Scholar] [CrossRef] [PubMed]
  25. Paylor, R.; Spencer, C.M.; Yuva-Paylor, L.A.; Pieke-Dahl, S. The use of behavioral test batteries, II: Effect of test interval. Physiol. Behav. 2006, 87, 95–102. [Google Scholar] [CrossRef] [PubMed]
  26. Võikar, V.; Vasar, E.; Rauvala, H. Behavioral alterations induced by repeated testing in C57BL/6J and 129S2/Sv mice: Implications for phenotyping screens. Genes Brain Behav. 2004, 3, 27–38. [Google Scholar] [CrossRef]
  27. Kulikov, A.V.; Tikhonova, M.A.; Kulikov, V.A. Automated measurement of spatial preference in the open field test with transmitted lighting. J. Neurosci. Methods 2008, 170, 345–351. [Google Scholar] [CrossRef]
  28. Kulikov, V.A.; Khotskin, N.V.; Nikitin, S.V.; Lankin, V.S.; Kulikov, A.V.; Trapezov, O.V. Application of 3-D imaging sensor for tracking minipigs in the open field test. J. Neurosci. Methods 2014, 235, 219–225. [Google Scholar] [CrossRef]
  29. Kulikov, A.V.; Morozova, M.V.; Kulikov, V.A.; Kirichuk, V.S.; Popova, N.K. Automated analysis of antidepressants’ effect in the forced swim test. J. Neurosci. Methods 2010, 191, 26–31. [Google Scholar] [CrossRef]
  30. Sato, K.; Sumi-Ichinose, C.; Kaji, R.; Ikemoto, K.; Nomura, T.; Nagatsu, I.; Ichinose, H.; Ito, M.; Sako, W.; Nagahiro, S.; et al. Differential involvement of striosome and matrix dopamine systems in a transgenic model of dopa-responsive dystonia. Proc. Natl. Acad. Sci. USA 2008, 105, 12551–12556. [Google Scholar] [CrossRef] [Green Version]
  31. Kulikov, A.V.; Naumenko, V.S.; Voronova, I.P.; Tikhonova, M.A.; Popova, N.K. Quantitative RT-PCR assay of 5-HT1A and 5-HT2A serotonin receptor mRNAs using genomic DNA as an external standard. J. Neurosci. Methods 2005, 141, 97–101. [Google Scholar] [CrossRef] [PubMed]
  32. Naumenko, V.S.; Osipova, D.V.; Kostina, E.V.; Kulikov, A.V. Utilization of a two- standard system in real-time PCR for quantification of gene expression in the brain. J. Neurosci. Methods 2008, 170, 197–203. [Google Scholar] [CrossRef] [PubMed]
  33. Fursenko, D.V.; Bazhenova, E.Y.; Khotskin, N.V.; Sorokin, I.E.; Kulikova, E.A.; Kulikov, A.V. Effect of Photoperiod and Lethal Yellow Mutation on Depression-Like Behavior and Expression of Proinflammatory Cytokines in the Hypothalamus in Mice. Bull. Exp. Biol. Med. 2019, 167, 100–103. [Google Scholar] [CrossRef]
  34. Bazhenova, E.Y.; Fursenko, D.V.; Khotskin, N.V.; Sorokin, I.E.; Kulikov, A.V. Effect of lethal yellow (AY) mutation and photoperiod alterations on mouse behavior. Vavilovskii Zhurnal Genet. I Sel. Vavilov J. Genet. Breed. 2019, 23, 55–61. [Google Scholar] [CrossRef] [Green Version]
  35. Siesser, W.B.; Zhang, X.; Jacobsen, J.P.; Sotnikova, T.D.; Gainetdinov, R.R.; Caron, M.G. Tryptophan hydroxylase 2 genotype determines brain serotonin synthesis but not tissue content in C57Bl/6J and BALB/cJ congenic mice. Neurosci. Lett. 2010, 481, 6–11. [Google Scholar] [CrossRef] [Green Version]
  36. Anderson, E.J.; Çakir, I.; Carrington, S.J.; Cone, R.D.; Ghamari-Langroudi, M.; Gillyard, T.; Gimenez, L.E.; Litt, M.J. 60 YEARS OF POMC: Regulation of feeding and energy homeostasis by α-MSH. J. Mol. Endocrinol. 2016, 56, T157–T174. [Google Scholar] [CrossRef] [Green Version]
  37. Yang, Y. Structure, function and regulation of the melanocortin receptors. Eur. J. Pharmacol. 2011, 660, 125–130. [Google Scholar] [CrossRef] [Green Version]
  38. Begriche, K.; Sutton, G.M.; Butler, A.A. Homeostastic and non-homeostatic functions of melanocortin-3 receptors in the control of energy balance and metabolism. Physiol. Behav. 2011, 104, 546–554. [Google Scholar] [CrossRef] [PubMed] [Green Version]
  39. Begriche, K.; Girardet, C.; McDonald, P.; Butler, A.A. Melanocortin-3 receptors and metabolic homeostasis. Prog. Mol. Biol. Transl. Sci. 2013, 114, 109–146. [Google Scholar] [CrossRef] [Green Version]
  40. Girardet, C.; Butler, A.A. Neural melanocortin receptors in obesity and related metabolic disorders. Biochim. Biophys. Acta 2014, 1842, 482–494. [Google Scholar] [CrossRef] [Green Version]
  41. Yadav, V.K.; Oury, F.; Suda, N.; Liu, Z.W.; Gao, X.B.; Confavreux, C.; Klemenhagen, K.C.; Tanaka, K.F.; Gingrich, J.A.; Guo, X.E.; et al. A serotonin-dependent mechanism explains the leptin regulation of bone mass, appetite, and energy expenditure. Cell 2009, 138, 976–989. [Google Scholar] [CrossRef] [PubMed] [Green Version]
  42. Gutknecht, L.; Araragi, N.; Merker, S.; Waider, J.; Sommerlandt, F.M.; Mlinar, B.; Baccini, G.; Mayer, U.; Proft, F.; Hamon, M.; et al. Impacts of brain serotonin deficiency following Tph2 inactivation on development and raphe neuron serotonergic specification. PLoS ONE 2012, 7, e43157. [Google Scholar] [CrossRef] [PubMed] [Green Version]
  43. Mosienko, V.; Beis, D.; Pasqualetti, M.; Waider, J.; Matthes, S.; Qadri, F.; Bader, M.; Alenina, N. Life without brain serotonin: Reevaluation of serotonin function with mice deficient in brain serotonin synthesis. Behav. Brain Res. 2015, 277, 78–88. [Google Scholar] [CrossRef] [PubMed]
  44. Stunkard, A.J.; Faith, M.S.; Allison, K.C. Depression and obesity. Biol. Psychiatry 2003, 54, 330–337. [Google Scholar] [CrossRef] [PubMed]
  45. Simon, G.E.; Von Korff, M.; Saunders, K.; Miglioretti, D.L.; Crane, P.K.; van Belle, G.; Kessler, R.C. Association between obesity and psychiatric disorders in the US adult population. Arch. Gen. Psychiatry 2006, 63, 824–830. [Google Scholar] [CrossRef] [Green Version]
  46. Luppino, F.S.; de Wit, L.M.; Bouvy, P.F.; Stijnen, T.; Cuijpers, P.; Penninx, B.W.; Zitman, F.G. Overweight, obesity, and depression: A systematic review and metaanalysis of longitudinal studies. Arch. Gen. Psychiatry 2010, 67, 220–229. [Google Scholar] [CrossRef]
  47. Łojko, D.; Buzuk, G.; Owecki, M.; Ruchała, M.; Rybakowski, J.K. Atypical features indepression: Association with obesity and bipolar disorder. J. Affect. Disord. 2015, 185, 76–80. [Google Scholar] [CrossRef]
  48. Sharma, A.N.; Elased, K.M.; Garrett, T.L.; Lucot, J.B. Neurobehavioral deficits in db/db diabetic mice. Physiol. Behav. 2010, 101, 381–388. [Google Scholar] [CrossRef] [Green Version]
  49. Guo, M.; Lu, X.Y. Leptin receptor deficiency confers resistance to behavioral effects of fluoxetine and desipramine via separable substrates. Transl. Psychiatry 2014, 4, e486. [Google Scholar] [CrossRef] [Green Version]
  50. Dinel, A.L.; André, C.; Aubert, A.; Ferreira, G.; Layé, S.; Castanon, N. Cognitive and emotional alterations are related to hippocampal inflammation in a mouse model of metabolic syndrome. PLoS ONE 2011, 6, e24325. [Google Scholar] [CrossRef] [Green Version]
  51. Cryan, J.F.; Mombereau, C. In search of a depressed mouse: Utility of models for studying depression-related behavior in genetically modified mice. Mol. Psychiatry 2004, 9, 326–357. [Google Scholar] [CrossRef] [PubMed]
  52. Mosienko, V.; Bert, B.; Beis, D.; Matthes, S.; Fink, H.; Bader, M.; Alenina, N. Exaggerated aggression and decreased anxiety in mice deficient in brain serotonin. Transl. Psychiatry 2012, 2, e122. [Google Scholar] [CrossRef] [PubMed] [Green Version]
  53. Beaulieu, J.M.; Zhang, X.; Rodriguiz, R.M.; Sotnikova, T.D.; Cools, M.J.; Wetsel, W.C.; Gainetdinov, R.R.; Caron, M.G. Role of GSK3 beta in behavioral abnormalities induced by serotonin deficiency. Proc. Natl. Acad. Sci. USA 2008, 105, 1333–1338. [Google Scholar] [CrossRef] [PubMed] [Green Version]
  54. Jacobsen, J.P.; Medvedev, I.O.; Caron, M.G. The 5-HT deficiency theory of depression: Perspectives from a naturalistic 5-HT deficiency model, the tryptophan hydroxylase 2 Arg439His knockin mouse. Philos. Trans. R. Soc. Lond. B Biol. Sci. 2012, 367, 2444–2459. [Google Scholar] [CrossRef] [Green Version]
  55. Jacobsen, J.P.; Siesser, W.B.; Sachs, B.D.; Peterson, S.; Cools, M.J.; Setola, V.; Folgering, J.H.; Flik, G.; Caron, M.G. Deficient serotonin neurotransmission and depression-like serotonin biomarker alterations in tryptophan hydroxylase 2 (Tph2) loss-of-function mice. Mol. Psychiatry 2012, 17, 694–704. [Google Scholar] [CrossRef] [Green Version]
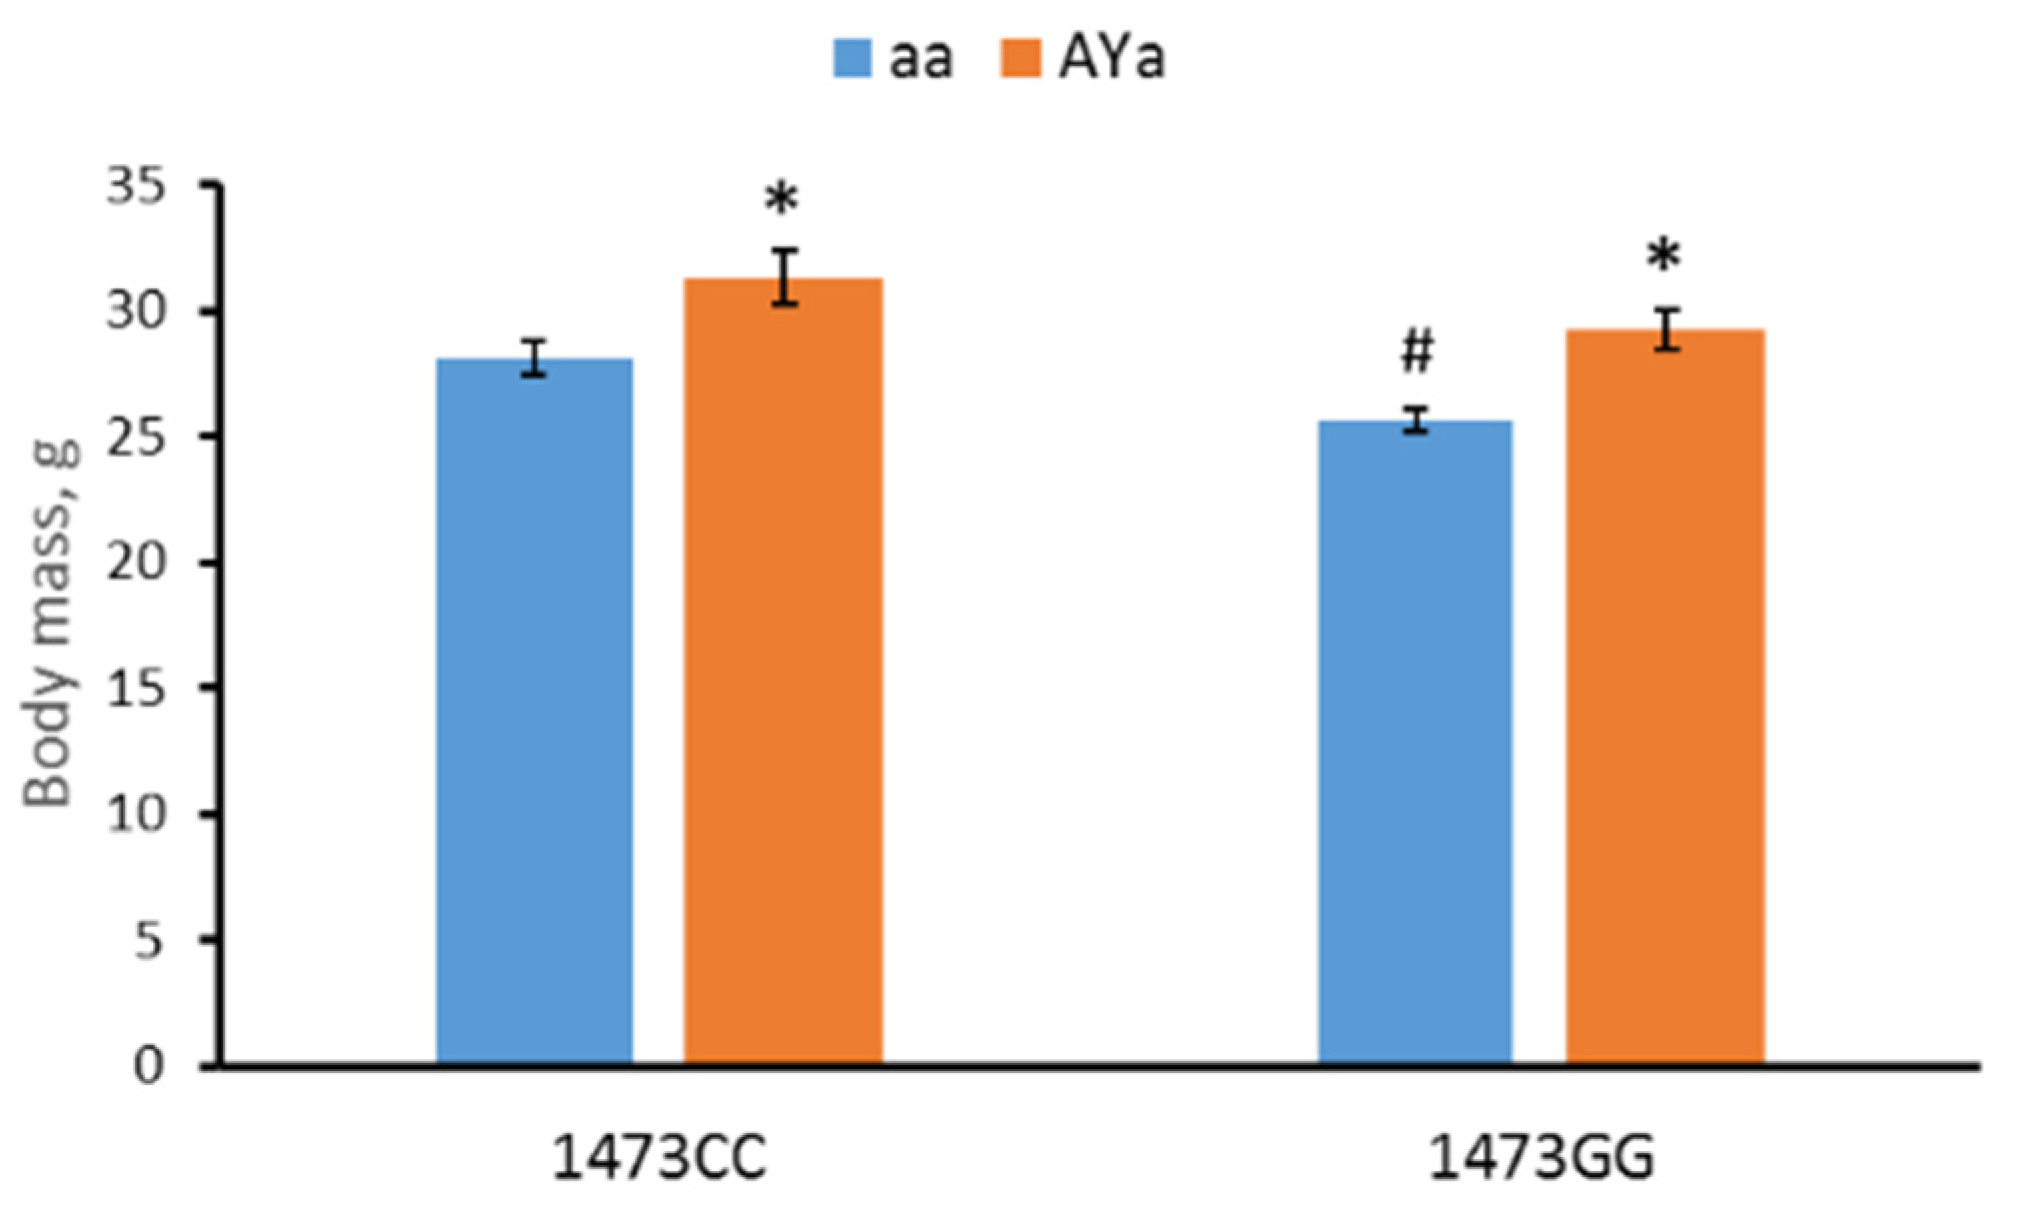
Figure 1. Body masses (g) of 12-week-old males of B6-1473CC/aa, B6-1473CC/AYa, B6-1473GG/aa and B6-1473GG/AYa mice. * p < 0.05 vs. corresponding aa genotype. # p < 0.05 vs. B6-1473CC/aa mice.
Biomolecules 13 00963 g001
Figure 2. Distance travelled (m), amount of fecal boli, time spent in the center (%) and number of vertical postures in the open field test in 12-week-old male B6-1473CC/aa, B6-1473CC/AYa, B6-1473GG/aa and B6-1473GG/AYa mice. * p < 0.05 vs. corresponding aa genotype; $$ p < 0.01 vs. the 1473CC mice; # p < 0.05 vs. the B6-1473CC/aa mice.
Biomolecules 13 00963 g002
Figure 3. Distance travelled (m) and time spent (%) in the center, open and closed arms in the elevated plus-maze test in 12-week-old male B6-1473CC/aa, B6-1473CC/AYa, B6-1473GG/aa and B6-1473GG/AYa mice.
Biomolecules 13 00963 g003
Figure 4. Immobility time in the forced swim test in 12-week-old male B6-1473CC/aa, B6-1473CC/AYa, B6-1473GG/aa and B6-1473GG/AYa mice. ** p < 0.01 vs. corresponding aa genotype; # p < 0.05 vs. the B6-1473CC/AYa mice.
Biomolecules 13 00963 g004
Figure 5. Amount of hind limb clasping and time spent hindlimb clasping in the tail suspension test in 12-week-old male B6-1473CC/aa, B6-1473CC/AYa, B6-1473GG/aa and B6-1473GG/AYa mice. * p < 0.05 vs. B6-1473CC/aa mice; $$$ p < 0.001 vs. B6-1473CC/AYa mice; # p < 0.05 vs. the B6-1473GG/aa mice.
Biomolecules 13 00963 g005
Figure 6. 5-HT and 5-HIAA levels and the 5-HIAA.5-HT turnover rate in cortex, hippocampus, striatum, hypothalamus and midbrain in 12-week-old male B6-1473CC/aa, B6-1473CC/AYa, B6-1473GG/aa and B6-1473GG/AYa mice.
Biomolecules 13 00963 g006
Figure 7. The TPH2 activity in cortex, hippocampus, striatum, hypothalamus and midbrain in 12-week-old male B6-1473CC/aa, B6-1473CC/AYa, B6-1473GG/aa and B6-1473GG/AYa mice. *** p < 0.001 vs. mice of 1473CC genotype.
Biomolecules 13 00963 g007
Table 1. Sequences, annealing temperatures of the primers and sizes of PCR products (amplicons).
GenePrimer SequencesAnnealing Temperature, °CAmplicon
Size, bp
Polr2a5′-TGTGACAACTCCATACAATGC
5′-CTCTCTTACTGAATTTGCGTACT
60194
Tph25′-CATTCCTCGCACAATTCCAGTCG′
5′-AGTCTACATCCATCCCAACTGCTG
61239
Maoa5′AATGAGGATGTTAAATGGGTAGATGTTGGT
5′-CTTGACATATTCAACTAGACGCTC
62138
Slc6a45′-AAGCCCCACCTTGACTCCTCC
5′-CTCCTTCCTCTCCTCACATATCC
57198
Htr1a5′-GACTGCCACCCTCTGCCCTATATC
5′-TCAGCAAGGCAAACAATTCCAG
62200
Htr2a5′-AGAAGCCACCTTGTGTGTGA
5′-TTGCTCATTGCTGATGGACT
61169
Agouti5’-GGATGTCACCCGCCTACT
5’-GTTACTCCGCAGACTCCT
62150
Mc3r5′-TCCGATGCTGCCTAACCT
5′-TGCAGGTTGCCATTCCT
62130
Mc4r5′-GTCGGAAACCATCGTCATTACC
5′-GCAAATGGATGCGAGCAAG
62150
Table 2. The Tph2, Maoa, Slc6a, Htr1a, Htr2a, Agouti, Mc3r and Mc4r genes mRNA levels in cortex, hippocampus, striatum, hypothalamus and midbrain in 12-week-old male B6-1473CC/aa, B6-1473CC/AYa, B6-1473GG/aa and B6-1473GG/AYa mice.
GeneB6-1473CC/aaB6-1473CC/AYaB6-1473CC/aaB6-1473CC/AYaF(3,28)
Cortex
Maoa650.3 ± 128.3556.2 ± 50.1632.2 ± 82.8602.0 ± 52.4F < 1
Htr1a34.0 ± 6.633.5 ± 4.637.0 ± 3.757.0 ± 19.2F = 1.2, p = 0.3
Htr2a126.0 ± 16.1119.6 ± 11.0140.5 ± 23.5138.5 ± 11.4F < 1
Agouti0.56 ± 0.4236.3 ± 11.5 ***0.07 ± 0.0324.1 ± 6.4 **F = 7.4, p < 0.001
Mc3r0.72 ± 0.320.46 ± 0.090.52 ± 0.091.14 ± 0.47F = 1.1, p = 0.4
Mc4r12.20 ± 2.578.81 ± 1.3711.25 ± 2.299.09 ± 1.54F < 1
Hippocampus
Maoa200.0 ± 20.6185.4 ± 17.0185.6 ± 18.0187.0 ± 23.6F < 1
Htr1a53.5 ± 7.045.2 ± 4.640.1 ± 6.459.9 ± 7.2F < 1
Htr2a10.5 ± 0.8610.3 ± 1.3010.3 ± 2.1711.5 ± 1.59F < 1
Agouti1.25 ± 0.5630.8 ± 3.3 ***2.23 ± 1.9531.3 ± 3.7 ***F = 40.6, p < 0.001
Mc3r3.58 ± 1.331.68 ± 1.091.10 ± 0.543.31 ± 1.87F < 1
Mc4r17.29 ± 2.5814.84 ± 2.2718.83 ± 7.0616.39 ± 2.61F < 1
Striatum
Maoa106.1 ± 9.9114.5 ± 8.8120.4 ± 13.9127.2 ± 13.8F < 1
Htr1a2.61 ± 0.573.79 ± 0.533.82 ± 0.543.51 ± 0.45F = 1.2, p = 0.3
Htr2a28.7 ± 2.5430.5 ± 5.6225.2 ± 3.3532.5 ± 3.61F < 1
Agouti0.14 ± 0.1242.1 ± 7.6 ***0.03 ± 0.0161.1 ± 7.5 ***F = 33.0, p < 0.001
Mc3r0.50 ± 0.141.46 ± 0.490.66 ± 0.101.06 ± 0.29F = 2.1, p = 0.1
Mc4r6.90 ± 1.156.61 ± 1.076.91 ± 1.127.36 ± 1.05F < 1
Hypothalamus
Maoa242.7 ± 21.3228.7 ± 18.9249.9 ± 16.8294.3 ± 46.4F < 1
Htr1a22.8 ± 1.620.9 ± 2.220.4 ± 2.324.8 ± 4.7F < 1
Htr2a16.81 ± 1.0818.74 ± 2.4318.94 ± 1.8621.88 ± 4.36F < 1
Agouti0.21 ± 0.1940.5 ± 4.2 ***0.02 ± 0.0145.6 ± 9.2 ***F = 24.2, p = 0.001
Mc3r12.41 ± 1.1817.67 ± 7.4813.54 ± 2.3113.91 ± 3.94F < 1
Mc4r10.55 ± 0.629.91 ± 1.7210.29 ± 1.0911.63 ± 2.48F < 1
Midbrain
Tph2337.2 ± 59.1261.2 ± 51.3375.1 ± 19.2283.6 ± 35.8F < 1
Maoa811.73.1809.9 ± 70.6847.9 ± 86.0787.8 ± 50.0F < 1
Slc6a478.4 ± 9.957.8 ± 4.764.3 ± 6.981.0 ± 19.2F < 1
Htr1a40.7 ± 3.634.2 ± 2.530.8 ± 2.834.4 ± 2.7F = 1.8, p = 0.2
Htr2a36.0 ± 3.8430.8 ± 2.3229.3 ± 2.4540.9 ± 9.73F < 1
Agouti5.54 ± 1.2446.4 ± 2.4 ***3.45 ± 0.8348.2 ± 4.7 ***F = 81.0, p = 0.001
Mc3r10.21 ± 1.613.93 ± 1.436.42 ± 1.656.49 ± 3.06F = 2.0, p = 0.1
Mc4r20.13 ± 4.9716.38 ± 2.5115.36 ± 2.3315.60 ± 3.19F < 1
** p < 0.01, *** p < 0.001 vs. corresponding aa genotype.
Disclaimer/Publisher’s Note: The statements, opinions and data contained in all publications are solely those of the individual author(s) and contributor(s) and not of MDPI and/or the editor(s). MDPI and/or the editor(s) disclaim responsibility for any injury to people or property resulting from any ideas, methods, instructions or products referred to in the content.