Article

A Truncated 14-Amino-Acid Myelin Protein-Zero-Targeting Peptide for Fluorescence-Guided Nerve-Preserving Surgery

by
Nataliia Berehova
1,
Maarten P. van Meerbeek
1,
Samaneh Azargoshasb
2,
Danny M. van Willigen
1,
Leon J. Slof
1,2,
Saaedeh Navaei Lavasani
1,
Matthias N. van Oosterom
1,
Fijs W. B. van Leeuwen
1,3 and
Tessa Buckle
1,3,*
1
Interventional Molecular Imaging Laboratory, Department of Radiology, Leiden University Medical Center, 2333 ZA Leiden, The Netherlands
2
Design and Prototyping, Department of Medical Technology, Leiden University Medical Center, 2333 ZA Leiden, The Netherlands
3
Department of Head and Neck Surgery, Division of Surgical Oncology, Netherlands Cancer Institute—Antoni van Leeuwenhoek Hospital, 1066 CX Amsterdam, The Netherlands
*
Author to whom correspondence should be addressed.
Biomolecules 2023, 13(6), 942; https://doi.org/10.3390/biom13060942
Submission received: 31 March 2023 / Revised: 31 May 2023 / Accepted: 1 June 2023 / Published: 5 June 2023

Abstract

:
Background: The occurrence of accidental nerve damage during surgery and the increasing application of image guidance during head-and-neck surgery have highlighted the need for molecular targeted nerve-sparing interventions. The implementation of such interventions relies on the availability of nerve-specific tracers. In this paper, we describe the development of a truncated peptide that has an optimized affinity for protein zero (P0), the most abundant protein in myelin. Methods and Materials: Further C- and N-terminal truncation was performed on the lead peptide Cy5-P0101–125. The resulting nine Cy5-labelled peptides were characterized based on their photophysical properties, P0 affinity, and in vitro staining. These characterizations were combined with evaluation of the crystal structure of P0, which resulted in the selection of the optimized tracer Cy5-P0112–125. A near-infrared Cy7-functionalized derivative (Cy7-P0112–125) was used to perform an initial evaluation of fluorescence-guided surgery in a porcine model. Results: Methodological truncation of the 26-amino-acid lead compound Cy5-P0101–125 resulted in a size reduction of 53.8% for the optimized peptide Cy5-P0112–125. The peptide design and the 1.5-fold affinity gain obtained after truncation could be linked to interactions observed in the crystal structure of the extracellular portion of P0. The near-infrared analogue Cy7-P0112–125 supported nerve illumination during fluorescence-guided surgery in the head-and-neck region in a porcine model. Conclusions: Methodological truncation yielded a second-generation P0-specific peptide. Initial surgical evaluation suggests that the peptide can support molecular targeted nerve imaging.

1. Introduction

Image-guided applications play an important role in the current progression realized in the field of head-and-neck surgery [1,2,3,4]. A prime example of such an approach is found in the surgical resection of sentinel nodes, a procedure that serves as a secondary means for the identification of (micro)metastatic tumor spread [1,2,5,6]. An upcoming application is found in the visualization of primary tumor margins [7,8,9,10,11]. Unfortunately, the location of both possibly involved lymph nodes and the primary tumor can coincide with the location of nerves within the complex anatomy of the head and neck area (e.g., the hypoglossal, lingual, and vagus nerves and the marginal mandibular trunk of the facial nerve; [12,13]). As a result, the occurrence of accidental surgically induced nerve damage is not uncommon. For instance, injury to the laryngeal nerve or mandibular nerve is seen in 14% of patients undergoing thyroid surgery or neck dissection, respectively [14,15]. Permanent paralysis is even seen in 4–7% of these patients [15]. This underlines that the intraoperative identification of nerves has the potential to serve as an important goal and target for image guidance strategies.
With its superior spatial resolution, multispectral/multiwavelength properties, and real-time imaging capabilities, fluorescence imaging has the potential to support high-level discrimination between target and non-target tissue [16,17]. To achieve fluorescent ‘illumination’ of nerves, nerve-targeting fluorescent tracers are required. Over the last years, a number of such tracers have been developed [18], including non-conjugated fluorescent dyes [19,20,21,22], peptides with either unknown nerve-related or intracellular targets such as myelin basic protein (MBP; [23,24,25]), or peptides that target myelin protein zero (MPZ, P0). The latter of these is the most abundant protein present in myelin [26,27,28]. The pursuit of the targeting of nerve-specific proteins is in line with conventional tumor receptor-targeted molecular imaging strategies [29]. Initial work on the targeting of P0 focused on truncation of the extracellular portion of the homotypic P0 protein into amino acid sequences [30]. This yielded the P0-specific lead compound Cy5-P0101–125, consisting of 26 amino acids that exhibited a binding affinity of 104 ± 17 nM [27]. Dimerization of this peptide (Cy5-(P0101–125)2; [26]) yielded a 1.5-fold increase in affinity but almost doubled the molecular weight. In vitro and in vivo evaluation using fluorescence immunohistochemistry of stained nerve tissue, blocking and FLIZA studies, and in vivo and ex vivo imaging after local intravenous and intraneural administration showed the robustness of this P0-taregting concept [26].
In this paper, we describe an alternative optimization route for the lead compound Cy5-P0101–125, namely, through methodological peptide truncation. To achieve this, the lead peptide was alternately truncated from both the C- and N-terminal sides, while systematically functionalizing the peptide with a Cy5-fluorescent label through a maleimide–cysteine coupling at the N-terminal face of the peptide (Figure 1). Following synthesis, the photophysical properties of these compounds were characterized, and their P0 affinity/specificity was determined via flow cytometry and confocal microscopy. Pearson correlation analysis of the peptide characteristics and binding interactions observed in the crystal structure of P0 was used to unravel the structure–activity relationship. The peptide sequence that showed the most favorable characteristics was subsequently labelled with a near-infrared Cy7 dye and applied during head-and-neck nerve surgery in a porcine model using a clinical-grade fluorescence camera.

2. Materials and Methods

All chemicals were received from Actu-All Chemical (Oss, The Netherlands), Sigma Aldrich (St. Louis, MO, USA), Tokyo Chemical Industry (Tokyo, Japan), Biosolve BV (Valkenswaard, The Netherlands), and VWR Chemicals (Solon, OH, USA) and used without further purification. DMF and DMSO were dried over 4 Å molecular sieves for at least 24 h prior to use. Preparative high-pressure liquid chromatography (prep-HPLC) was performed on a Waters HPLC system (Waters Chromatography B.V., Etten-Leur, The Netherlands) using a 2545 quaternary gradient module pump and a 2489 UV detector. A Dr. Maisch ReproSil-Pur 120 C18-AQ 10 μM (250 mm × 20 mm) column (Dr. Maisch HPLC GmbH, Ammerbuch-Entringen, Germany) was applied with an operating flow rate of 12 mL/min. Analytical HPLC was performed on a Waters Acquity UPLC-MS system using a Acquity UPLC photodiode array detector, an SQ Detector mass spectrometer, and a flow rate of 0.5 mL/min (Waters BEH C18 130 Å 1.7 mm (100 mm × 2.1 mm) column). Lyophilization was performed using a VaCo 2-II lyophilizer (Zirbus technology GmbH, Bad Grund (Harz), Germany). Absorption spectrometry was performed using a UV1280 UV–vis spectrometer (Shimadzu, Kyoto, Japan), and fluorescence spectrometry was performed using an LS55 (Perkin Elmer, Waltham, MA, USA). Fluorescence confocal imaging was performed using an SP8 WLL confocal microscope (Leica Microsystems, Wetzlar, Germany). The obtained images were analyzed using Leica Confocal Software (Leica Microsystems). The mean fluorescence intensity values per sample were measured using an LSRII flow cytometer (BD Biosciences, Franklin Lakes, NJ, USA) with APC-A settings (635 nm laser and 750 nm long-pass filter) for a Cy5 dye. Image acquisition and processing for the assessment of P0 staining were performed using LASX software (Leica Application Software Suite 4.8). Image analysis (3D) was performed using Image J [26]. For the affinity assessment, fluorescence was measured using a FACSCanto II flow cytometry device (BD Biosciences, Franklin Lakes, NJ, USA) in the APC-A channel, and the accompanying FlowJoTM v5 software (BD Biosciences, Franklin Lakes, NJ, USA) was used for further analysis. Figure 1 was created using BioRender (https://biorender.com/, accessed on 30 May 2023). Feature clustering and Pearson correlation assessment were performed using MATLAB 9.9.0.1495850 (R2020b) software (The MathWorks Inc.: Natick, MA, USA). For crystal structure analysis, RCSB PDB (https://www.rcsb.org/) was used.

2.1. Synthetic Procedures

2.1.1. Dye Synthesis

The sequences of P0 peptides, Sulfonate-(SO3)Cy5(SO3)-Maleimide, and its precursors were synthesized according to earlier reported procedures [26,31,32]. For synthesis of the Cy7 analogue, the precursor Sulfonate-(SO3)Cy7(SO3)-COOH [33] was dissolved in dry DMSO (5 mL), followed by the addition of PyBOP (2.5 eq), N-(2-aminoethyl)maleimide (1.2 eq), and N-methyl morpholine (4 eq). The reaction mixture was stirred for 3 h at r.t. The crude solution was purified by preparative HPLC employing a gradient of 25 → 95% acetonitrile. Yield 65.8%. m/z: Calcd for C43H50N4O12S32- 911, 07, found 913.5.

2.1.2. General Synthetic Procedure for the Fluorescent C-Terminal Labelling of Truncation Peptides

A stock solution of Maleimide-(SO3)Cy5(SO3)-Sulfonate (12, 4 mM) in Mili-Q (1) was made. An excess of truncated P0 peptide (Figure 1; 1.4 eq) was dissolved in phosphate-buffered saline (PBS) (pH 7.4, 100 mM), followed by the addition of 1 eq of the dye from the stock solution. The mixture was sonicated and allowed to react at r.t. for 4 h. The crude product was purified via preparative HPLC (gradient 15 → 95% acetonitrile in Mili-Q over 30 min). A blue, fluffy compound was obtained after lyophilization for all truncated Cy5-labeled tracer derivatives.
For creation of the Cy7 derivative, peptide (1 eq) was dissolved in degassed buffer HEPES at pH 7.4. Sulfonate-(SO3)Cy7(SO3)-Maleimide (20 eq) was dissolved in DMSO. A 100× molar excess of TCEP was added to the solution with the peptide, followed by the addition of maleimide. The reaction mixture was flushed with nitrogen, mixed thoroughly, and kept at room temperature overnight. The crude product was purified via preparative HPLC, employing a gradient of 5 → 95% acetonitrile in Mili-Q. A green, fluffy compound (3a) was obtained after lyophilization. Cy5-P0101–125: 6.4 mg (yield 36.3%), m/z [M+3H—979.7]; Cy5-P0101–120: 4.4 mg (yield 24%), m/z [M+3H − 1999.3]; Cy5-P0101–115: 5.1 mg (yield 34.5%), m/z [M+3H − 877.4]; Cy5-P0101-110: 1.4 mg (yield 15%), m/z [M+2H − 1051.0]; Cy5-P0101–106: 0.87 mg (yield 42%), m/z [M+2H—858.15]; Cy5-P0105–125: 0.8 mg (10.3%), m/z [M+3H+ Na+—1165.3]; Cy5-P0108-125: 1.7 mg (yield 16.2%), m/z [M+3H − 1050.7]; Cy5-P0112–125: 0.4 mg (yield 5%), m/z [M+3H − 925.6]; Cy5-P0116–125: 1.7 mg (yield 15.8%), m/z [M+2H − 1167.6]; Cy5-P0120–125: 2.8 mg (yield 20.9%), m/z [M+2H − 898.0]; Cy7-P0112–125: 0.5 mg (yield 16.5%), m/z [M+2H − 1400.8]. See Figures S1–S12 for mass spectra of the synthesized compounds.

2.2. Experimental Procedures

2.2.1. Assessment of P0 Staining via Fluorescence Confocal Microscopy

The P0 specificity of Cy5-P0101–125 was previously determined in P0-expressing myelinating Schwannoma cells (RT4 D6P2T myelinating Schwannoma cells (ATCC® CRL-2768™; [34])) and non-P0-expressing cells, using P0 antibodies and a fluorescent derivative of the extracellular portion of P0 [27]. P0-expressing RT4 D6P2T cells were grown in Dulbecco’s modified Eagle medium (Life Technologies, Paisley, UK) containing penicillin, streptomycin, and fetal calf serum (All BD Biosciences) at 37 °C and 5% CO2. Cells were trypsinized and seeded onto 35 mm culture dishes that contained a glass insert (MatTek co) one or two days prior to the imaging experiment. One hour prior to imaging, 1 μM Cy5-P101–125, Cy5-P0101–120, Cy5-P0101–115, Cy5-P0101–110, Cy5-P0101–106, Cy5-P0105–125, Cy5-P0108–125, Cy5-P0112–125, Cy5-P0116–125, Cy5-P0120–125, or the original lead compound Cy5-P0101–125 [27] was added (incubation at 4 °C; N = 3 per tracer). Imaging was performed as previously described [35]. Image acquisition and processing were performed using LASX software (Leica Application Software Suite 4.8). Image analysis, including (3D) surface plot and co-localization analysis, was performed using Image J [26].

2.2.2. Affinity Assessment via Flow Cytometry

Analysis of the binding affinity (KD) of Cy5-P101–125, Cy5-P0101–120, Cy5-P0101–115, Cy5-P0101–110, Cy5-P0101–106, Cy5-P0105–125, Cy5-P0108–125, Cy5-P0112–125, Cy5-P0116–125, and Cy5-P0120–125 for P0 was performed using P0-expressing RT4 D6P2T cells and a previously described flow cytometric method [27,35]. Saturation binding experiments were performed for each of the fluorescent peptides in a concentration range of 0–2000 nM. All measurements were performed in triplicate, and experiments were repeated at least two times per tracer. The fluorescence was measured using a FACSCanto II flow cytometry device (BD Biosciences) in the APC-A channel, and the accompanying FlowJo software was used for further analysis. KD assessment was performed using the normalized geometric means, which were fitted with equations in GraphPad Prism 5 software.

2.2.3. Chemical and Photophysical Properties

Determination of the chemical and photophysical properties (LogP, solubility, serum binding, net charge, and brightness) was performed as previously described [27,31,36].

2.2.4. Correlation Assessment and P0-Related Interactions

Cluster analysis was applied based on standardized values for each feature using the clustergram function in MATLAB [37]. An evaluation of P0-related interactions was performed using peptide characteristic and inter- and intra-molecular interactions that were extracted from the crystal structure of the extracellular portion of P0 [38].

2.2.5. In Vivo Imaging of the Optimized Peptide

In vivo experiments in pigs were approved by the ethical board of the University of Ghent (EC2019/79). Pigs were housed at the animal facility at ORSI Academy (Melle, Belgium) until use for nerve imaging experiments during surgical training (weight per animal: approximately 40 kg). Experiments were performed in accordance with the Experiments on Animals Act (Wod, 2014) and the applicable legislation in Belgium, and in accordance with the European guidelines (EU directive no. 2010/63/EU) regarding the protection of animals used for scientific purposes. The pigs were bred and kept in accordance with Belgium law in and by a licensed establishment for the use of experimental animals.
Cy7-P0112–125 (0.25 mg, 300 µmol) was evaluated in pigs undergoing open surgery in the head and neck area using a clinical-grade handheld fluorescence camera (N = 2, PDE-mod, Hamamatsu Photonics; [39]). Animals received either intravenous injection (in the jugular vein under ultrasound guidance) or injection directly into the vagus nerve (intraneural administration). In both cases, fluorescence imaging of the vagus nerve and surrounding tissues was performed at 1 h after tracer administration. The animals were maintained under isoflurane anesthesia for the complete duration of the surgical training and subsequent nerve imaging experiments and were euthanized before awakening from the anesthesia. After resection, ex vivo imaging was applied using the same camera system. Image processing was performed using in-house custom-developed software [27,40].

2.3. Statistical Evaluation

A statistical evaluation to compare the affinity (KD) was performed using unpaired Student’s t-test. Values of p < 0.05 were considered significant. Pearson correlation analysis was applied based on standardized feature values according to previously described methods [37].

3. Results

3.1. Synthesis and Compound Properties

Systematic truncation of the original lead peptide P0101–125 resulted in the creation of Cy5-P0101–120, Cy5-P0101–115, Cy5-P0101–110, Cy5-P0101–106, Cy5-P0105–125, Cy5-P0108–125, Cy5-P0112–125, Cy5-P0116–125, and Cy5-P0120−125 (Figure 1). Assessment of the photophysical properties of these tracer derivatives (Table 1) revealed substantial differences in their LogP values (range: 0.60–1.59). With the exception of Cy5-P0116–125 and Cy5-P0120–125, truncation resulted in a decrease in serum binding (from 89% to 47–69%). C-terminal truncation of the PTRY122–125 amino acid sequence (Cy5-P0101–120) resulted in a twofold increase in brightness, a feature that was maintained throughout the C-terminal matrix. A less pronounced effect was seen within the N-terminal truncation matrix, as a similar increase in brightness was only seen for Cy5-P0105–125 and Cy5-P0112–125. Net charge remained in the range of −1 to −3 for all tracer derivatives.

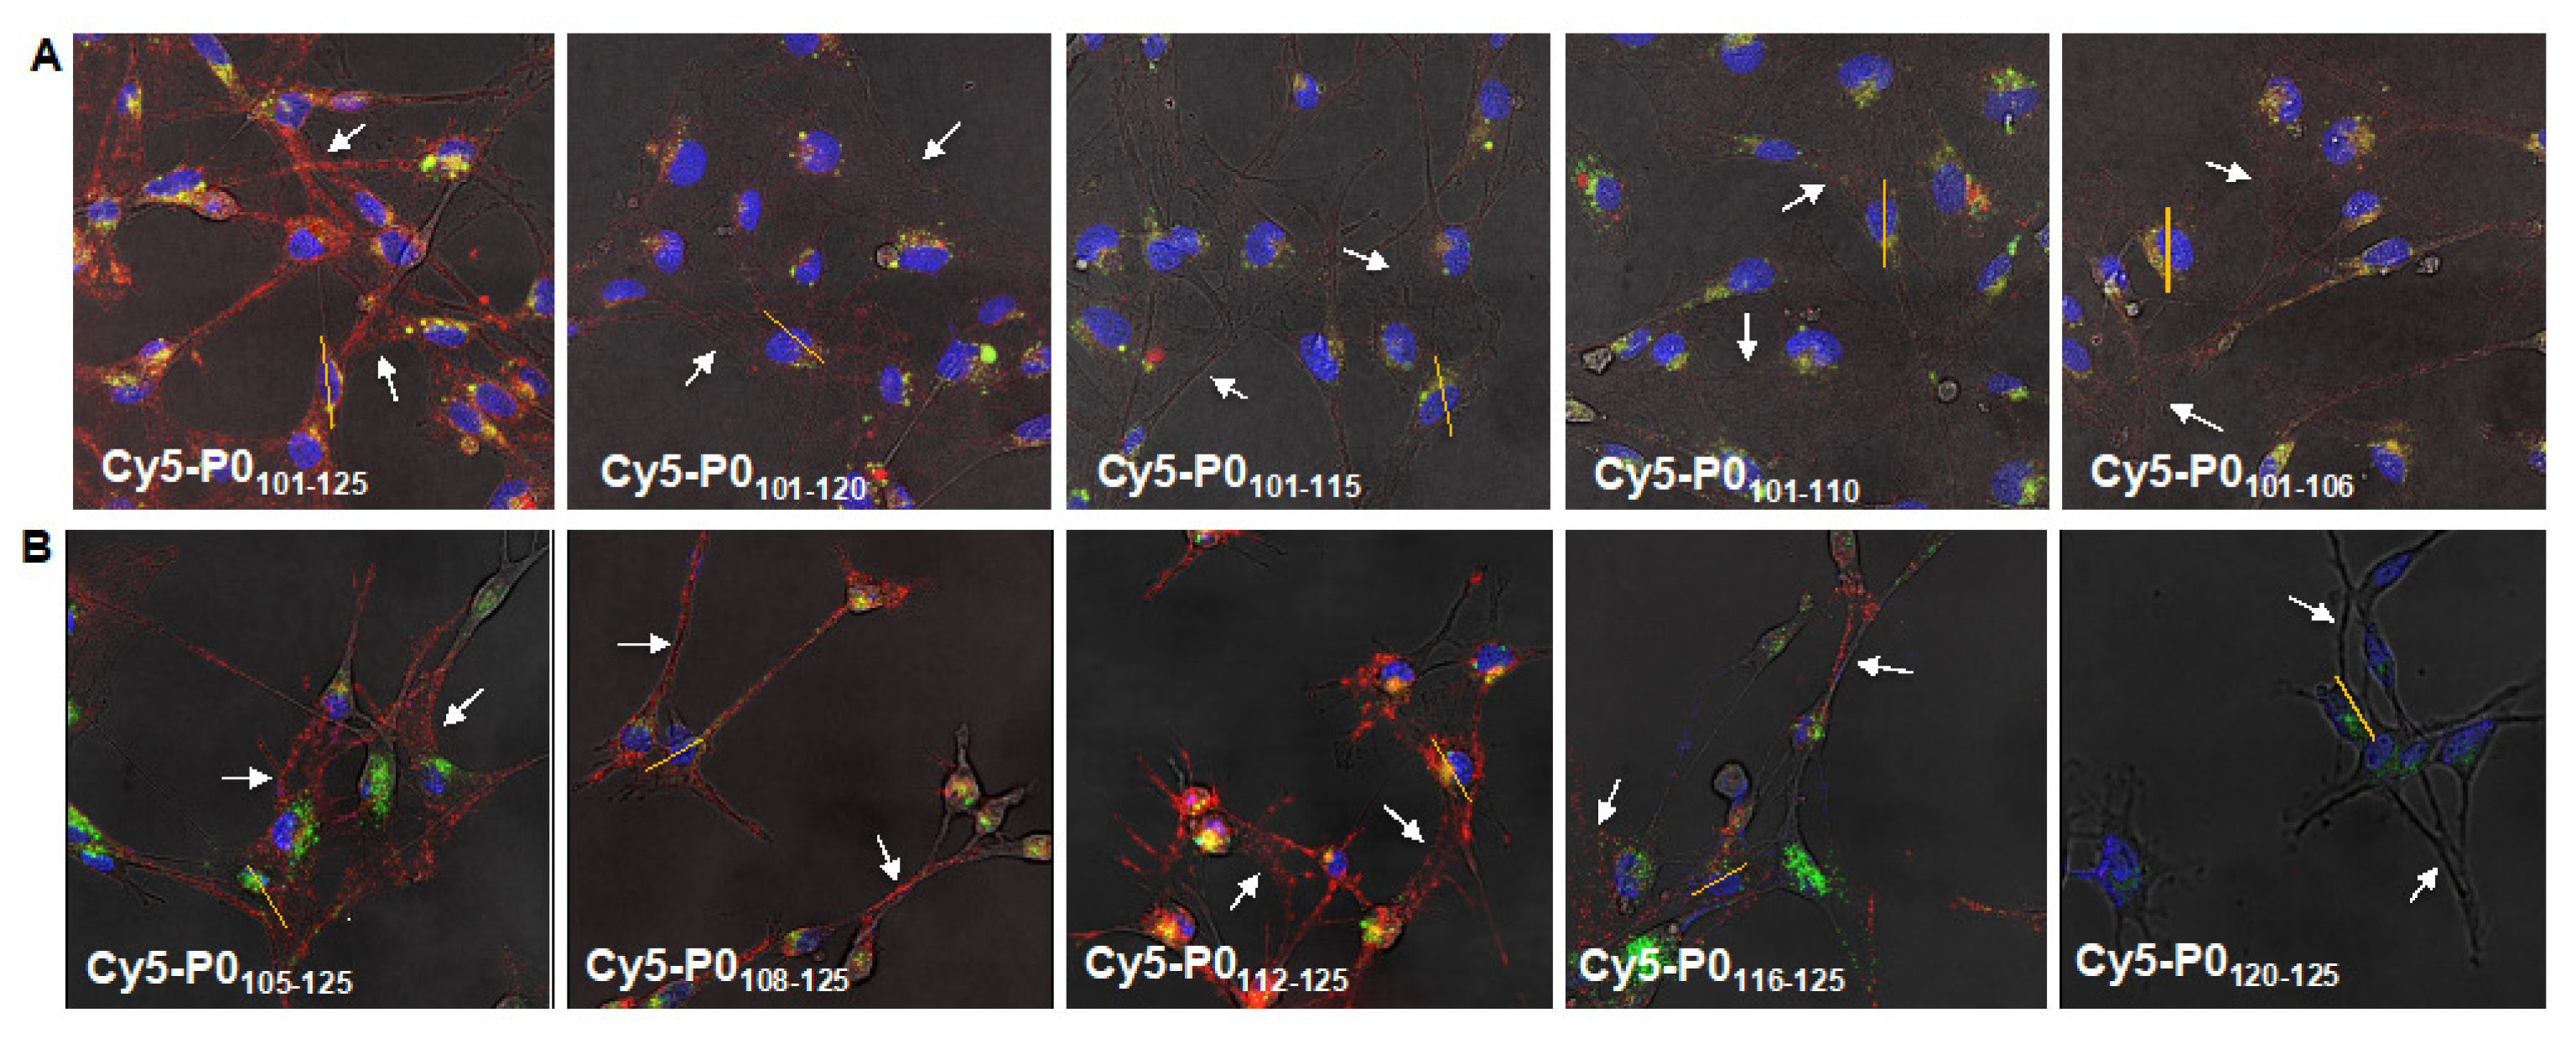
3.2. P0 Staining by Fluorescence Confocal Microscopy

In line with previous reports, the staining of Cy5-P0101–125 in P0-expressing RT4 Schwannoma cells [27] was in agreement with the location of P0 on the membrane (P0-related staining in red; Figure 2) and, more specifically, on the cellular outgrowths (white arrows) of the Schwannoma cells.

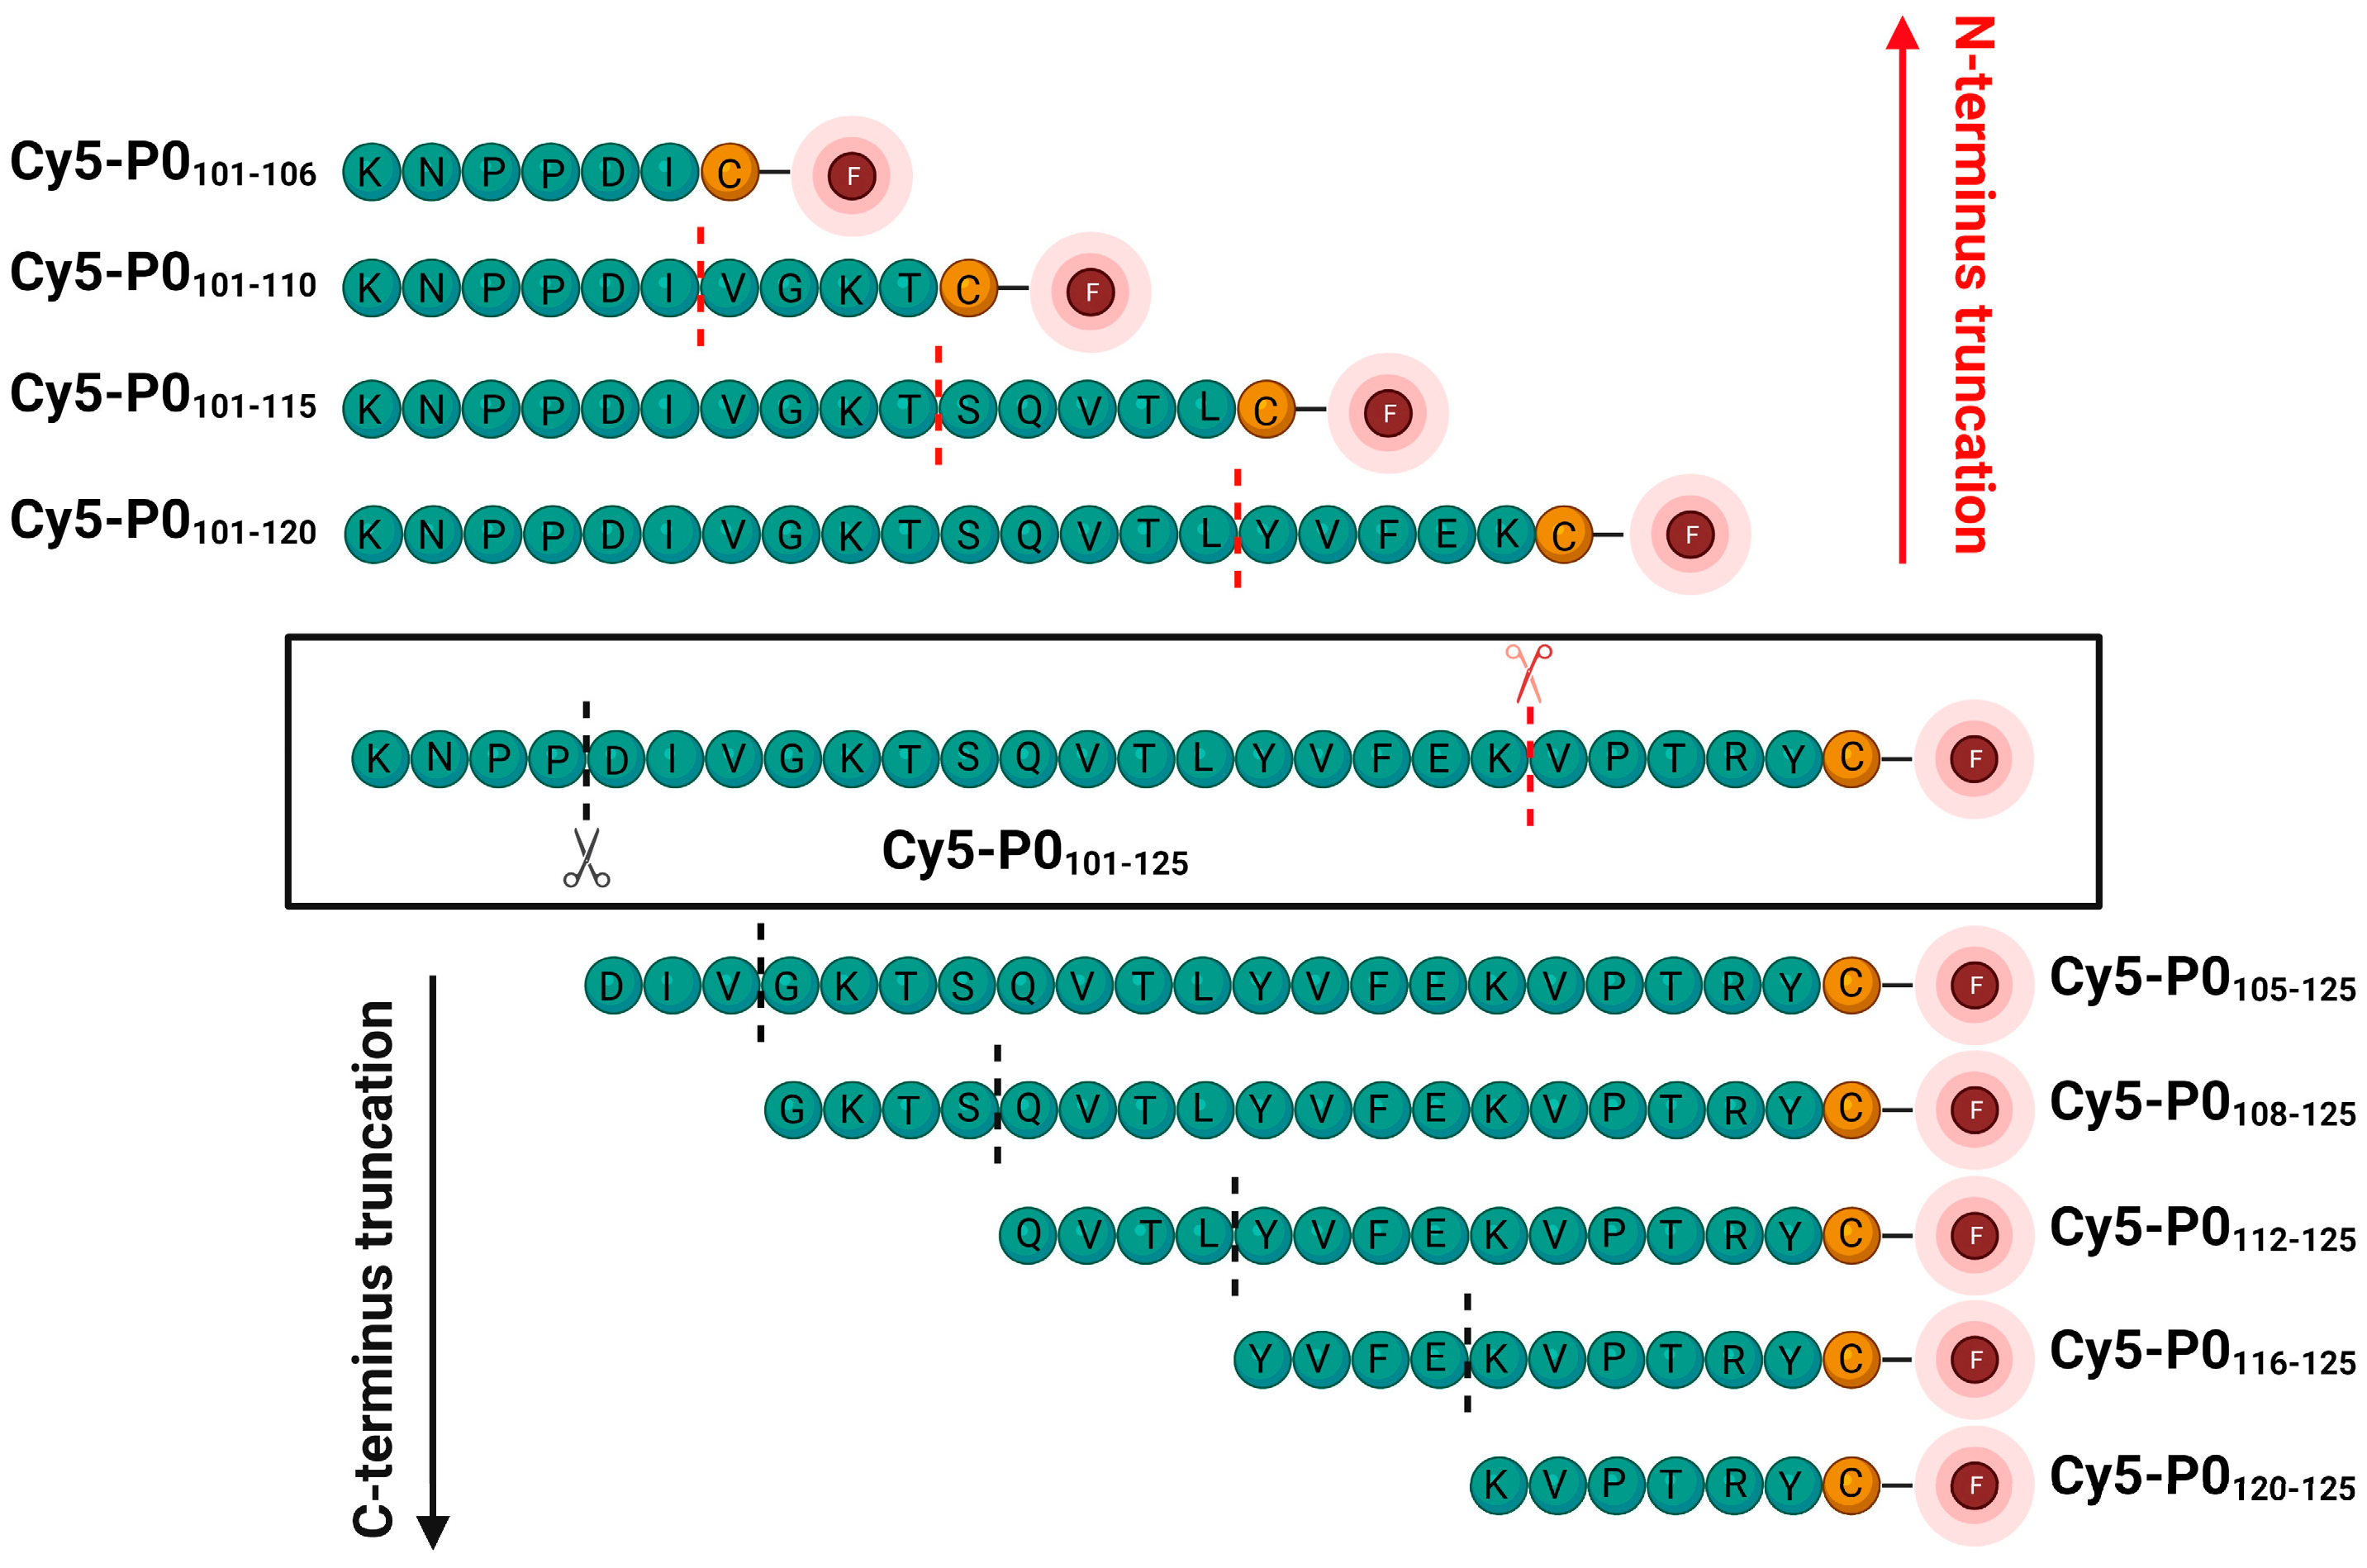
3.2.1. C-Terminal Matrix

A comparison between the compounds within the C-terminal matrix and the lead compound Cy5-P0101–125 revealed differences in localization, as well as P0-related staining intensity (Figure 2A, in red). The level of staining of the cellular outgrowths was shown to decrease with each truncation step, suggesting that C-terminal truncation resulted in a loss of P0 specificity. The differences in the localization of staining were underlined by surface plot analysis of the fluorescence (Figure S13A). The loss of staining of the outgrowths was shown to correspond to an increase in the level of co-localization with the intracellular control staining/non-specific staining (Table S1).

3.2.2. N-Terminal Matrix

In contrast to that with the C-terminal truncation of P0101–125, the P0-related staining pattern was maintained during the first three N-terminal truncation steps (Figure 2B). Interestingly, truncation from Cy5-P0105–125 to Cy5-P0108–125 and Cy5-P0112–125 resulted in an increase in P0-related staining intensity. This was corroborated by an increase in peak height and intensity in the corresponding surface plots (Figure S13B). Further truncation (Cy5-P0116–125) resulted in a decrease in staining intensity, while no specific staining was observed for Cy5-P0120–125. Co-localization with the intracellular control staining was shown to be low for Cy5-P0105–125, Cy5-P0108–125, and Cy5-P0112–125, while the loss in P0-related staining for Cy5-P0116–125 and Cy5-P0120–125 again resulted in an increase in the level of co-localization (Table S1).

3.3. P0 Affinity Determined by Flow Cytometry

Peptides within the C-terminal truncation matrix did not show nanomolar binding affinity for P0 (KD; Figure 3A), which is in line with the lack of specific staining seen in Schwannoma cells (Figure 2A). N-truncation did, however, show a significant increase in P0-related affinity from 175 to 83 (p = 0.04) and 69 nM (p = 0.0001) for Cy5-P0105–125, Cy5-P0108–125, and Cy5-P0112–125, respectively. As an example, a representation of the increase in signal intensity and the resulting saturation binding curve for Cy5-P0112–125 are provided in Figure 3C,D. Again, the affinity could be related to P0-related staining (Figure 2B).
Interestingly, solubility (Table 1) seems to be linked to affinity. Tracers with a low affinity of >1000 nM were soluble, while higher affinity tracers (e.g., Cy5-P0108–125 and Cy5P0112–125) showed relatively low solubility (Table 1). This unexpected effect might be explained through the intrinsic homotypic interactions between P0 molecules, wherein the levels of inter- and intra-molecular interactions can both affect affinity and solubility.

3.4. Relationships between Chemical and Biological Features

Analysis of the crystal structure of the extracellular portion of P0 [38] allowed an investigation of the inter- and intra-molecular interactions between the parental amino acids in this protein (Table 2). Pearson correlation assessment based on the peptide characteristics and the interactions observed in the crystal structure revealed three different subclasses of compounds (Figure 4, y-axis). In this classification, an intermediate or low number of acceptor and donor molecules and a low number of supramolecular/intermolecular interactions were found to be the main denominators. These structural features showed a direct correlation with the level of affinity (high number of donors/acceptors = high affinity, low number of donors/acceptors = low affinity). This correlation was also seen for the level of solubility (Table 1).
Truncation of the original lead compound Cy5-P0101–125, a peptide that largely overlaps with the G B-helix in the extracellular portion of the P0 structure (Figure 5), decreased the number of interactions. This yielded varying effects on the binding affinity of the tracers (Figure 3 and Figure 4). C-terminal truncation of the PTRY122–125 amino acid sequence resulted in a loss of affinity. This implies that this sequence has a critical function within the peptide. N-terminal truncation of the KNPP101–104 amino acid sequence yielded a 1.67-fold drop in affinity (p > 0.0003), suggesting that this sequence plays a role in P0 binding, but one that is less critical.
The crystal structure of P0 indicates that N102 can bind to V107, thereby creating a loop within the peptide (Figure 5). Interestingly, truncation of the DIV105–107 amino acid sequence again yielded a 2.1-fold rise in affinity (p = 0.0002, Figure 3A). This is especially interesting when one realizes that the P0 crystal structure indicates that the amino acids V107 and Q112 facilitate intermolecular van der Waals interactions (Figure 5; [41]). Further truncation of GKTS108–111 only yielded a modest 1.2-fold (p = 0.09) rise in affinity. Removal of the QVTL112–115 sequence reduced the affinity by nearly 2.13-fold (p = 0.09) and therefore seems to be rather critical for maintaining affinity for P0. Further truncation of YVFE116–119, a sequence containing a plurality of H-donors and acceptors, again resulted in a complete loss of affinity. Further analysis of the crystal structure suggests that sequence TLYVFE114–119 provides intramolecular binding for the A’ and F B-sheets (Figure 5 (top right); [41]).

3.5. In Vivo Imaging of Nerves in the Head and Neck Region

To provide a proof-of-principle of intraoperative real-time near-infrared nerve visualization in an open surgery setting, Cy7-P0112–125 was synthesized and evaluated in a porcine model.
Intravenous administration of Cy7-P0112–125 in the jugular vein yielded a fluorescence signal in the vagus nerve (Figure 6A, black arrow). However, the signal-to-background ratio was low. Intraneural administration substantially improved the staining (Figure 6A). Ex vivo assessment of excised nerve tissue followed by fluorescence-intensity-based image processing (Figure 6B) confirmed tracer uptake in the nerve after intravenous administration (SBR: 1.9) and after intraneural administration (SBR: 4.9).

4. Discussion

Methodological peptide truncation was shown to provide a successful optimization route, resulting in the selection of Cy5-P0112–125. This P0-specific peptide showed a 1.5-fold increase in affinity compared to the lead compound Cy5-P0101–125 (Figure 3; p = 0.01), while a 47% reduction in the number of incorporated amino acids was realized (from 26 (101–125; KNPPDIVGKTSQVTLYVFEKVPTRY) to 14 (112–125; QVTLYVFEKVPTRY), Figure 1). This route not only allowed the generation of a new lead, but also provided increased mechanistic insight into the molecular requirements of P0 binding.
Truncation combined with affinity studies (Figure 3), chemical analysis (Table 1), and P0 crystal structure observations (Figure 3 and Figure 4, and Table 2) gave interesting insights into the (homotypic) peptide binding of the P0 proteins. P0-related affinity seems to be dominated by two primary binding interactions. The first is the apparent anchoring function of the C-terminal VPTRY121–125 sequence [41], a feature that was shown to be critical in the positioning of the P0 proteins, and, in particular, the GKTSQVTLYVFE108–119 pharmacophore, for binding. (Figure 3). The GKTSQVTL108–115 portion of the original lead sequence was shown to have the most prominent effect on P0-related binding. The presence of Q112 in this sequence seemingly facilitates the targeting of V107, while the remaining amino acids provide a supporting function. More specifically, YVFE116–119 on its own did not show affinity for P0, but one can argue that its main role is to help facilitate the positioning of Q112.
Previous work on P0-derived myelin-targeting peptides indicates that this target is specific for the peripheral nervous system [27], reducing the risk of late-term toxic effects due to accumulation in the CNS. This feature is a common side effect for small-molecule nerve agents derived from, e.g., the neural imaging agent Pittsburgh compound B [20,22,42,43]. Various studies have put forward local tracer administration as a means to decrease uptake beyond the surgical field [19,27,44]. This strategy is generally employed to help boost the effective local concentration and, as such, facilitate a positive effect on local targeting. In line with our previous work on Cy5-P0101–125 [27], the porcine studies in Figure 6 indicate that intravenous injection of Cy7-P0112–125 in the vessel leading to the organ of choice did indeed induce staining of the vagus nerve. As previously shown for other targeted tracers, optimization of the dosing and timing is expected to provide higher SBR values, further adding to the utility of this administration strategy [29]. While intraneural administration yielded explicit nerve staining with a high SBR, longitudinal studies are needed to determine whether this administration route could have negative effects on nerve viability.
Surgical visualization of nerves may not only serve head-and-neck surgery, but also help promote nerve sparing in, e.g., neuro-, orthopedic, colorectal, bladder, and prostate surgery. As surgery is moving increasingly towards minimally invasive (robotic) approaches, it is critical that the nerve-specific tracers are compatible with clinical-grade endoscopic camera systems. To this end, the far-red Cy5 dye (lex = 650 nm, lem = 667 nm) has demonstrated compatibility with a KARL STORZ prototype [40,45], while the near-infrared Cy7 dye (lex = 750 nm, lem = 777 nm; [16]) is compatible with the Image 1 S Rubina (KARL STORZ) and the Firefly endoscope+ (Intuitive) set-up. These features will promote further dissemination.

5. Conclusions

Methodological truncation of the lead compound Cy5-P0101–125, combined with assessment of the crystal structure of the extracellular portion of P0 and inter- and intra-molecular binding interactions, resulted in the selection of the optimized tracer Cy5-P0112–125. This high-affinity tracer allowed effective P0-related staining in vitro, and its Cy7 derivative was shown to be compatible with clinical-grade fluorescence imaging devices during nerve imaging in a porcine model.

6. Patents

European patent application No.16180535.3.

Supplementary Materials

The following supporting information can be downloaded at: https://www.mdpi.com/article/10.3390/biom13060942/s1, Figure S1: Mass spectrum of Cy5-P0101–125. m/z [M+3H—979.7]; Figure S2: Mass spectrum of Cy5-P0101–120. m/z [M+3H—1999.3]; Figure S3: Mass spectrum of Cy5-P0101–115. m/z [M+3H—877.4]; Figure S4: Mass spectrum of Cy5-C-P0101–110. m/z [M+2H –1051.0 ]; Figure S5: Mass spectrum of Cy5-P0101–106. m/z [M+2H—858.5]; Figure S6. Mass spectrum of Cy5-P0105–125. m/z [M+3H+ Na+—1165.3]; Figure S7: Mass spectrum of Cy5-P0108–125. m/z [M+2H– 1050.7]; Figure S8: Mass spectrum of Cy5-P0112–125.m/z [M+2H—1389.0]; Figure S9: Mass spectrum of Cy5-P0116–125. m/z [M+2H—1167.6]; Figure S10: Mass spectrum of Cy5-P0120–125. m/z [M+2H—898.0]; Figure S11: Mass spectrum of Maleimide-(SO3)Cy5(SO3)Sulfonate. m/z [M—913.4]; Figure S12: Mass spectrum of Cy7-P0112–125. m/z [M+2H—1400.8]; Figure S13: Surface plot analysis fluorescence confocal images; Table S1: Semi-quatitative assessment of co-localization staining P0 tracers and lysosomal and nuclear control staining.

Author Contributions

Conceptualization, F.W.B.v.L. and T.B.; methodology, N.B., M.P.v.M., S.A., D.M.v.W., S.N.L. and M.N.v.O.; software, S.A., S.N.L. and M.N.v.O.; validation, N.B., M.P.v.M. and D.M.v.W.; formal analysis, N.B., M.P.v.M., S.A., F.W.B.v.L. and T.B.; investigation, N.B., M.P.v.M., S.A., D.M.v.W., L.J.S., S.N.L., M.N.v.O. and T.B.; resources, F.W.B.v.L. and T.B.; data curation, N.B., D.M.v.W., L.J.S. and T.B.; writing—original draft preparation, N.B., M.P.v.M., F.W.B.v.L. and T.B.; writing—review and editing, N.B., M.P.v.M., F.W.B.v.L. and T.B.; visualization, N.B., M.P.v.M., S.A., S.N.L., M.N.v.O. and T.B.; supervision, F.W.B.v.L. and T.B.; project administration, N.B. and T.B.; funding acquisition, F.W.B.v.L. and T.B. All authors have read and agreed to the published version of the manuscript.

Funding

This research was funded by the Research Foundation of Flanders (Grant no. FWO S000922N), an ERC proof-of-concept grant (790079), and an NWO-TTW-VICI (TTW BGT16141) grant supported by the Dutch Research Council.

Institutional Review Board Statement

The animal study protocol was approved by the Institutional Review Board of the University of Ghent (EC2019/79).

Informed Consent Statement

Not applicable.

Data Availability Statement

The data presented in this study are available on request from the corresponding author. The data are not publicly available due to patent restrictions.

Conflicts of Interest

The authors declare no conflict of interest.

References

  1. Berger, D.; van den Berg, N.; van der Noort, V.; van der Hiel, B.; Valdés Olmos, R.A.; Buckle, T.A.; KleinJan, G.; Brouwer, O.R.; Vermeeren, L.; Karakullukçu, B.; et al. Technological (R)Evolution Leads to Detection of More Sentinel Nodes in Patients with Melanoma in the Head and Neck Region. J. Nucl. Med. 2021, 62, 1357–1362. [Google Scholar] [CrossRef]
  2. KleinJan, G.H.; Bunschoten, A.; van den Berg, N.S.; Olmos, R.A.; Klop, W.M.; Horenblas, S.; van der Poel, H.G.; Wester, H.J.; van Leeuwen, F.W. Fluorescence guided surgery and tracer-dose, fact or fiction? Eur. J. Nucl. Med. Mol. Imaging 2016, 43, 1857–1867. [Google Scholar] [CrossRef] [PubMed] [Green Version]
  3. Lee, Y.J.; Krishnan, G.; Nishio, N.; van den Berg, N.S.; Lu, G.; Martin, B.A.; van Keulen, S.; Colevas, A.D.; Kapoor, S.; Liu, J.T.C.; et al. Intraoperative Fluorescence-Guided Surgery in Head and Neck Squamous Cell Carcinoma. Laryngoscope 2021, 131, 529–534. [Google Scholar] [CrossRef] [PubMed]
  4. Vonk, J.; de Wit, J.G.; Voskuil, F.J.; Witjes, M.J.H. Improving oral cavity cancer diagnosis and treatment with fluorescence molecular imaging. Oral. Dis. 2021, 27, 21–26. [Google Scholar] [CrossRef] [PubMed] [Green Version]
  5. Christensen, A.; Juhl, K.; Kiss, K.; Lelkaitis, G.; Charabi, B.W.; Mortensen, J.; Kjær, A.; von Buchwald, C. Near-infrared fluorescence imaging improves the nodal yield in neck dissection in oral cavity cancer—A randomized study. Eur. J. Surg. Oncol. 2019, 45, 2151–2158. [Google Scholar] [CrossRef]
  6. Zanoni, D.K.; Stambuk, H.E.; Madajewski, B.; Montero, P.H.; Matsuura, D.; Busam, K.J.; Ma, K.; Turker, M.Z.; Sequeira, S.; Gonen, M.; et al. Use of Ultrasmall Core-Shell Fluorescent Silica Nanoparticles for Image-Guided Sentinel Lymph Node Biopsy in Head and Neck Melanoma: A Nonrandomized Clinical Trial. JAMA Netw. Open 2021, 4, e211936. [Google Scholar] [CrossRef]
  7. KleinJan, G.H.; van Werkhoven, E.; van den Berg, N.S.; Karakullukcu, M.B.; Zijlmans, H.; van der Hage, J.A.; van de Wiel, B.A.; Buckle, T.; Klop, W.M.C.; Horenblas, S.; et al. The best of both worlds: A hybrid approach for optimal pre- and intraoperative identification of sentinel lymph nodes. Eur. J. Nucl. Med. Mol. Imaging 2018, 45, 1915–1925. [Google Scholar] [CrossRef] [Green Version]
  8. Maurer, T.; Robu, S.; Schottelius, M.; Schwamborn, K.; Rauscher, I.; van den Berg, N.S.; van Leeuwen, F.W.B.; Haller, B.; Horn, T.; Heck, M.M.; et al. (99m)Technetium-based Prostate-specific Membrane Antigen-radioguided Surgery in Recurrent Prostate Cancer. Eur. Urol. 2019, 75, 659–666. [Google Scholar] [CrossRef]
  9. Maurer, T.; Weirich, G.; Schottelius, M.; Weineisen, M.; Frisch, B.; Okur, A.; Kübler, H.; Thalgott, M.; Navab, N.; Schwaiger, M.; et al. Prostate-specific membrane antigen-radioguided surgery for metastatic lymph nodes in prostate cancer. Eur. Urol. 2015, 68, 530–534. [Google Scholar] [CrossRef]
  10. Nishio, N.; van den Berg, N.S.; van Keulen, S.; Martin, B.A.; Fakurnejad, S.; Teraphongphom, N.; Chirita, S.U.; Oberhelman, N.J.; Lu, G.; Horton, C.E.; et al. Optical molecular imaging can differentiate metastatic from benign lymph nodes in head and neck cancer. Nat. Commun. 2019, 10, 5044. [Google Scholar] [CrossRef] [Green Version]
  11. Voskuil, F.J.; de Jongh, S.J.; Hooghiemstra, W.T.R.; Linssen, M.D.; Steinkamp, P.J.; de Visscher, S.; Schepman, K.P.; Elias, S.G.; Meersma, G.J.; Jonker, P.K.C.; et al. Fluorescence-guided imaging for resection margin evaluation in head and neck cancer patients using cetuximab-800CW: A quantitative dose-escalation study. Theranostics 2020, 10, 3994–4005. [Google Scholar] [CrossRef] [PubMed]
  12. Buckle, T.; KleinJan, G.H.; Engelen, T.; van den Berg, N.S.; DeRuiter, M.C.; van der Heide, U.; Valdes Olmos, R.A.; Webb, A.; van Buchem, M.A.; Balm, A.J.; et al. Diffusion-weighted-preparation (D-prep) MRI as a future extension of SPECT/CT based surgical planning for sentinel node procedures in the head and neck area? Oral. Oncol. 2016, 60, 48–54. [Google Scholar] [CrossRef]
  13. Kolokythas, A. Long-term surgical complications in the oral cancer patient: A comprehensive review. Part I. J. Oral. Maxillofac. Res. 2010, 1, e1. [Google Scholar] [CrossRef] [PubMed]
  14. Godballe, C.; Madsen, A.R.; Sørensen, C.H.; Schytte, S.; Trolle, W.; Helweg-Larsen, J.; Barfoed, L.; Kristiansen, L.; Sørensen, V.Z.; Samuelsen, G.; et al. Risk factors for recurrent nerve palsy after thyroid surgery: A national study of patients treated at Danish departments of ENT Head and Neck Surgery. Eur. Arch. Otorhinolaryngol. 2014, 271, 2267–2276. [Google Scholar] [CrossRef] [PubMed]
  15. Møller, M.N.; Sørensen, C.H. Risk of marginal mandibular nerve injury in neck dissection. Eur. Arch. Otorhinolaryngol. 2012, 269, 601–605. [Google Scholar] [CrossRef]
  16. van Beurden, F.; van Willigen, D.M.; Vojnovic, B.; van Oosterom, M.N.; Brouwer, O.R.; der Poel, H.G.V.; Kobayashi, H.; van Leeuwen, F.W.B.; Buckle, T. Multi-Wavelength Fluorescence in Image-Guided Surgery, Clinical Feasibility and Future Perspectives. Mol. Imaging 2020, 19, 1536012120962333. [Google Scholar] [CrossRef]
  17. van Leeuwen, F.W.; Hardwick, J.C.; van Erkel, A.R. Luminescence-based Imaging Approaches in the Field of Interventional Molecular Imaging. Radiology 2015, 276, 12–29. [Google Scholar] [CrossRef]
  18. Chen, Y.; Zhang, H.; Lei, Z.; Zhang, F. Recent Advances in Intraoperative Nerve Bioimaging: Fluorescence-Guided Surgery for Nerve Preservation. Small Struct. 2020, 1, 2000036. [Google Scholar] [CrossRef]
  19. Barth, C.W.; Gibbs, S.L. Direct Administration of Nerve-Specific Contrast to Improve Nerve Sparing Radical Prostatectomy. Theranostics 2017, 7, 573–593. [Google Scholar] [CrossRef]
  20. Gibbs-Strauss, S.L.; Nasr, K.A.; Fish, K.M.; Khullar, O.; Ashitate, Y.; Siclovan, T.M.; Johnson, B.F.; Barnhardt, N.E.; Tan Hehir, C.A.; Frangioni, J.V. Nerve-highlighting fluorescent contrast agents for image-guided surgery. Mol. Imaging 2011, 10, 91–101. [Google Scholar] [CrossRef] [PubMed] [Green Version]
  21. Gustafson, T.P.; Yan, Y.; Newton, P.; Hunter, D.A.; Achilefu, S.; Akers, W.J.; Mackinnon, S.E.; Johnson, P.J.; Berezin, M.Y. A NIR Dye for Development of Peripheral Nerve Targeted Probes. Medchemcomm 2012, 3, 685–690. [Google Scholar] [CrossRef] [Green Version]
  22. Park, M.H.; Hyun, H.; Ashitate, Y.; Wada, H.; Park, G.; Lee, J.H.; Njiojob, C.; Henary, M.; Frangioni, J.V.; Choi, H.S. Prototype nerve-specific near-infrared fluorophores. Theranostics 2014, 4, 823–833. [Google Scholar] [CrossRef] [Green Version]
  23. Hingorani, D.V.; Whitney, M.A.; Friedman, B.; Kwon, J.K.; Crisp, J.L.; Xiong, Q.; Gross, L.; Kane, C.J.; Tsien, R.Y.; Nguyen, Q.T. Nerve-targeted probes for fluorescence-guided intraoperative imaging. Theranostics 2018, 8, 4226–4237. [Google Scholar] [CrossRef]
  24. Hussain, T.; Mastrodimos, M.B.; Raju, S.C.; Glasgow, H.L.; Whitney, M.; Friedman, B.; Moore, J.D.; Kleinfeld, D.; Steinbach, P.; Messer, K.; et al. Fluorescently labeled peptide increases identification of degenerated facial nerve branches during surgery and improves functional outcome. PLoS ONE 2015, 10, e0119600. [Google Scholar] [CrossRef]
  25. Whitney, M.A.; Crisp, J.L.; Nguyen, L.T.; Friedman, B.; Gross, L.A.; Steinbach, P.; Tsien, R.Y.; Nguyen, Q.T. Fluorescent peptides highlight peripheral nerves during surgery in mice. Nat. Biotechnol. 2011, 29, 352–356. [Google Scholar] [CrossRef] [PubMed]
  26. Berehova, N.; Buckle, T.; van Meerbeek, M.P.; Bunschoten, A.; Velders, A.H.; van Leeuwen, F.W.B. Nerve Targeting via Myelin Protein Zero and the Impact of Dimerization on Binding Affinity. Molecules 2022, 27, 9015. [Google Scholar] [CrossRef] [PubMed]
  27. Buckle, T.; Hensbergen, A.W.; van Willigen, D.M.; Bosse, F.; Bauwens, K.; Pelger, R.C.M.; van Leeuwen, F.W.B. Intraoperative visualization of nerves using a myelin protein-zero specific fluorescent tracer. EJNMMI Res. 2021, 11, 50. [Google Scholar] [CrossRef] [PubMed]
  28. Raasakka, A.; Kursula, P. How Does Protein Zero Assemble Compact Myelin? Cells 2020, 9, 1832. [Google Scholar] [CrossRef]
  29. Buckle, T.; van Willigen, D.M.; Welling, M.M.; van Leeuwen, F.W.B. Pre-clinical development of fluorescent tracers and translation towards clinical application. In Nuclear Medicine and Molecular Imaging; Signore, A., Ed.; Elsevier: Oxford, UK, 2022; pp. 644–661. [Google Scholar]
  30. D’Urso, D.; Brophy, P.J.; Staugaitis, S.M.; Gillespie, C.S.; Frey, A.B.; Stempak, J.G.; Colman, D.R. Protein zero of peripheral nerve myelin: Biosynthesis, membrane insertion, and evidence for homotypic interaction. Neuron 1990, 4, 449–460. [Google Scholar] [CrossRef]
  31. Bunschoten, A.; van Willigen, D.M.; Buckle, T.; van den Berg, N.S.; Welling, M.M.; Spa, S.J.; Wester, H.J.; van Leeuwen, F.W. Tailoring Fluorescent Dyes To Optimize a Hybrid RGD-Tracer. Bioconjug Chem. 2016, 27, 1253–1258. [Google Scholar] [CrossRef]
  32. Lopalco, M.; Koini, E.N.; Cho, J.K.; Bradley, M. Catch and release microwave mediated synthesis of cyanine dyes. Org. Biomol. Chem. 2009, 7, 856–859. [Google Scholar] [CrossRef] [PubMed]
  33. Shershov, V.E.; Spitsyn, M.A.; Kuznetsova, V.E.; Timofeev, E.N.; Ivashkina, O.A.; Abramov, I.S.; Nasedkina, T.V.; Zasedatelev, A.S.; Chudinov, A.V. Near-infrared heptamethine cyanine dyes. Synthesis, spectroscopic characterization, thermal properties and photostability. Dye Pigment. 2013, 97, 353–360. [Google Scholar] [CrossRef]
  34. Kuil, J.; Buckle, T.; Yuan, H.; van den Berg, N.S.; Oishi, S.; Fujii, N.; Josephson, L.; van Leeuwen, F.W. Synthesis and evaluation of a bimodal CXCR4 antagonistic peptide. Bioconjug. Chem. 2011, 22, 859–864. [Google Scholar] [CrossRef] [Green Version]
  35. Berrens, A.C.; van Oosterom, M.N.; Slof, L.J.; van Leeuwen, F.W.B.; van der Poel, H.G.; Buckle, T. Three-way multiplexing in prostate cancer patients—Combining a bimodal sentinel node tracer with multicolor fluorescence imaging. Eur. J. Nucl. Med. Mol. Imaging 2022, 50, 1262–1263. [Google Scholar] [CrossRef]
  36. Spa, S.J.; Hensbergen, A.W.; van der Wal, S.; Kuil, J.; van Leeuwen, F.W.B. The influence of systematic structure alterations on the photophysical properties and conjugation characteristics of asymmetric cyanine 5 dyes. Dye Pigment. 2018, 152, 19–28. [Google Scholar] [CrossRef] [Green Version]
  37. Azargoshasb, S.; Boekestijn, I.; Roestenberg, M.; KleinJan, G.H.; van der Hage, J.A.; van der Poel, H.G.; Rietbergen, D.D.D.; van Oosterom, M.N.; van Leeuwen, F.W.B. Quantifying the Impact of Signal-to-background Ratios on Surgical Discrimination of Fluorescent Lesions. Mol. Imaging Biol. 2023, 25, 180–189. [Google Scholar] [CrossRef] [PubMed]
  38. Shapiro, L.; Doyle, J.P.; Hensley, P.; Colman, D.R.; Hendrickson, W.A. Structure of Myelin Membrane Adhesion Molecule P0. Available online: https://www.rcsb.org/structure/1NEU (accessed on 29 March 2023).
  39. van den Berg, N.S.; Miwa, M.; KleinJan, G.H.; Sato, T.; Maeda, Y.; van Akkooi, A.C.; Horenblas, S.; Karakullukcu, B.; van Leeuwen, F.W. (Near-Infrared) Fluorescence-Guided Surgery Under Ambient Light Conditions: A Next Step to Embedment of the Technology in Clinical Routine. Ann. Surg. Oncol. 2016, 23, 2586–2595. [Google Scholar] [CrossRef] [Green Version]
  40. Buckle, T.; van Alphen, M.; van Oosterom, M.N.; van Beurden, F.; Heimburger, N.; van der Wal, J.E.; van den Brekel, M.; van Leeuwen, F.W.B.; Karakullukcu, B. Translation of c-Met Targeted Image-Guided Surgery Solutions in Oral Cavity Cancer-Initial Proof of Concept Data. Cancers 2021, 13, 2674. [Google Scholar] [CrossRef]
  41. Shapiro, L.; Doyle, J.P.; Hensley, P.; Colman, D.R.; Hendrickson, W.A. Crystal structure of the extracellular domain from P0, the major structural protein of peripheral nerve myelin. Neuron 1996, 17, 435–449. [Google Scholar] [CrossRef] [Green Version]
  42. Morris, J.C.; Roe, C.M.; Grant, E.A.; Head, D.; Storandt, M.; Goate, A.M.; Fagan, A.M.; Holtzman, D.M.; Mintun, M.A. Pittsburgh Compound B Imaging and Prediction of Progression from Cognitive Normality to Symptomatic Alzheimer Disease. Arch. Neurol. 2009, 66, 1469–1475. [Google Scholar] [CrossRef] [Green Version]
  43. Puchtler, H.; Sweat, F.; Levine, M. On The Binding of Congo Red by Amyloid. J. Histochem. Cytochem. 1962, 10, 355–364. [Google Scholar] [CrossRef] [Green Version]
  44. KleinJan, G.H.; Buckle, T.; van Willigen, D.M.; van Oosterom, M.N.; Spa, S.J.; Kloosterboer, H.E.; van Leeuwen, F.W. Fluorescent lectins for local in vivo visualization of peripheral nerves. Molecules 2014, 19, 9876–9892. [Google Scholar] [CrossRef] [PubMed] [Green Version]
  45. De Vries, H.M.; Bekers, E.; van Oosterom, M.N.; Karakullukcu, M.B.; van der Poel, H.G.; van Leeuwen, F.W.B.; Buckle, T.; Brouwer, O.R. c-MET Receptor-Targeted Fluorescence on the Road to Image-Guided Surgery in Penile Squamous Cell Carcinoma Patients. J. Nucl. Med. 2022, 63, 51–56. [Google Scholar] [CrossRef] [PubMed]
Figure 1. Methodological N- and C-terminal truncation of the lead compound Cy5-P0101–125 (center), resulting in N- (red arrow; top) and C-terminal (black arrow; bottom) truncation matrices. Peptide labelling with F (fluorophore) was achieved using a maleimide–cysteine coupling at the N-terminal face of each peptide.
Biomolecules 13 00942 g001
Figure 2. P0-related cellular staining. Two-dimensional fluorescence confocal imaging for assessment of P0-related staining of (A) the tracers in the C-terminal matrix (Cy5-P0101–125, Cy5-P0101–120, Cy5-P0101–115, Cy5-P0101–110, and Cy5-P0101–106) and (B) the tracers in the N-terminal matrix (Cy5-P0105–125, Cy5-P0108–125, Cy5-P0112–125, Cy5-P0116–125, and Cy5-P0120–125) in P0-expressing RT4 Schwannoma cultures. P0-related staining (Cy5) in red, lysosomes in green, and nuclear staining in blue. Yellow line: orientation 3D analysis; white arrows: examples of locations of cellular outgrowth within the sample.
Biomolecules 13 00942 g002
Figure 3. Affinity of truncated peptide matrixes. (A) Affinity (KD) values for N- and C-terminal truncated peptides determined via saturation binding using P0-expressing RT4 Schwannoma cells. * Obtained from [27]. (B) A 3D representation of the increase in signal intensity and (C) saturation binding curve over the applied concentration range (0–2000 nM) for the sequence with the highest KD, namely, Cy5-P0112–125.
Biomolecules 13 00942 g003
Figure 4. Correlation of P0-related interactions and binding. (A) Hierarchical clustering of standardized data values of features of truncated compounds (red—higher rate of the relation between the features, blue—negative relation). (B) Pearson correlation. The color bar represents the correlation strength between the tracers’ features (red—positive correlation, blue—negative correlation). (C) Lead and truncated P0-targeting peptides Cy5-P0101–125 and Cy5-P0112–125. Hydrogen donors (blue) and acceptors (red) that support inter- or intra-molecular interactions have been indicated on peptide sequences. The importance of the peptide sequences is color coded, with the most important binders in green and the least important ones in red. F, fluorophore.
Biomolecules 13 00942 g004
Figure 5. Inter- and intra-molecular amino acid interactions in the G B-helix of P0. Representation of the crystal structure of the extracellular portion of P0 and binding between two P0 molecules (in green and purple). C denotes the C-terminus and N denotes the N-terminus of the P0 molecule. A’, G, and F highlight the involved β sheets. Intermolecular interactions between Q112 and V107 (top left), intramolecular interaction of TLYVFE114–119 with β sheet A’ (top right), and intramolecular interactions between N102 and V107 are highlighted.
Biomolecules 13 00942 g005
Figure 6. In vivo and ex vivo imaging using Cy7-P0112–125. (A) In vivo whitelight and fluorescence imaging using a clinical-grade hand-held fluorescence camera after local intravenous or intraneural tracer administration. Arrow: location of the vagus nerve. (B) Ex vivo fluorescence-based color-coded intensity-based image-processing evaluation of excised nerve tissue showing fluorescence in green and that allowed evaluation of the signal-to-background ratio (SBR).
Biomolecules 13 00942 g006
Table 1. Chemical and photophysical properties of P0-targeting fluorescent tracers.
Solubility
(µM)
LogPSerum
Binding
Brightness
(in HSA)
Net Charge
Cy5-P0101–125172−1.39 + 0.0989 + 2%67,760−1
Cy5-P0101–12015−0.99 ± 0.166 ± 12%137,940−2
Cy5-P0101–115>400−0.80 ± 0.1660 ± 9%217,800−2
Cy5-P0101–110>400−0.73 ± 0.1255 ± 8%111,320−2
Cy5-P0101–106>400−0.95 ± 0.0547 ± 7%118,580−3
Cy5-P0105–1259−0.60 ± 0.0456 ± 8%157,300−2
Cy5-P0108–12525−1.34 + 0.0369 ± 7%58,080−1
Cy5-P0112–12571−1.08 + 0.0350 + 3%121,000−2
Cy5-P0116–125150−1.58 + 0.0381 + 5%60,500−2
Cy5-P0120–125150−1.59 + 0.0171 ± 11%70,180−1
HSA = human serum albumin.
Table 2. Inter- and intra-molecular interactions.
No. of AcceptorsNo. of DonorsNo. of Intramolecular Interactions No. of Intermolecular Interactions
Cy5-P0101–1254039263
Cy5-P0101–1202929262
Cy5-P0101–1152422182
Cy5-P0101–110161481
Cy5-P0101–10610920
Cy5-P0105–1253633243
Cy5-P0108–1253228232
Cy5-P0112–1252621162
Cy5-P0116–125201581
Cy5-P0120–125131001
Disclaimer/Publisher’s Note: The statements, opinions and data contained in all publications are solely those of the individual author(s) and contributor(s) and not of MDPI and/or the editor(s). MDPI and/or the editor(s) disclaim responsibility for any injury to people or property resulting from any ideas, methods, instructions or products referred to in the content.

