
Multiple Inositol Polyphosphate Phosphatase Compartmentalization Separates Inositol Phosphate Metabolism from Inositol Lipid Signaling


 and
and 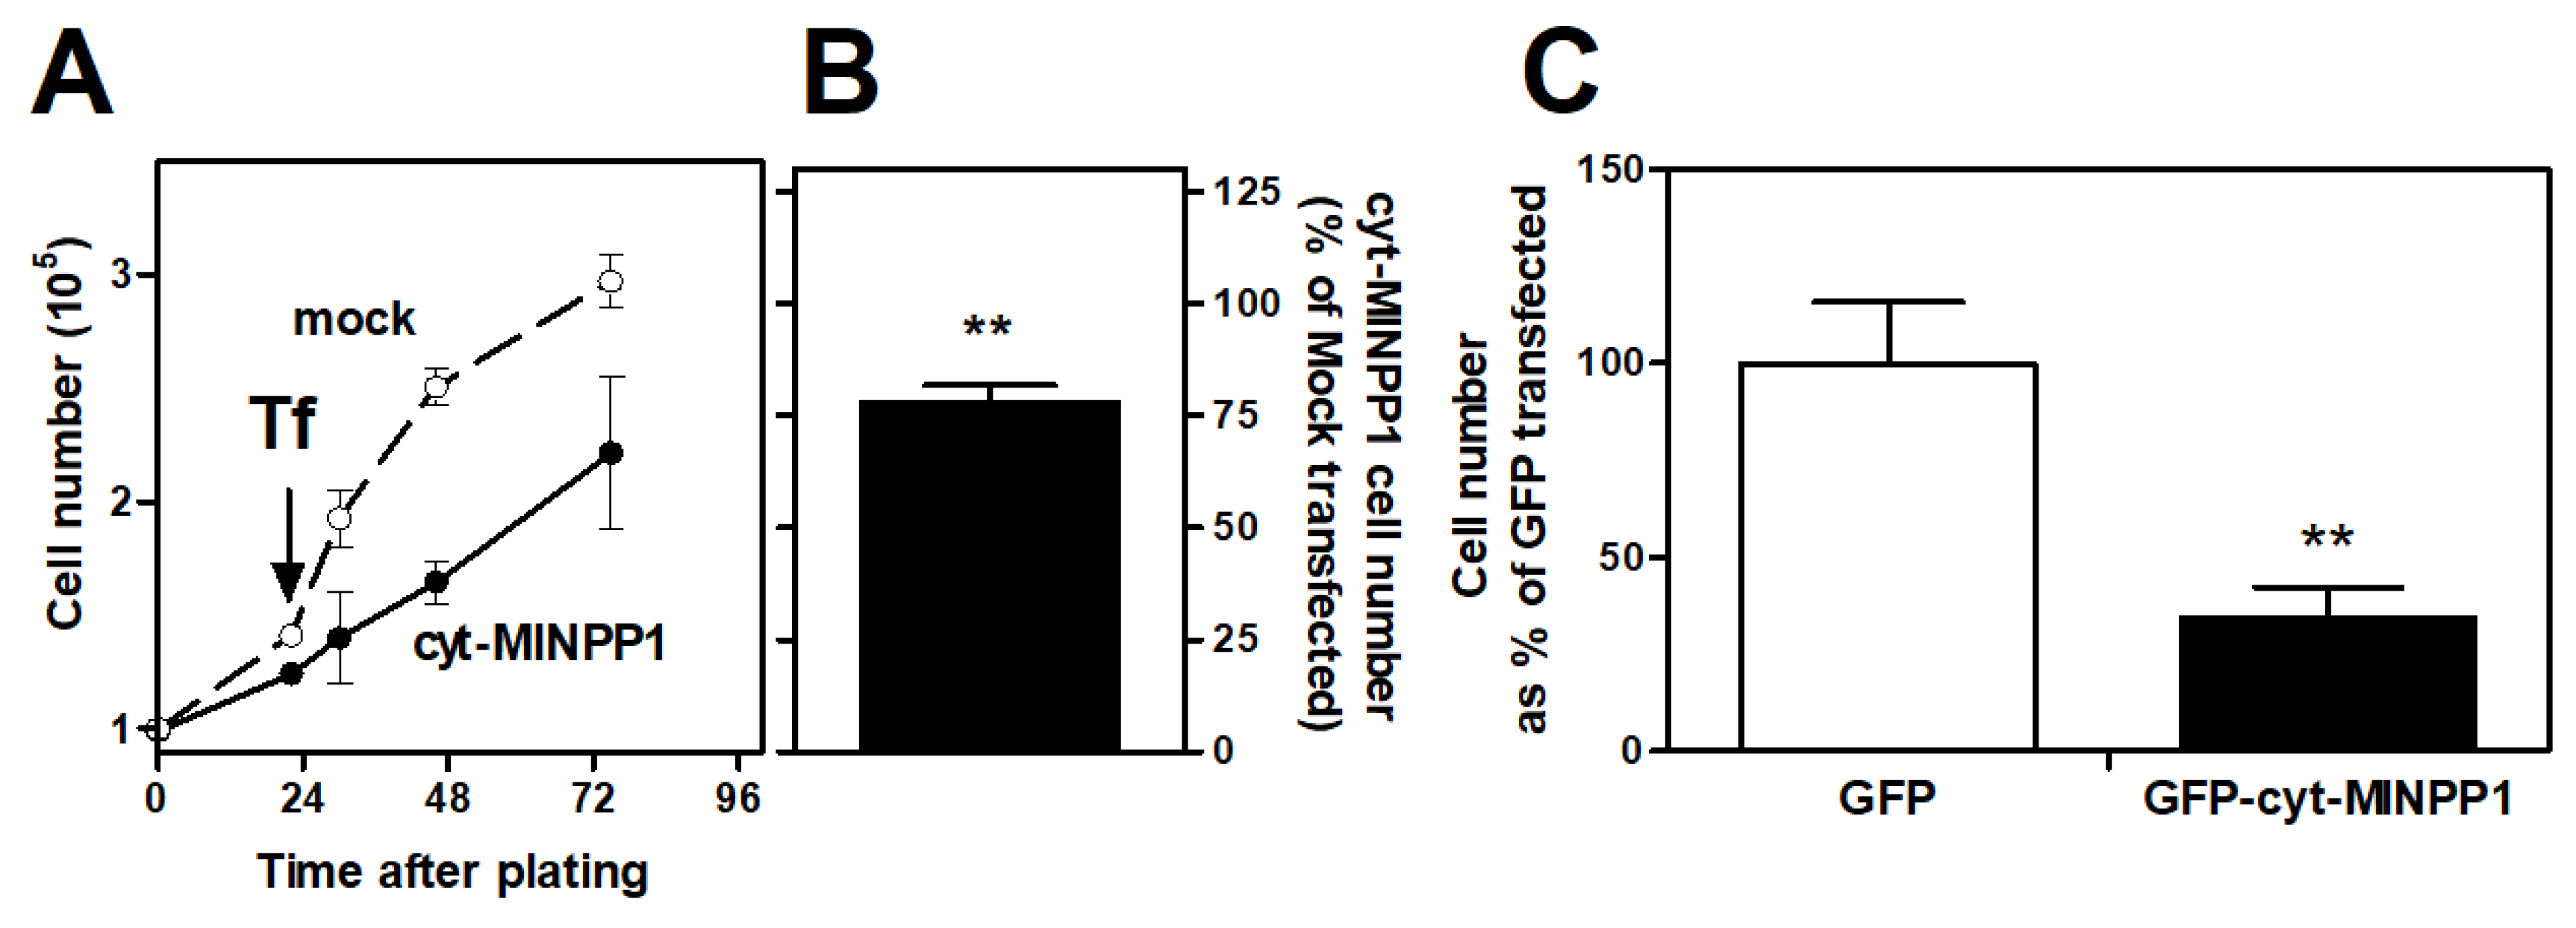
Abstract
1. Introduction
2. Materials & Methods
2.1. Preparation of GFP-Linked MINPP1 Constructs
2.2. Cell Culture, Transfection and Labelling Protocols
2.3. Confocal Microscopy and Colocalization
2.4. Inositol Lipid Analysis
2.5. HPLC
2.6. Assay of cyt-MINPP1 Activity
3. Results
3.1. Effect of cyt-MINPP1 on Cell Growth
3.2. Effect of cyt-MINPP1 Expression on PtdIns(3,4,5)P3

4. Discussion
5. Conclusions
Supplementary Materials
Author Contributions
Funding
Institutional Review Board Statement
Informed Consent Statement
Data Availability Statement
Acknowledgments
Conflicts of Interest
References
- Barker, C.J.; Berggren, P.-O. New Horizons in Cellular Regulation by Inositol Polyphosphates: Insights from the Pancreaticβ-Cell. Pharmacol. Rev. 2013, 65, 641–669. [Google Scholar] [CrossRef] [PubMed]
- Livermore, T.M.; Azevedo, C.; Kolozsvári, B.; Wilson, M.S.; Saiardi, A. Phosphate, inositol and polyphosphates. Biochem. Soc. Trans. 2016, 44, 253–259. [Google Scholar] [CrossRef] [PubMed]
- Irvine, R.F.; Schell, M.J. Back in the water: The return of the inositol phosphates. Nat. Rev. Mol. Cell Biol. 2001, 2, 327–338. [Google Scholar] [CrossRef] [PubMed]
- Kim, E.; Ahn, H.; Kim, M.G.; Lee, H.; Kim, S. The Expanding Significance of Inositol Polyphosphate Multikinase as a Signaling Hub. Mol. Cells 2017, 40, 315–321. [Google Scholar] [CrossRef]
- Trung, M.N.; Furkert, D.; Fiedler, D. Versatile signaling mechanisms of inositol pyrophosphates. Curr. Opin. Chem. Biol. 2022, 70, 102177. [Google Scholar] [CrossRef]
- Shears, S.B. Intimate connections: Inositol pyrophosphates at the interface of metabolic regulation and cell signaling. J. Cell. Physiol. 2018, 233, 1897–1912. [Google Scholar] [CrossRef]
- Hanakahi, L.A.; Bartlet-Jones, M.; Chappell, C.; Pappin, D.; West, S.C. Binding of Inositol Phosphate to DNA-PK and Stimulation of Double-Strand Break Repair. Cell 2000, 102, 721–729. [Google Scholar] [CrossRef]
- Orchiston, E.A.; Bennett, D.; Leslie, N.R.; Clarke, R.G.; Winward, L.; Downes, C.P.; Safrany, S.T. PTEN M-CBR3, a Versatile and Selective Regulator of Inositol 1,3,4,5,6-Pentakisphosphate (Ins(1,3,4,5,6)P5). J. Biol. Chem. 2004, 279, 1116–1122. [Google Scholar] [CrossRef]
- Morrison, B.H.; Bauer, J.A.; Kalvakolanu, D.V.; Lindner, D.J. Inositol Hexakisphosphate Kinase 2 Mediates Growth Suppressive and Apoptotic Effects of Interferon-β in Ovarian Carcinoma Cells. J. Biol. Chem. 2001, 276, 24965–24970. [Google Scholar] [CrossRef]
- Piccolo, E.; Vignati, S.; Maffucci, T.; Innominato, P.F.; Riley, A.M.; Potter, B.V.; Pandolfi, P.P.; Broggini, M.; Iacobelli, S.; Innocenti, P.; et al. Inositol pentakisphosphate promotes apoptosis through the PI 3-K/Akt pathway. Oncogene 2004, 23, 1754–1765. [Google Scholar] [CrossRef]
- Rameh, L.E.; Cantley, L.C. The Role of Phosphoinositide 3-Kinase Lipid Products in Cell Function. J. Biol. Chem. 1999, 274, 8347–8350. [Google Scholar] [CrossRef] [PubMed]
- Takenawa, T.; Itoh, T. Phosphoinositides, key molecules for regulation of actin cytoskeletal organization and membrane traffic from the plasma membrane. Biochim. Biophys. Acta BBA—Mol. Cell Biol. Lipids 2001, 1533, 190–206. [Google Scholar] [CrossRef] [PubMed]
- Vanhaesebroeck, B.; Leevers, S.J.; Ahmadi, K.; Timms, J.; Katso, R.; Driscoll, P.C.; Woscholski, R.; Parker, P.J.; Waterfield, M.D. Synthesis and Function of 3-Phosphorylated Inositol Lipids. Annu. Rev. Biochem. 2001, 70, 535–602. [Google Scholar] [CrossRef] [PubMed]
- Irvine, R.F. Nuclear lipid signalling. Nat. Rev. Mol. Cell Biol. 2003, 4, 349–360. [Google Scholar] [CrossRef] [PubMed]
- Insall, R.H.; Weiner, O.D. PIP3, PIP2, and Cell Movement—Similar Messages, Different Meanings? Dev. Cell 2001, 1, 743–747. [Google Scholar] [CrossRef]
- Eckmann, L.; Rudolf, M.T.; Ptasznik, A.; Schultz, C.; Jiang, T.; Wolfson, N.; Tsien, R.; Fierer, J.; Shears, S.B.; Kagnoff, M.F.; et al. d-myo -Inositol 1,4,5,6-tetrakisphosphate produced in human intestinal epithelial cells in response to Salmonella invasion inhibits phosphoinositide 3-kinase signaling pathways. Proc. Natl. Acad. Sci. USA 1997, 94, 14456–14460. [Google Scholar] [CrossRef]
- Caffrey, J.J.; Darden, T.; Wenk, M.R.; Shears, S.B. Expanding coincident signaling by PTEN through its inositol 1,3,4,5,6-pentakisphosphate 3-phosphatase activity. FEBS Lett. 2001, 499, 6–10. [Google Scholar] [CrossRef]
- Chakraborty, A.; Koldobskiy, M.A.; Bello, N.; Maxwell, M.; Potter, J.J.; Juluri, K.R.; Maag, D.; Kim, S.; Huang, A.S.; Dailey, M.J.; et al. Inositol Pyrophosphates Inhibit Akt Signaling, Thereby Regulating Insulin Sensitivity and Weight Gain. Cell 2010, 143, 897–910. [Google Scholar] [CrossRef]
- Maehama, T.; Dixon, J.E. The Tumor Suppressor, PTEN/MMAC1, Dephosphorylates the Lipid Second Messenger, Phosphatidylinositol 3,4,5-Trisphosphate. J. Biol. Chem. 1998, 273, 13375–13378. [Google Scholar] [CrossRef]
- Nogimori, K.; Hughes, P.; Glennon, M.; Hodgson, M.; Putney, J.W., Jr.; Shears, S. Purification of an inositol (1,3,4,5)-tetrakisphosphate 3-phosphatase activity from rat liver and the evaluation of its substrate specificity. J. Biol. Chem. 1991, 266, 16499–16506. [Google Scholar] [CrossRef]
- Craxton, A.; Caffrey, J.J.; Burkhart, W.; Safrany, S.; Shears, S.B. Molecular cloning and expression of a rat hepatic multiple inositol polyphosphate phosphatase. Biochem. J. 1997, 328, 75–81. [Google Scholar] [CrossRef] [PubMed]
- Van Dijken, P.; de Haas, J.-R.; Craxton, A.; Erneux, C.; Shears, S.B.; Van Haastert, P.J. A Novel, Phospholipase C-independent Pathway of Inositol 1,4,5-Trisphosphate Formation in Dictyostelium and Rat Liver. J. Biol. Chem. 1995, 270, 29724–29731. [Google Scholar] [CrossRef] [PubMed]
- Yu, J.; Leibiger, B.; Yang, S.-N.; Caffery, J.J.; Shears, S.B.; Leibiger, I.B.; Barker, C.J.; Berggren, P.-O. Cytosolic multiple inositol polyphosphate phosphatase in the regulation of cytoplasmic free Ca2+ concentration. J. Biol. Chem. 2003, 278, 46210–46218. [Google Scholar] [CrossRef] [PubMed]
- Caffrey, J.J.; Hidaka, K.; Matsuda, M.; Hirata, M.; Shears, S. The human and rat forms of multiple inositol polyphosphate phosphatase: Functional homology with a histidine acid phosphatase up-regulated during endochondral ossification. FEBS Lett. 1999, 442, 99–104. [Google Scholar] [CrossRef] [PubMed]
- Kilaparty, S.P.; Agarwal, R.; Singh, P.; Kannan, K.; Ali, N. Endoplasmic reticulum stress-induced apoptosis accompanies enhanced expression of multiple inositol polyphosphate phosphatase 1 (Minpp1): A possible role for Minpp1 in cellular stress response. Cell Stress Chaperon. 2016, 21, 593–608. [Google Scholar] [CrossRef] [PubMed]
- Ucuncu, E.; Rajamani, K.; Wilson, M.S.C.; Medina-Cano, D.; Altin, N.; David, P.; Barcia, G.; Lefort, N.; Banal, C.; Vasilache-Dangles, M.-T.; et al. MINPP1 prevents intracellular accumulation of the chelator inositol hexakisphosphate and is mutated in Pontocerebellar Hypoplasia. Nat. Commun. 2020, 11, 6087. [Google Scholar] [CrossRef] [PubMed]
- Ali, N.; Craxton, A.; Shears, S. Hepatic Ins(1,3,4,5)P4 3-phosphatase is compartmentalized inside endoplasmic reticulum. J. Biol. Chem. 1993, 268, 6161–6167. [Google Scholar] [CrossRef]
- Chi, H.; Yang, X.; Kingsley, P.D.; O’Keefe, R.J.; Puzas, J.E.; Rosier, R.N.; Shears, S.B.; Reynolds, P.R. Targeted Deletion of Minpp1 Provides New Insight into the Activity of Multiple Inositol Polyphosphate Phosphatase In Vivo. Mol. Cell. Biol. 2000, 20, 6496–6507. [Google Scholar] [CrossRef]
- Trung, M.N.; Kieninger, S.; Fandi, Z.; Qiu, D.; Liu, G.; Mehendale, N.K.; Saiardi, A.; Jessen, H.; Keller, B.; Fiedler, D. Stable Isotopomers of myo-Inositol Uncover a Complex MINPP1-Dependent Inositol Phosphate Network. ACS Central Sci. 2022, 8, 1683–1694. [Google Scholar] [CrossRef]
- Leibiger, I.B.; Walther, R.; Pett, U.; Leibiger, B. Positive and negative regulatory elements are involved in transcriptional control of the rat glucokinase gene in the insulin producing cell line HIT M2.2.2. FEBS Lett. 1994, 337, 161–166. [Google Scholar] [CrossRef]
- Anderson, K.E.; Stephens, L.R.; Hawkins, P.T. Phosphoinositide 3-kinases. In Signal Transduction: A Practical Approach, 2nd ed.; Milligan, G., Ed.; Oxford University Press: Oxford, UK, 1999; pp. 283–300. [Google Scholar]
- Leibiger, B.; Leibiger, I.B.; Moede, T.; Kemper, S.; Kulkarni, R.N.; Kahn, C.; de Vargas, L.M.; Berggren, P.-O. Selective Insulin Signaling through A and B Insulin Receptors Regulates Transcription of Insulin and Glucokinase Genes in Pancreatic β Cells. Mol. Cell 2001, 7, 559–570. [Google Scholar] [CrossRef] [PubMed]
- Clark, J.; Anderson, K.E.; Juvin, V.; Smith, T.S.; Karpe, F.; Wakelam, M.J.O.; Stephens, L.R.; Hawkins, P.T. Quantification of PtdInsP3 molecular species in cells and tissues by mass spectrometry. Nat. Methods 2011, 8, 267–272. [Google Scholar] [CrossRef] [PubMed]
- Spinelli, L.; Leslie, N.R. Assaying PTEN catalysis in vitro. Methods 2015, 77–78, 51–57. [Google Scholar] [CrossRef] [PubMed]
- Harishchandra, R.K.; Neumann, B.M.; Gericke, A.; Ross, A.H. Biophysical methods for the characterization of PTEN/lipid bilayer interactions. Methods 2015, 77–78, 125–135. [Google Scholar] [CrossRef]
- Maehama, T.; Taylor, G.S.; Slama, J.T.; Dixon, J.E. A Sensitive Assay for Phosphoinositide Phosphatases. Anal. Biochem. 2000, 279, 248–250. [Google Scholar] [CrossRef]
- Cho, J.; Choi, K.; Darden, T.; Reynolds, P.R.; Petitte, J.N.; Shears, S.B. Avian multiple inositol polyphosphate phosphatase is an active phytase that can be engineered to help ameliorate the planet’s “phosphate crisis”. J. Biotechnol. 2006, 126, 248–259. [Google Scholar] [CrossRef]
- Hoenig, M.; Lee, R.J.; Ferguson, D.C. A microtiter plate assay for inorganic phosphate. J. Biochem. Biophys. Methods 1989, 19, 249–251. [Google Scholar] [CrossRef]
- Stephens, L.R.; Hughes, K.T.; Irvine, R.F. Pathway of phosphatidylinositol(3,4,5)-trisphosphate synthesis in activated neutrophils. Nature 1991, 351, 33–39. [Google Scholar] [CrossRef]
- Yu, J.; Berggren, P.-O.; Barker, C.J. An Autocrine Insulin Feedback Loop Maintains Pancreatic β-Cell 3-Phosphorylated Inositol Lipids. Mol. Endocrinol. 2007, 21, 2775–2784. [Google Scholar] [CrossRef]
- Gimm, O.; Chi, H.; Dahia, P.L.M.; Perren, A.; Hinze, R.; Komminoth, P.; Dralle, H.; Reynolds, P.R.; Eng, C. Somatic Mutation and Germline Variants of MINPP1, a Phosphatase Gene Located in Proximity to PTEN on 10q23.3, in Follicular Thyroid Carcinomas1. J. Clin. Endocrinol. Metab. 2001, 86, 1801–1805. [Google Scholar] [CrossRef]
- Kon, H.; Sonoda, Y.; Kumabe, T.; Yoshimoto, T.; Sekiya, T.; Murakami, Y. Structural and functional evidence for the presence of tumor suppressor genes on the short arm of chromosome 10 in human gliomas. Oncogene 1998, 16, 257–263. [Google Scholar] [CrossRef] [PubMed]
- Barker, C.J.; French, P.J.; Moore, A.J.; Nilsson, T.; Berggren, P.O.; Bunce, C.M.; Kirk, C.J.; Michell, R.H. Inositol 1,2,3-trisphosphate and inositol 1,2- and/or 2,3-bisphosphate are normal constituents of mammalian cells. Biochem. J. 1995, 306, 557–564. [Google Scholar] [CrossRef] [PubMed]
- Veiga, N.; Torres, J.; Mansell, D.; Freeman, S.; Domínguez, S.; Barker, C.J.; Díaz, A.; Kremer, C. “Chelatable iron pool”: Inositol 1,2,3-trisphosphate fulfils the conditions required to be a safe cellular iron ligand. JBIC J. Biol. Inorg. Chem. 2009, 14, 51–59. [Google Scholar] [CrossRef] [PubMed]
- Spiers, I.D.; Barker, C.J.; Chung, S.-K.; Chang, Y.-T.; Freeman, S.; Gardiner, J.M.; Hirst, P.H.; Lambert, P.A.; Michell, R.H.; Poyner, D.R.; et al. Synthesis and iron binding studies of myo-inositol 1,2,3-trisphosphate and (±)-myo-inositol 1,2-bisphosphate, and iron binding studies of all myo-inositol tetrakisphosphates. Carbohydr. Res. 1996, 282, 81–99. [Google Scholar] [CrossRef]
- Barker, C.J.; Wright, J.; Hughes, P.J.; Kirk, C.J.; Michell, R.H. Complex changes in cellular inositol phosphate complement accompany transit through the cell cycle. Biochem. J. 2004, 380, 465–473. [Google Scholar] [CrossRef]
- Le, N.T.V.; Richardson, D.R. The role of iron in cell cycle progression and the proliferation of neoplastic cells. Biochim. Biophys. Acta 2002, 1603, 31–46. [Google Scholar] [CrossRef]

Disclaimer/Publisher’s Note: The statements, opinions and data contained in all publications are solely those of the individual author(s) and contributor(s) and not of MDPI and/or the editor(s). MDPI and/or the editor(s) disclaim responsibility for any injury to people or property resulting from any ideas, methods, instructions or products referred to in the content. |
© 2023 by the authors. Licensee MDPI, Basel, Switzerland. This article is an open access article distributed under the terms and conditions of the Creative Commons Attribution (CC BY) license (https://creativecommons.org/licenses/by/4.0/).
Share and Cite
Yu, J.; Leibiger, B.; Yang, S.-N.; Shears, S.B.; Leibiger, I.B.; Berggren, P.-O.; Barker, C.J. Multiple Inositol Polyphosphate Phosphatase Compartmentalization Separates Inositol Phosphate Metabolism from Inositol Lipid Signaling. Biomolecules 2023, 13, 885. https://doi.org/10.3390/biom13060885
Yu J, Leibiger B, Yang S-N, Shears SB, Leibiger IB, Berggren P-O, Barker CJ. Multiple Inositol Polyphosphate Phosphatase Compartmentalization Separates Inositol Phosphate Metabolism from Inositol Lipid Signaling. Biomolecules. 2023; 13(6):885. https://doi.org/10.3390/biom13060885
Chicago/Turabian StyleYu, Jia, Barbara Leibiger, Shao-Nian Yang, Stephen B. Shears, Ingo B. Leibiger, Per-Olof Berggren, and Christopher J. Barker. 2023. "Multiple Inositol Polyphosphate Phosphatase Compartmentalization Separates Inositol Phosphate Metabolism from Inositol Lipid Signaling" Biomolecules 13, no. 6: 885. https://doi.org/10.3390/biom13060885
APA StyleYu, J., Leibiger, B., Yang, S.-N., Shears, S. B., Leibiger, I. B., Berggren, P.-O., & Barker, C. J. (2023). Multiple Inositol Polyphosphate Phosphatase Compartmentalization Separates Inositol Phosphate Metabolism from Inositol Lipid Signaling. Biomolecules, 13(6), 885. https://doi.org/10.3390/biom13060885