


Biological Effects of HDAC Inhibitors Vary with Zinc Binding Group: Differential Effects on Zinc Bioavailability, ROS Production, and R175H p53 Mutant Protein Reactivation
 and
and
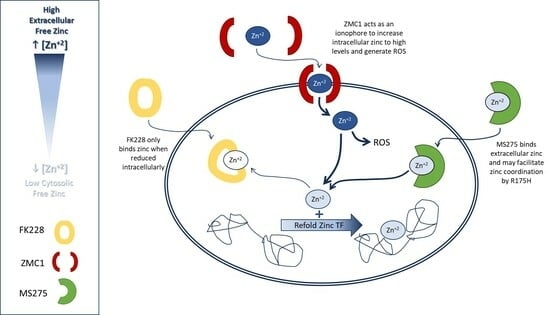
Abstract
1. Introduction
2. Materials and Methods
2.1. Cell Lines, Extracts, Treatments, and Culture Conditions
2.2. p53 Response Element Binding Assays
2.3. Intracellular Zinc Assay
2.4. ROS Detection
2.5. NanoLuc Luciferase Assay
2.6. Immunofluorescence Staining
2.7. p53 Immunoaffinity Purification
2.8. Immunoblotting
2.9. ELISA
2.10. Statistical Analysis
3. Results
3.1. HDACi with Dissimilar ZBGs Differentially Impact R175H Bind to RE In Vitro
3.2. MS275 Benzamide ZBG Increased Intracellular Free Zinc and ROS Production
3.3. Treatment with the HDACi MS275 Refolds and Reactivates R175H p53
3.4. Activating Post-translational Modifications (PTMs) on R175H with HDACi Treatment
4. Discussion
5. Conclusions
Supplementary Materials
Author Contributions
Funding
Institutional Review Board Statement
Informed Consent Statement
Data Availability Statement
Conflicts of Interest
References
- Liang, T.; Wang, F.; Elhassan, R.M.; Cheng, Y.; Tang, X.; Chen, W.; Fang, H.; Hou, X. Targeting histone deacetylases for cancer therapy: Trends and challenges. Acta Pharm. Sin. B 2023, 13, 2425–2463. [Google Scholar] [CrossRef] [PubMed]
- Mrakovcic, M.; Kleinheinz, J.; Fröhlich, L.F. p53 at the Crossroads between Different Types of HDAC Inhibitor-Mediated Cancer Cell Death. Int. J. Mol. Sci. 2019, 20, 2415. [Google Scholar] [CrossRef] [PubMed]
- Gu, W.; Roeder, R.G. Activation of p53 Sequence-Specific DNA Binding by Acetylation of the p53 C-Terminal Domain. Cell 1997, 90, 595–606. [Google Scholar] [CrossRef] [PubMed]
- Luo, J.; Li, M.; Tang, Y.; Laszkowska, M.; Roeder, R.G.; Gu, W. Acetylation of p53 augments its site-specific DNA binding both in vitro and in vivo. Proc. Natl. Acad. Sci. USA 2004, 101, 2259–2264. [Google Scholar] [CrossRef]
- Xu, Y. Regulation of p53 responses by post-translational modifications. Cell Death Differ. 2003, 10, 400–403. [Google Scholar] [CrossRef]
- Ito, A.; Kawaguchi, Y.; Lai, C.H.; Kovacs, J.J.; Higashimoto, Y.; Appella, E.; Yao, T.P. MDM2–HDAC1-mediated deacetylation of p53 is required for its degradation. EMBO J. 2002, 21, 6236–6245. [Google Scholar] [CrossRef]
- Lee, J.-H.; Bollschweiler, D.; Schäfer, T.; Huber, R. Structural basis for the regulation of nucleosome recognition and HDAC activity by histone deacetylase assemblies. Sci. Adv. 2021, 7, eabd4413. [Google Scholar] [CrossRef]
- Dornan, D.; Shimizu, H.; Burch, L.; Smith, A.J.; Hupp, T.R. The proline repeat domain of p53 binds directly to the transcriptional coactivator p300 and allosterically controls DNA-dependent acetylation of p53. Mol. Cell Biol. 2003, 23, 8846–8861. [Google Scholar] [CrossRef]
- Zhang, L.; Zhang, J.; Jiang, Q.; Zhang, L.; Song, W. Zinc binding groups for histone deacetylase inhibitors. J. Enzyme Inhib. Med. Chem. 2018, 33, 714–721. [Google Scholar] [CrossRef]
- Krężel, A.; Maret, W. Zinc-buffering capacity of a eukaryotic cell at physiological pZn. JBIC J. Biol. Inorg. Chem. 2006, 11, 1049–1062. [Google Scholar] [CrossRef]
- Maret, W. Analyzing free zinc(II) ion concentrations in cell biology with fluorescent chelating molecules. Met. Integr. Biometal Sci. 2015, 7, 202–211. [Google Scholar] [CrossRef] [PubMed]
- Maret, W. The redox biology of redox-inert zinc ions. Free Radic. Biol. Med. 2019, 134, 311–326. [Google Scholar] [CrossRef]
- Maret, W. Zinc in Cellular Regulation: The Nature and Significance of “Zinc Signals”. Int. J. Mol. Sci. 2017, 18, 2285. [Google Scholar] [CrossRef] [PubMed]
- Hull, E.E.; Montgomery, M.R.; Leyva, K.J. HDAC Inhibitors as Epigenetic Regulators of the Immune System: Impacts on Cancer Therapy and Inflammatory Diseases. BioMed Res. Int. 2016, 2016, 8797206. [Google Scholar] [CrossRef] [PubMed]
- Kogan, S.; Carpizo, D.R. Zinc Metallochaperones as Mutant p53 Reactivators: A New Paradigm in Cancer Therapeutics. Cancers 2018, 10, 166. [Google Scholar] [CrossRef] [PubMed]
- Colvin, R.A.; Holmes, W.R.; Fontaine, C.P.; Maret, W. Cytosolic zinc buffering and muffling: Their role in intracellular zinc homeostasis. Met. Integr. Biometal Sci. 2010, 2, 306–317. [Google Scholar] [CrossRef]
- Yu, X.; Blanden, A.; Tsang, A.T.; Zaman, S.; Liu, Y.; Gilleran, J.; Bencivenga, A.F.; Kimball, S.D.; Loh, S.N.; Carpizo, D.R. Thiosemicarbazones Functioning as Zinc Metallochaperones to Reactivate Mutant p53. Mol. Pharmacol. 2017, 91, 567–575. [Google Scholar] [CrossRef]
- Ha, J.H.; Prela, O.; Carpizo, D.R.; Loh, S.N. p53 and Zinc: A Malleable Relationship. Front. Mol. Biosci. 2022, 9, 895887. [Google Scholar] [CrossRef]
- Zaman, S.; Yu, X.; Bencivenga, A.F.; Blanden, A.R.; Liu, Y.; Withers, T.; Na, B.; Blayney, A.J.; Gilleran, J.; Boothman, D.A.; et al. Combinatorial Therapy of Zinc Metallochaperones with Mutant p53 Reactivation and Diminished Copper Binding. Mol. Cancer Ther. 2019, 18, 1355–1365. [Google Scholar] [CrossRef]
- Na, B.; Yu, X.; Withers, T.; Gilleran, J.; Yao, M.; Foo, T.K.; Chen, C.; Moore, D.; Lin, Y.; Kimball, S.D.; et al. Therapeutic targeting of BRCA1 and TP53 mutant breast cancer through mutant p53 reactivation. NPJ Breast Cancer 2019, 5, 14. [Google Scholar] [CrossRef]
- Klimovich, B.; Meyer, L.; Merle, N.; Neumann, M.; König, A.M.; Ananikidis, N.; Keber, C.U.; Elmshäuser, S.; Timofeev, O.; Stiewe, T. Partial p53 reactivation is sufficient to induce cancer regression. J. Exp. Clin. Cancer Res. 2022, 41, 80. [Google Scholar] [CrossRef] [PubMed]
- Gilleran, J.A.; Yu, X.; Blayney, A.J.; Bencivenga, A.F.; Na, B.; Augeri, D.J.; Blanden, A.R.; Kimball, S.D.; Loh, S.N.; Roberge, J.Y.; et al. Benzothiazolyl and Benzoxazolyl Hydrazones Function as Zinc Metallochaperones to Reactivate Mutant p53. J. Med. Chem. 2021, 64, 2024–2045. [Google Scholar] [CrossRef]
- Blanden, A.R.; Yu, X.; Blayney, A.J.; Demas, C.; Ha, J.-H.; Liu, Y.; Withers, T.; Carpizo, D.R.; Loh, S.N. Zinc shapes the folding landscape of p53 and establishes a pathway for reactivating structurally diverse cancer mutants. eLife 2020, 9, e61487. [Google Scholar] [CrossRef] [PubMed]
- Wang, T.Y.; Jia, Y.L.; Zhang, X.; Sun, Q.L.; Li, Y.C.; Zhang, J.H.; Zhao, C.P.; Wang, X.Y.; Wang, L. Treating Colon Cancer Cells with FK228 Reveals a Link between Histone Lysine Acetylation and Extensive Changes in the Cellular Proteome. Sci. Rep. 2015, 5, 18443. [Google Scholar] [CrossRef] [PubMed]
- Blanden, A.R.; Yu, X.; Wolfe, A.J.; Gilleran, J.A.; Augeri, D.J.; O’Dell, R.S.; Olson, E.C.; Kimball, S.D.; Emge, T.J.; Movileanu, L.; et al. Synthetic metallochaperone ZMC1 rescues mutant p53 conformation by transporting zinc into cells as an ionophore. Mol. Pharmacol. 2015, 87, 825–831. [Google Scholar] [CrossRef]
- Rosato, R.R.; Almenara, J.A.; Grant, S. The histone deacetylase inhibitor MS-275 promotes differentiation or apoptosis in human leukemia cells through a process regulated by generation of reactive oxygen species and induction of p21CIP1/WAF1 1. Cancer Res. 2003, 63, 3637–3645. [Google Scholar]
- Davis, M.R.; Daggett, J.J.; Pascual, A.S.; Lam, J.M.; Leyva, K.J.; Cooper, K.E.; Hull, E.E. Epigenetically maintained SW13+ and SW13- subtypes have different oncogenic potential and convert with HDAC1 inhibition. BMC Cancer 2016, 16, 316. [Google Scholar] [CrossRef]
- Abmayr, S.M.; Yao, T.; Parmely, T.; Workman, J.L. Preparation of Nuclear and Cytoplasmic Extracts from Mammalian Cells. Curr. Protoc. Mol. Biol. 2006, 75, 12.1.1–12.1.10. [Google Scholar] [CrossRef]
- Italiano, D.; Lena, A.M.; Melino, G.; Candi, E. Identification of NCF2/p67phox as a novel p53 target gene. Cell Cycle 2012, 11, 4589–4596. [Google Scholar] [CrossRef]
- Scian, M.J.; Stagliano, K.E.R.; Ellis, M.A.; Hassan, S.; Bowman, M.; Miles, M.F.; Deb, S.P.; Deb, S. Modulation of Gene Expression by Tumor-Derived p53 Mutants. Cancer Res. 2004, 64, 7447–7454. [Google Scholar] [CrossRef]
- Thompson, L.R.; Oliveira, T.G.; Hermann, E.R.; Chowanadisai, W.; Clarke, S.L.; Montgomery, M.R. Distinct TP53 Mutation Types Exhibit Increased Sensitivity to Ferroptosis Independently of Changes in Iron Regulatory Protein Activity. Int. J. Mol. Sci. 2020, 21, 6751. [Google Scholar] [CrossRef] [PubMed]
- Wang, P.L.; Sait, F.; Winter, G. The ‘wildtype’ conformation of p53: Epitope mapping using hybrid proteins. Oncogene 2001, 20, 2318–2324. [Google Scholar] [CrossRef] [PubMed]
- Bartek, J.; Iggo, R.; Gannon, J.; Lane, D.P. Genetic and immunochemical analysis of mutant p53 in human breast cancer cell lines. Oncogene 1990, 5, 893–899. [Google Scholar] [PubMed]
- Xirodimas, D.P.; Lane, D.P. Molecular Evolution of the Thermosensitive PAb1620 Epitope of Human p53 by DNA Shuffling. J. Biol. Chem. 1999, 274, 28042–28049. [Google Scholar] [CrossRef][Green Version]
- Sabapathy, K.; Lane, D.P. Understanding p53 functions through p53 antibodies. J. Mol. Cell Biol. 2019, 11, 317–329. [Google Scholar] [CrossRef]
- Dehart, C.J.; Chahal, J.S.; Flint, S.J.; Perlman, D. Extensive Post-translational Modification of Active and Inactivated Forms of Endogenous p53. Mol. Cell. Proteom. 2013, 13, 1–17. [Google Scholar] [CrossRef]
- Liu, Y.; Tavana, O.; Gu, W. p53 modifications: Exquisite decorations of the powerful guardian. J. Mol. Cell Biol. 2019, 11, 564–577. [Google Scholar] [CrossRef]
- Shieh, S.Y.; Ahn, J.; Tamai, K.; Taya, Y.; Prives, C. The human homologs of checkpoint kinases Chk1 and Cds1 (Chk2) phosphorylate p53 at multiple DNA damage-inducible sites. Genes. Dev. 2000, 14, 289–300. [Google Scholar] [CrossRef]
- Loughery, J.; Cox, M.; Smith, L.M.; Meek, D.W. Critical role for p53-serine 15 phosphorylation in stimulating transactivation at p53-responsive promoters. Nucleic Acids Res. 2014, 42, 7666–7680. [Google Scholar] [CrossRef]
- Brooks, C.L.; Gu, W. The impact of acetylation and deacetylation on the p53 pathway. Protein Cell 2011, 2, 456–462. [Google Scholar] [CrossRef]
- Zhao, Y.; Lu, S.; Wu, L.; Chai, G.; Wang, H.; Chen, Y.; Sun, J.; Yu, Y.; Zhou, W.; Zheng, Q.; et al. Acetylation of p53 at Lysine 373/382 by the Histone Deacetylase Inhibitor Depsipeptide Induces Expression of p21Waf1/Cip1. Mol. Cell. Biol. 2006, 26, 2782–2790. [Google Scholar] [CrossRef] [PubMed]
- Bourdon, J.C.; Fernandes, K.; Murray-Zmijewski, F.; Liu, G.; Diot, A.; Xirodimas, D.P.; Saville, M.K.; Lane, D.P. p53 isoforms can regulate p53 transcriptional activity. Genes. Dev. 2005, 19, 2122–2137. [Google Scholar] [CrossRef] [PubMed]
- Connolly, R.M.; Rudek, M.A.; Piekarz, R. Entinostat: A promising treatment option for patients with advanced breast cancer. Future Oncol. 2017, 13, 1137–1148. [Google Scholar] [CrossRef] [PubMed]
- Sidiropoulos, D.N.; Rafie, C.I.; Jang, J.K.; Castanon, S.; Baugh, A.G.; Gonzalez, E.; Christmas, B.J.; Narumi, V.H.; Davis-Marcisak, E.F.; Sharma, G.; et al. Entinostat Decreases Immune Suppression to Promote Antitumor Responses in a HER2+ Breast Tumor Microenvironment. Cancer Immunol. Res. 2022, 10, 656–669. [Google Scholar] [CrossRef]
- Shi, Y.; Fu, Y.; Zhang, X.; Zhao, G.; Yao, Y.; Guo, Y.; Ma, G.; Bai, S.; Li, H. Romidepsin (FK228) regulates the expression of the immune checkpoint ligand PD-L1 and suppresses cellular immune functions in colon cancer. Cancer Immunol. Immunother. CII 2021, 70, 61–73. [Google Scholar] [CrossRef]
- Li, Y.; Zhou, W.; Li, L.; Li, J.W.; Li, T.; Huang, C.; Lazaro-Camp, V.J.; Kavlashvili, T.; Zhang, Y.; Reyes, H.; et al. Enhancing progestin therapy via HDAC inhibitors in endometrial cancer. Am. J. Cancer Res. 2022, 12, 5029–5048. [Google Scholar]
- Moskowitz, A.J.; Horwitz, S.M. Targeting histone deacetylases in T-cell lymphoma. Leuk. Lymphoma 2017, 58, 1306–1319. [Google Scholar] [CrossRef]
- Vu, K.; Wu, C.H.; Yang, C.Y.; Zhan, A.; Cavallone, E.; Berry, W.; Heeter, P.; Pincus, L.; Wieduwilt, M.J.; William, B.M.; et al. Romidepsin Plus Liposomal Doxorubicin Is Safe and Effective in Patients with Relapsed or Refractory T-Cell Lymphoma: Results of a Phase I Dose-Escalation Study. Clin. Cancer Res. 2020, 26, 1000–1008. [Google Scholar] [CrossRef]
- Zhang, P.; Zhang, M. Epigenetics in the Pathogenesis and Treatment of Cutaneous T-Cell Lymphoma. Front. Oncol. 2021, 11, 663961. [Google Scholar] [CrossRef]
- Yue, K.; Qin, M.; Huang, C.; James Chou, C.; Jiang, Y.; Li, X. Comparison of three zinc binding groups for HDAC inhibitors—A potency, selectivity and enzymatic kinetics study. Bioorganic Med. Chem. Lett. 2022, 70, 128797. [Google Scholar] [CrossRef]
- Butler, J.S.; Loh, S.N. Kinetic partitioning during folding of the p53 DNA binding domain. J. Mol. Biol. 2005, 350, 906–918. [Google Scholar] [CrossRef] [PubMed]
- Marszałek, I.; Krężel, A.; Goch, W.; Zhukov, I.; Paczkowska, I.; Bal, W. Revised stability constant, spectroscopic properties and binding mode of Zn(II) to FluoZin-3, the most common zinc probe in life sciences. J. Inorg. Biochem. 2016, 161, 107–114. [Google Scholar] [CrossRef] [PubMed]
- Robert, C.; Rassool, F.V. HDAC inhibitors: Roles of DNA damage and repair. Adv. Cancer Res. 2012, 116, 87–129. [Google Scholar] [CrossRef] [PubMed]
- Sultana, F.; Manasa, K.L.; Shaik, S.P.; Bonam, S.R.; Kamal, A. Zinc Dependent Histone Deacetylase Inhibitors in Cancer Therapeutics: Recent Update. Curr. Med. Chem. 2019, 26, 7212–7280. [Google Scholar] [CrossRef] [PubMed]
- Oliveira, T.; Hermann, E.; Lin, D.; Chowanadisai, W.; Hull, E.; Montgomery, M. HDAC inhibition induces EMT and alterations in cellular iron homeostasis to augment ferroptosis sensitivity in SW13 cells. Redox Biol. 2021, 47, 102149. [Google Scholar] [CrossRef]
- Rosato, R.R.; Almenara, J.A.; Maggio, S.C.; Coe, S.; Atadja, P.; Dent, P.; Grant, S. Role of histone deacetylase inhibitor-induced reactive oxygen species and DNA damage in LAQ-824/fludarabine antileukemic interactions. Mol. Cancer Ther. 2008, 7, 3285–3297. [Google Scholar] [CrossRef]
- Chen, F.; Li, X.; Aquadro, E.; Haigh, S.; Zhou, J.; Stepp, D.W.; Weintraub, N.L.; Barman, S.A.; Fulton, D.J.R. Inhibition of histone deacetylase reduces transcription of NADPH oxidases and ROS production and ameliorates pulmonary arterial hypertension. Free Radic. Biol. Med. 2016, 99, 167–178. [Google Scholar] [CrossRef]
- Ariffin, J.K.; das Gupta, K.; Kapetanovic, R.; Iyer, A.; Reid, R.C.; Fairlie, D.P.; Sweet, M.J. Histone Deacetylase Inhibitors Promote Mitochondrial Reactive Oxygen Species Production and Bacterial Clearance by Human Macrophages. Antimicrob. Agents Chemother. 2015, 60, 1521–1529. [Google Scholar] [CrossRef]
- Kluska, K.; Adamczyk, J.; Krężel, A. Metal binding properties, stability and reactivity of zinc fingers. Coord. Chem. Rev. 2018, 367, 18–64. [Google Scholar] [CrossRef]


Disclaimer/Publisher’s Note: The statements, opinions and data contained in all publications are solely those of the individual author(s) and contributor(s) and not of MDPI and/or the editor(s). MDPI and/or the editor(s) disclaim responsibility for any injury to people or property resulting from any ideas, methods, instructions or products referred to in the content. |
© 2023 by the authors. Licensee MDPI, Basel, Switzerland. This article is an open access article distributed under the terms and conditions of the Creative Commons Attribution (CC BY) license (https://creativecommons.org/licenses/by/4.0/).
Share and Cite
Flores, B.M.; Uppalapati, C.K.; Pascual, A.S.; Vong, A.; Baatz, M.A.; Harrison, A.M.; Leyva, K.J.; Hull, E.E. Biological Effects of HDAC Inhibitors Vary with Zinc Binding Group: Differential Effects on Zinc Bioavailability, ROS Production, and R175H p53 Mutant Protein Reactivation. Biomolecules 2023, 13, 1588. https://doi.org/10.3390/biom13111588
Flores BM, Uppalapati CK, Pascual AS, Vong A, Baatz MA, Harrison AM, Leyva KJ, Hull EE. Biological Effects of HDAC Inhibitors Vary with Zinc Binding Group: Differential Effects on Zinc Bioavailability, ROS Production, and R175H p53 Mutant Protein Reactivation. Biomolecules. 2023; 13(11):1588. https://doi.org/10.3390/biom13111588
Chicago/Turabian StyleFlores, Brianna M., Chandana K. Uppalapati, Agnes S. Pascual, Alan Vong, Margaux A. Baatz, Alisha M. Harrison, Kathryn J. Leyva, and Elizabeth E. Hull. 2023. "Biological Effects of HDAC Inhibitors Vary with Zinc Binding Group: Differential Effects on Zinc Bioavailability, ROS Production, and R175H p53 Mutant Protein Reactivation" Biomolecules 13, no. 11: 1588. https://doi.org/10.3390/biom13111588
APA StyleFlores, B. M., Uppalapati, C. K., Pascual, A. S., Vong, A., Baatz, M. A., Harrison, A. M., Leyva, K. J., & Hull, E. E. (2023). Biological Effects of HDAC Inhibitors Vary with Zinc Binding Group: Differential Effects on Zinc Bioavailability, ROS Production, and R175H p53 Mutant Protein Reactivation. Biomolecules, 13(11), 1588. https://doi.org/10.3390/biom13111588