Article

Understanding Calmodulin Variants Affecting Calcium-Dependent Inactivation of L-Type Calcium Channels through Whole-Cell Simulation of the Cardiac Ventricular Myocyte

by
Matthew D. McCoy
1,2,†,
Aman Ullah
1,†,
W. Jonathan Lederer
3 and
M. Saleet Jafri
1,3,*
1
School of Systems Biology, George Mason University, Fairfax, VA 22030, USA
2
Innovation Center for Biomedical Informatics, Department of Oncology, Georgetown University Medical Center, Georgetown University, Washington, DC 20057, USA
3
Center for Biomedical Engineering and Technology, University of Maryland School of Medicine, Baltimore, MD 20201, USA
*
Author to whom correspondence should be addressed.
These authors contributed equally to this work.
Biomolecules 2023, 13(1), 72; https://doi.org/10.3390/biom13010072
Submission received: 9 November 2022 / Revised: 21 December 2022 / Accepted: 23 December 2022 / Published: 29 December 2022
(This article belongs to the Special Issue Molecular Basis of Cardiovascular Diseases)

Abstract

:
Mutations in the calcium-sensing protein calmodulin (CaM) have been linked to two cardiac arrhythmia diseases, Long QT Syndrome 14 (LQT14) and Catecholaminergic Polymorphic Ventricular Tachycardia Type 4 (CPVT4), with varying degrees of severity. Functional characterization of the CaM mutants most strongly associated with LQT14 show a clear disruption of the calcium-dependent inactivation (CDI) of the L-Type calcium channel (LCC). CPVT4 mutants on the other hand are associated with changes in their affinity to the ryanodine receptor. In clinical studies, some variants have been associated with both CPVT4 and LQT15. This study uses simulations in a model for excitation–contraction coupling in the rat ventricular myocytes to understand how LQT14 variant might give the functional phenotype similar to CPVT4. Changing the CaM-dependent transition rate by a factor of 0.75 corresponding to the D96V variant and by a factor of 0.90 corresponding to the F142L or N98S variants, in a physiologically based stochastic model of the LCC prolonger, the action potential duration changed by a small amount in a cardiac myocyte but did not disrupt CICR at 1, 2, and 4 Hz. Under beta-adrenergic simulation abnormal excitation–contraction coupling was observed above 2 Hz pacing for the mutant CaM. The same conditions applied under beta-adrenergic stimulation led to the rapid onset of arrhythmia in the mutant CaM simulations. Simulations with the LQT14 mutations under the conditions of rapid pacing with beta-adrenergic stimulation drives the cardiac myocyte toward an arrhythmic state known as Ca2+ overload. These simulations provide a mechanistic link to a disease state for LQT14-associated mutations in CaM to yield a CPVT4 phenotype. The results show that small changes to the CaM-regulated inactivation of LCC promote arrhythmia and underscore the significance of CDI in proper heart function.

1. Introduction

Calmodulin (CaM) mutants have been associated with cardiac arrhythmia in clinical and experimental studies [1,2,3]. CaM mutants that disrupt the Ca2+-dependent inactivation (CDI) of the L-type Ca2+ channel have been associated in experimental studies with LQT14 [1,3]. CaM variants that have reduced affinity for the ryanodine receptor and increase RyR open probability have been associated experimentally with CPVT4 [1,3]. However, in clinical studies, associating variants with disease is more difficult. The D96V and N98S CaM variants have been associated with both LQT14 and CPVT4 [4,5,6,7,8]. This study uses a computational model for EC coupling in the rat ventricular myocyte to study how reductions in CDI similar to those seen in the N98S and D96V mutations can lead to Ca2+ overload and therefore be confused with the CPVT4 phenotype.
In the cell, networks of individual protein interactions combine to produce emergent cell behavior. Discovering how proteins function in the cell is a true scientific endeavor, where experiments are built to test and expand the understanding of these molecular systems. The iterative undertaking requires building up mechanistic theory through carefully designed and executed experimentation but is limited by the cost of execution and biological complexity. Computational modeling provides a platform to integrate the previous knowledge of these complex systems, where competing theories can be explored and expanded [9,10]. Models which faithfully reproduce emergent behavior are useful in testing the sensitivity of the phenotype to the individual interactions within a system and can be used to direct the course of future experiments. The growing accessibility and power of computational resources enable more complex modeling to be realized, and the pairing with experimental studies will continue to become commonplace.
A powerful application of cellular models is the ability to test a variety of underlying conditions which lead to similar emergent behavior and has been very successful exploring the process of excitation–contraction (EC) coupling in the cardiac myocyte [11,12]. These excitable cells respond to an action potential by initiating a contractile stimulating release of calcium from sarcoplasmic reticulum (SR) [13]. The cellular structure of the cardiac myocyte (Figure 1A) contains specialized calcium release structures known as Calcium Release Units (CRU), where the SR is closely associated with the T-tubule (Figure 1B). When the cell membrane is depolarized, L-type Calcium Channels (LCC) open and allow calcium to enter the small junctional volume. Ryanodine Receptor 2 (RYR2) channels on the surface of the SR membrane open in response to allow the flow of additional calcium from the internal store in a process known as CICR.
Central to EC coupling in the cardiac ventricular myocyte Ca2+ are the elementary events that give rise to the Ca2+ transient consists of many sparks [14]. Under conditions of high intracellular Ca2+ referred to as Ca2+ overload, spontaneous Ca2+ release observed. Under high resolution, spontaneous release can be observed Ca2+ waves which consist of the summation of sparks to create a propagating wave [15,16]. When spontaneous Ca2+ release, which consists of the summation of Ca2+ sparks, occur at several subcellular locations this can result in an arrhythmia membrane depolarization [15,17]. Many studies have shown the link between spontaneous Ca2+ release, propagation of Ca2+ release, and the resulting membrane depolarization on both the spatial and non-spatial scales [15,18]. Non-spatial models are useful for understanding cellular dynamics in ventricular myocytes as has been shown in many published papers [19]. Spatial models while useful in understand Ca2+ dynamics and spontaneous Ca2+ waves are very computationally expensive and have seem limited used to understand EC coupling in simulations involving pacing for many seconds.
Following CICR, the cell is returned to a diastolic state by various ion pumps, restoring cellular ionic concentrations to their initial values. Many proteins play a role in maintaining the cycle, each providing an opportunity to produce an emergent arrhythmia disease phenotype through its altered function. The disease is complex with a large number of different disease variants attributed to mutations in different proteins and is illustrated by the naming conventions for two of these diseases, Long QT Syndrome 14 (LQT14) and catecholaminergic polymorphic ventricular tachycardia Type 4 (CPVT4). Characterized by an elongation of the QT interval on the electrocardiogram, the thirteen LQT14 variants arise out of functional abnormalities in different proteins responsible for restoring the transmembrane voltage after depolarization [20,21,22]. The CPVT4 phenotype is more difficult to diagnose, as fatal arrhythmia is present only under cardiac stress [23]. By integrating the individual contributions of each component in the system, computational models can be used to identify novel conditions which may give rise to disease. This is especially true for the cardiac myocyte, where similar cell behavior can arise despite different origins in electrical handling or calcium release.
The recent association of mutations in the calcium binding protein CaM with LQT14 and CPVT4 blur the line between the disease classifications [24,25]. The sequence variations, shown in Table 1, have been characterized through several independent studies [8,26,27,28,29,30,31,32,33]. Most of the mutations occur near one of the CaM EF-hand Ca2+ binding domains and disrupt Ca2+ binding to varying degrees. Several of the mutants have been associated with varying severity of LQT14 or CPVT4, while others have been reported to show characteristics of both (e.g., N98S). CaM acts to convey calcium signals in the cell and interacts with multiple proteins involved in regulating EC coupling. For some mutants, the impact on LCC Ca2+-dependent inactivation and RYR2 open probability has been reported, but it remains unclear how certain mutations can present as both LQT14 and CPVT4 [31,32]. In addition to the direct interaction with ion channels, differences in gene expression of other system components and subcellular geometry could influence the emergence of an arrhythmic prone state.
Gene variants are classified as being associated with a disease phenotype through clinical studies and GWAS (Genome Wide Association Studies). Genetic analysis can be a powerful tool when used as a marker for hard to diagnose conditions, but harmful mutations can be mischaracterized by failing to consider the systematic impact of small changes to individual molecular interactions. In the case of LQT14, CaM mutations which do not inflict a detectable impact on the action potential may be dismissed as benign. Classified as less severe and associated with harder to diagnose conditions, dismissing their role in Ca2+-dependent inactivation (CDI) eliminates the consideration of therapies targeted at LCC regulation. Using a computational model of EC coupling, the impact of mutant CaM on individual interactions can be examined in detail to make inferences about the mechanisms underlying emergent cell behavior. By demonstrating how even a fractional disruption in a key component of CICR can increase susceptibility to fatal arrhythmia, computational simulations provide a deeper understanding the link between sequence variation and disease. These insights can be used to support mechanistic hypotheses and motivate continued research into complex genetic disease.

2. Materials and Methods

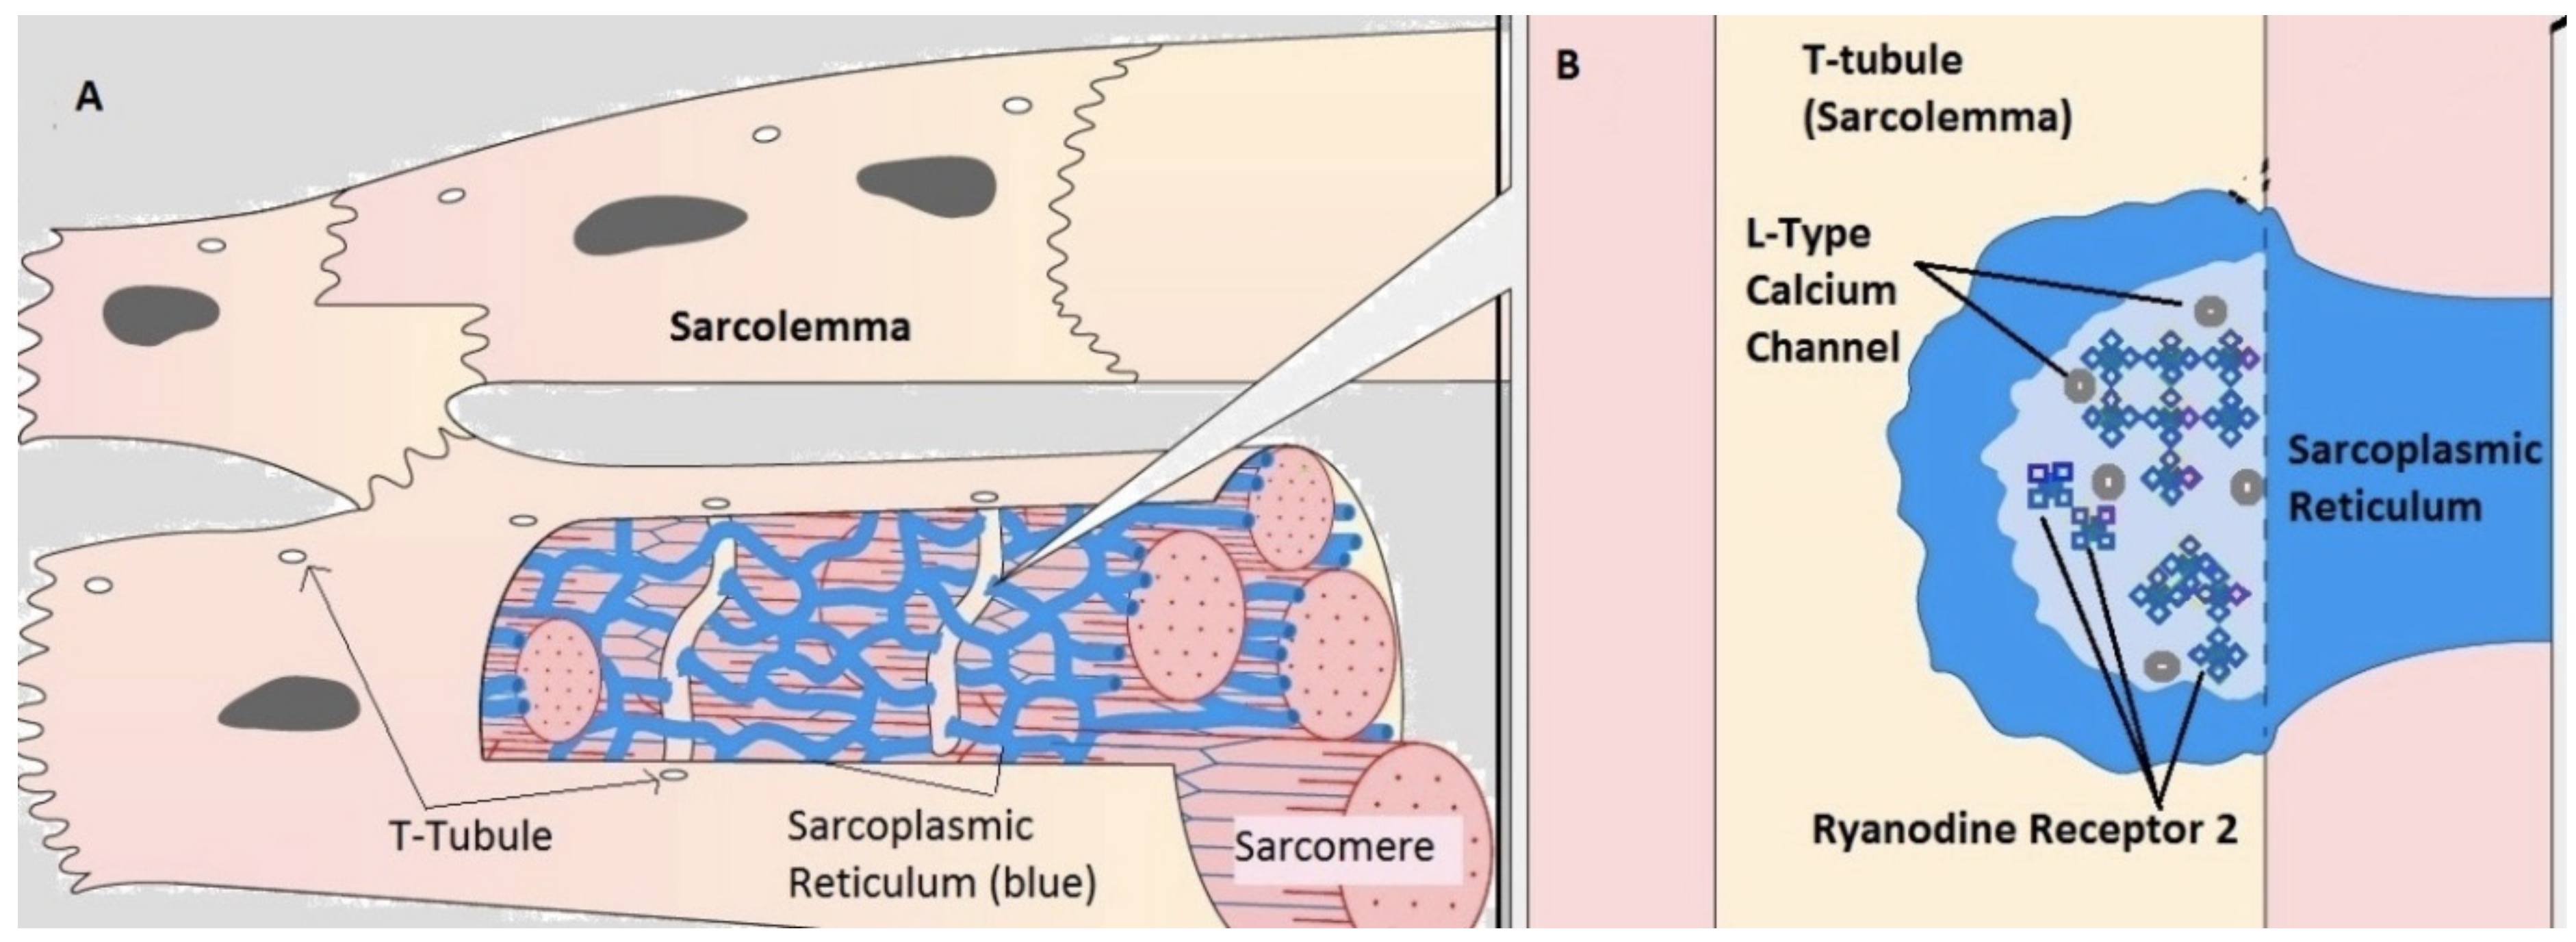
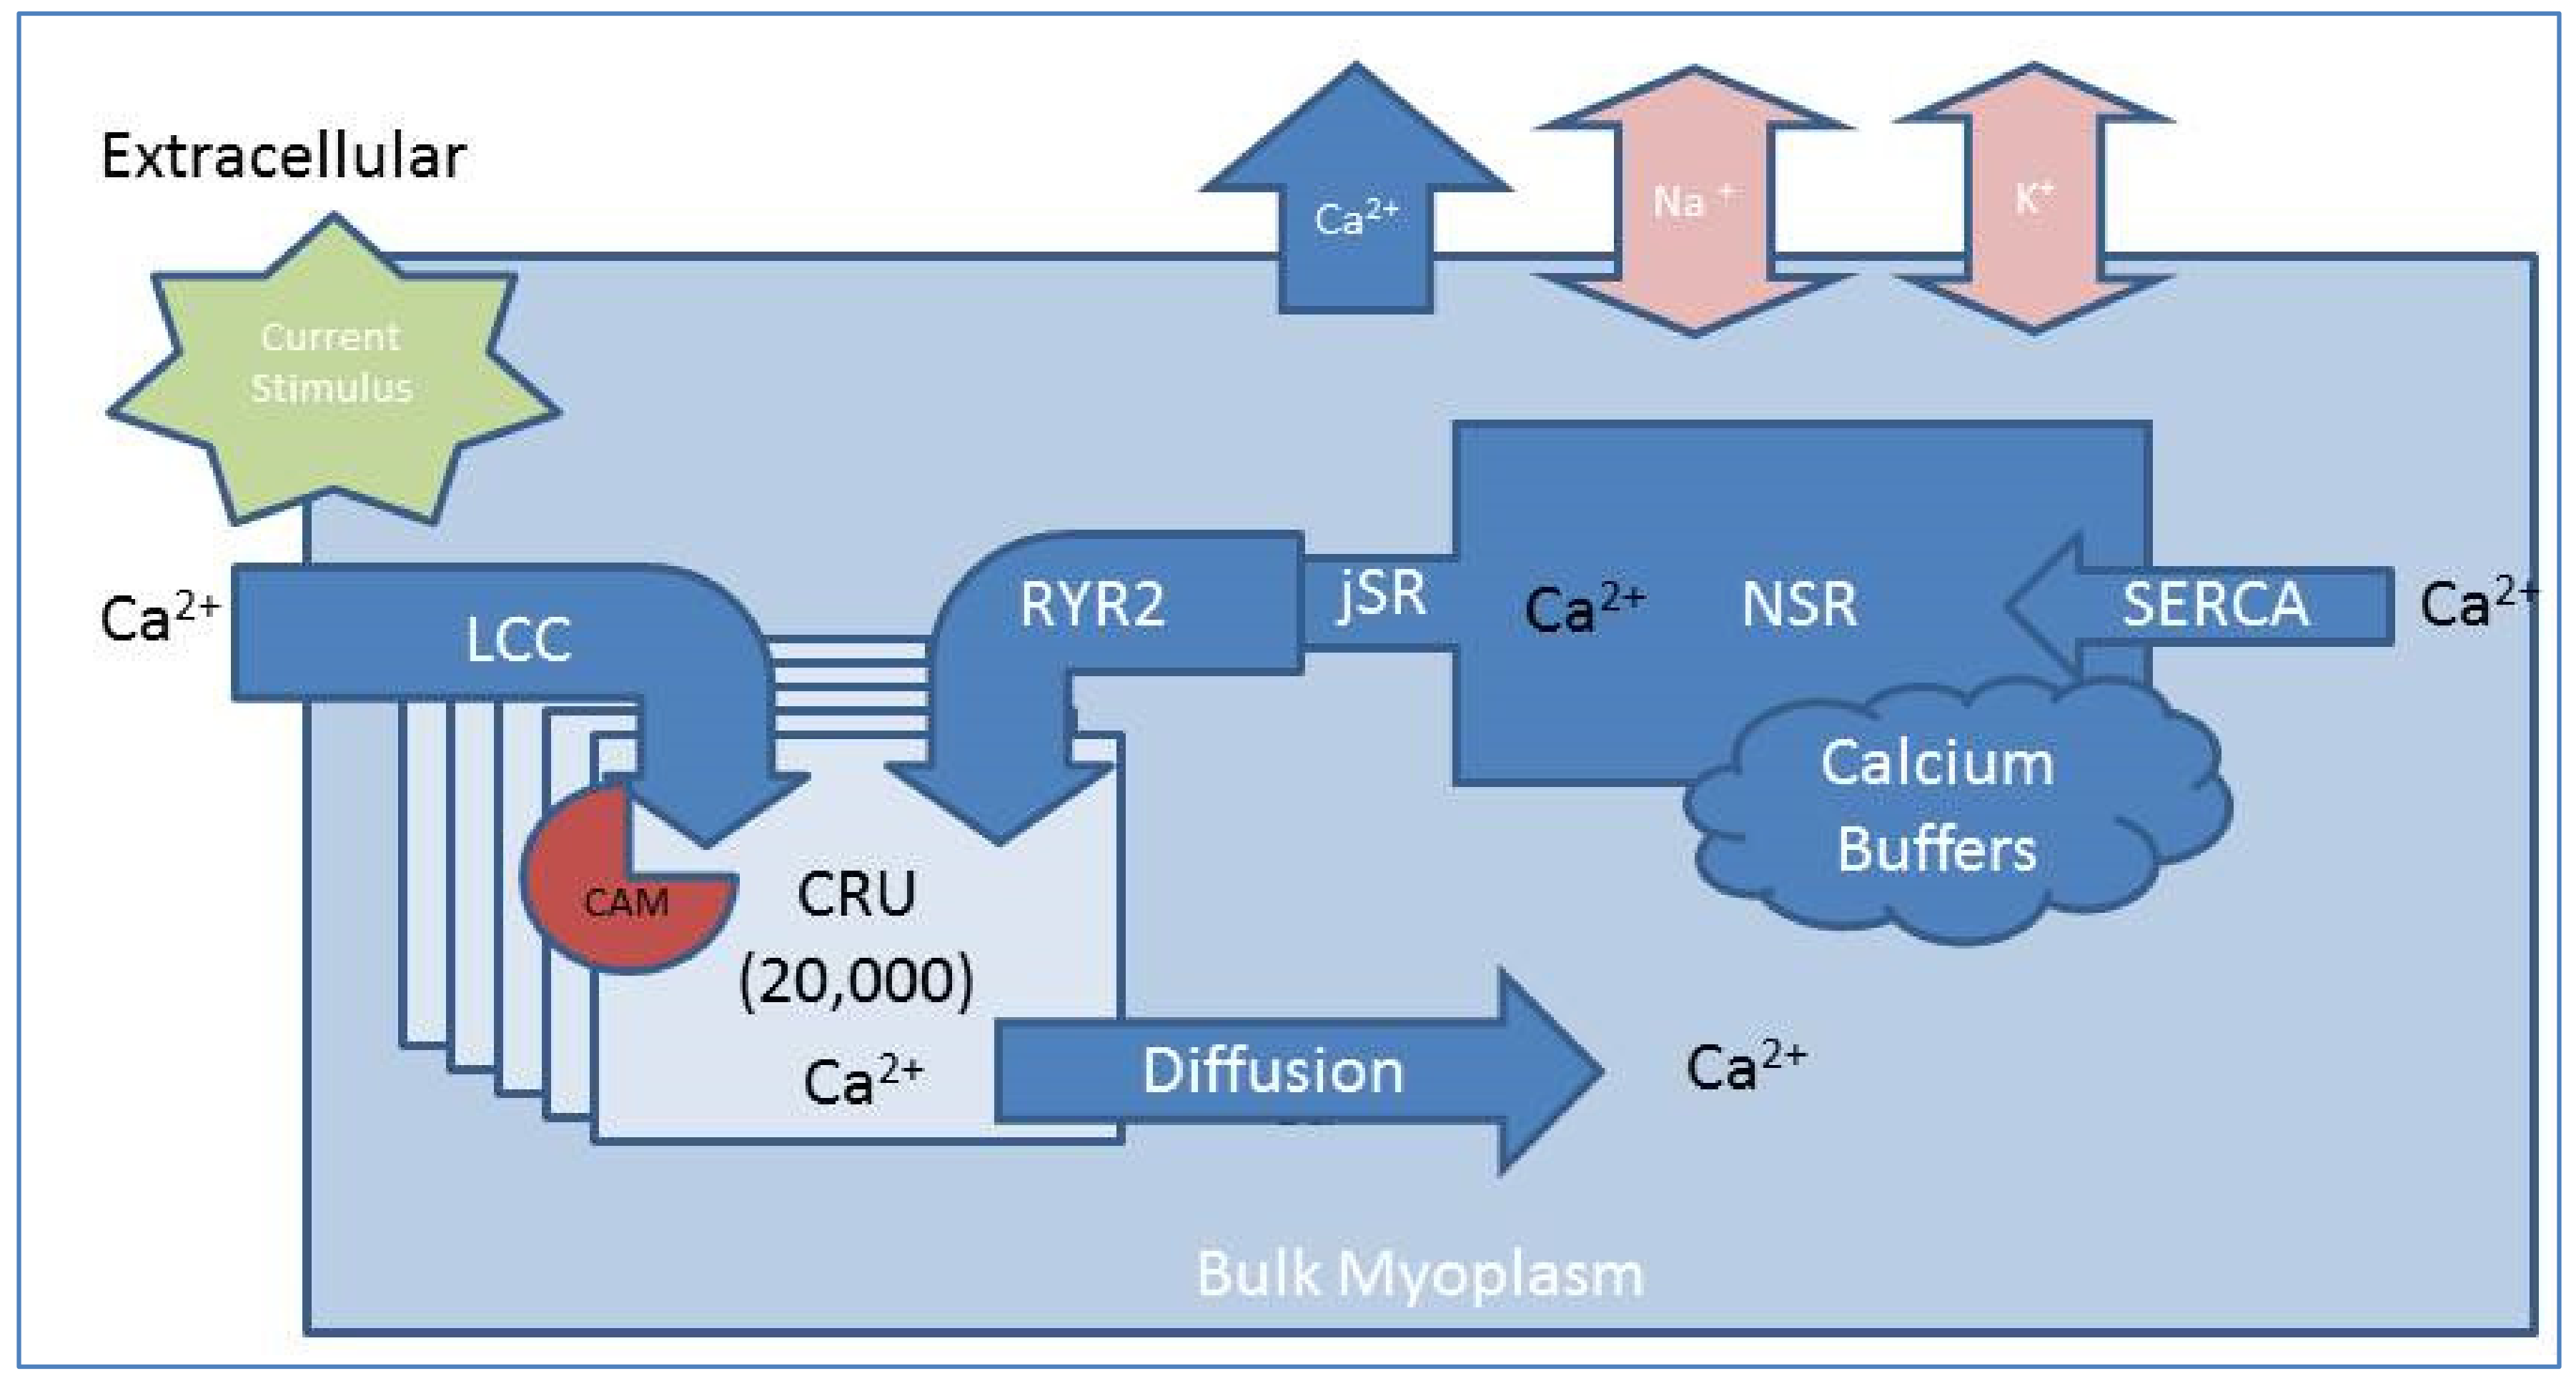
2.1. Compartmental Cellular Model

A physiologically realistic, compartmental model built to understand the intricacies of calcium dynamics in the CRU of was expanded to explore the impact of deficiencies in CaM regulated inactivation of LCC in a computational model of the rat cardiac ventricular myocyte [34]. The model, shown schematically in Figure 2, models the CICR from the SR through the stochastic simulation of 20,000 independent CRUs. In each of the 20,000 CRUs, there are 49 RyR2s and 7 LCC. Experimental studies have shown that there are 30–300 RyR2s in the cardiac dyad. Our previous studies showed that in this range the spark properties do not change much in the range of 50–300 RyR2 channels [35]. Forty-nine channels were chosen because it was easier to derive the mean field coupling between RyRs in this square array [36].
Our model presented in [1] includes all the membrane currents and improves upon our previous work that focused solely on the Ca2+ dynamics [2]. The opening probability of each LCC channel on the T-tubule membrane is dependent on the transmembrane voltage and opens in response to the injection of current via a simulated current clamp protocol. The RYR2 channels open in response to the flow of calcium into the small volume of the dyadic subspace, releasing calcium from the SR to diffuse into the bulk myoplasm. The increase in Ca2+ in the dyad also triggers the CaM-dependent inactivation of the LCC to halt the flow of extracellular calcium into the cell. The bulk of the released calcium is reloaded back into the SR via sarcoplasmic/endoplasmic reticulum Ca2+-ATPase (SERCA) pumps, and ionic homeostasis is achieved as Ca2+, Na+, and K+ pumps in the membrane restore the transmembrane potential. Additional interactions of calcium in both the cell and SR are accounted for by buffers in the myoplasm and SR.

2.1.1. Calcium Release Site (CRU)

A calcium release site is formed by the dyadic subspace and contains a cluster of 49 RyR2 channels and 7 LCCs channels. At each calcium release site, dynamic calcium buffering is implemented for three different endogenous buffers: calmodulin (CaM), sarcolemmal (SL) buffer and sarcoplasmic reticulum (SR) buffer rather than using the rapid buffering approximation or fixed buffering [27,30]. Experiments suggest the existence of non-junctional DHPR (10–20%), located on the external sarcolemma and not forming the release sites with RyR2 [37,38].

2.1.2. Ryanodine Receptor Type-2 Model

The 2-state ryanodine receptor model incorporates cytosolic calcium-dependent and luminal calcium-dependent gating as described previously with only a small modification to the luminal dependence function to match spark characteristics [27]. The states are with the transition rate k r y r + being increased by subspace Ca2+ ( Ca 2 + d s i ) and junctional SR Ca2+( Ca 2 + j s r i ) and k r y r + being a constant. The RyR2s are arranges in a cluster and display coupled gating as using our previous formulation [27].
C k r y r + k r y r O
The opening and closing of individual calcium channels in the CRU are dependent on the local environmental conditions. The RYR2 channels are represented by a 2 state Markov model, where the opening transition rate is dependent on the calcium concentration in both the dyad subspace formed at the interface with the T-tubule and the junctional SR (jSR). The jSR is represented by an additional compartment in the model, which accounts for the limited diffusion of calcium from the non-junctional SR (NSR) found throughout the cell into the substructures at the CRU interface.
CaM has been shown in experiments to associate with RyR2 and modulate its open probability and the IC50 values for CaM binding to RyR2 varies with disease causing CaM variants [32]. However, the RyR2 open probability has been observed to be higher in CPVT4 causing CaM variants but not in LQT14 variants [32]. Furthermore, physiological concentrations of CaM lowered RyR2 open probability in failing human ventricular myocytes where the RyR2 was phosphorylated but not healthy human myocytes [39]. This suggests that the interaction of CaM and RyR2 is more complicated than simple association or Ca2+ binding. For these reasons, in this study of LQT14, the interaction of RyR2 and CaM was not included and left for future studies.

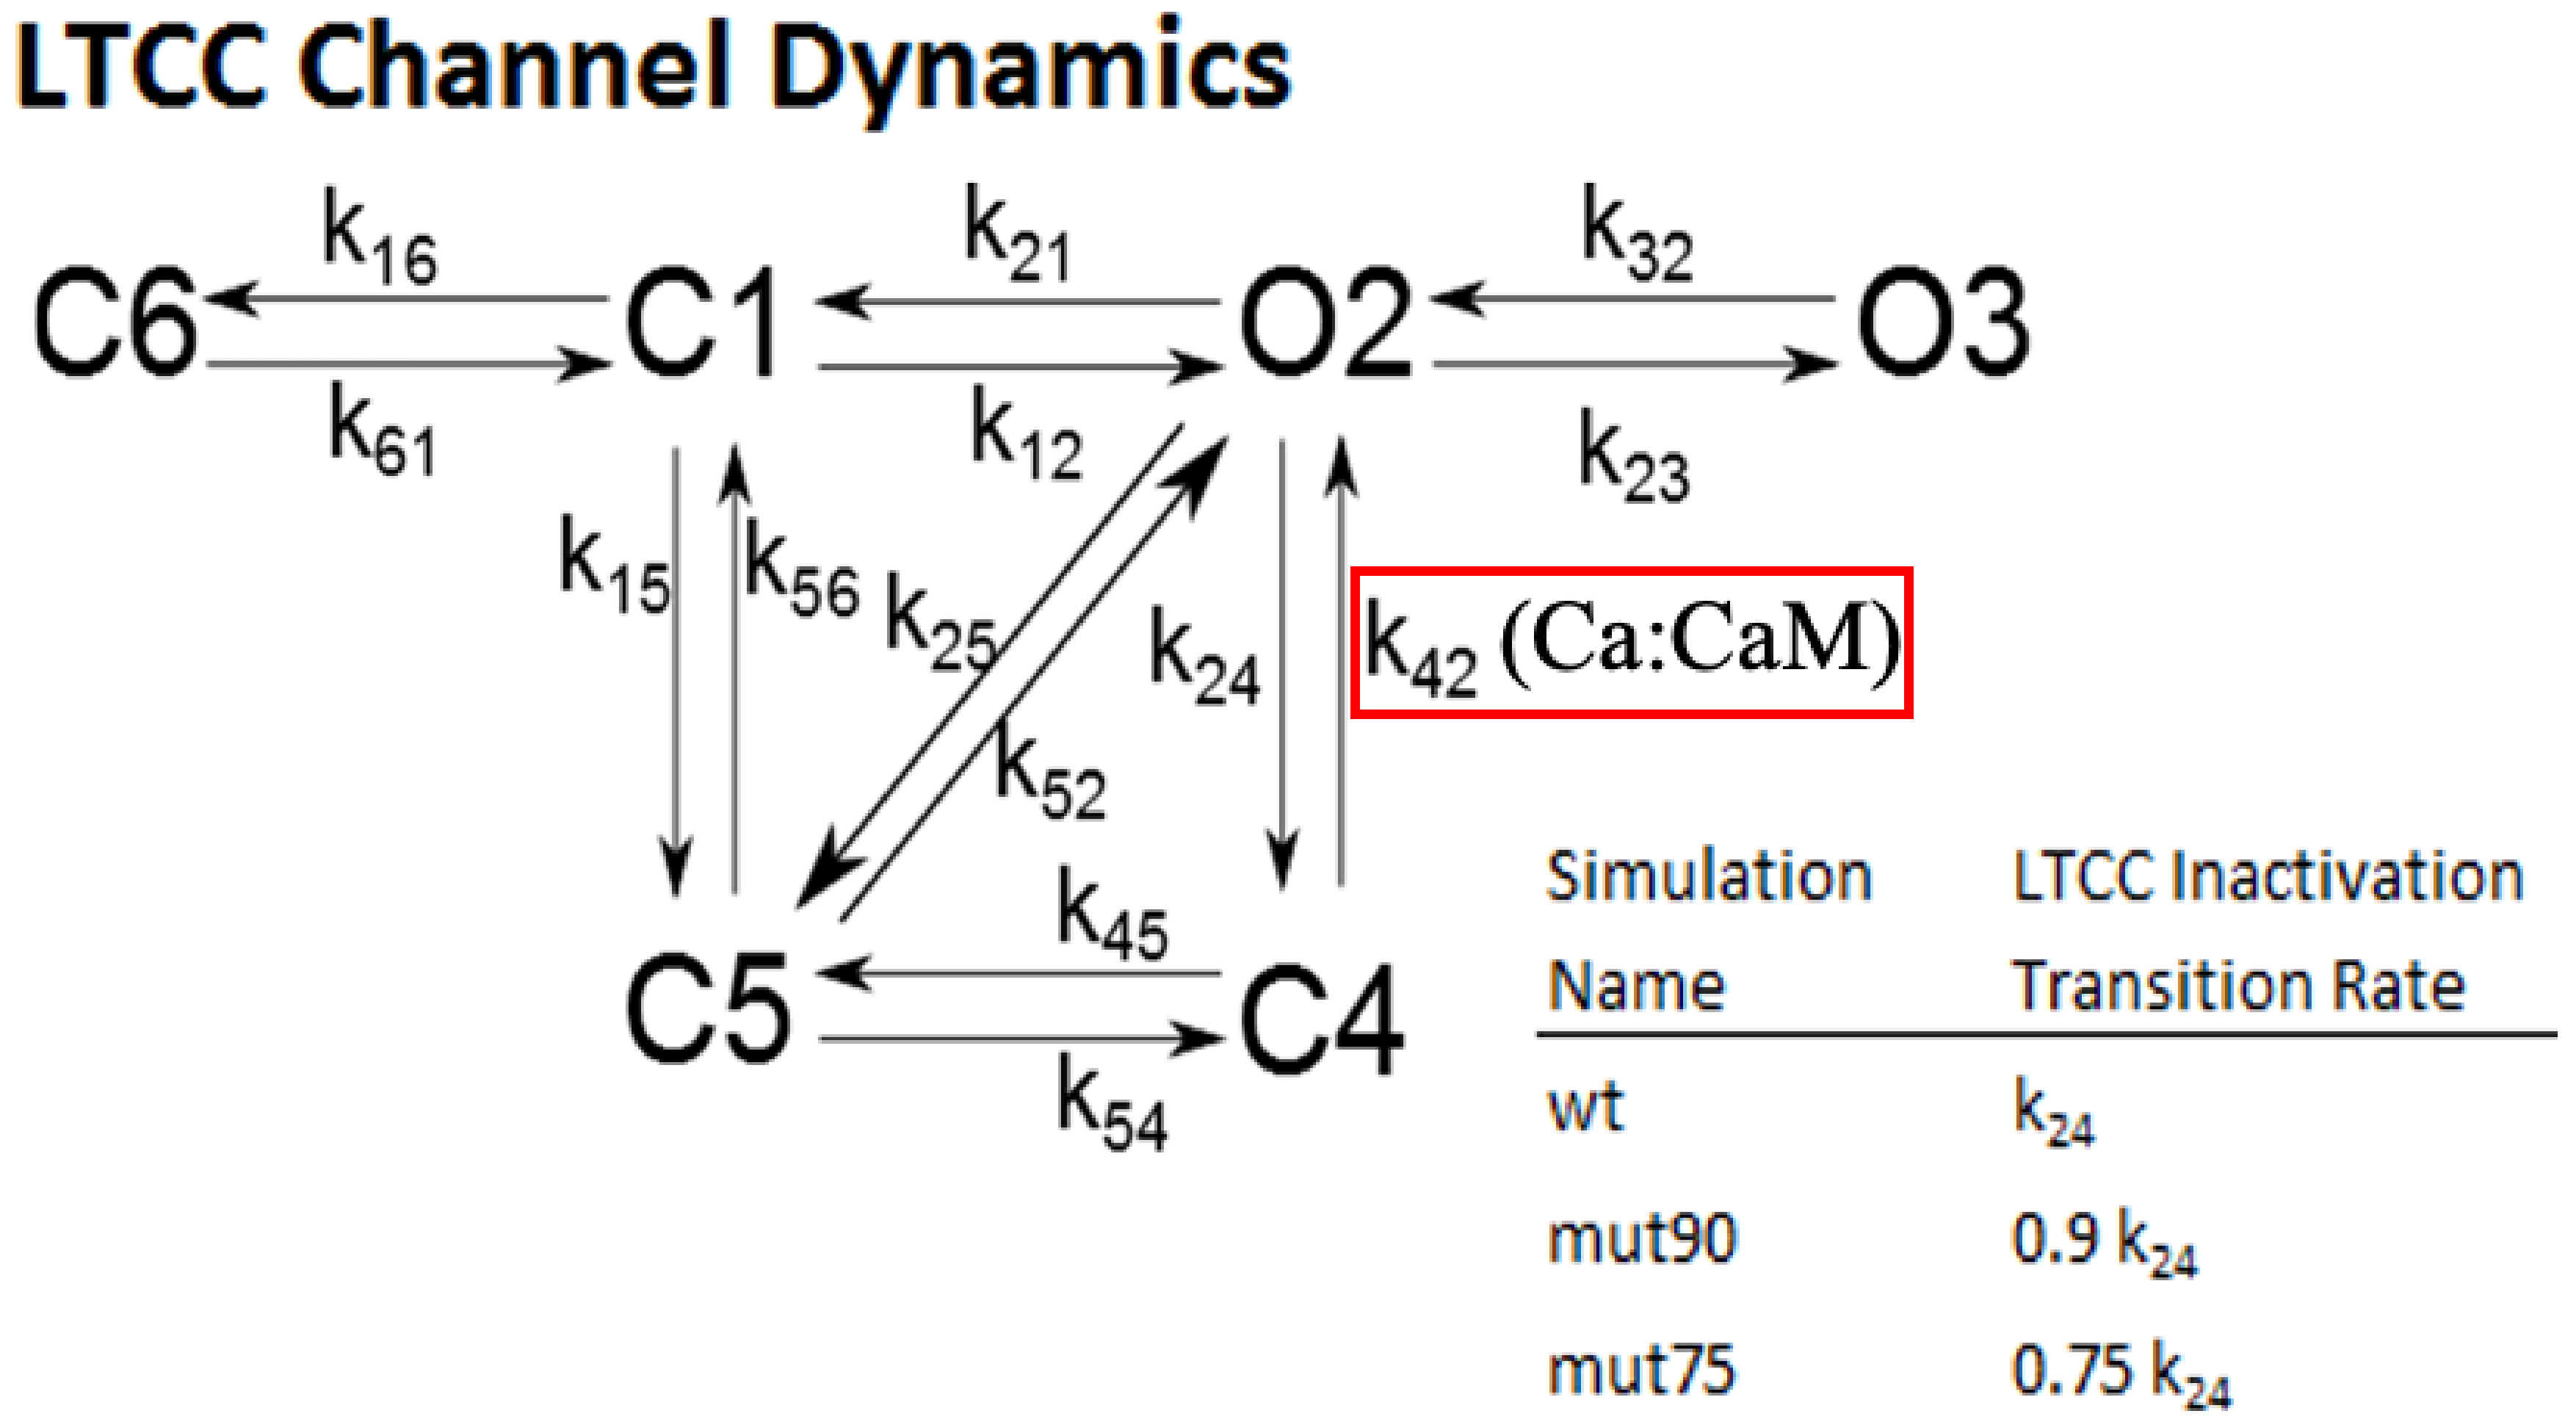
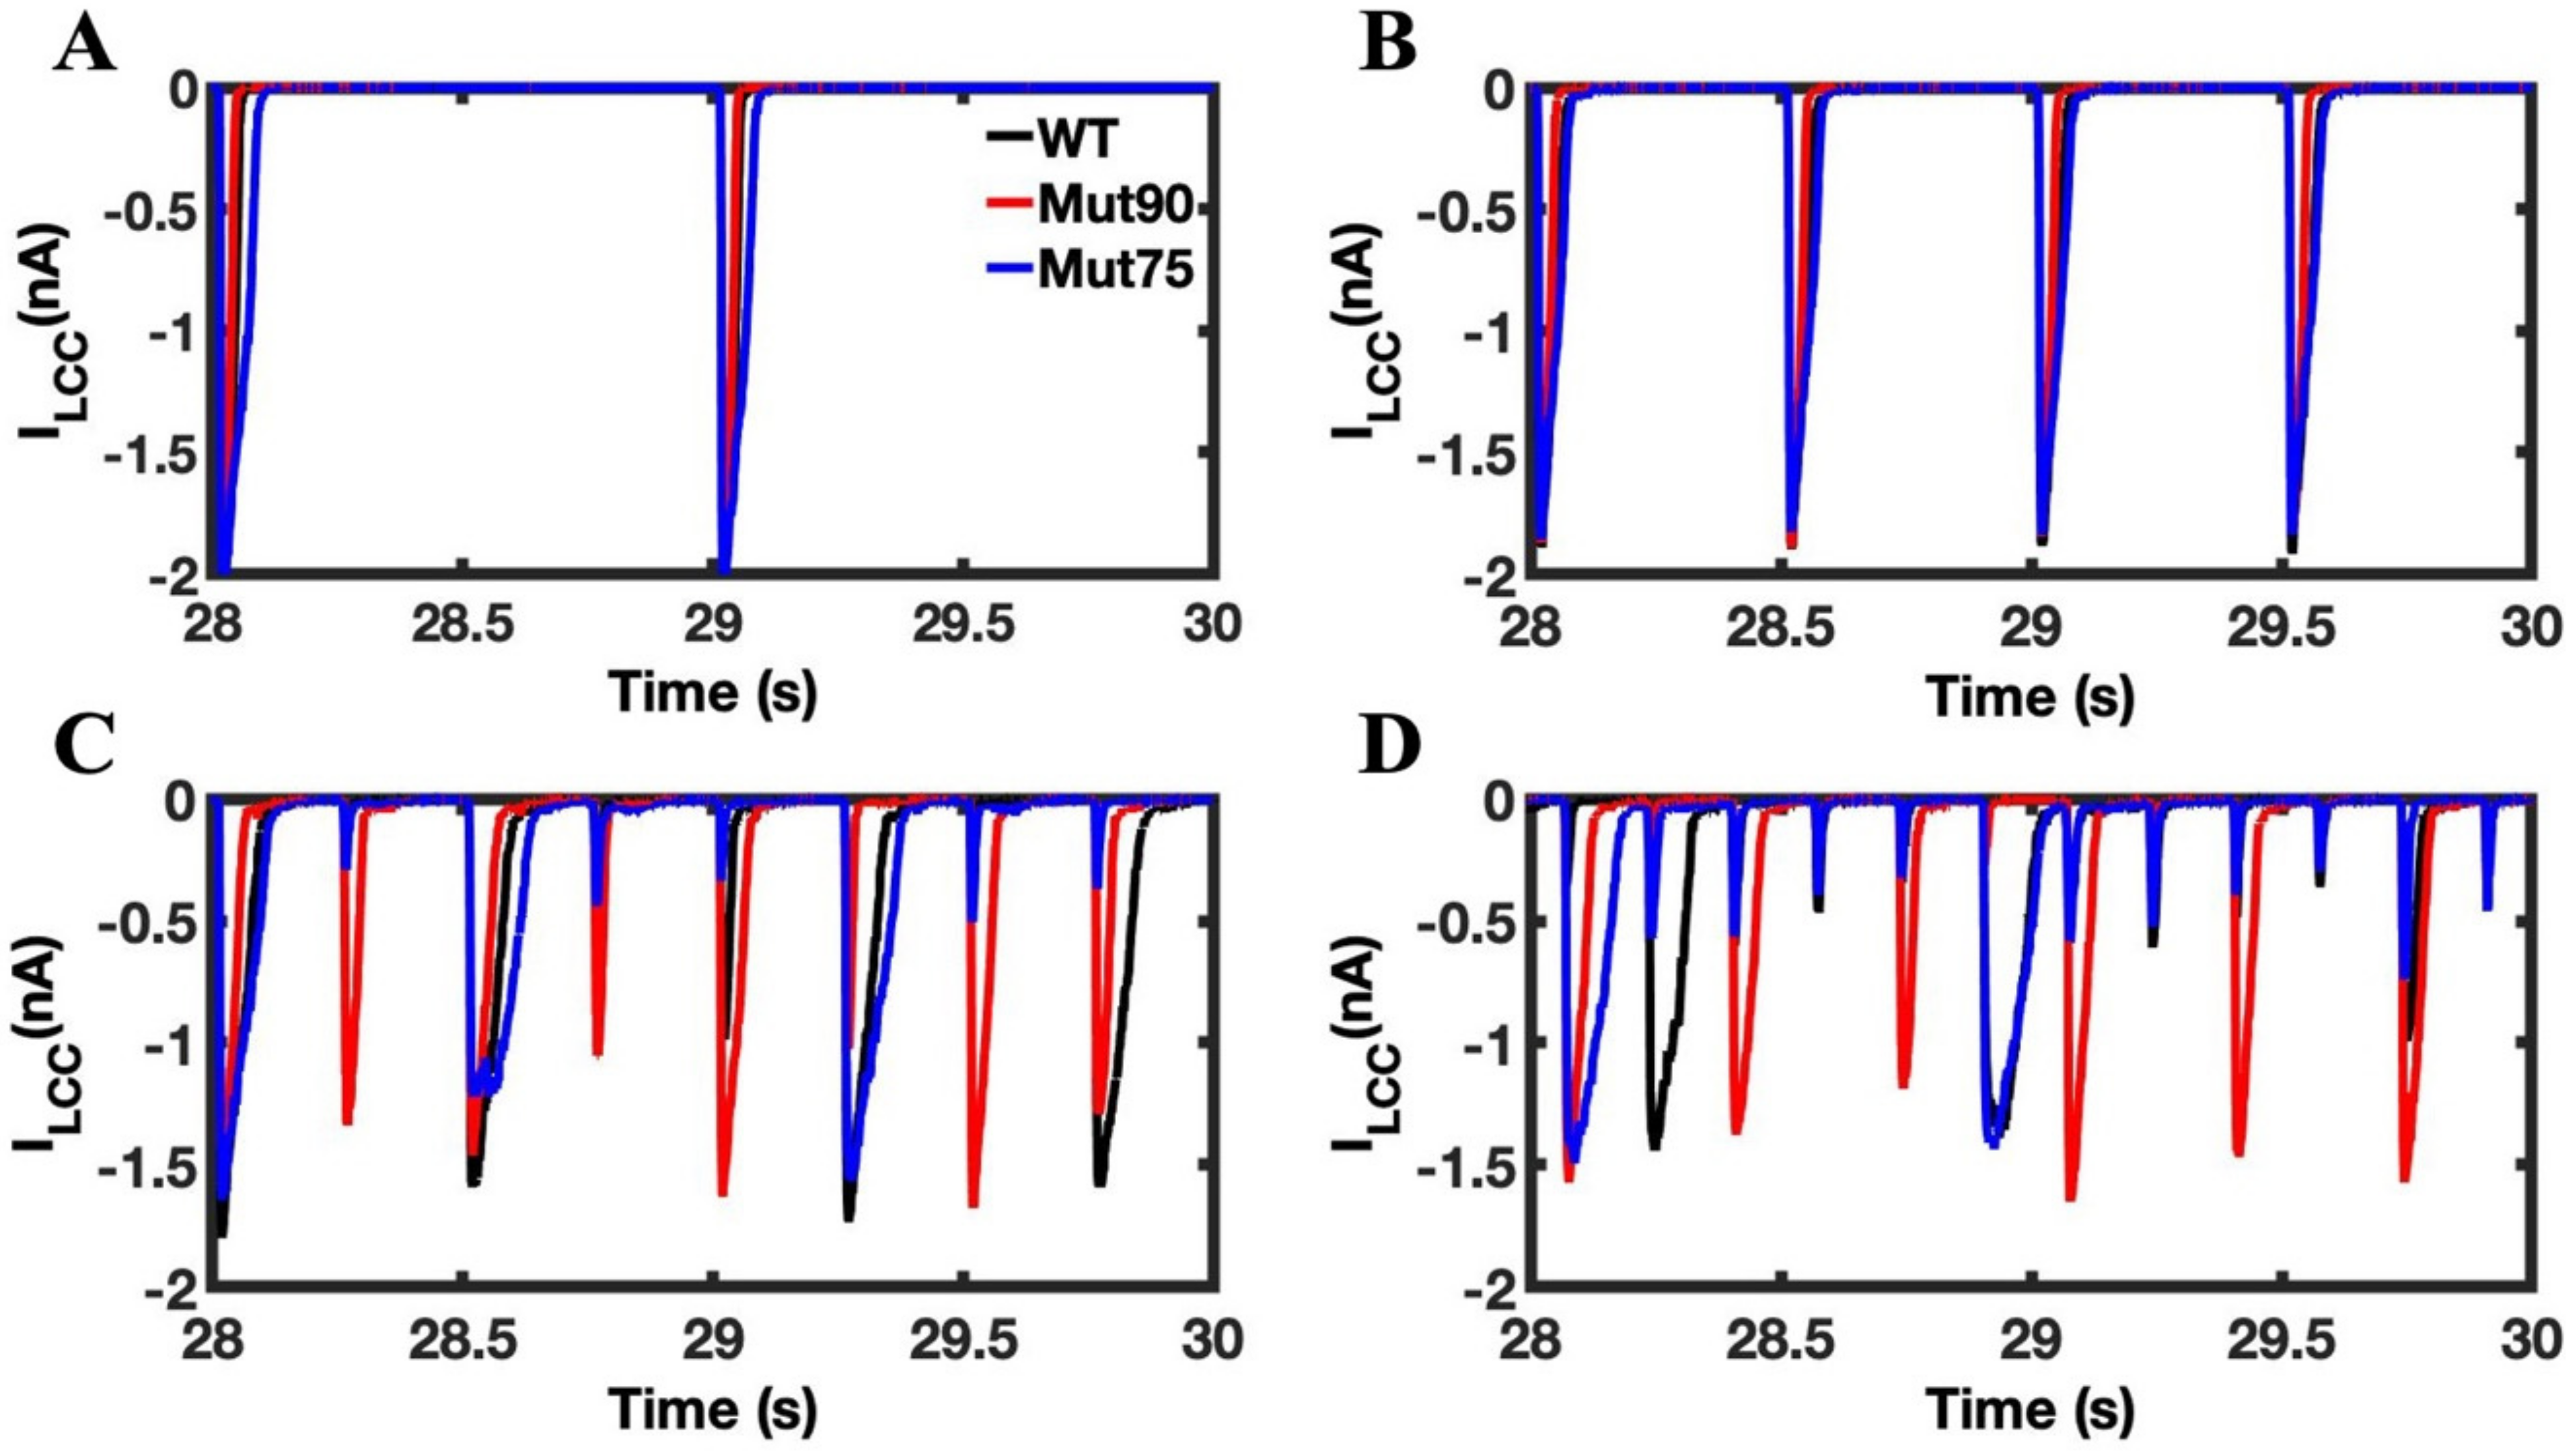
2.1.3. L-Type Calcium Channel Gating

The dynamics of the voltage gated LCC are more complex and are represented by the experimentally constrained six state Markov model shown in Figure 3 that was developed by Sun and co-workers and used in our previous work [34,40,41]. The transition rate between most states is dependent on the transmembrane voltage. At resting potential, channels are overwhelmingly likely to be in the closed state C6 and transition to C1 as the membrane potential increases. The transition to O2 occurs when the membrane polarity is reversed, with stronger depolarizations driving the channel into the O3 state. The thermodynamic transition rate from O2->C1 is very small, so LCC inactivation occurs primarily by 2 routes. The voltage-dependent inactivation (VDI) is represented by the transition O2->C5, and the CaM-dependent inactivation (CDI) by O2->C4. During CICR, the concentration of calcium in the dyad is 100-fold more than in the myoplasm activating CDI.
The endogenous buffer CaM bound to Ca2+ (Ca:CaM) is the effector for Ca2+-dependent inactivation (CDI) of L-type Ca2+ channel. The calcium-free CaM is called apo calmodulin (apo-CaM) with two homologous domains, known as lobes [42]. For each apo-CaM molecule, there are four different calcium binding sites: two at the E-F hand motifs of the N-terminal (N-lobe) and two at the E-F hand motifs of the C-terminal (C-lobe) of CaM (for review see [43]). In L-type Ca2+ channels (Cav1.2), CDI is triggered by the binding of Ca2+ ions to either the C-lobe or N-lobe of CaM with each lobe conferring a fraction of the CDI [44]. The model assumes binding of two Ca2+ ions is needed to produce CDI. This differs from the original Sun model, which used the Hill coefficient as 3 based upon earlier data [40]. In addition, the original model did not incorporate the loss of calcium in the subspace due to binding to calmodulin (CaM). The bind of Ca2+ to CaM is modeled using Mass action kinetics as follows:
d C a : C a M d y a d d t = k C a M + C a d y a d 2 C a M T C a : C a M d i a d   k C a M C a : C a M d y a d
where [CaM]T is the total CaM concentration, k C a M + is the binding on rate and k C a M is the binding off rate with values shown in Table 2. Hence, the contribution of calcium from a small fraction of DHPR Idhpr,nj (15%) was also added. Appendix A Figure A1 shows Ca2+ in the subspaces are rest. Ca2+ sparks and Ca2+ quarks result in increases in the amount of Ca2+:CaM complex in the dyad. The amount of Ca2+:CaM complex in the subspace is greater during pacing at 8 Hz compared to pacing at 1 Hz pacing leading to increased Ca-dependent inactivation of the L-type channel.
The specific mechanisms by which mutations in CaM alter the dynamics of LCC inactivation depend on local changes to the way CaM interacts with the cytoplasmic domains of the channel. While different mutants can alter the mechanism in unique ways, the net impact on the LCC channel dynamics is to decrease the rate of CaM-dependent inactivation. On the scale of the compartmental myocyte model, the LCC interactions with CaM are modeled through the transition rate constant k24. Lowering the transition rate from O2 to C4 by 10% and 25% simulates mutations in CaM which only slightly impact channel function, allowing for the systematic impact on cell function to be studied. The wild type and two mutant CDI models were each simulated for 100 s using a current clamp protocol and determined that a steady train of transients were obtained after 20 s. Simulations were then run 6 times (each with a different seed for the pseudo random number generator) for the wild-type and two mutant CDI models for 30 s, at 1, 2, 4, and 6 Hz stimulation rate. The simulations all converged on a steady train of transients that overlapped. In the figures, data from a single simulation are shown.
To understand how the 10% and 25% reduction in k24 might be compared the experimentally observed changes in the Ca2+ binding affinity of the CaM variants, a steady-state assumption was made about Ca2+ binding to CaM based on the simulations seen in Appendix A Figure A1. When Equation (2) is solved at steady state, the [Ca:CaM] is given by
C a : C a M d y a d = C a d y a d 2 C a M T C a d y a d 2 + K e q   w h e r e   K e q = k C a M /   k C a M + .
When dyadic Ca2+ is assumed to be 10 µM, the ratio of the [Ca:CaM]myo of the variant to the wildtype yields the factor modifying k24 shown in Table 1. It is important to note that the simulations were not performed to quantitatively predict the consequences of a particular variant.
Living rats have heart rates of 330 to 480 beats per minute which translates to 5.5 to 8 Hz (https://web.jhu.edu/animalcare/procedures/rat.html last accessed 19 December 2022). However, in experimental studies included those that explore CPVT4 and LQTS14 isolated myocytes are stimulated at 1, 2, 3, 4, and other pacing rates. The simulations are performed at the rates used in experiments as well as physiological rates. Interestingly, simulations of wildtype rat ventricular myocytes paced at 8 Hz and observed electrical and Ca2+ alternans which are abolished when β-adrenergic stimulation is added [34]. It is possible to simulate human or Guinea pig EC coupling and repeat these simulations. However, these are left for future studies as those models are being developed. However, many of the experimental studies on the effect of CaM variants have been performed in rodents, which is the reason this current study was performed in a model of rat ventricular myocyte EC coupling. Simulations at pacing rates 1 Hz and 2 Hz were performed because these stimulation rates are often used in experiments. Simulations at 4 Hz represent the physiological basal stimulation rate in the living rat. The experiments were repeated in a model of beta-adrenergic stimulation at 6 Hz pacing to reflect the functional remodeling which occurs as a result of increased cardiac stress. In this state, the calcium current through the LCC and SERCA channels is increased by a factor of 1.2 and 1.3, respectively. Beta-adrenergic stimulation was also performed at 1, 2, and 4 Hz to show the enhancement in Ca2+ loading compared to control simulations that is sometimes studies in experiments.
Several important emergent measures of cellular phenotype are simulated by the model and arise from the independent regulation of calcium channels in CICR. The cyclic increase in calcium concentration in the bulk compartments of the myoplasm is determined by the diffusion of calcium from each of the 20,000 dyad subspace volumes. The subsequent loading of calcium from the bulk cellular volume to the NSR occurs through SERCA channels, and the concentration is also reported by the simulation. Additionally, the flow of potassium, sodium, and calcium ions contribute to the transmembrane voltage and impact the magnitude and duration of the action potential. Additionally, the individual flow through each CRU can be used to determine the independent contributions of the LCC and RYR2 dynamics. When summed, they provide a measure of the contribution to the transmembrane calcium current by the LCC and flux through RYR2 channels. Additional contributions to the calcium current come from the bidirectional Na+-Ca2+ exchanger (NCX) channels (Incx), which play an important role in restoring the cell to its resting potential. Together, these variables can be used to investigate the underlying mechanism leading to an arrhythmia prone phenotype.

2.2. Numerical Methods

The system of ordinary differential equations comprising the model is solved using the explicit Euler method. The simulation uses no-flux boundary conditions based upon the assumption that there was not a significant gradient across cells at the border of the simulation. The adaptive timestep (10–100 nanoseconds) is required for numerical stability and is also necessary to capture the fast and stochastic gating of DHPR (dihydropyridine receptor) and RyR2 channels. Each release site uses a different sequence of pseudo-random numbers to control channel gating. These Monte Carlo simulations are computed on Fermi-GPGPU cards, with pseudo-random numbers derived from the Saru pseudo-random number generator on GPGPU provided by Asfar et al. [45]. When the channel fires, a smaller time-step is selected; first to ensure numerical stability, second to limit maximum 10% of the CRUs having state changes to occur at a specified time [46,47]. Channel gating depends upon the local dyadic subspace (Ca2+). The myoplasmic calcium indirectly links all the release sites through modulation of the subspace (Ca2+). Thus, the fraction 10% was selected so that the amount of calcium release does not change much in the bulk myoplasm of the system so that these CRUs are assumed to experience the same bulk myoplasmic calcium. Model code is available in the Supplementary Material (File S1).

2.3. Statistical Analysis

To ensure that the simulations were consistent each simulation was run 6 times with different starting seed values for the pseudo random number generator. Simulations were compared to make sure that the results were similar across simulations. A representative simulation was chosen to display in the figures. The model generates an intractable amount of Ca2+ spark data for the 20,000 Ca2+ release units for analysis. To address this, for the Ca2+ spark analysis, data from the last second of each simulation were retained for 10% of the 20,000 Ca2+ release units (2000 CRUs). The data were processed to calculate spark amplitudes, spark duration, spark frequency, and spark time to peak using a program created in Fortran. For this calculation a spark was considered to start with the dyadic space Ca2+ rose above 25 µM. A spark was assumed to terminate when the dyadic space Ca2+ subsequently fell below 5 µM. Microsoft Excel was used to calculate the means for these properties and the two-sided student’s t-test comparing the means under the assumption of different variances and sample sizes.

3. Results

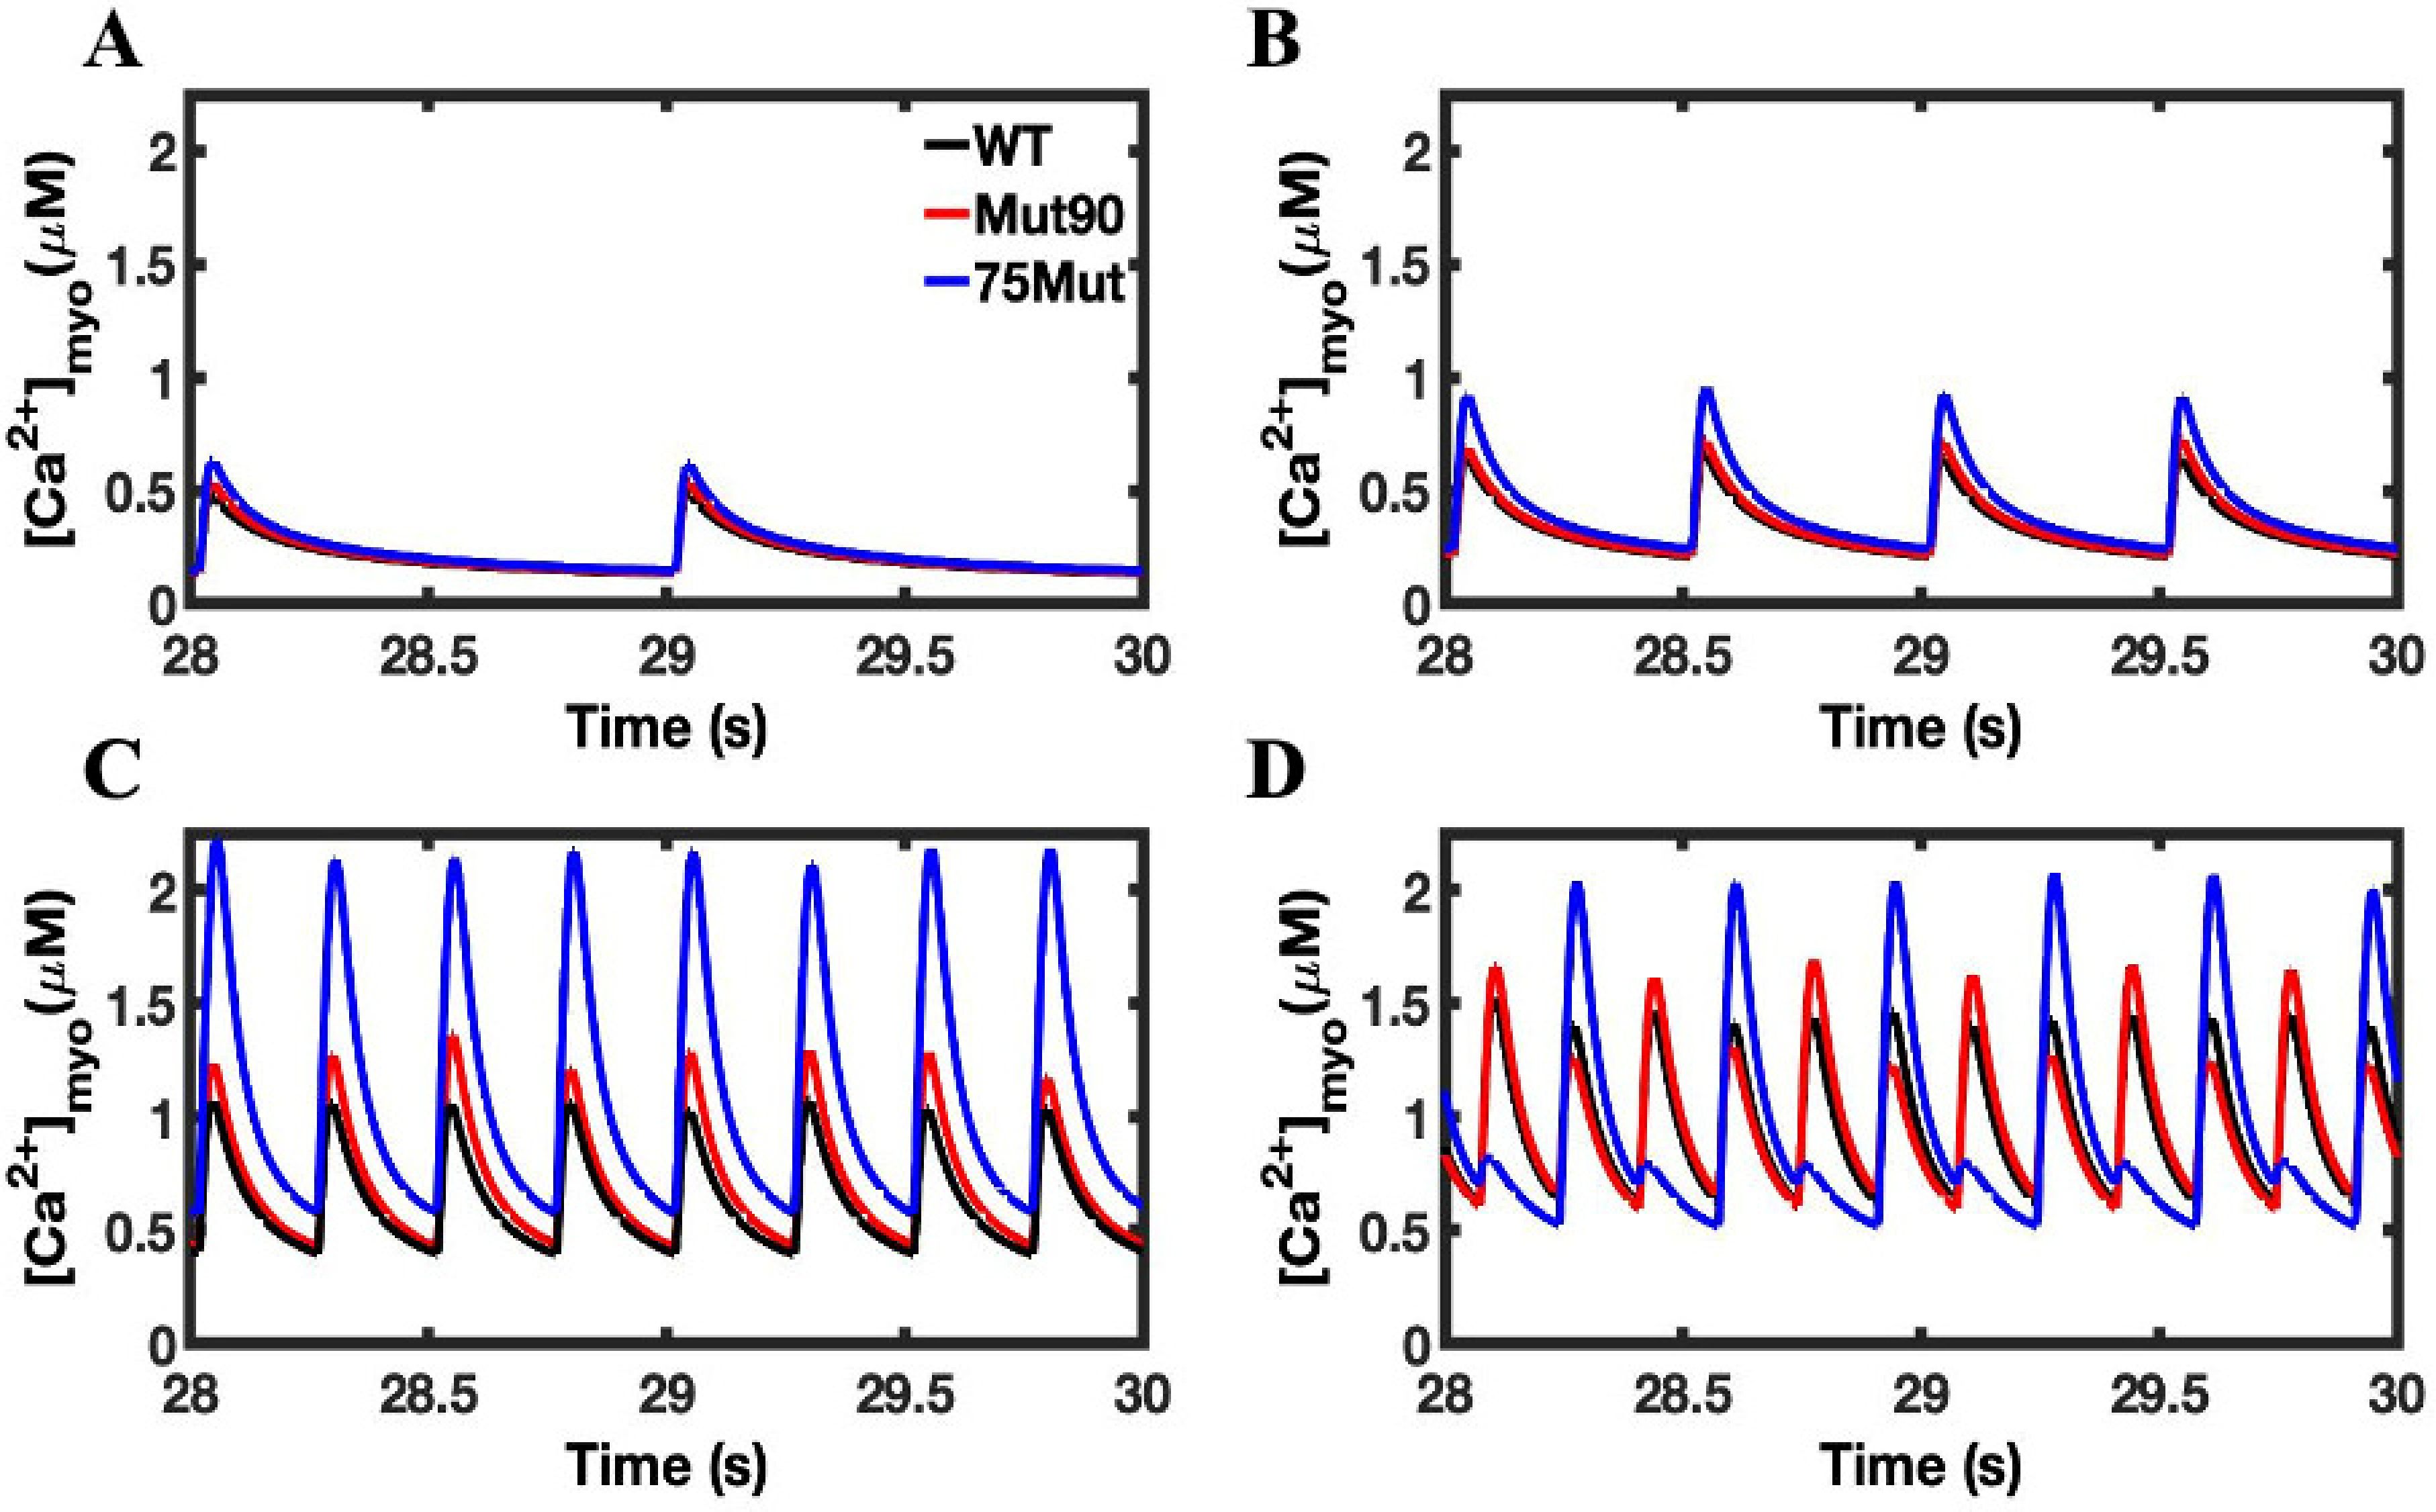
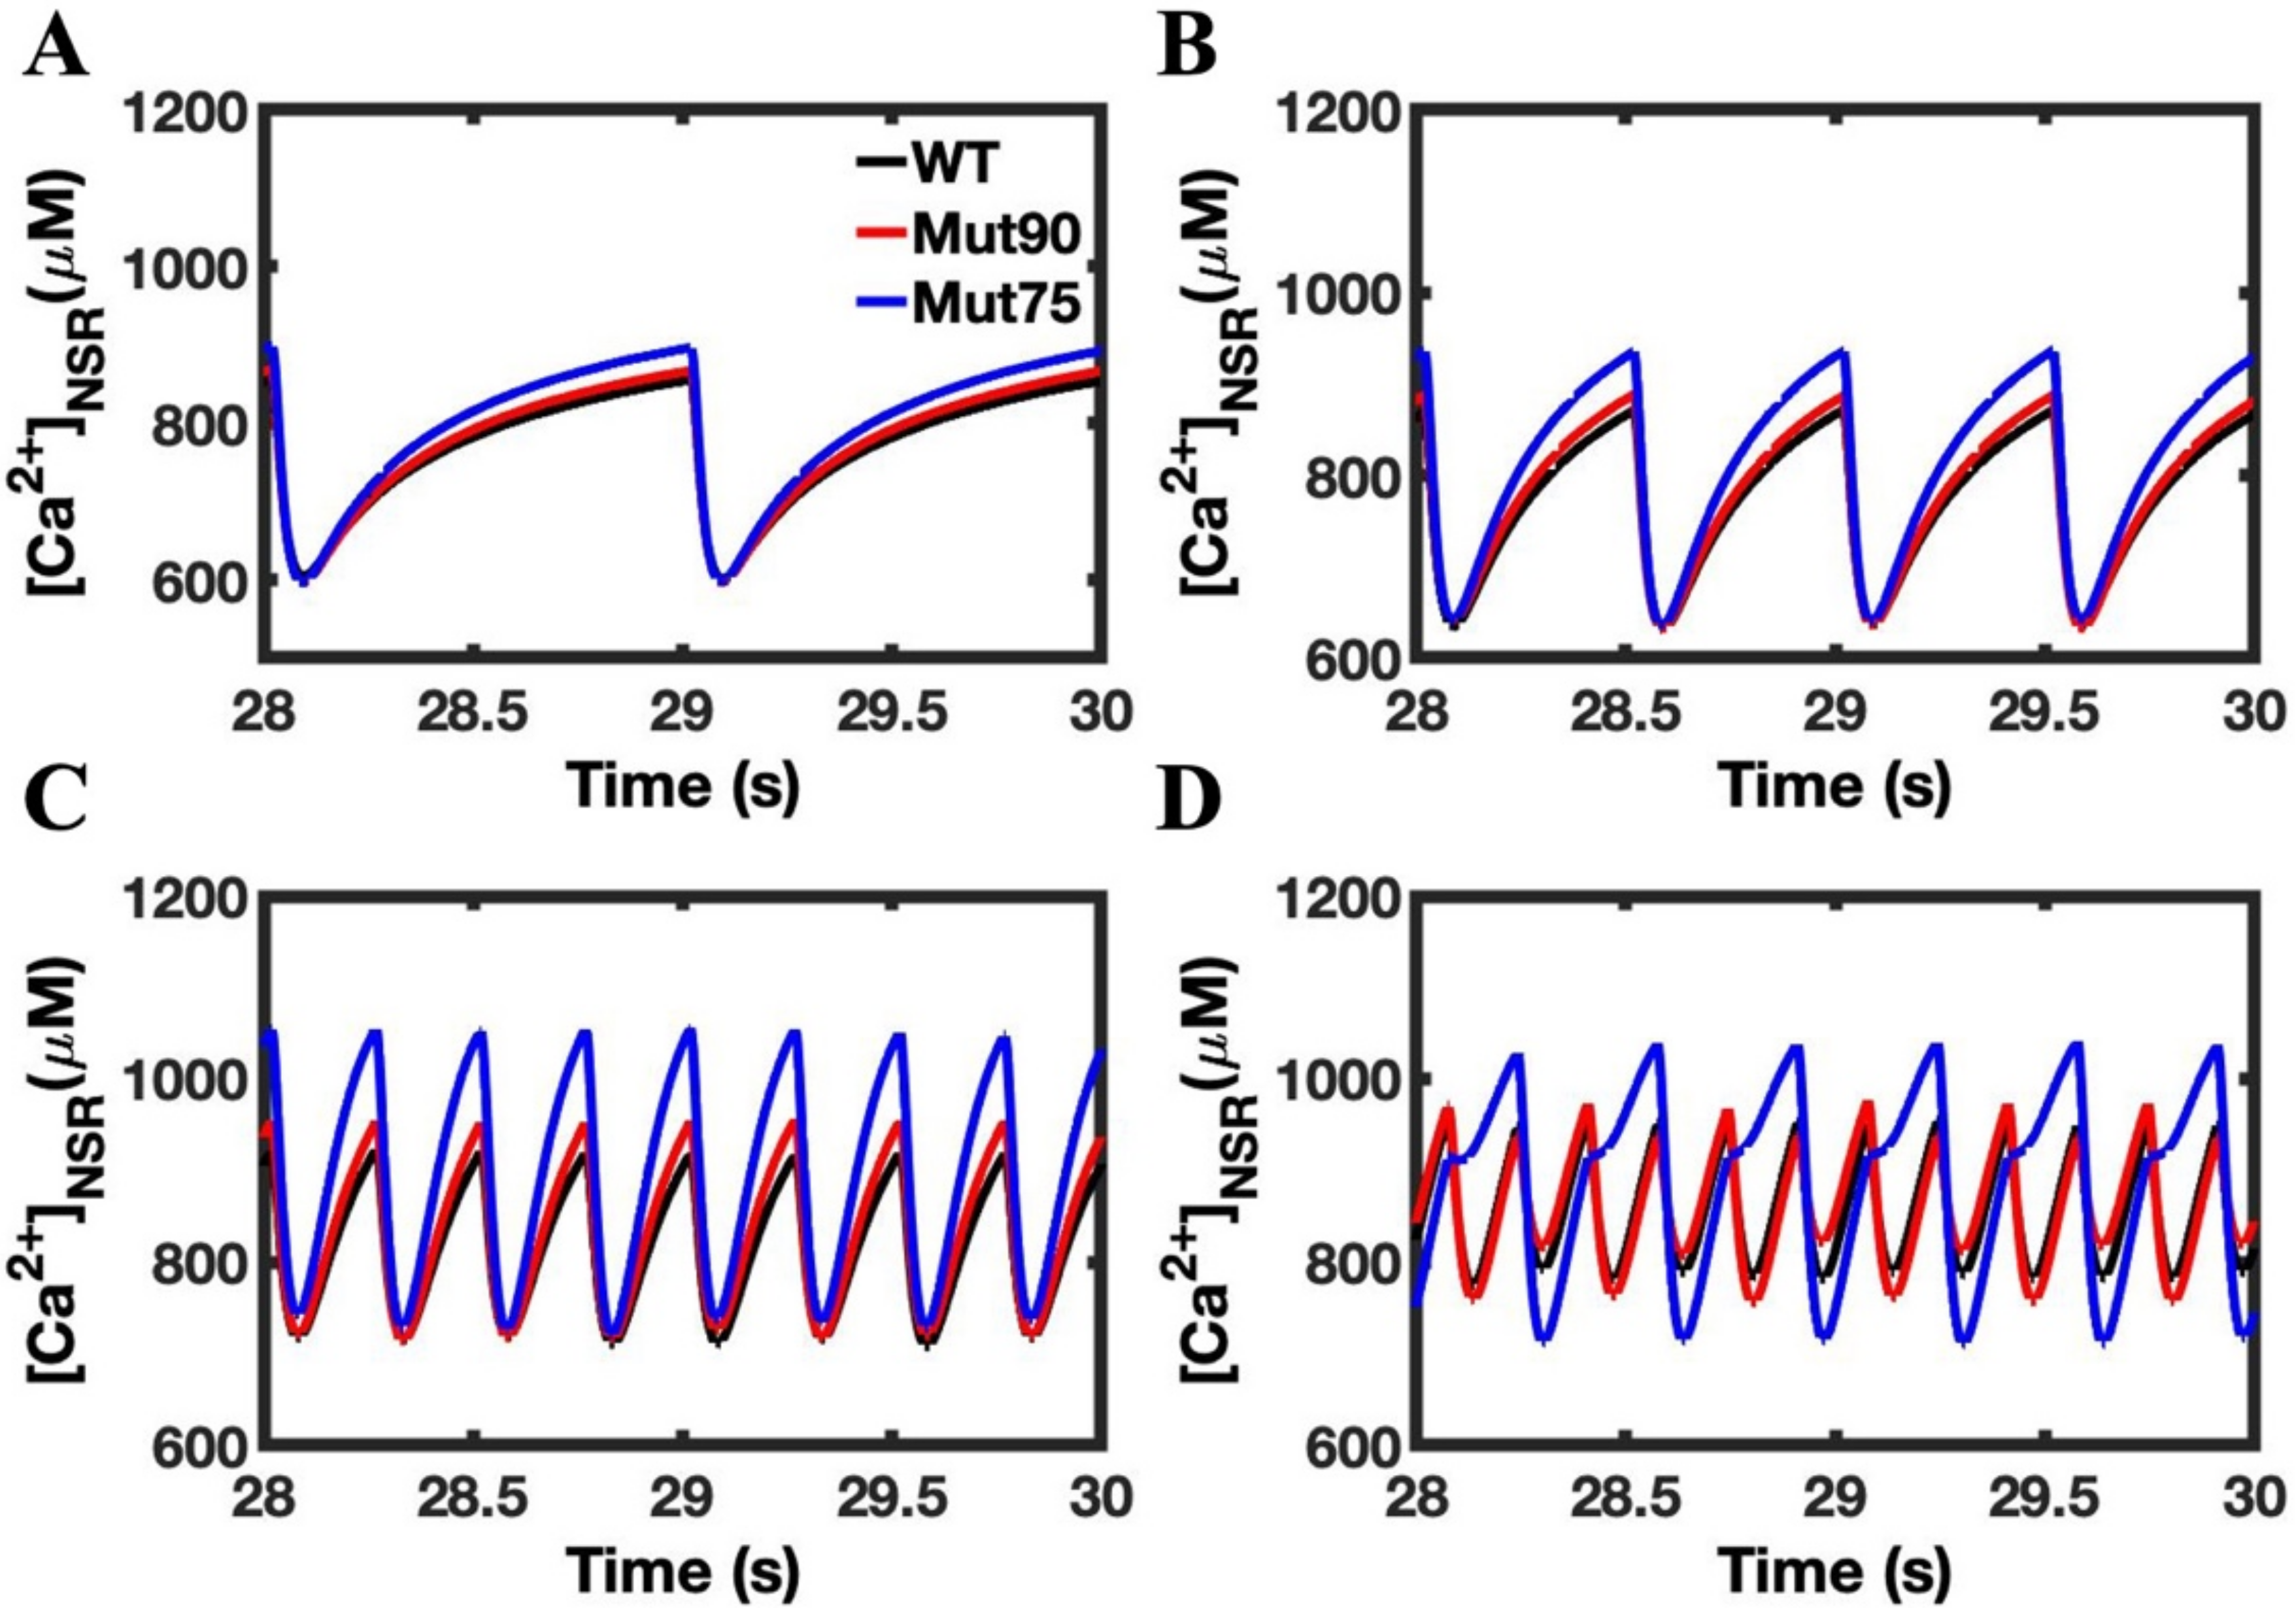
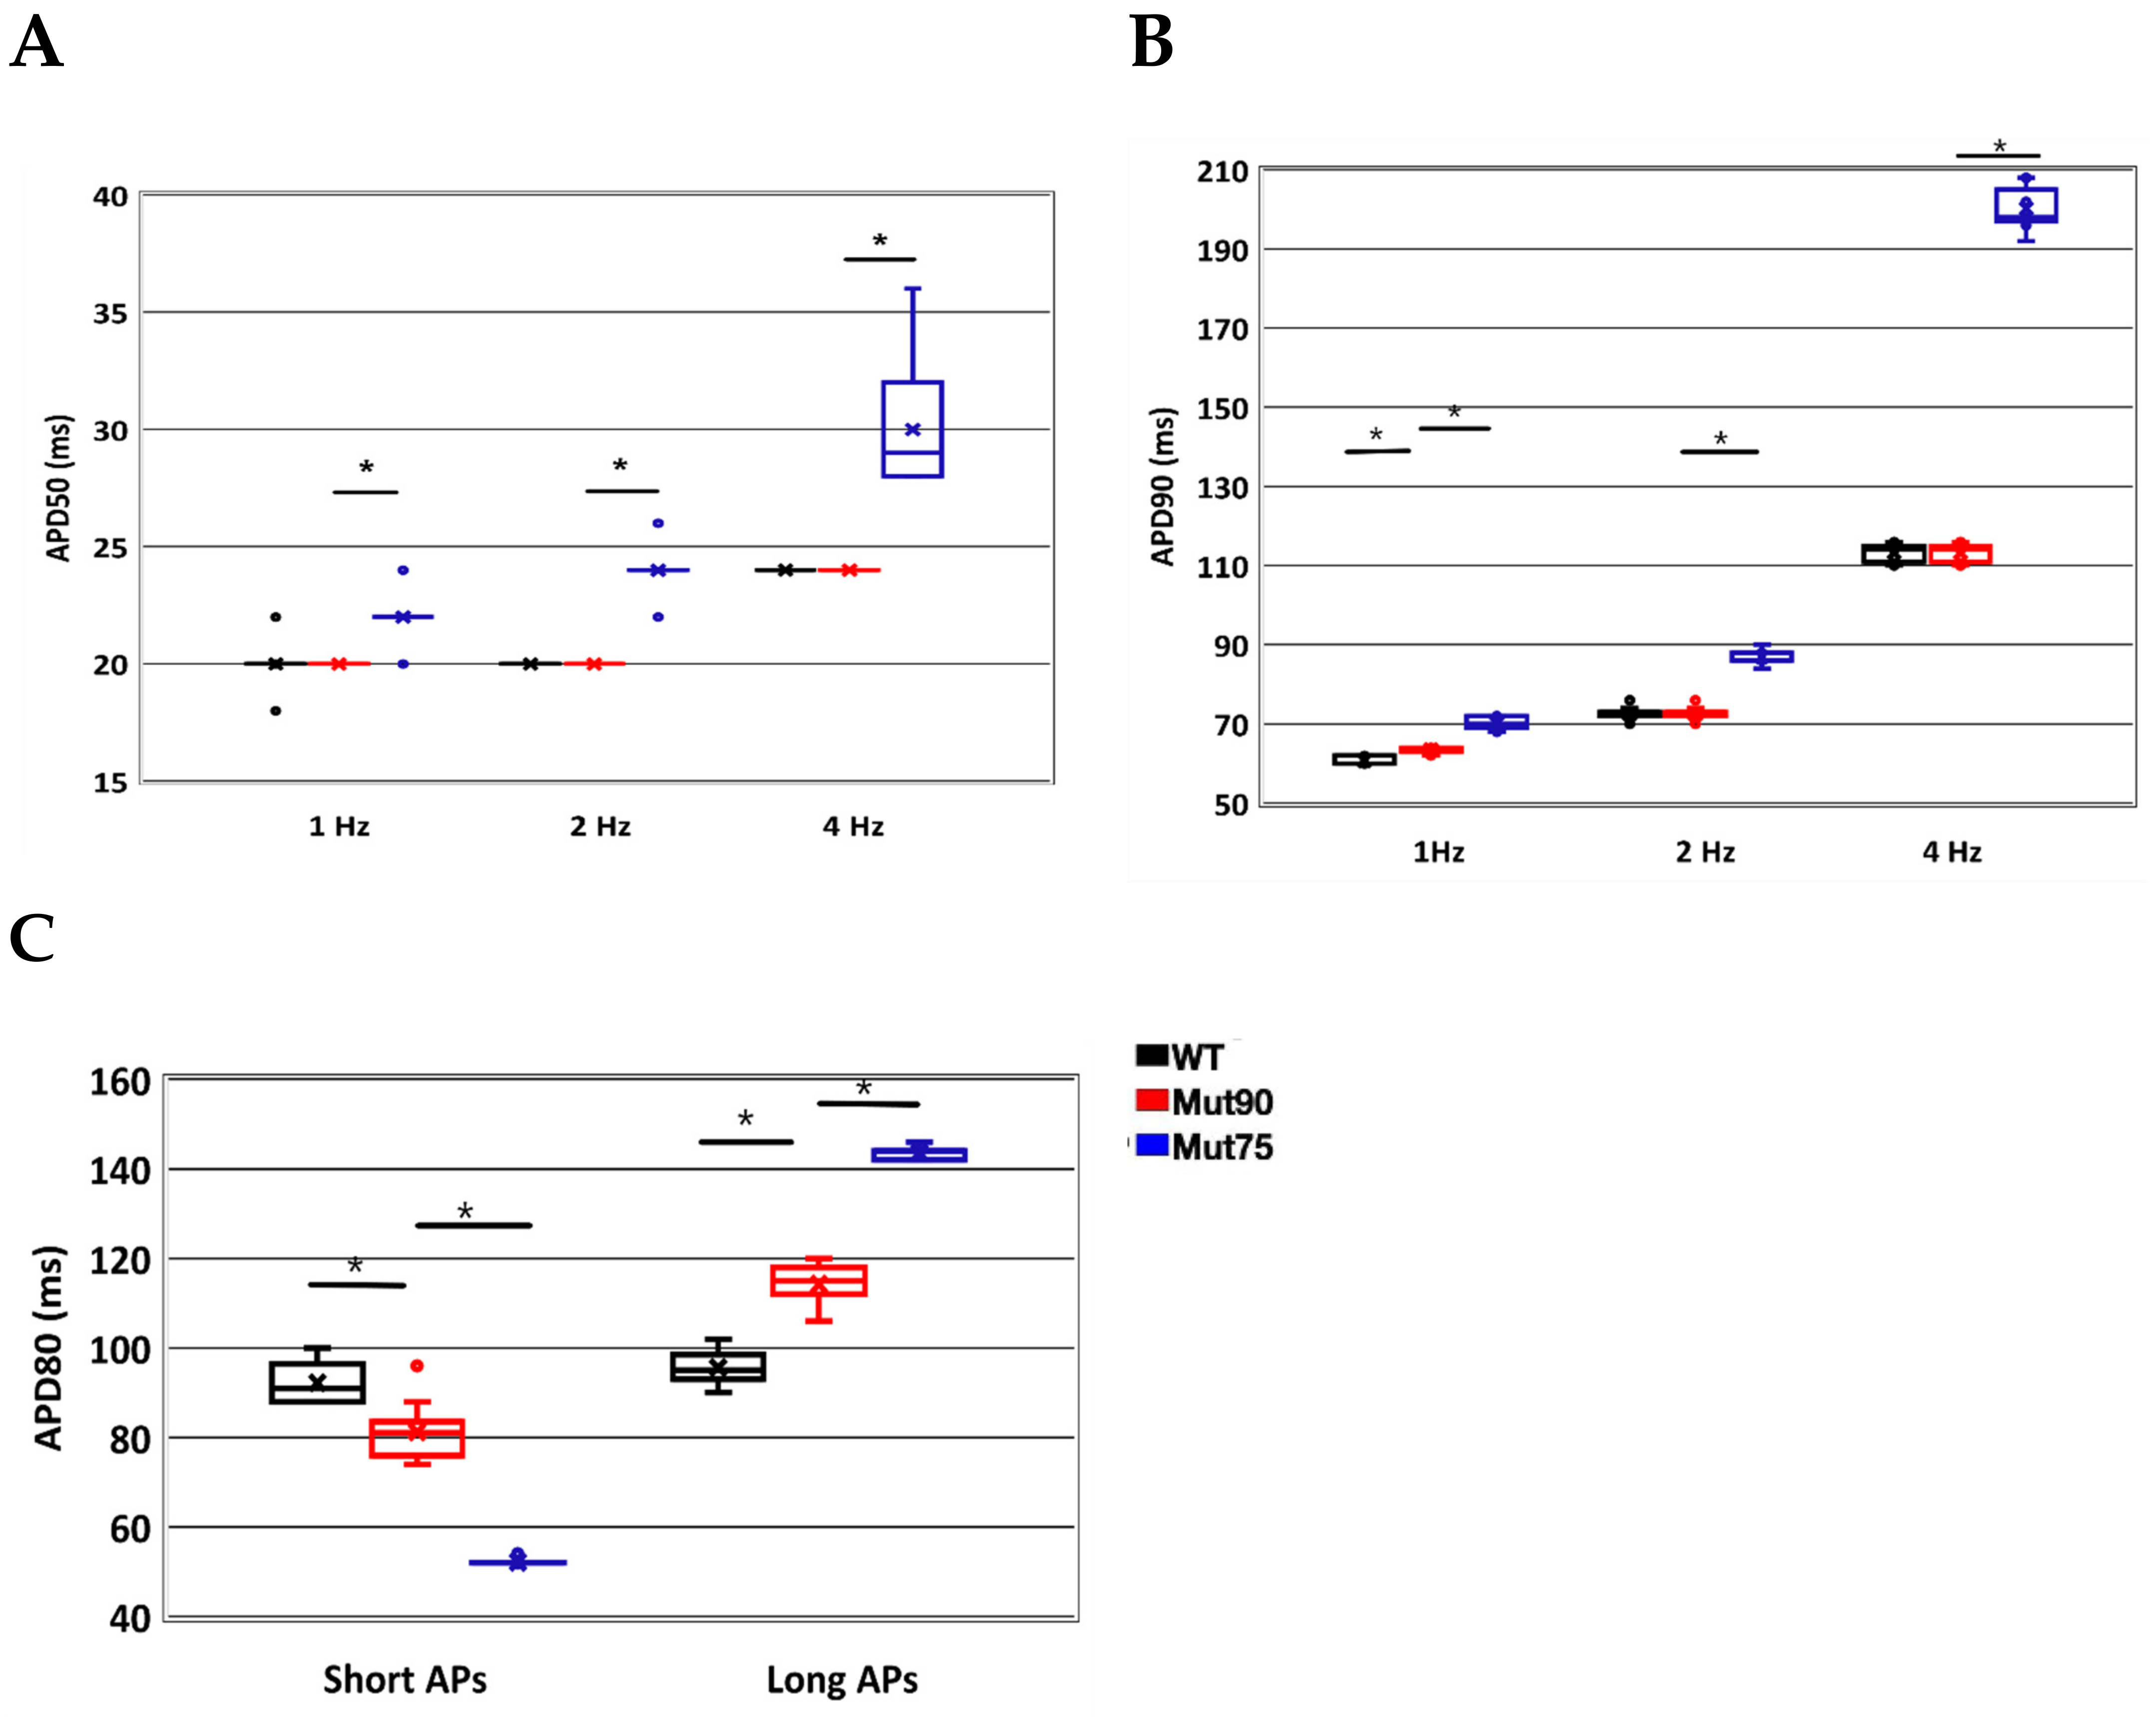
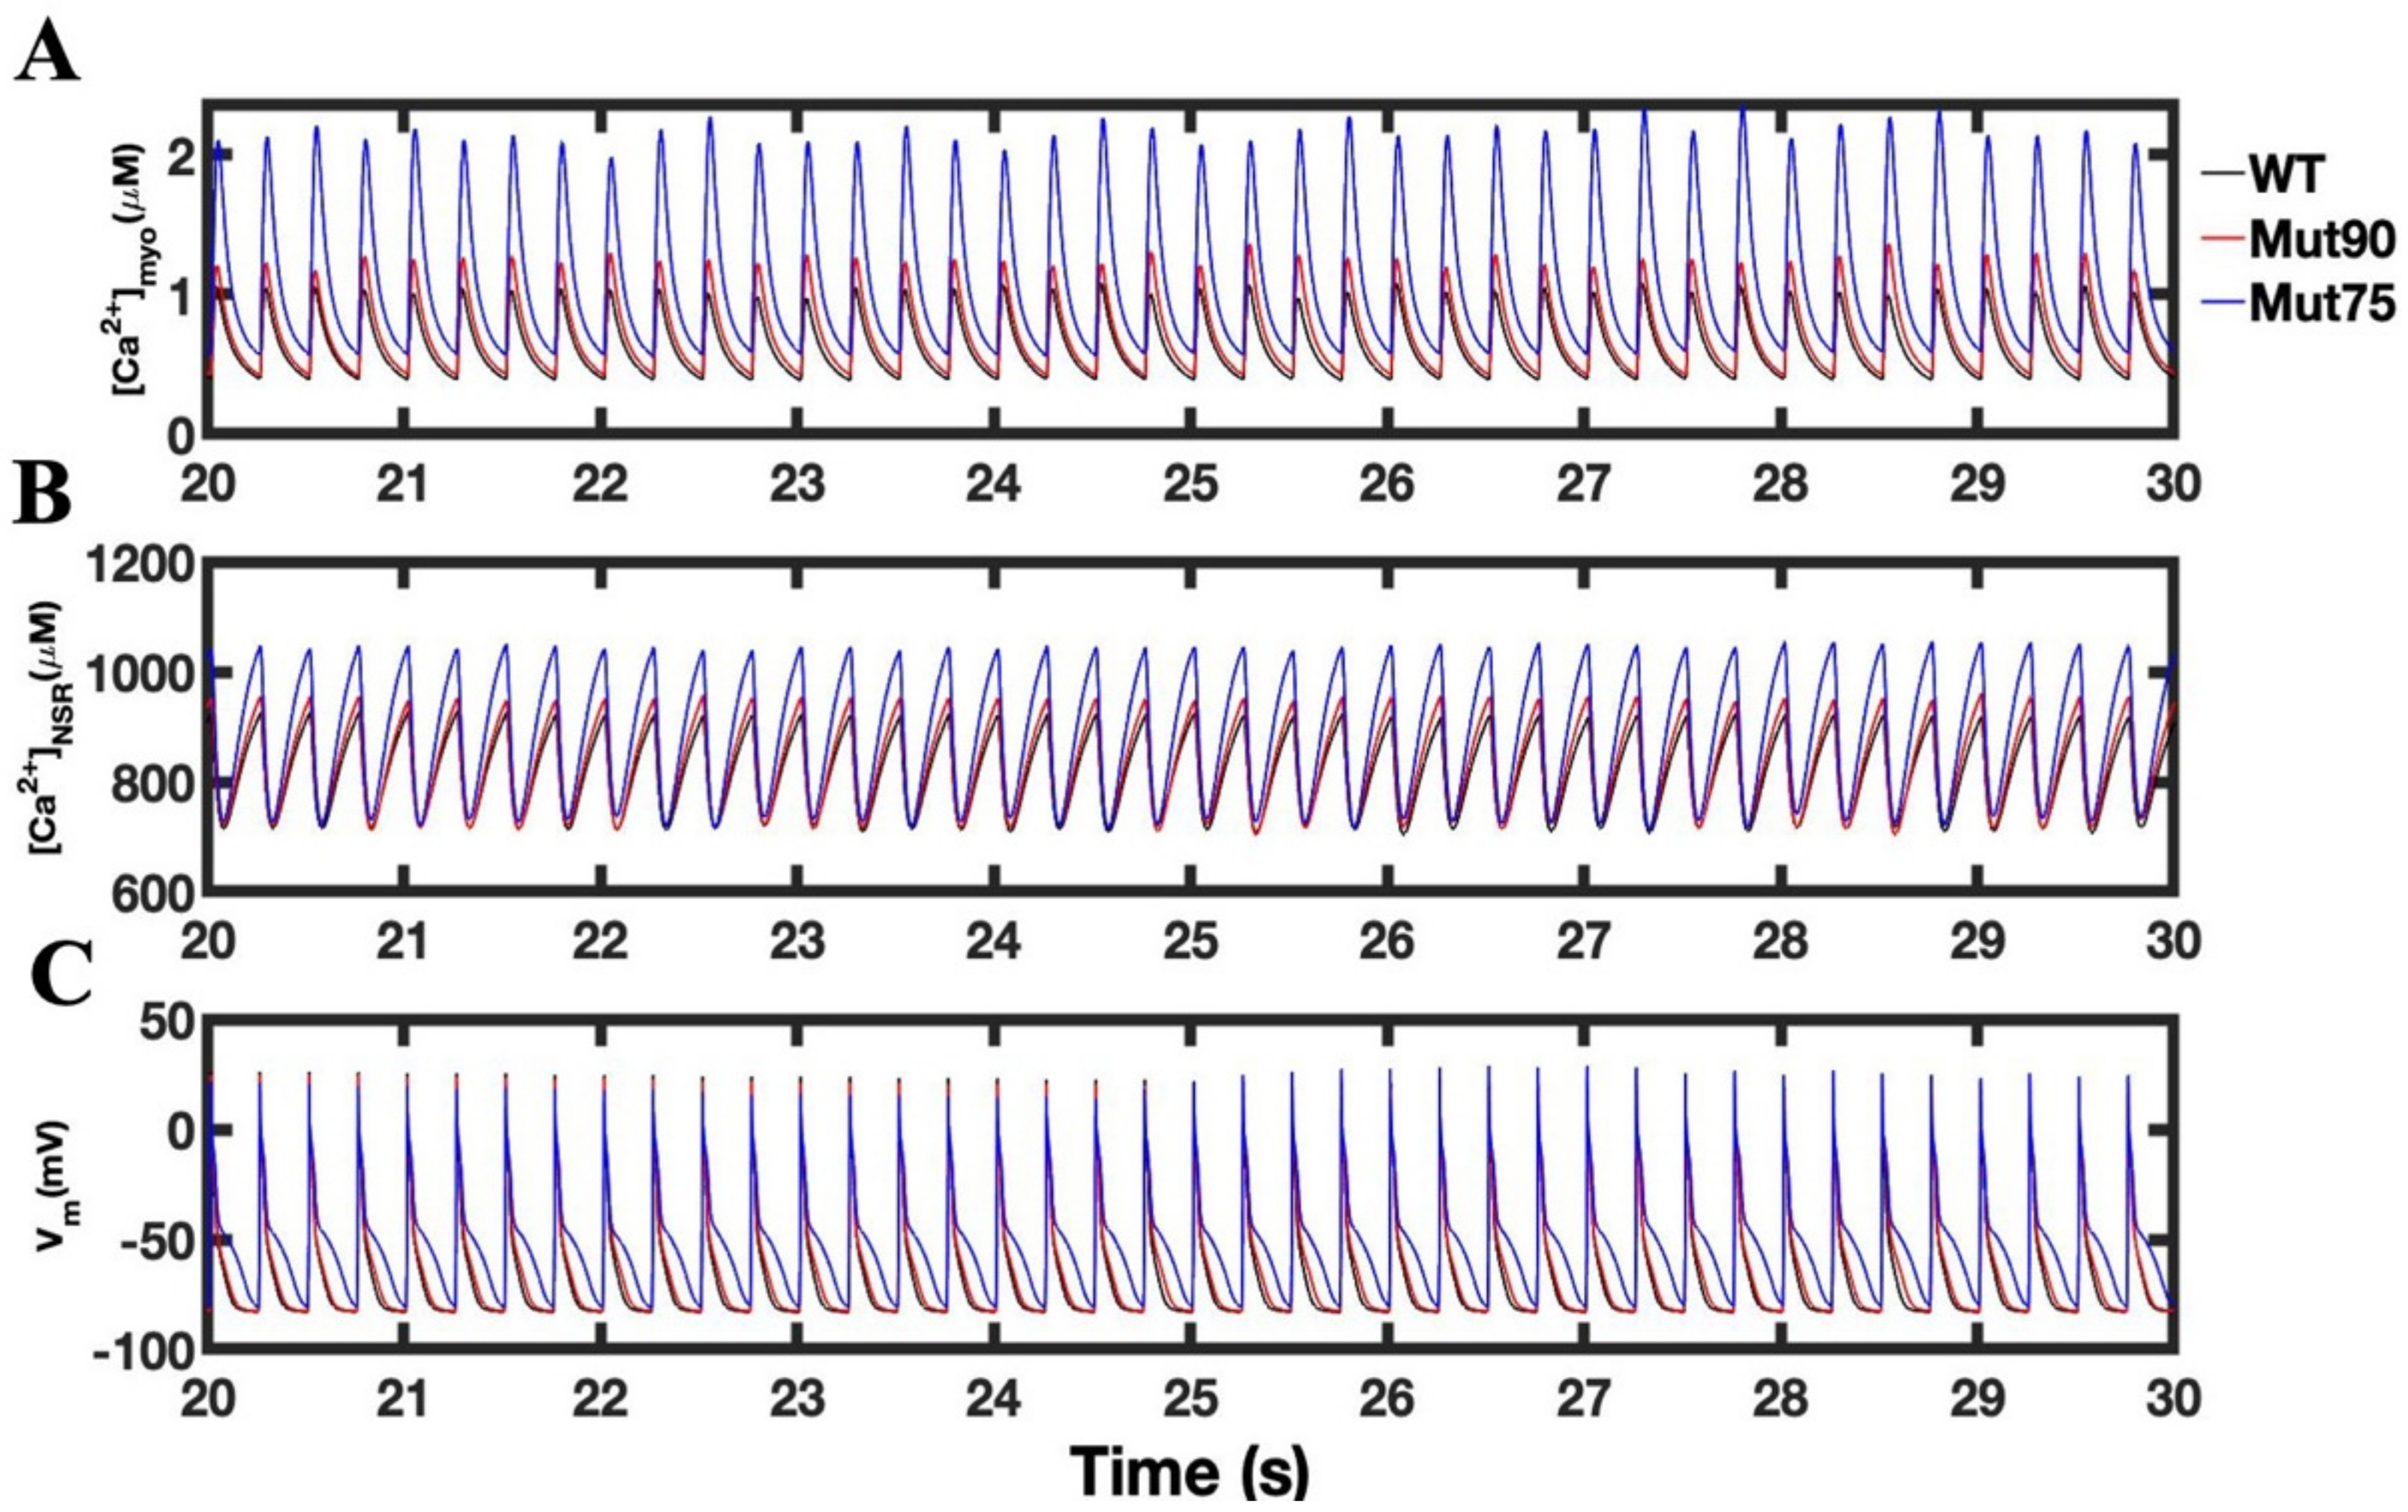
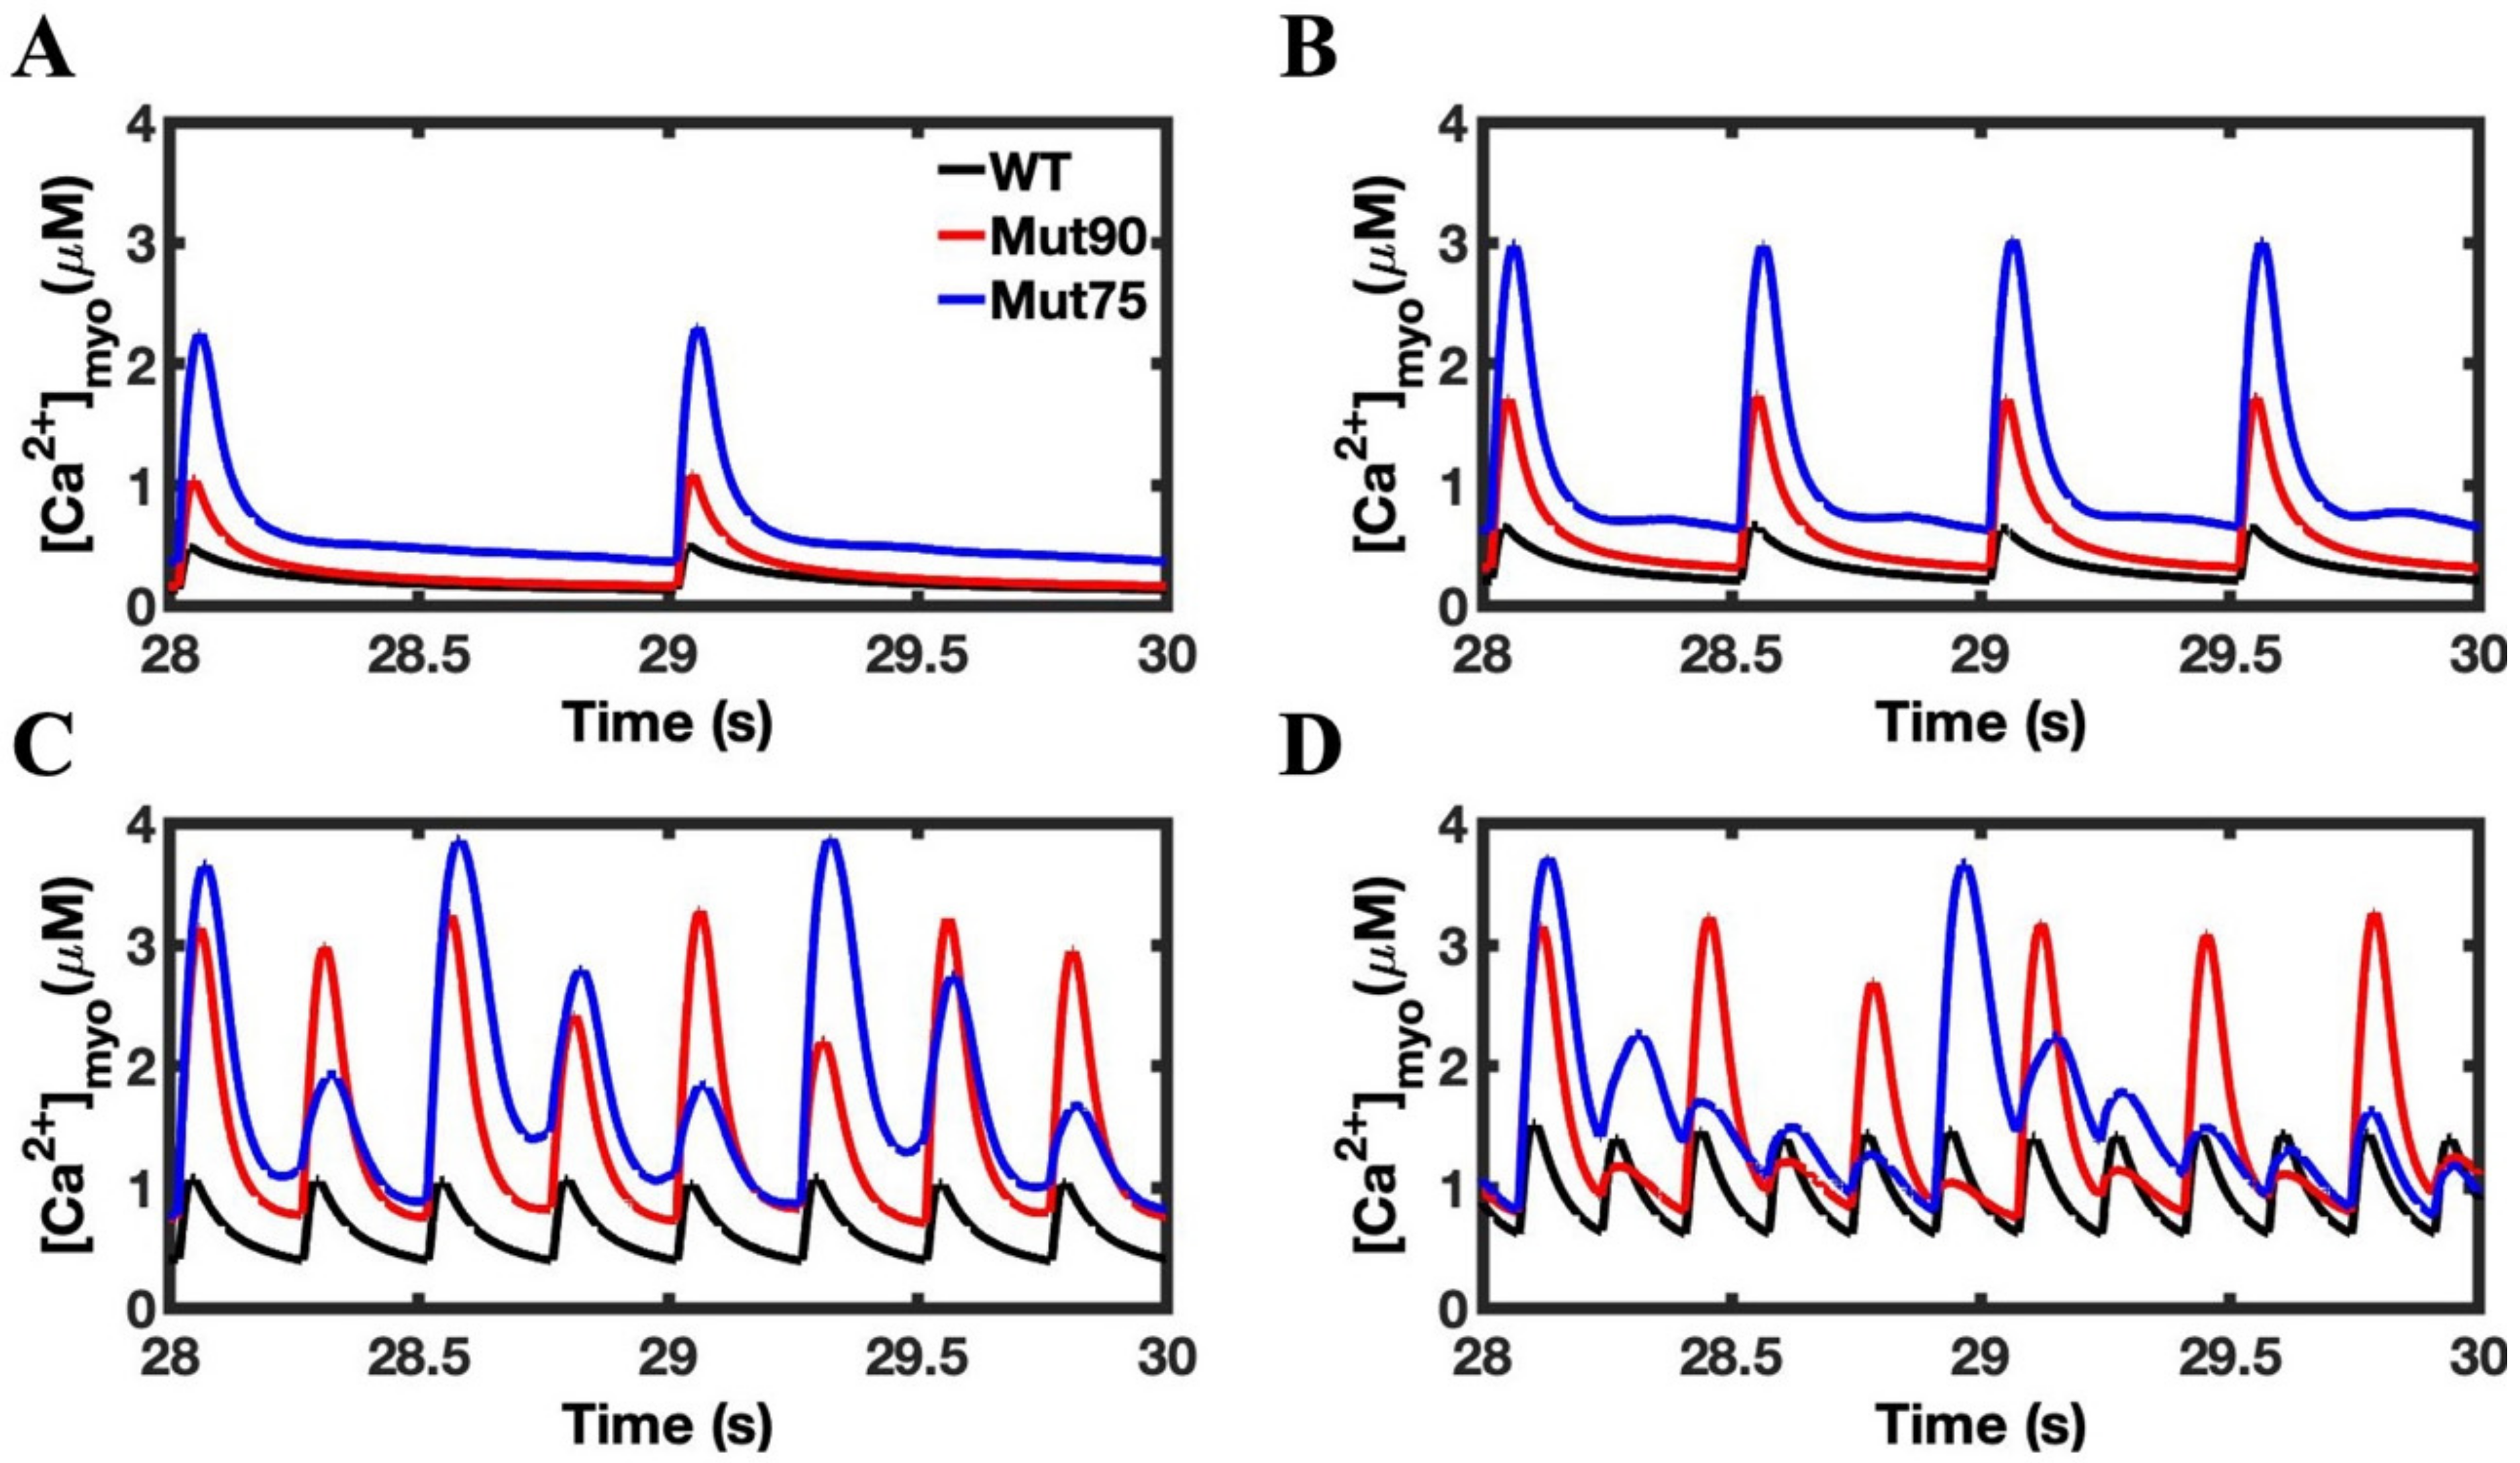
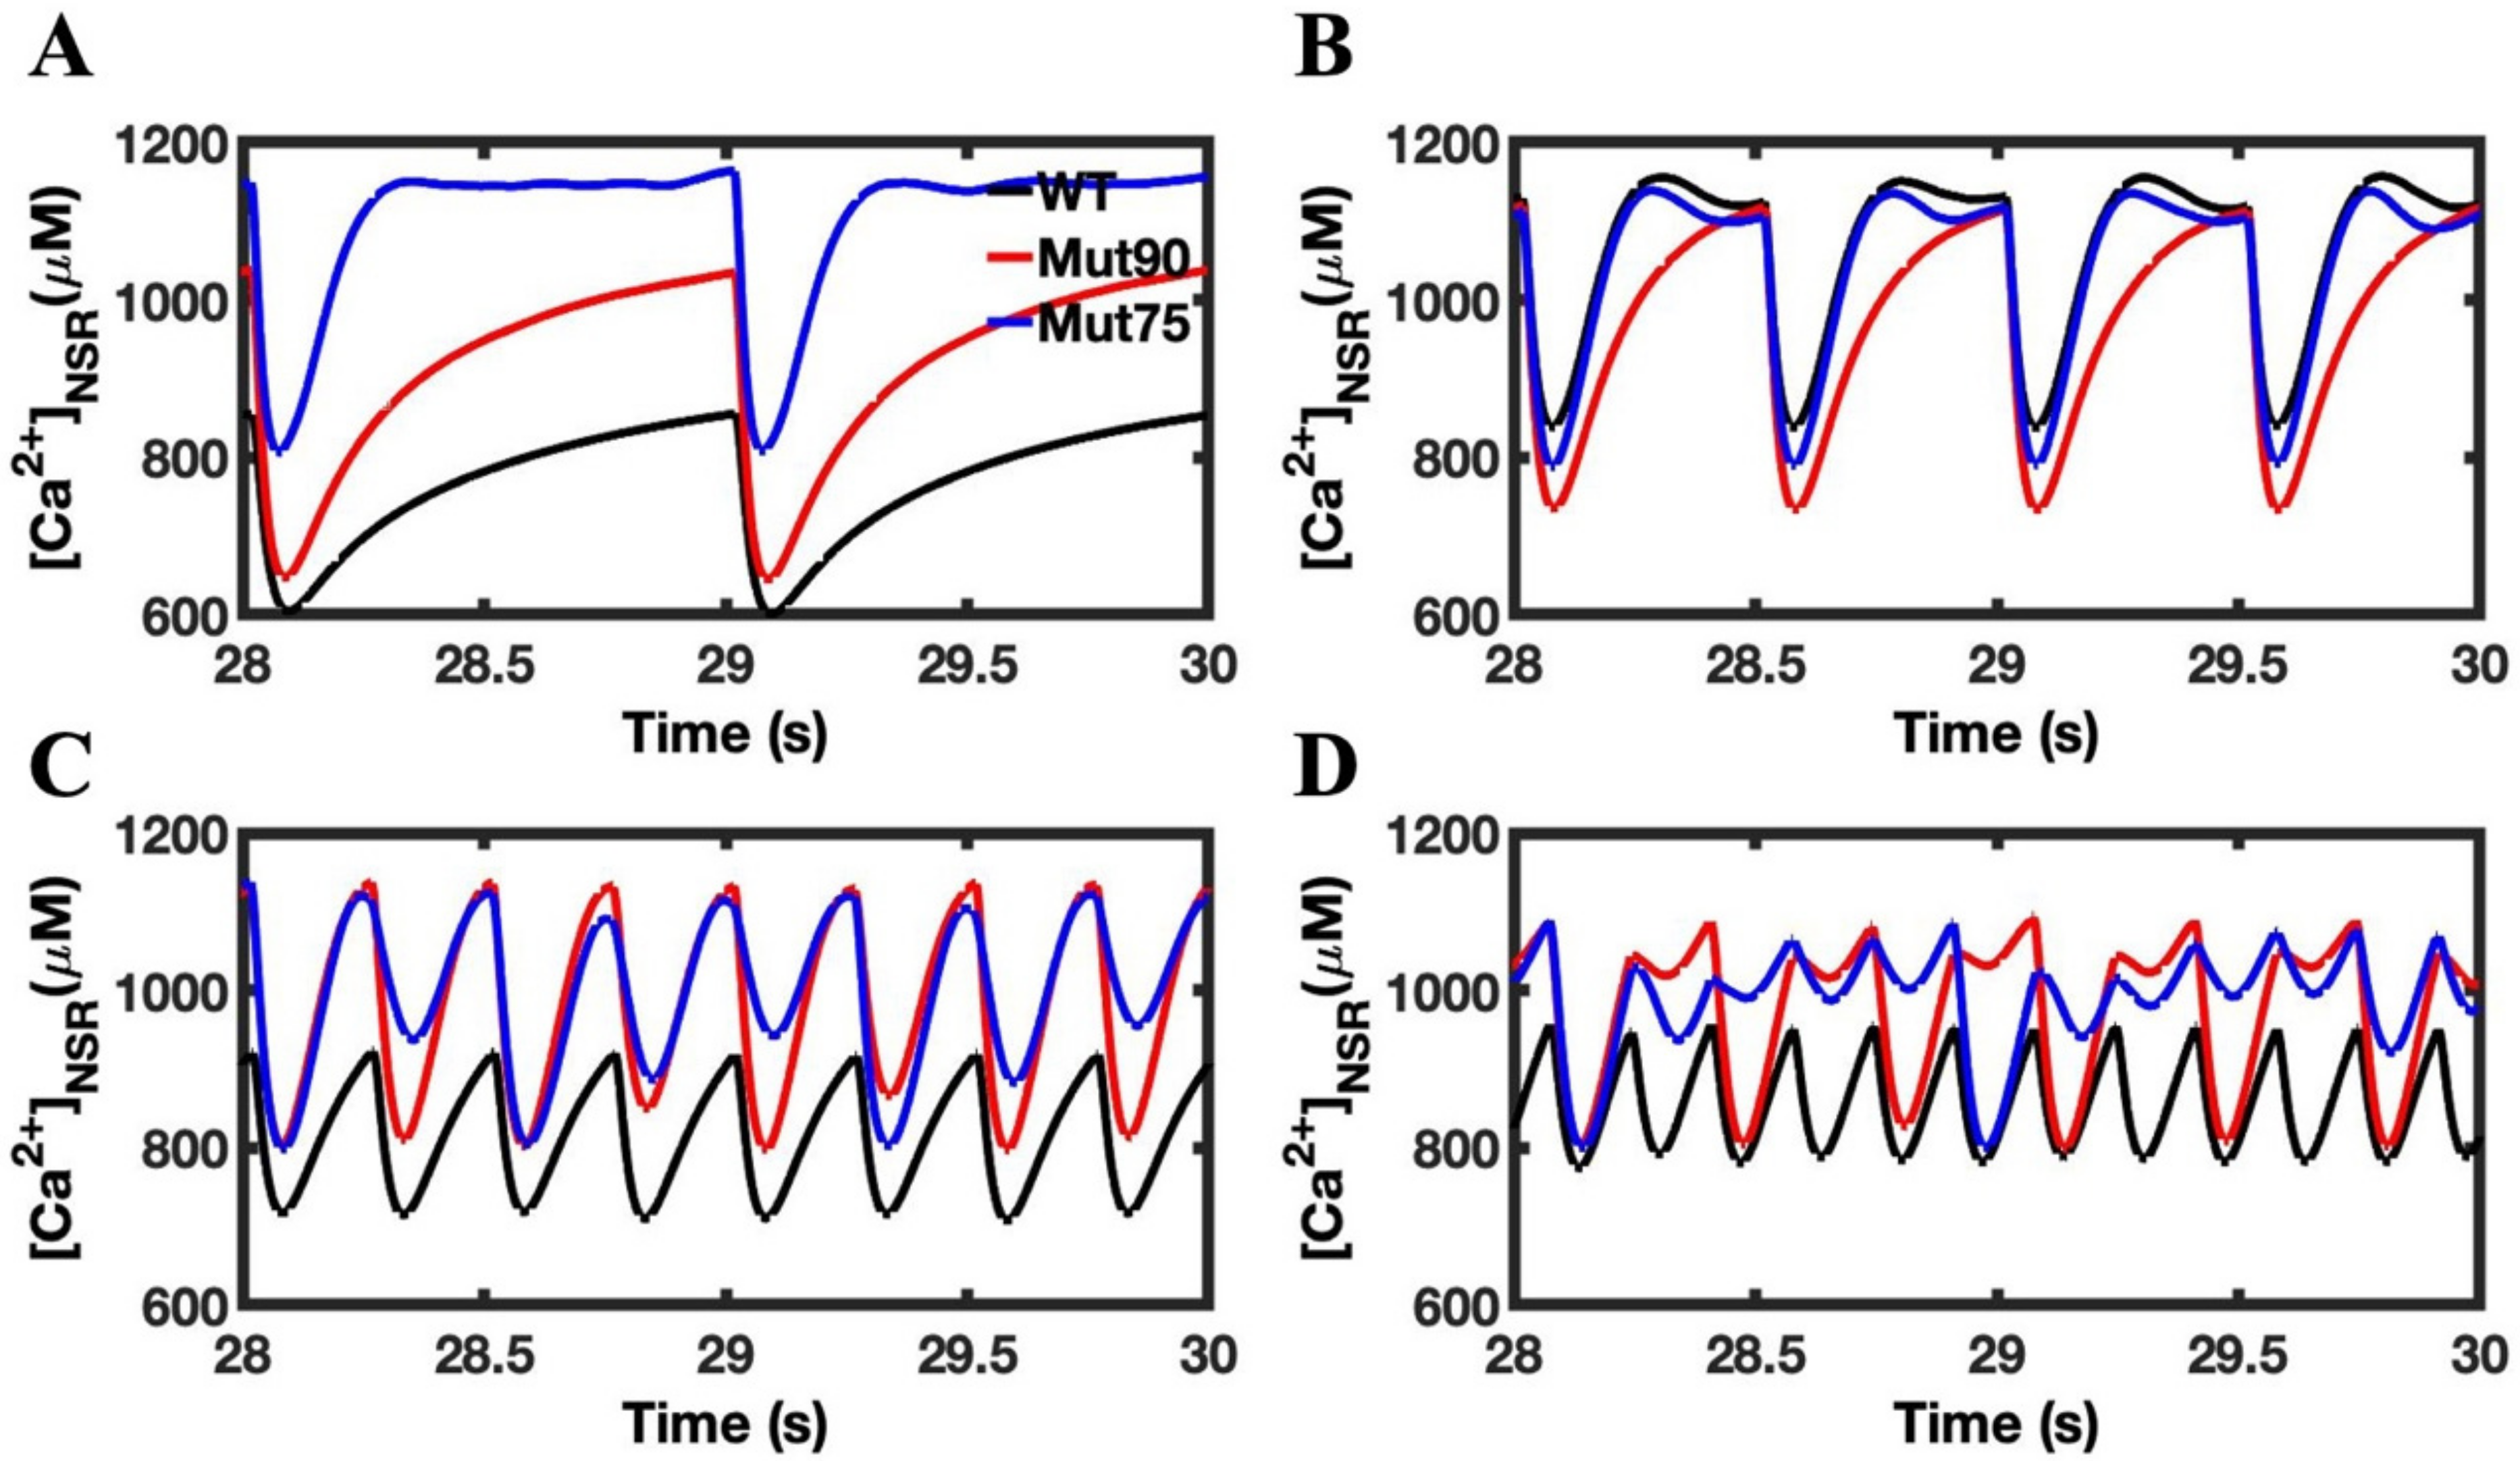
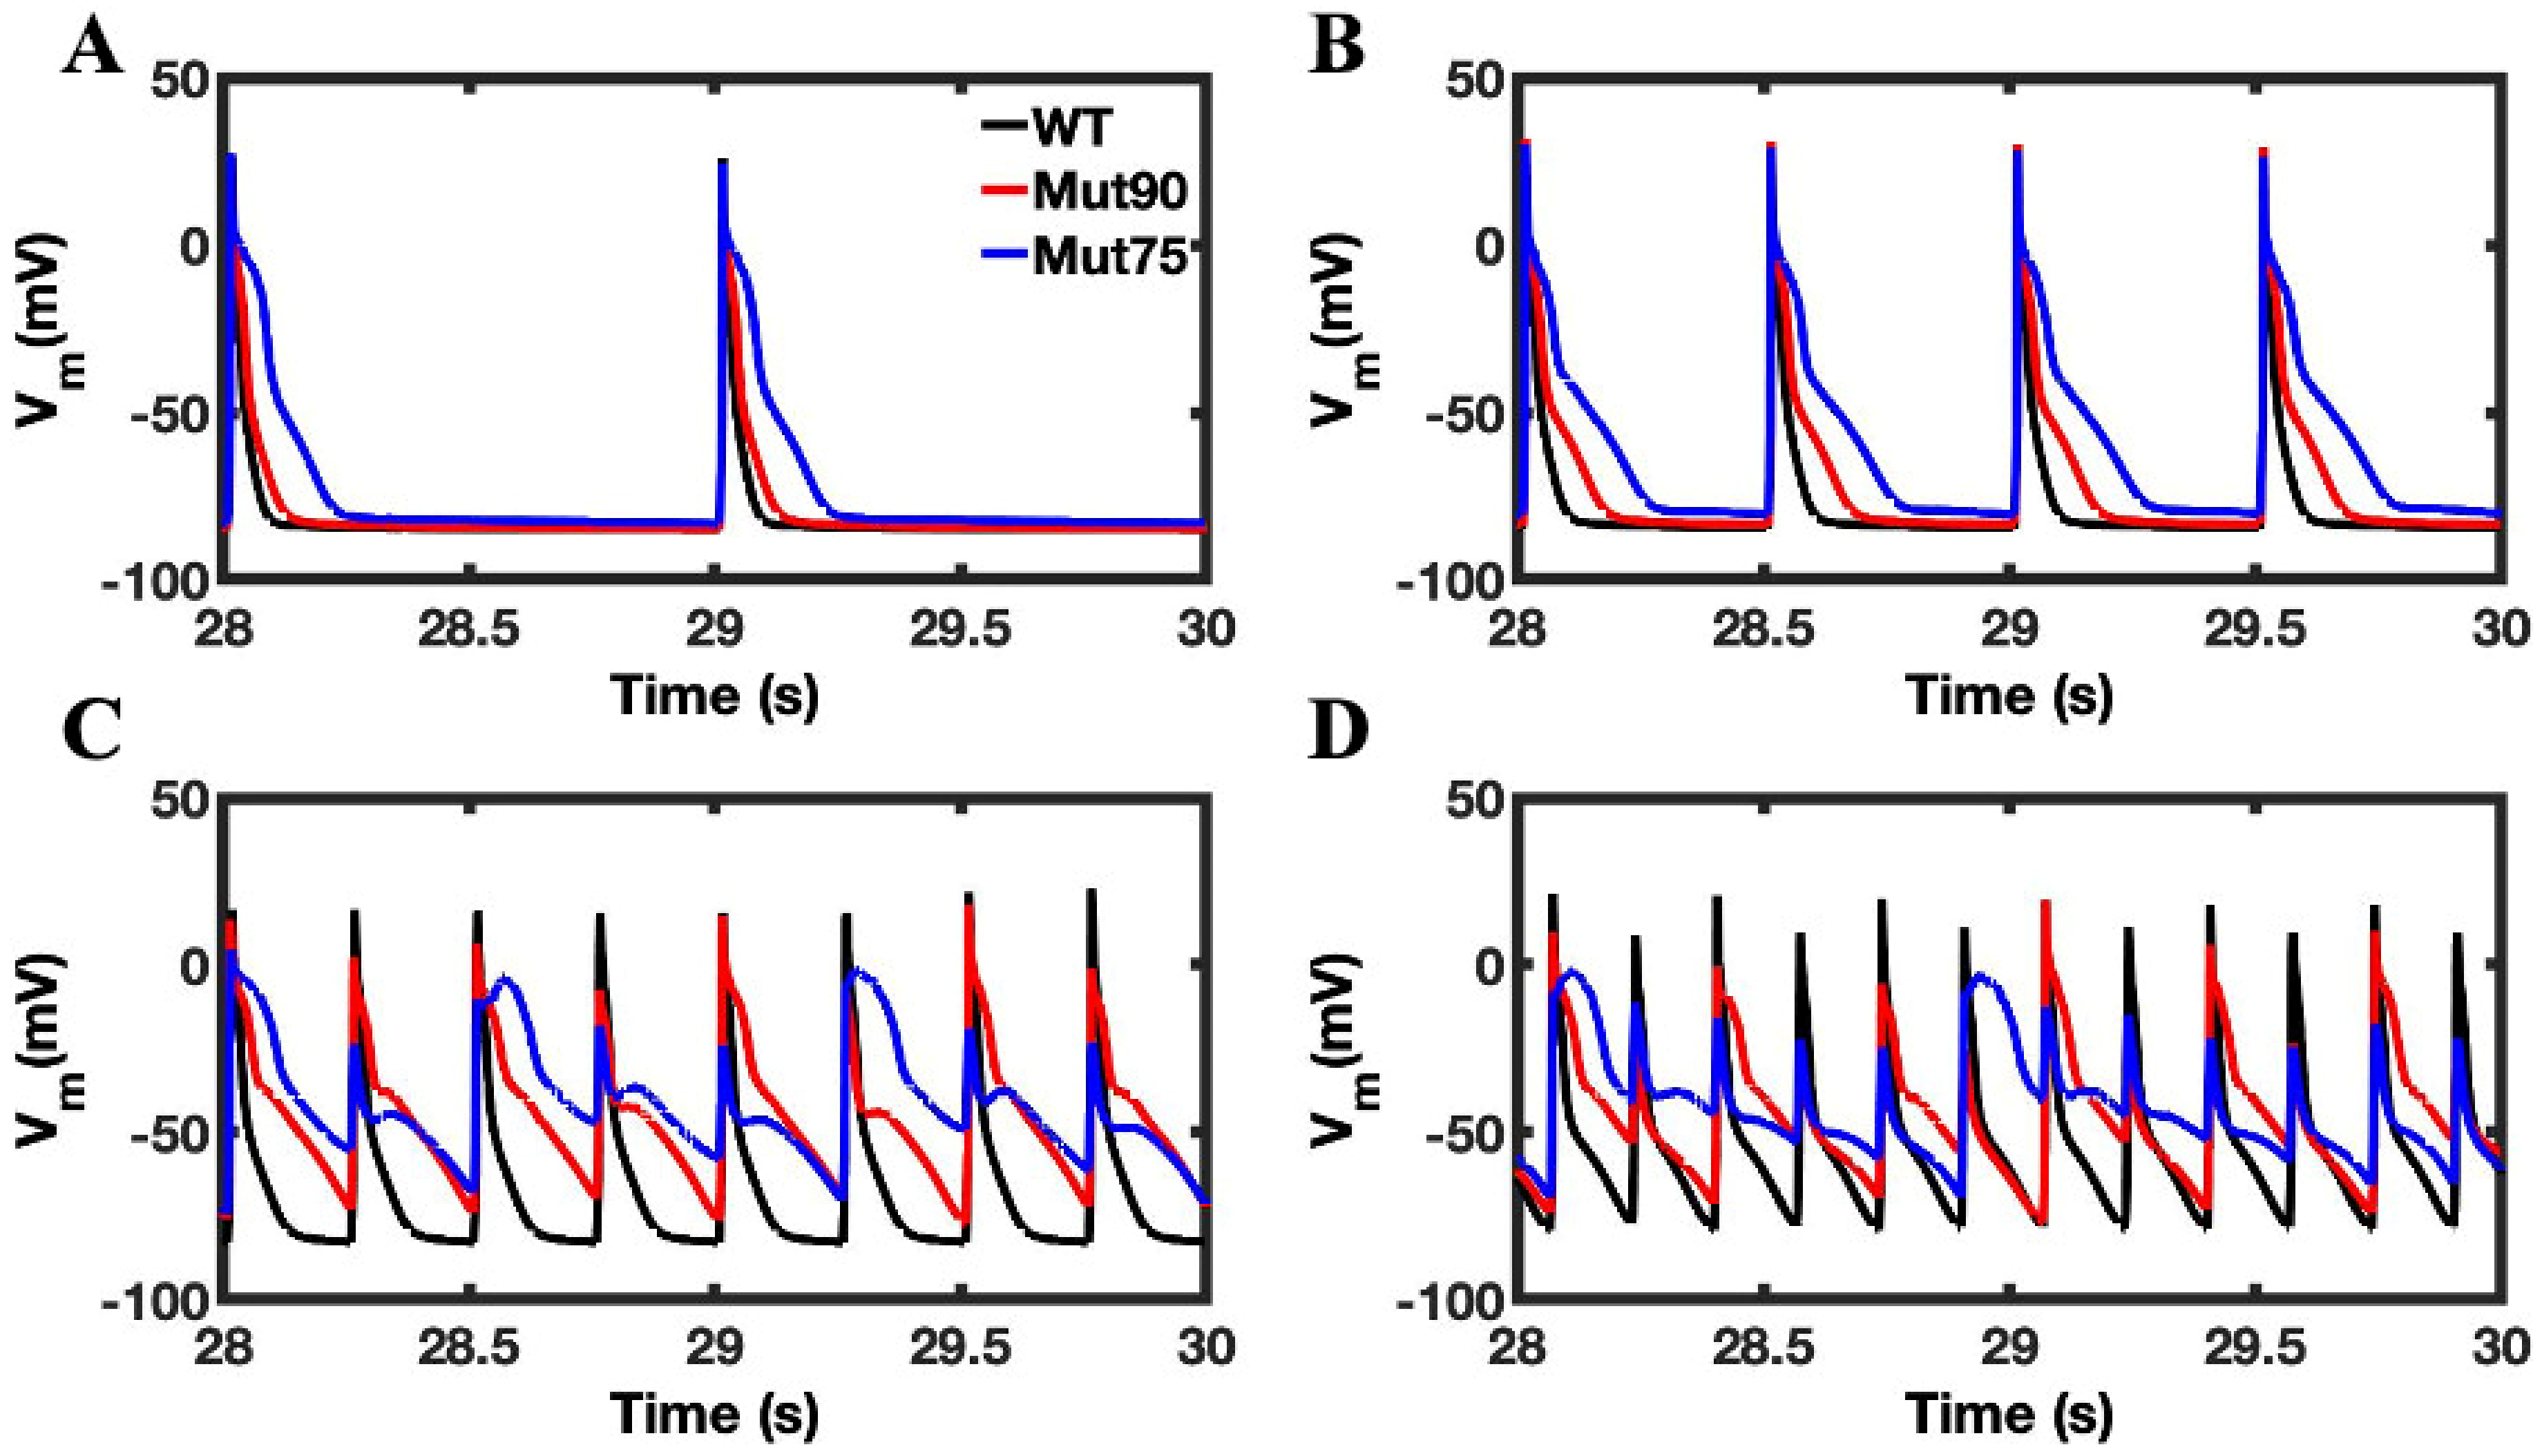
3.1. Reduction of L-Type Calcium Channel CDI Leads to Abnormal EC Coupling

The CaM-dependent inactivation of LCC plays an important role controlling the amount of Ca2+ used to initiate CICR and ensuring the channel is closed prior to the ensuing action potential. The impact of even a slight decrease in the CaM-dependent transition probability can be seen in the simulation results in Figure 4, Figure 5 and Figure 6.
The increase in the peak concentration of cellular Ca2+ is seen in both mutants, and the relative increase over the wild-type concentrations is magnified by pacing (Figure 4). An additional impact of pacing is the elevation of the minimum Ca2+ concentration level. In the 1 Hz simulation, the mutant cells had time to reach the wild-type diastolic concentrations. As the pacing increased, the minimum cellular Ca2+ concentration seen by the cell becomes elevated. For the more severe mutant, the minimum concentration is higher in the 4 Hz pacing (Figure 4C) than the maximum concentration seen for the wild-type cell in the 1 Hz simulation (Figure 4A). Still, the disruption is not severe enough to induce an arrhythmia. The simulations at 6 Hz pacing show a normal train of Ca2+ transients for WT (black) but Ca2+ alternans developing with the reduction in CDI.
The simulation results for the cardiac myocytes show the mutations impacting the CDI have a similar impact on the NSR calcium dynamics (Figure 5). At the onset of CICR, calcium is rapidly depleted as it diffuses to refill the jSR compartments of each CRU. In the 1 Hz simulations, there is no detectable difference in the rate of depletion, but the mutant simulations show an increased calcium loading during the diastolic state (Figure 5A). Under 2 Hz pacing, the NSR is still fully depleted, and the mutant simulations reaches the same minimum calcium concentration as the wild type (Figure 5B). This is no longer the case when the myocytes are subject to the 4 Hz pacing, where CICR terminates before the NSR can be fully depleted (Figure 5C). In Figure 5D, the refilling of the NSR varies from beat-to-beat with the development of alternans.
Despite the changes in calcium loading in both the bulk cell and NSR, the overall impact on the action potential is minimal in the simulations (Figure 6A,B). With 4 Hz pacing, the action potential duration increases a small amount in the 0.90 CDI mutants and a large amount with the 0.85 CDI mutant (Figure 6C). The increase in action potential duration (APD) can be quantified by calculating the average time it takes the transmembrane voltage to return to its diastolic levels over all the depolarizations. In Figure 6D APD alternans is present in the simulated mutants at 6 Hz pacing. The time it takes the cell to rise above 50% and 90% value of the diastolic potential amplitude and return to that point are known as APD50 and APD90, respectively. Figure 7A,B shows that the APD50 and APD90, respectively, for wild type and variant simulated myocytes is significantly increased at 4 Hz and with increased disruption of CDI. Although pacing at 6 Hz yields normal APs for wild type, with the mutants alternans occurs and becomes significantly more severe as the functional defect increases (Figure 7C). APD80 is shown for the long and short action potentials instead of APD90 because the APs at 6Hz in Figure 6D do not always return to 90% repolarization.
On a longer timescale, a 30 s simulation at 4 Hz pacing is shown in Figure 8, the magnitude of impact of mutations on the cellular and NSR calcium concentrations is clear (Figure 8A,B). During 4 Hz pacing, all cells respond by with an increased calcium concentrations in the bulk myoplasm and NSR, but the mutants do so with and increased rate and scale (Figure 8C). However, despite these differences in calcium concentration, the impact of the CaM mutations on the action potential is less pronounced. In the simulation for a given cell type (wild type and mutant), the difference in action potential from beat to beta is negligible after 20 s because all simulations are able to achieve a new homeostasis. This is further demonstrated by the uniformity of the cyclic peaks in the final second of simulations. Still, the simulated mutations do push the simulations toward instability, as oscillations in the peak cellular calcium begin to occur for the more severe mutant under 4 Hz pacing. In this condition, the cell has assumed a state on the verge of arrhythmia, indicating a possible threshold of diminished CDI function that is tolerated by the cardiac myocyte.

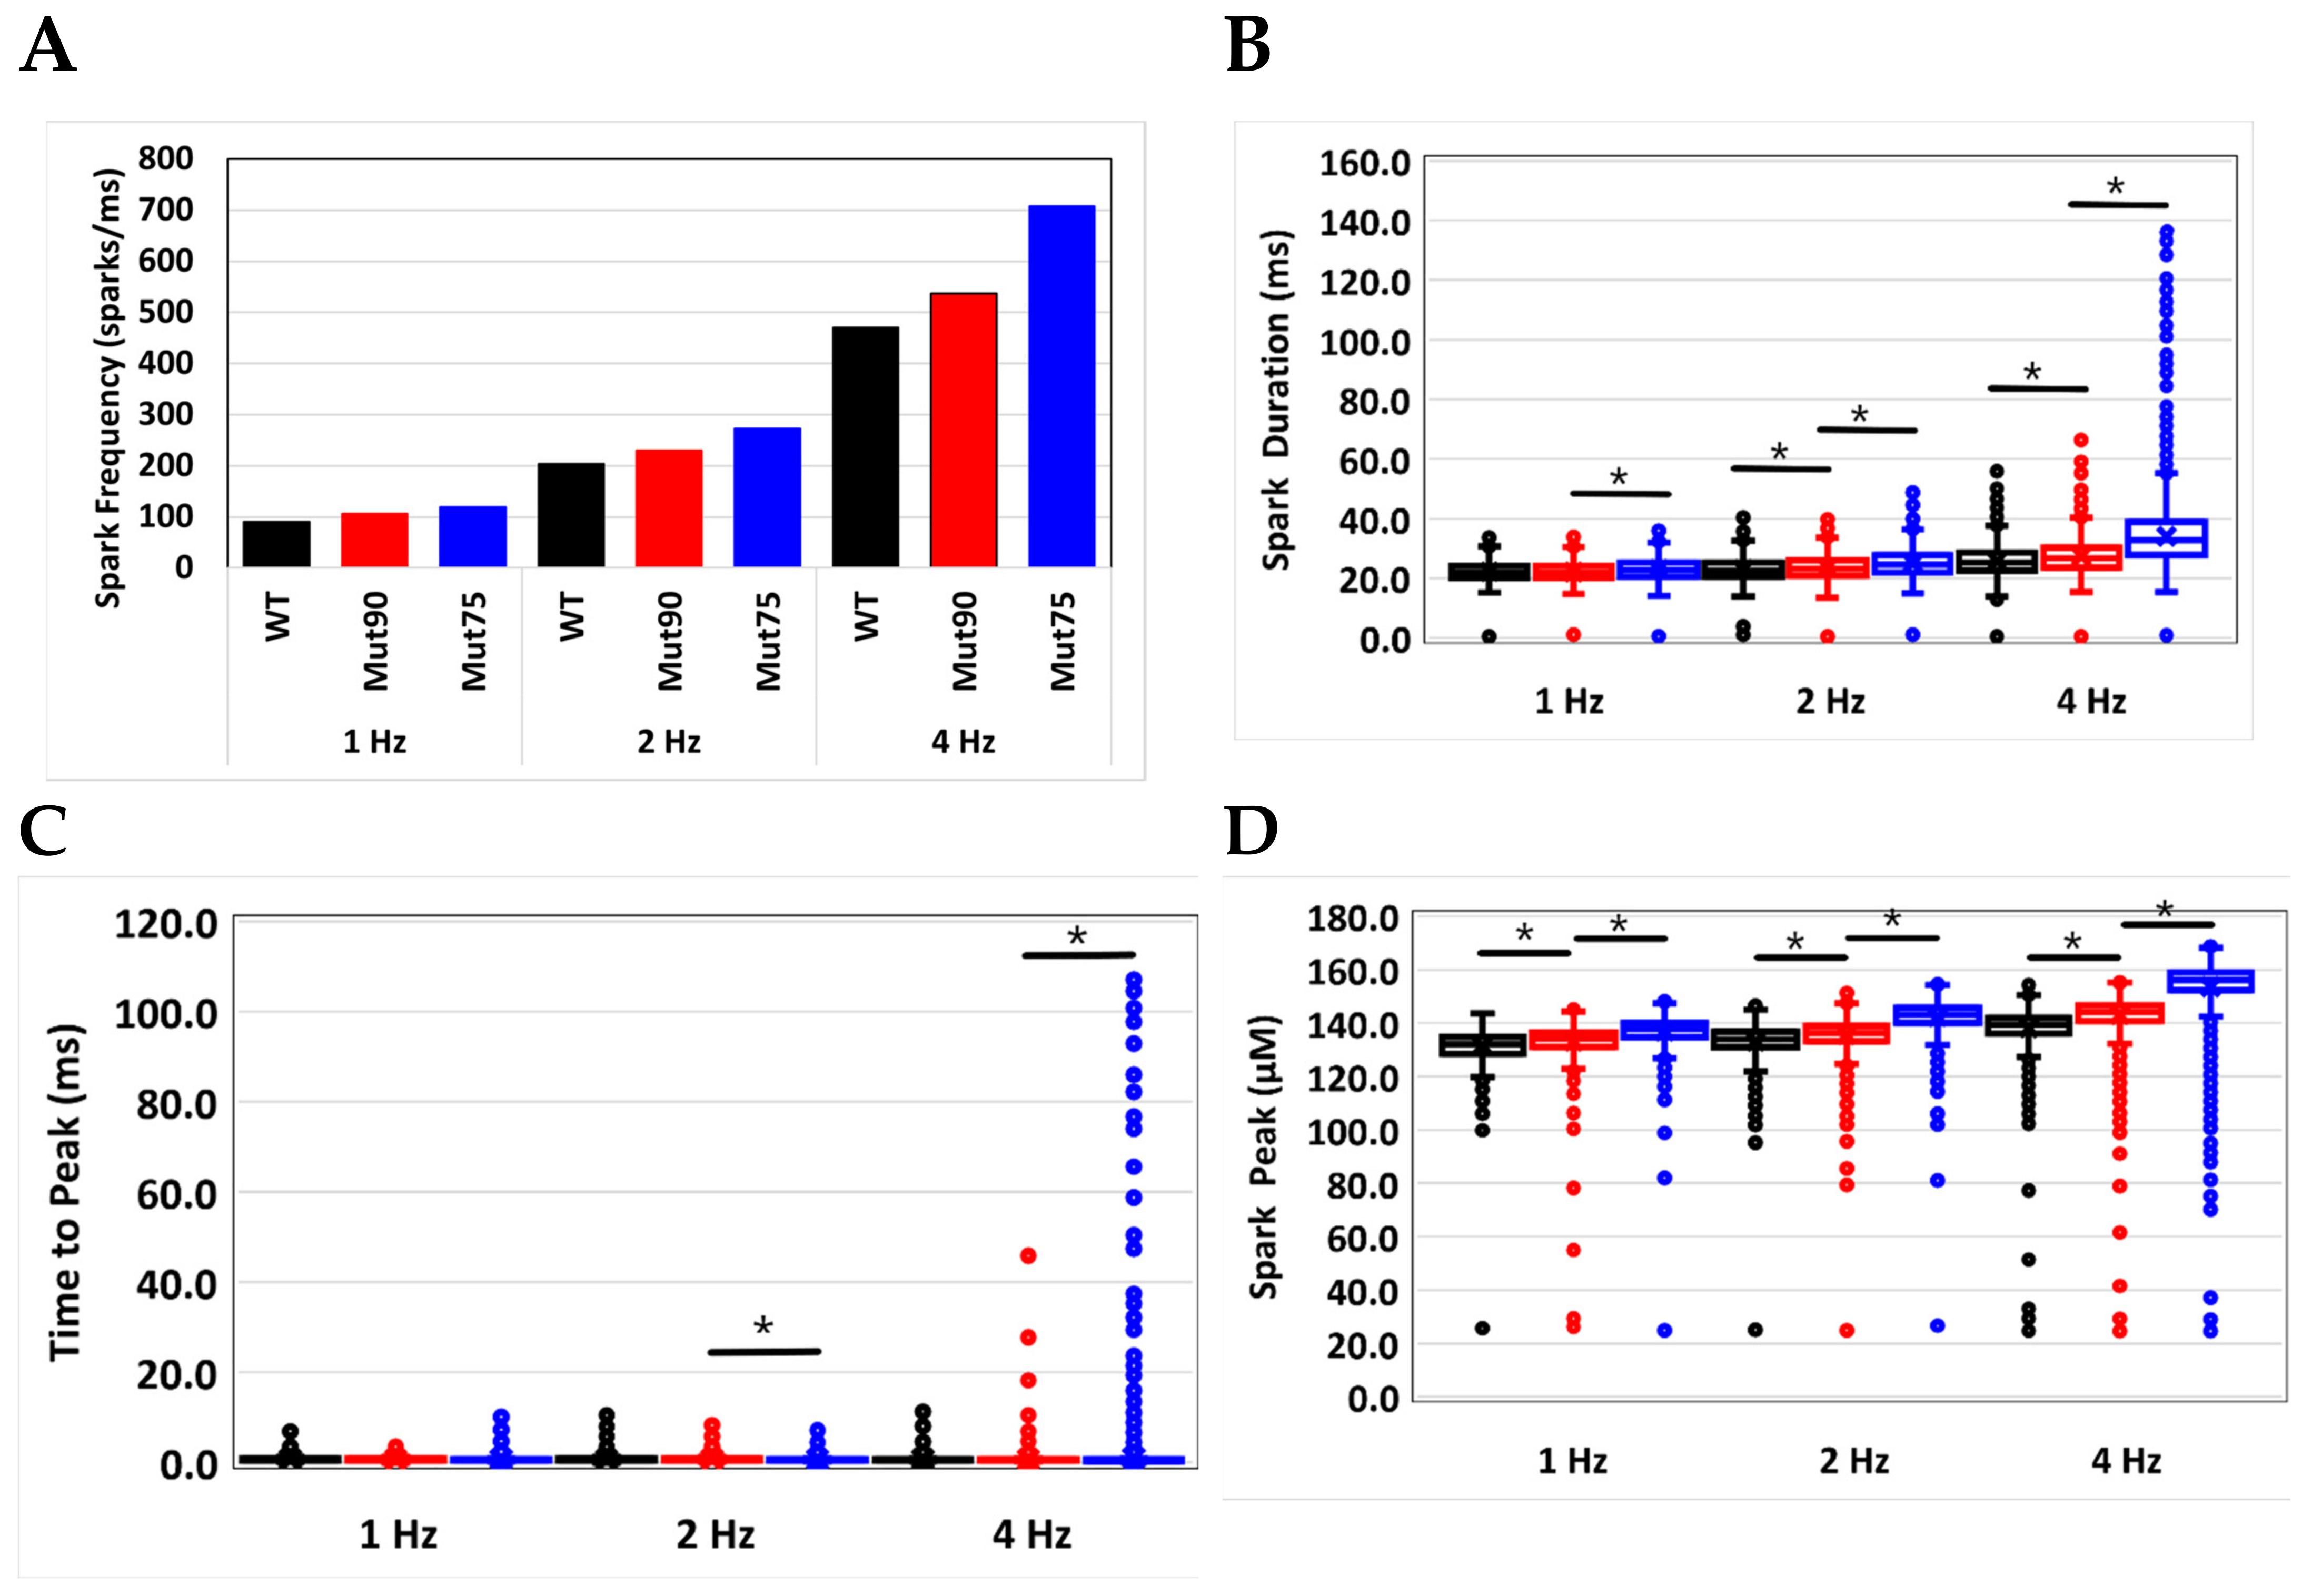
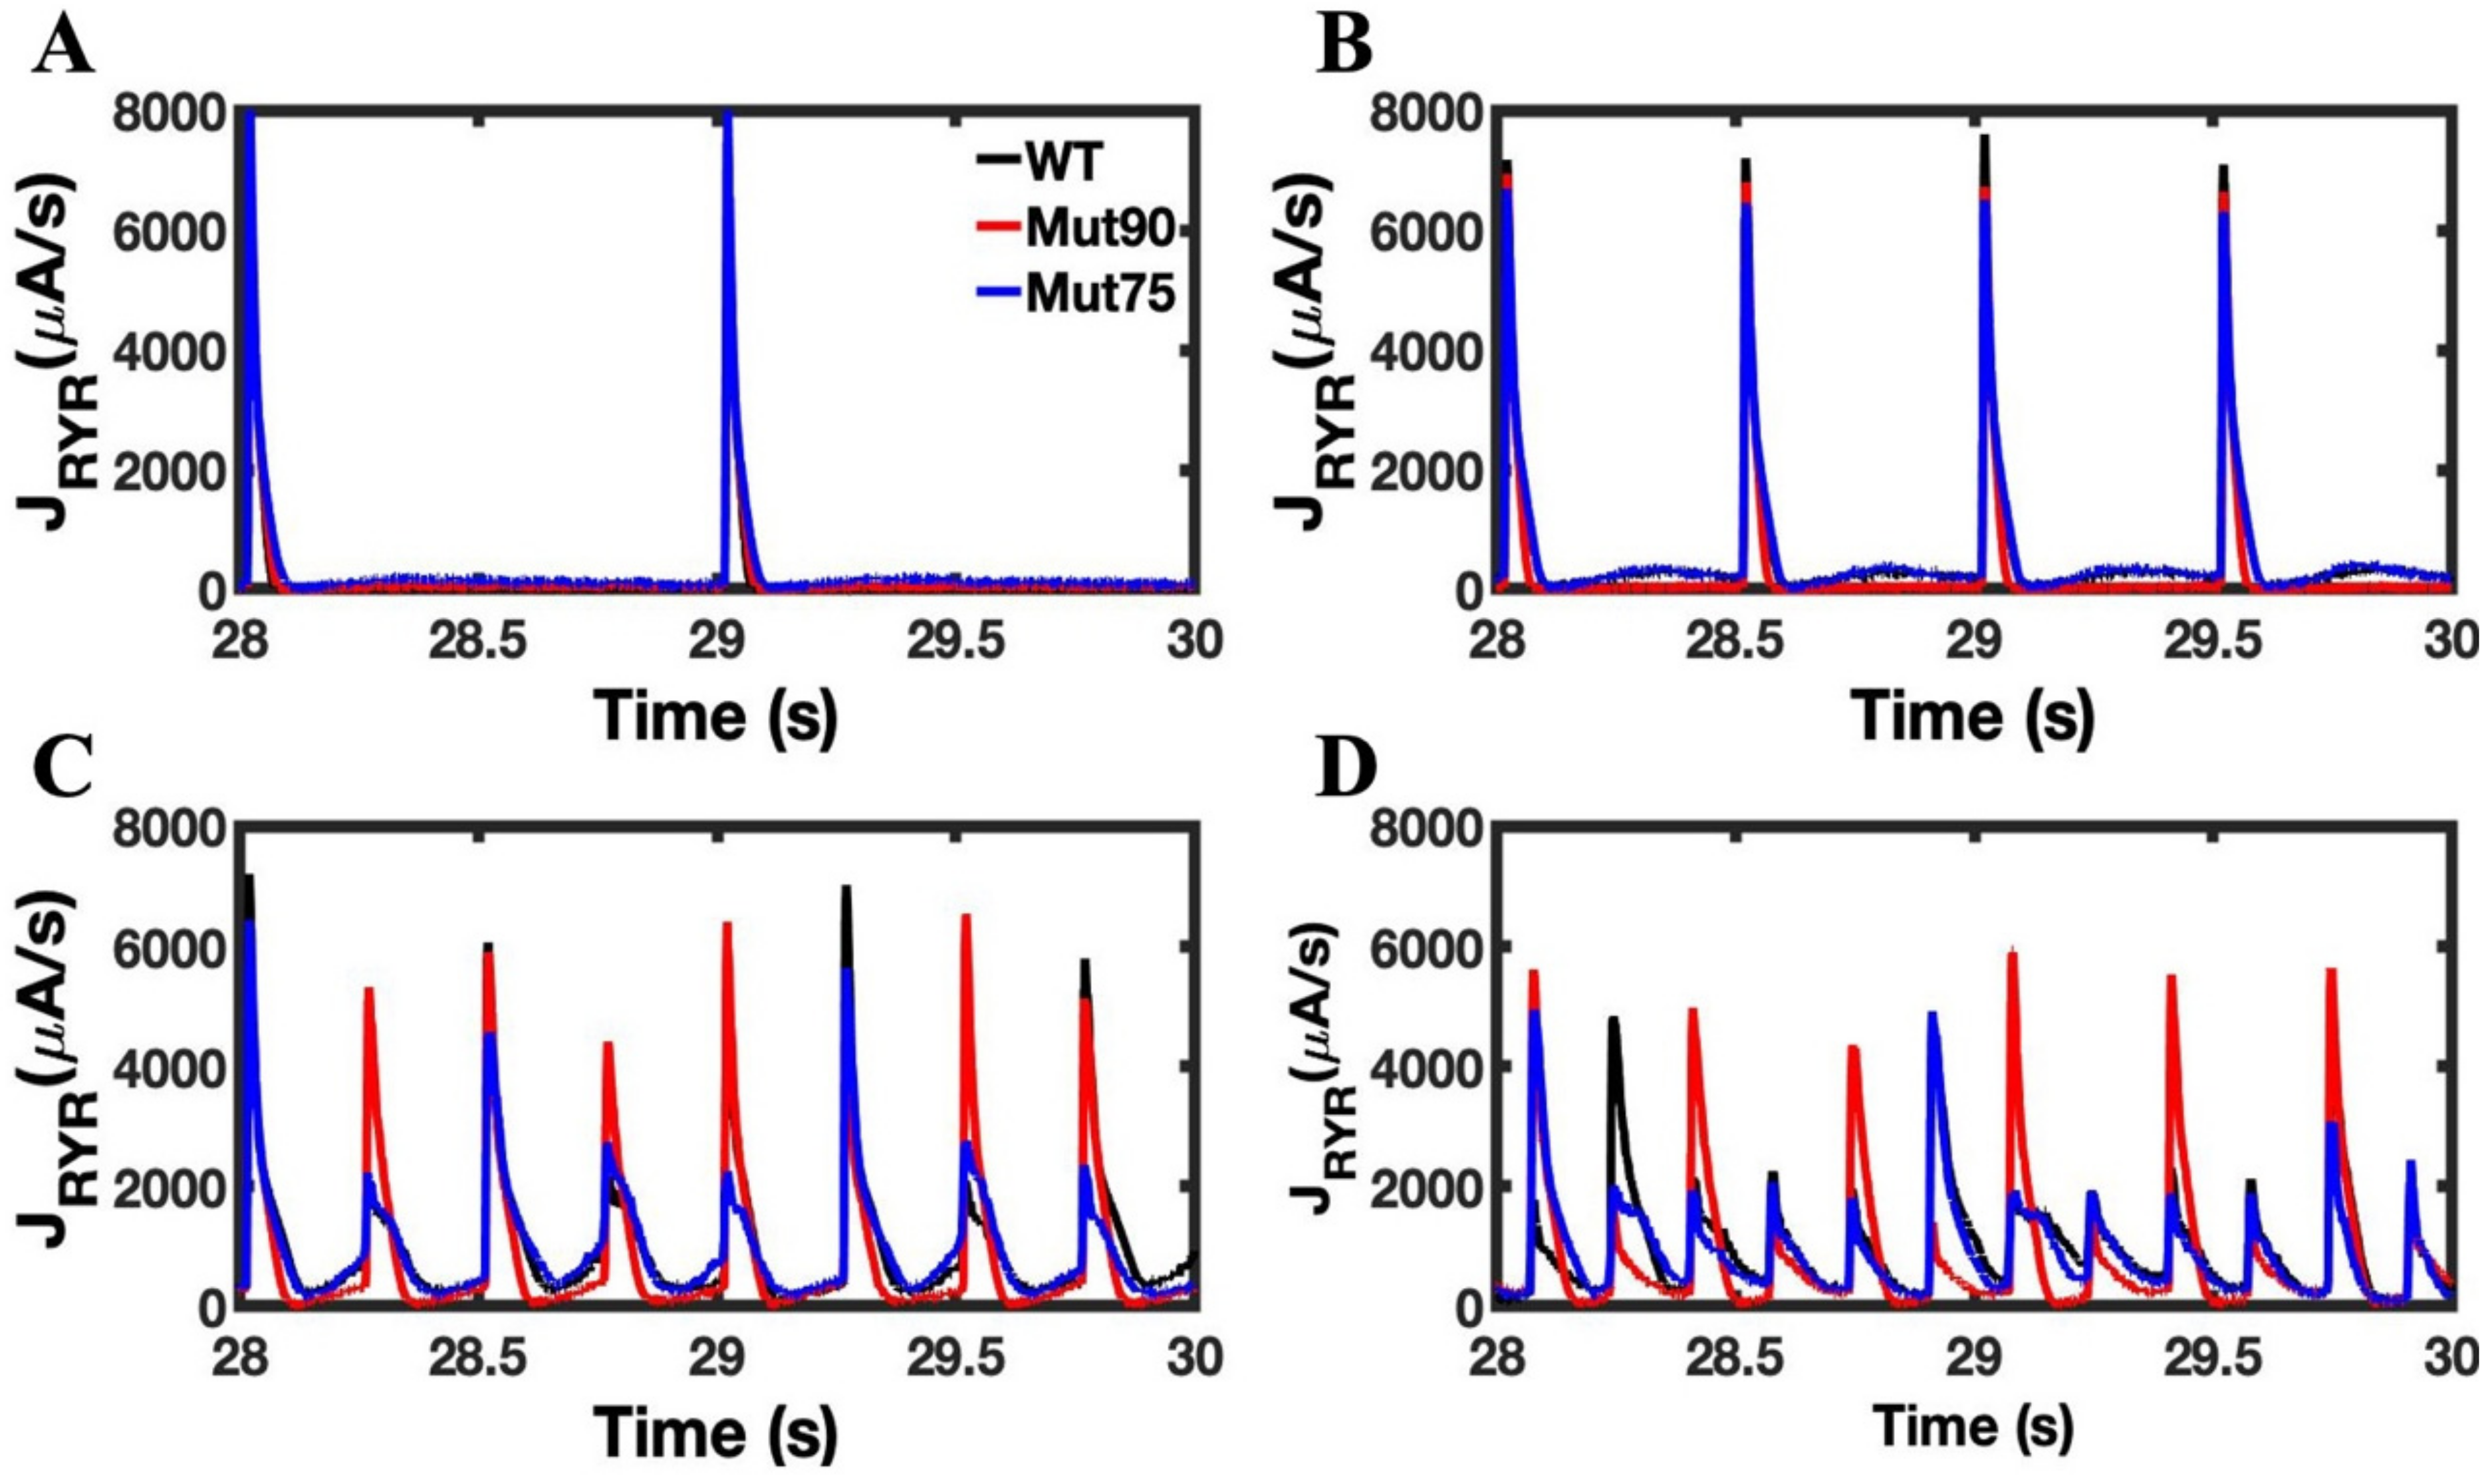
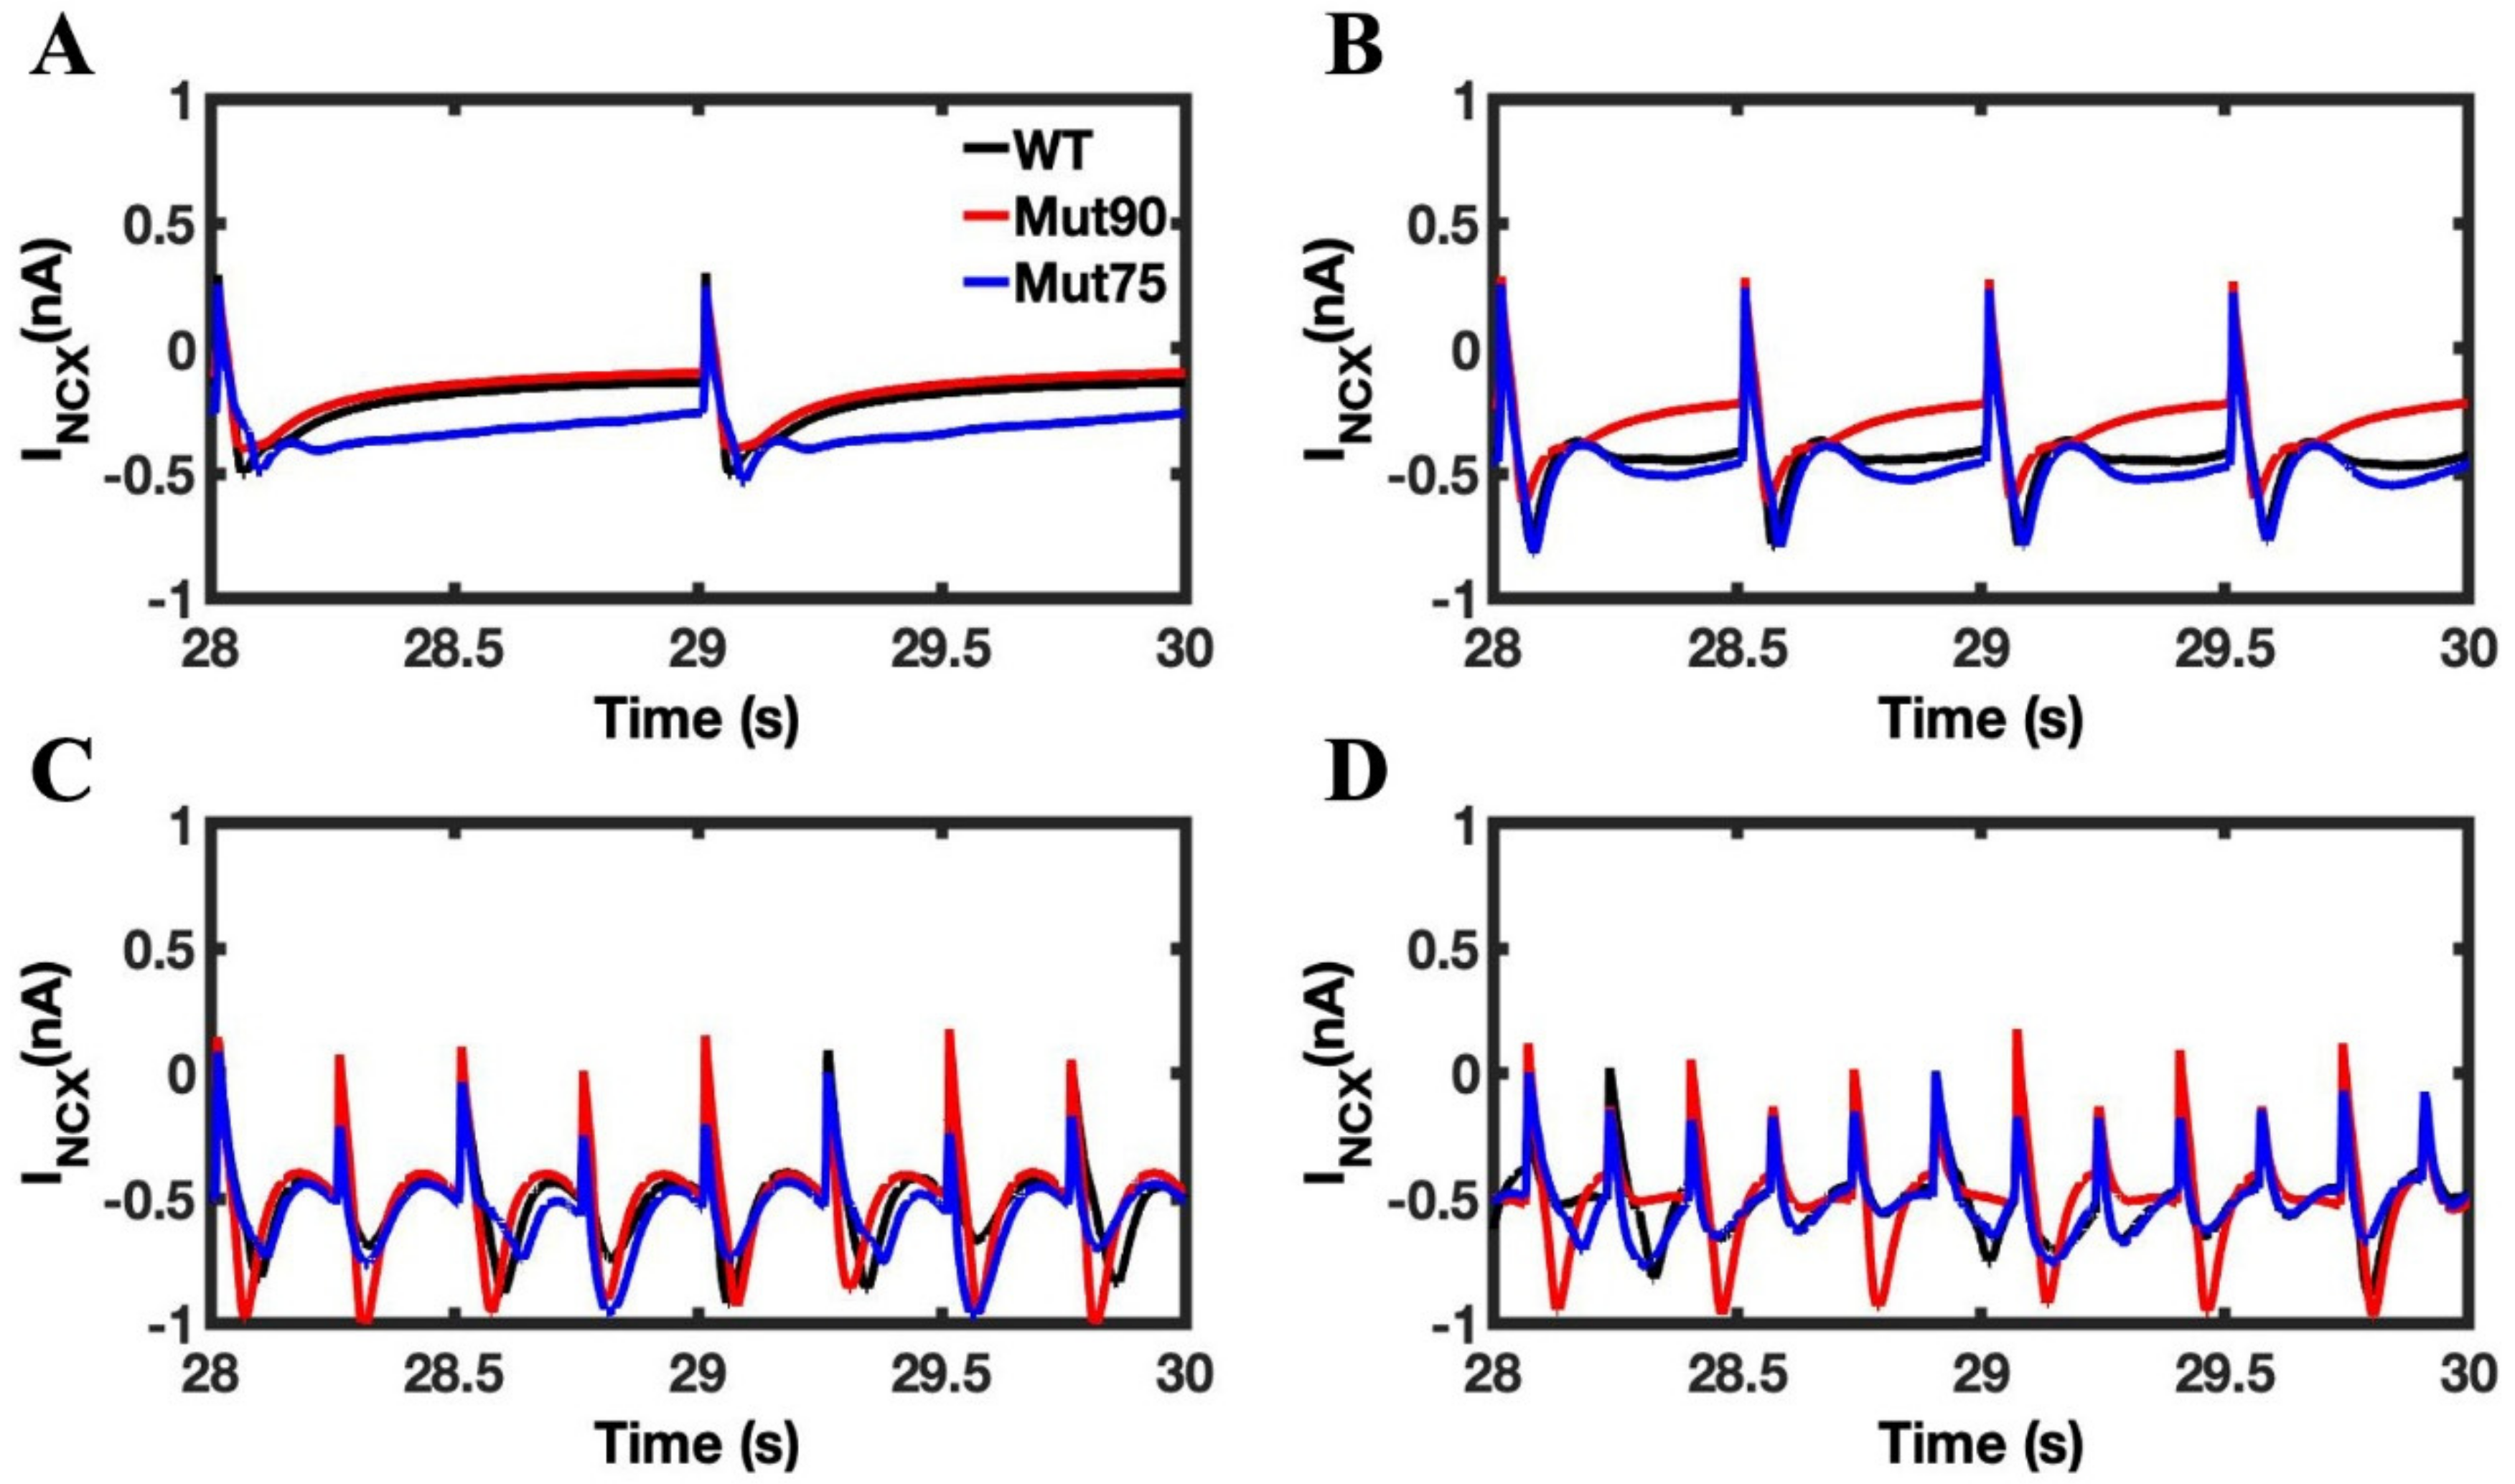
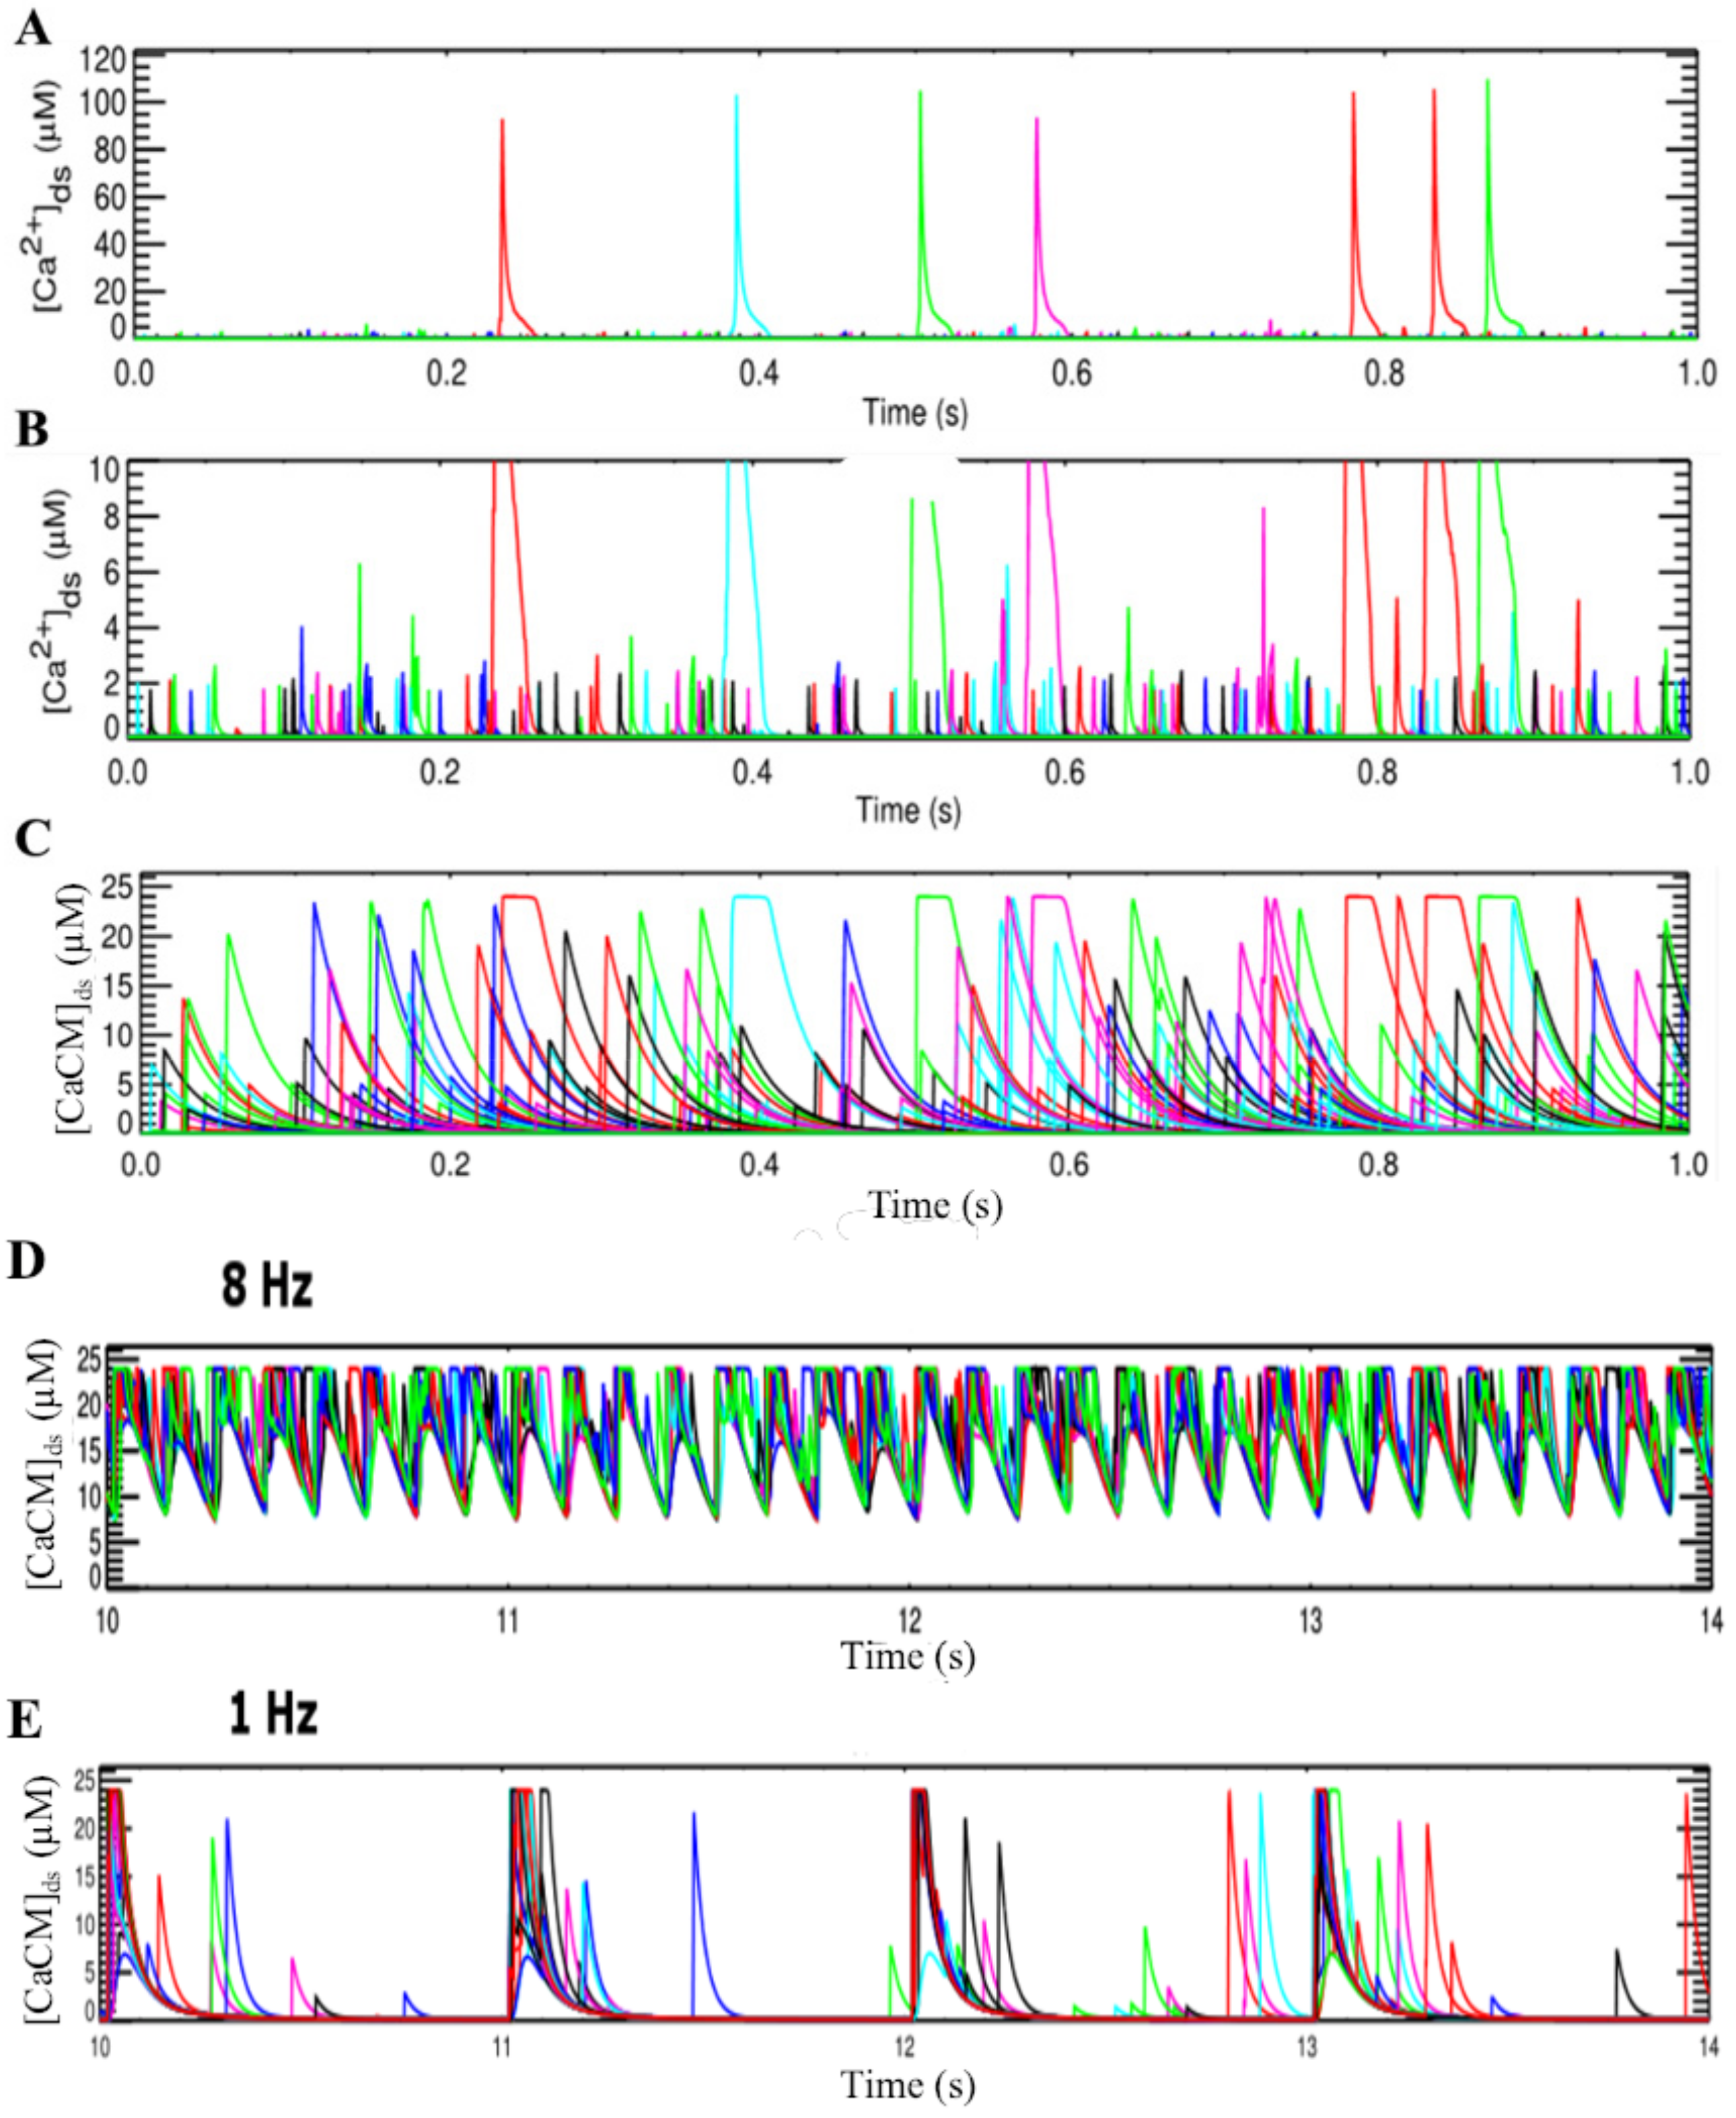
3.2. Changes in Ca2+ Spark Dynamics Underlie Arrhythmogenesis

Occasionally, the RYR2 channel will spontaneously transition to the open state to produce a non-coordinated release of Ca2+ from the CRU. Known as a Ca2+ spark, the Ca2+ release can trigger larger changes in the ionic homeostasis and promotes arrhythmia when occurring spontaneously at the wrong time, and the impact of the small Ca2+ release is compounded when sparks increase in frequency, duration, and rate. As seen in Figure 9A, diminished CaM inactivation leads to an increase in spark frequency over the wild-type model. Table 3 shows the mean values for the Ca2+ spark properties. The spark duration during pacing ranges between 89.6–707.9 sparks per ms which translates to up 100,000’s of Ca2+ sparks per second. With such a large sample size the standard deviation will be small and the difference of the means will show statistical significance [48]. For example, with even a 1% difference in means (with mean = 200) and the standard deviation equal to the mean, the sample size would simply need to be ~160,000 to achieve statistical significance at the p < 0.001 level. Hence, statistical significance is not shown. At 4 Hz the average Ca2+ spark duration is increased significantly with the mutants and increases pacing frequency (Figure 9B). The spread of the spark durations increases at 4 Hz when arrhythmia occurs consistent with experiments and other simulation studies. The simulations also predict a delayed average time to peak with increasing frequency and severity of mutation (Figure 9C). Similar to spark duration the dispersion of the time to peak increases under arrhythmic conditions. The average peak spark magnitude increases with the severity of CDI disruption for each pacing frequency (Figure 9D) and more outliers are observed under arrhythmic conditions. Pacing at 1 Hz produces a greater average spark duration for the wild-type myocyte over the mutant models. As the rate of pacing increases, the severity of the mutations causes increase dispersion of Ca2+ spark properties. When coupled with the increased spark frequency of the mutant myocytes, the total spontaneous Ca2+ release could make significant contributions to developing an arrhythmia. Rat ventricular myocytes harboring CaM mutants showed a decreased loading of the SR produced by an increased spark rate [32]. Since the cells were not undergoing pacing CICR, the increased spark rate is attributed to altered CaM binding to the RYR2 channels. Since CaM interactions with RYR2 was not modeled in the current simulations, the increase in calcium sparks caused by diminished CDI further increases the potential for EC coupling disruption.

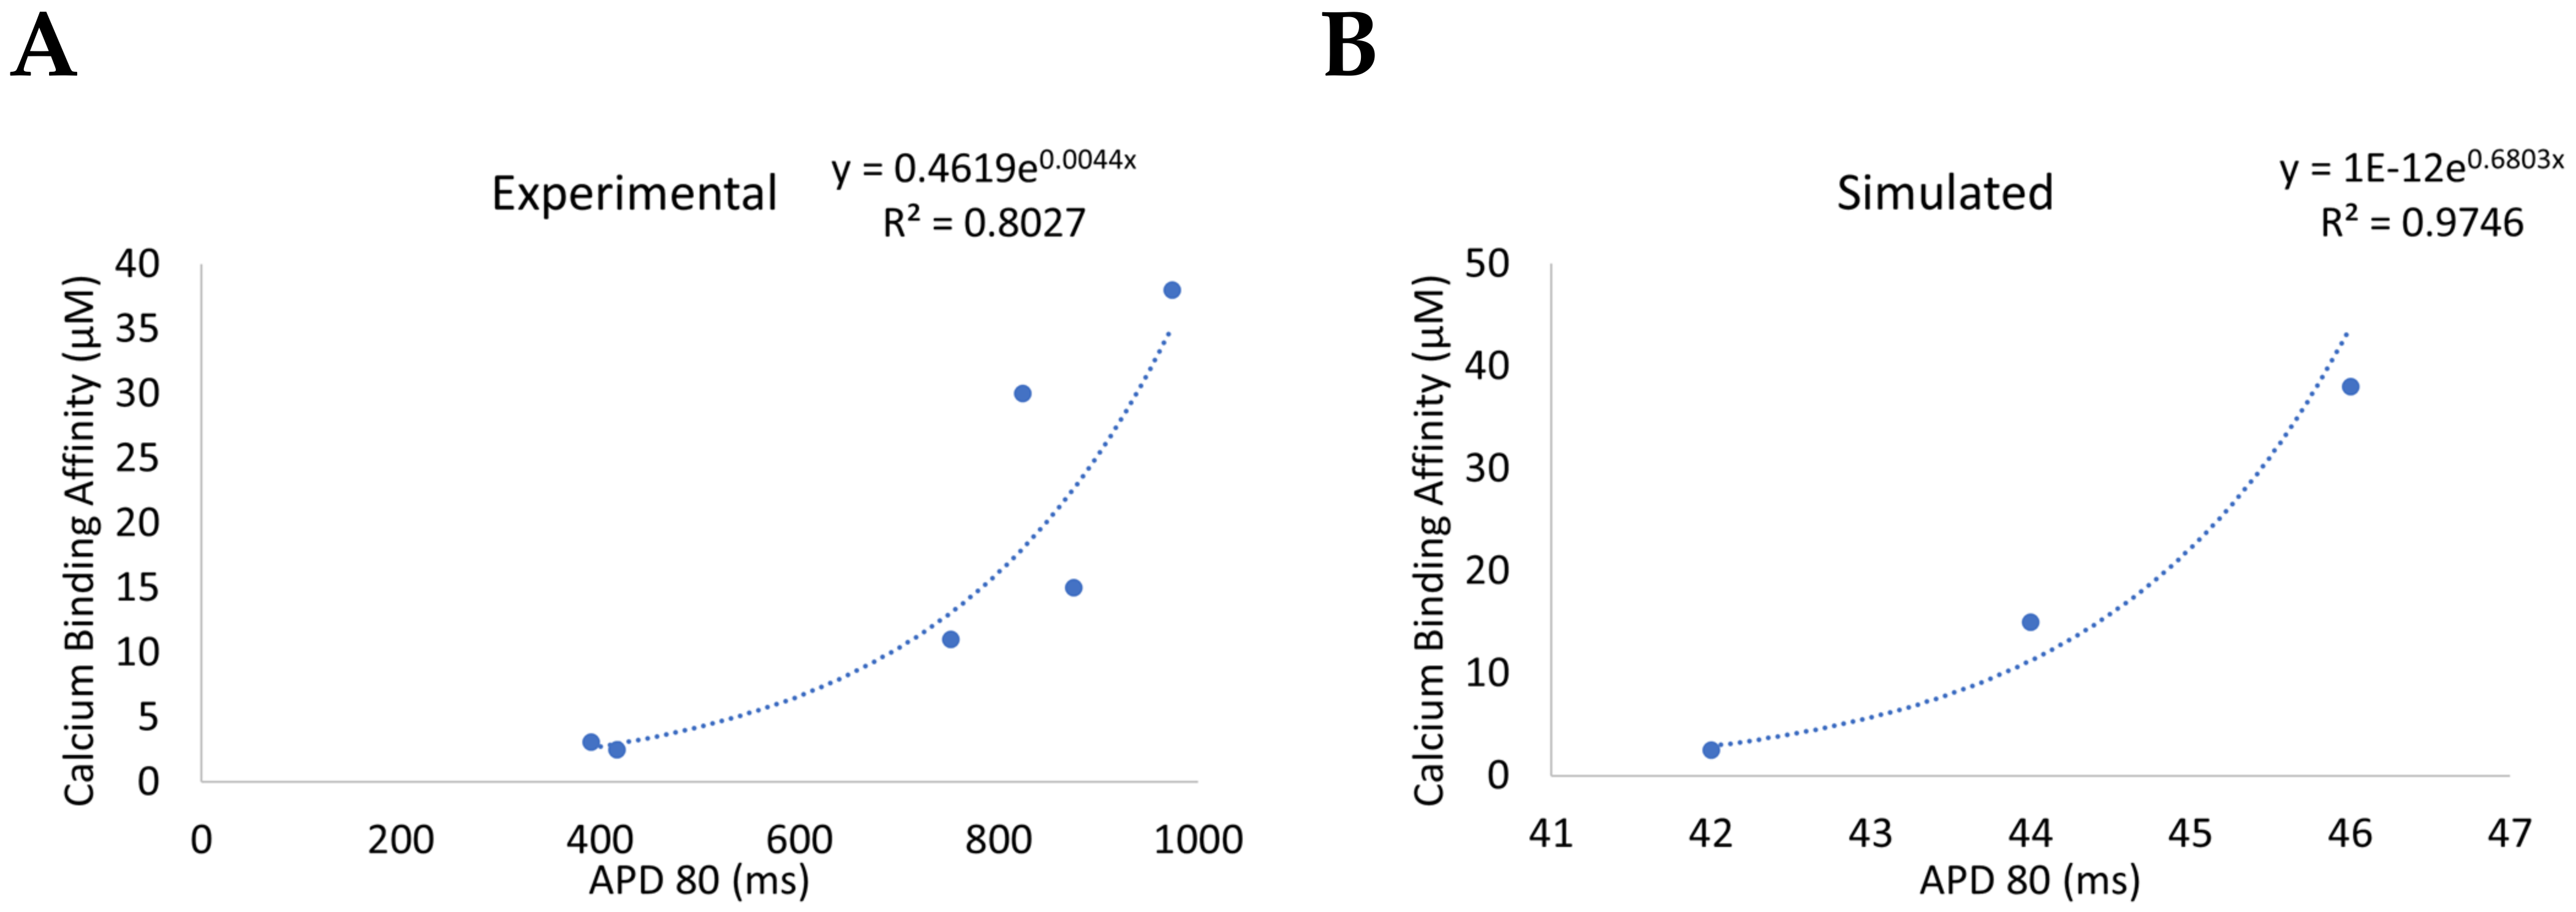
3.3. Beta-Adrenergic Stimulation Potentiates Ca2+ Overload in Myocytes with Reduced CDI

Beta-adrenergic stimulation induces functional changes in the cardiac myocyte in response to stress or exercise. Under normal conditions, the increase in calcium flux through the LCC and SERCA allow the cardiac myocyte to cope with the increased demands of higher frequency pacing. The results for the beta-adrenergic simulations are shown in Figure 9, Figure 10 and Figure 11, where the deleterious impact of diminished CDI is clearly shown by the disruption to both calcium dynamics in the myoplasm (Figure 10) and in the NSR (Figure 11) and the action potential (Figure 12) when pacing is applied. The increased flow of calcium through the LCC in response to beta-adrenergic stimulation is enhanced by the impact of the diminished CDI. In response to pacing, the exaggeration leads to the development of an arrhythmia, where the regular cyclic peak in cellular calcium concentration is lost.
The other impact of beta-adrenergic stimulation is to increase the rate calcium is loaded into the SR through the SERCA pumps. In the more severe of the CDI mutants, the increased loading in the 2 Hz pacing results in the NSR never depleting during CICR. The increased calcium concertation increases the open probability of the RYR2 channels and underlies the increase in APD seen in Figure 11. Even in the less severe mutant, 4 and 6 Hz pacing induces arrhythmia and causes instability in the NSR calcium dynamics.
In the wild-type simulations of beta-adrenergic stimulated cardiac myocytes, the calcium concentrations in the myoplasm (Figure 10D) and the NSR (Figure 11D) reach similar levels as seen in the mutant simulations. However, instead of devolving into arrhythmia, the wild-type simulations are able to balance the increased calcium load to maintain depolarization during the action potential (Figure 12D).
While the magnitude of the action potential is diminished in the 6 Hz wild-type simulation, the membrane still depolarizes. Conversely, both mutant simulations produce arrhythmic behavior in the 6 Hz pacing of beta-adrenergic cardiac myocytes, developing into a phenotypic state of period-doubling (alternans) characteristic of Ca2+ overload in CPVT4. As seen in Figure 10D, Figure 11D and Figure 12D, EC coupling also breaks down during 2 Hz pacing due to the increased NSR calcium loading in the more severe mutant. The increased calcium concentration increases the refilling of the jSR and increases the open probability of the RYR2 channels. The mut75 action potential is elongated to produce a LQT14 phenotype while the mut90 action potential only deviates slightly from the wild type. The model demonstrates how different emergent phenotypes can arise out from a single underlying deficiency in molecular function.
An advantage of the computational model is that it allows the underlying mechanism of the arrhythmia to be probed in detail. The calcium current through the LCC was totaled across all 20,000 CRUs to produce the plots in Figure 13. The importance of CDI on controlling the initial flow of calcium during in seen in the failure of mutant simulations to maintain a tight window of current flow into the cell. In the simulations without beta adrenergic stimulation, there is virtually no difference in the current through the LCC. However, during beta-adrenergic stimulation, the diminished inactivation increases the length of time calcium enters the cell. This effect is enhanced by pacing, but in all simulations LCC inactivation is relatively rapid occurs long before the onset of the following action potential. Still, the small increase in the influx alters the dynamics of CICR by increasing the open probability of RYR2 channels on the SR membrane.
The increase in open probability of the RYR2 channels causes a small increase in the Ca2+ flux from the SR. The total calcium flux through all the RYR2 channels in the 20,000 independent CRUs is provided in Figure 14. In the cardiac myocyte simulations without beta adrenergic stimulation, the magnitude of the Ca2+ release is increased in the CDI mutants while the duration of release remains the same. The increased window of calcium current through the LCC initiates CICR in an increased number of RYR2 channels but does not impact the transition to a closed state. However, when beta-adrenergic stimulation is applied the increased loading in the SR elongates the Ca2+ release into the dyad subspace. During pacing, these small changes accumulate and ultimately interrupt the myocyte’s ability to regulate the transmembrane voltage through the Na+-Ca2+ exchanger.
The current through the Na+-Ca2+ exchanger in the cell membrane is shown in Figure 15. During the action potential, the normal flow of calcium out of the cell in reversed to export the large influx of sodium and is shown by positive peak in Na+-Ca2+ exchanger current. This reversal in flow is necessary to restore the action potential in the cell membrane. However, the accumulated impact of the increased CICR drives up the calcium concentration in the myoplasm and reduces gradient responsible for driving the ion the exchange. As seen in the 1 Hz simulations, the impact of the CDI mutation on is to prolong the time restore the Na+-Ca2+ exchanger current to the diastolic level. In the beta-adrenergic stimulated myocytes, the increase is magnified, and the effect accumulates in the more severe mutant and is accelerated by pacing. Once the cumulative impact reaches a threshold, the cell is no longer able to reverse current in response to the action potential. The ability to maintain the transmembrane potential is lost and the rhythmic pacing of the cell deteriorates into arrhythmia.
The overall result of a small change to the rate of CDI leads to the rapid formation of arrhythmia, as the high cellular concentration of calcium interrupts the ability to regulate the transmembrane voltage through the Na+-Ca2+ exchanger. Once the calcium concentration becomes too large, the channels are not able to efficiently reverse direction to export sodium. The mechanism feeds into itself, as the increased flow through an individual CRU promotes larger releases through loading of calcium into the NSR, until the cell reaches a state where the regulatory mechanism is overcome. Arrhythmias associated with CPVT4 typically have altered RYR2 function but can also occur by diminished function of other channels which influence the concentration of ions in the cardiac myocyte. The movement of calcium through the cellular compartments creates an interconnected relationship between channel dynamics and underscored the difficulty in identifying the mechanism associated with a disease phenotype only detectable at the tissue level.

4. Discussion

The simulation study presented here explored how mutations to N98S and D96V that result in reduced CDI corresponding can lead to abnormal EC coupling and therefore arrhythmia. As the CDI was reduced by a factor of 0.9 (N98S) and 0.75 (D96V) in the variants the action potential duration increased a small amount. This is consistent with clinical findings that the QT prolongation in patients with the N98S variant is small [4]. and Ca2+ dynamics result in a normal wave train during 1 Hz, 2 Hz, and 4 Hz pacing rates. A pacing rate of 1 Hz and 2 Hz are often used in experimental studies and a 4 Hz pacing rate is the physiological heart rate of rat. Rapid pacing at 6 Hz resulted in abnormal Ca2+ dynamics and action potential dynamics in the form of alternans which is precipitated by high level of Ca2+ in the ventricular myocyte.
Under beta adrenergic stimulation, pacing at 1 Hz and 2 Hz showed a steady train of Ca2+ transients and action potentials with prolonged duration in the mutant simulations. Pacing at 4 Hz under beta adrenergic stimulation produced alternans in both the Ca2+ transient and action potentials. Pacing at 6 Hz, resulted in a very irregular train of action potentials and the underlying Ca2+ dynamics. Under the rapid pacing simulations Ca2+ levels were significantly elevated in the SR and myoplasm consistent with Ca2+ overload. For comparison, in a mouse knock-in model the N98S mutant ventricular myocytes showed that beta adrenergic stimulation induced a delay in repolarization and increase L-type Ca2+ current in optical and electrical measurement of membrane potential in isolated hearts compared to control [5].
Underlying the arrhythmic behavior was an increase in Ca2+ spark frequency, amplitude, and duration. These findings are supported by other studies. Wescott and co-workers also observed in increase in Ca2+ spark duration in their simulations of CPVT when arrhythmia was observed [49]. In experiments flecainide reduced spark amplitude, decreased Ca2+ wave incidence, and suppressed CPVT symptoms in mice and humans [50,51]. Macquaide and co-workers observed in a joint experimental and modeling study that in sheep cardiac myocytes experiencing atrial fibrillation, myocytes had >50% higher spark frequency with increased spark time to peak and duration [52]. This increase in Ca2 spark frequency has also been observed in atrial fibrillation in human atrial myocytes by Hove-Madsen and co-workers [53].
Calmodulin variants have been associated with long QT syndrome 14 (LQT14), catecholaminergic polymorphic ventricular tachycardia type 4 (CPVT4), and idiopathic ventricular fibrillation (IVF), however, arrhythmogenesis has been attributed mainly to either prolonged repolarization (LQT14 phenotype) or increase calcium release from the SR (CPVT phenotype) [2,54]. The recent association of mutations in CaM with these two arrhythmic cardiac diseases raises questions about how complex, emergent disease states are classified [1]. The mutations that are strongly associated with LQT14 strongly disrupt the CaM-dependent inactivation of LCC and are easy to diagnose using an ECG. However, other mutations in structurally similar locations in CaM manifest as the harder to detect CPVT4. Since CaM interacts with a range of other proteins in the cell such as the Na+ channel and SK channel, even those involved in regulating EC coupling and CICR, it’s possible that some of the CaM mutants’ function normally in LCC inactivation and the CPVT4 state arises through other interactions [55,56,57]. Experimental studies have shown that the LQT14 phenotype does not depend on CaM interactions with the Na+ channel [8].
The prolonged action potential of guinea-pig ventricular myocytes expressing mutant CaM associated with LQT14 shown in Figure 1 (in Reference [31]) displayed a much more severe impact on the action potential and cellular calcium. The impacts of those mutations on the CaM inactivation of LCC would clearly alter the electrical signature on the tissue scale and make the increased chances for arrhythmia easily identifiable. In fact, and experimental optical mapping study in heart by Němec and co-workers suggested that the abnormal Ca2+ dynamics associated with CPVT, can also be associated with the T-wave lability found in LQT [58]. The underly defect in the Ca2+ dynamics is the Ca2+ overload in the myocyte for both LQT and CPVT4 [59,60]. For less severe CaM mutations, the deviation from the wild-type action potential would be difficult to detect using available diagnostic methods, and a mutation which only fractionally decreases the CaM-dependent LCC transition to a closed state would avoid detection in the unstimulated heart. While the phenotypic impact of less severe CaM mutations is not as easily detectable, the altered dynamics of the cardiac myocyte increase the susceptibility to arrhythmia.
The action potential duration (APD80) and the Ca2+ binding affinity changes for the different CaM variants has been measured experimentally by others (see [1,31,61]). Figure 16A shows the relationship between APD80 (in experiments on Guinea pig ventricular myocytes paced at 0.5 Hz) and KD is a monotonically increasing non-linear function with a high correlation coefficient. The simulations in Figure 16B using a rat ventricular myocyte model from this current study paced at 1 Hz shows a similar monotonically increasing trend where calcium binding affinity is approximated by the inverse fractional change. The binding affinities were estimated using the assumption of rapid equilibrium and that subspace calcium remains elevated at 10 µM. In this work, changes to the rate constant were implemented and specific variants were bit simulated.
The simulations clarify that Ca2+ overload is the mechanism behind the overlapping phenotypes of the arrhythmia and provide a way of differentiating how they arise. The simulations show that even a small change to the rate of CaM regulated inactivation of the LCC promotes an arrhythmia prone state. Increased calcium loading in the bulk myoplasm, and SR is exaggerated through pacing, as is the spark rate and intensity. The altered ionic homeostasis increases the likelihood of disrupting the EC coupling cycle by a mechanism similar to CPVT4, despite the originating from disrupted function associated with LQT14. A greater understanding of conditions which give rise to complex genetic diseases such as these in enhanced through modeling the emergent impact of altering individual functional interactions.
In the cardiac ventricular myocyte CDI is a complex phenomenon conferred by the interactions of CaM with Ca2+ and the L-type Ca2+ channel. The two lobes of CaM each have two Ca2+ binding sites and both of the are involved in CDI [44]. CaM variants associated with LQT14 affect Ca2+ binding sites in both lobes. The current model does not differentiate between the contributions of the two lobes and their combined contributions to CDI. This has been left for future studies. The experimental literature gives a wide range of values of the Ca2+ binding affinity of CaM ranging from 2.5 to 150 µM when interacting with the L-type Ca2+ channel and from 0.03 to 4.0 µM when interacting with the RyR2 [6,8,26,27,28,29,30,31,32,33]. CaM seems to respond to the high Ca2+ inside the CRU during a Ca2+ spark (>100 µM) as well as the bulk myoplasmic Ca2+ levels seen in the myoplasm (1 µM). The varied values observed experimentally might all be valid with the value depending on the experimental (or cellular) environment of CaM. Understanding these complex issues will require integration of new experimental and modeling studies.
Previous computational modeling studies have studied the mechanisms LQT14. Tadross et al. developed a model of Ca2+-dependent inactivation by calmodulin that demonstrated the binding and unbinding of calmodulin from the L-type Ca2+ channel as a mechanism of complex decoding of the Ca2+ signal [62]. Lai and co-workers created at two-state allosteric model of calmodulin and it’s binding to different molecular targets [63]. The present study did not go into such detail and instead considered the consequences of reduced Ca2+-dependent activation on excitation–contraction coupling, Limpitikul et al. developed a bi-lobal model of Ca2+-dependent inactivation in the cardiac ventricular myocyte of the L-type channel based on experimental data to characterize the effects of the D130G variant [64]. They showed the resulting action potential prolongation resulting from this variant. While their methodology provides a way to simulate other variants, it does not explain the mixed phenotype observed from certain variants as explored by this modeling study. Numerous other computational studies have studied LQT resulting from variants in other ion channels with mechanism of the action prolongation differs from this study [65,66,67,68]. For example, Kernik and co-workers studied genetic variants of KCNQ1, Bai and co-workers studied the CACNA1C R858H variant (LQT8), and Sadrieh and co-workers studied variants in IKr (LQT2). Grandi and co-workers studied the compound mutations involving the slowly and rapidly activating delayed-rectifier potassium currents (IKs and IKr) and the fast sodium current (INa).

5. Conclusions

Our computational model of the rat ventricular myocyte demonstrates the changes in the features of excitation–contraction coupling in myocytes with wild-type and variant calmodulin. With variants that are attributed to causing LQT14, the myocytes have increase action potential duration and large Ca2+ transients due to loss of Ca2+-dependent inactivation. These changes are potentiated with beta adrenergic stimulation and are accompanied by the development of Ca2+ overload and alternans which is seen during CPVT4. The increased RyR opening due to the increased myocyte Ca2+ contributes to this phenotype. Taken together, this confluence of phenotypic features can cause the LQT14 variants causing a change in Ca2+-dependent inactivation to appear as if they are causing a CPVT4 phenotype.

Supplementary Materials

The following supporting information can be downloaded at https://www.mdpi.com/article/10.3390/biom13010072/s1, File S1: Model code.

Author Contributions

Conceptualization, M.D.M., W.J.L. and M.S.J.; methodology, M.D.M., A.U. and M.S.J.; software, M.D.M. and A.U.; validation, M.D.M., A.U. and M.S.J.; formal analysis, M.D.M. investigation, M.D.M.; resources, M.S.J.; data curation, M.D.M.; writing—original draft preparation, M.D.M.; writing—review and editing, M.D.M., A.U. and M.S.J.; visualization, M.D.M. and A.U.; supervision, M.S.J.; project administration, M.S.J.; funding acquisition, M.S.J. and W.J.L. All authors have read and agreed to the published version of the manuscript.

Funding

This research was funded by National Institutes of Health (NIH) grant numbers 5R01HL105239 (M.S.J. & W.J.L.) and 5U01HL116321 (M.S.J. & W.J.L).

Institutional Review Board Statement

Not applicable.

Informed Consent Statement

Not applicable.

Data Availability Statement

The rat ventricular myocyte model was recently published, and the parameters described below are for the normal and HF setting. Please check [34,69] for the detail and description of the parameters of the model.

Acknowledgments

The authors thank Tsekwi Simoyi for his contributions to generating Figure 1.

Conflicts of Interest

The authors declare no conflict of interest.

Appendix A

Figure A1. Calcium in the subspaces during (A) Ca2+ sparks and (B) Ca2+ quarks, (C) The amount of Ca2+:CaM complex in the subspace during spontaneous Ca2+ sparks and quarks at rest. The amount of Ca2+:CaM complex in the subspace is greater during (D) pacing at 8 Hz compared to (E) pacing at 1 Hz pacing leading to increased Ca-dependent inactivation of the L-type channel.
Biomolecules 13 00072 g0a1

References

  1. Chazin, W.J.; Johnson, C.N. Calmodulin Mutations Associated with Heart Arrhythmia: A Status Report. Int. J. Mol. Sci. 2020, 21, 1418. [Google Scholar] [CrossRef] [Green Version]
  2. Crotti, L.; Spazzolini, C.; Tester, D.J.; Ghidoni, A.; Baruteau, A.-E.; Beckmann, B.-M.; Behr, E.R.; Bennett, J.S.; Bezzina, C.R.; Bhuiyan, Z.A.; et al. Calmodulin mutations and life-threatening cardiac arrhythmias: Insights from the International Calmodulinopathy Registry. Eur. Heart J. 2019, 40, 2964–2975. [Google Scholar] [CrossRef] [PubMed]
  3. Jensen, H.H.; Brohus, M.; Nyegaard, M.; Overgaard, M.T. Human Calmodulin Mutations. Front. Mol. Neurosci. 2018, 11, 396. [Google Scholar] [CrossRef] [PubMed] [Green Version]
  4. Jiménez-Jáimez, J.; Doza, J.P.; Ortega, Á.; Macías-Ruiz, R.; Perin, F.; del Rey, M.M.R.-V.; Ortiz-Genga, M.; Monserrat, L.; Barriales-Villa, R.; Blanca, E.; et al. Calmodulin 2 Mutation N98S Is Associated with Unexplained Cardiac Arrest in Infants Due to Low Clinical Penetrance Electrical Disorders. PLoS ONE 2016, 11, e0153851. [Google Scholar] [CrossRef]
  5. Tsai, W.-C.; Guo, S.; Olaopa, M.A.; Field, L.J.; Yang, J.; Shen, C.; Chang, C.-P.; Chen, P.-S.; Rubart, M. Complex Arrhythmia Syndrome in a Knock-In Mouse Model Carrier of the N98S Calm1 Mutation. Circulation 2020, 142, 1937–1955. [Google Scholar] [CrossRef] [PubMed]
  6. Søndergaard, M.T.; Liu, Y.; Larsen, K.T.; Nani, A.; Tian, X.; Holt, C.; Wang, R.; Wimmer, R.; Van Petegem, F.; Fill, M.; et al. The Arrhythmogenic Calmodulin p.Phe142Leu Mutation Impairs C-domain Ca2+ Binding but Not Calmodulin-dependent Inhibition of the Cardiac Ryanodine Receptor. J. Biol. Chem. 2017, 292, 1385–1395. [Google Scholar] [CrossRef] [Green Version]
  7. Gomez-Hurtado, N.; Boczek, N.J.; Kryshtal, D.O.; Johnson, C.N.; Sun, J.; Nitu, F.R.; Cornea, R.L.; Chazin, W.J.; Calvert, M.L.; Tester, D.J.; et al. Novel CPVT-Associated Calmodulin Mutation in CALM3 (CALM3-A103V) Activates Arrhythmogenic Ca Waves and Sparks. Circ. Arrhythmia Electrophysiol. 2016, 9, e004161. [Google Scholar] [CrossRef] [Green Version]
  8. Yin, G.; Hassan, F.; Haroun, A.R.; Murphy, L.L.; Crotti, L.; Schwartz, P.J.; George, A.L.; Satin, J. Arrhythmogenic calmodulin mutations disrupt intracellular cardiomyocyte Ca2+ regulation by distinct mechanisms. J. Am. Heart Assoc. 2014, 3, e000996. [Google Scholar] [CrossRef] [Green Version]
  9. Brodland, G.W. How computational models can help unlock biological systems. Semin. Cell Dev. Biol. 2015, 47–48, 62–73. [Google Scholar] [CrossRef] [Green Version]
  10. Tuszynski, J.A.; Winter, P.; White, D.; Tseng, C.-Y.; Sahu, K.K.; Gentile, F.; Spasevska, I.; Omar, S.I.; Nayebi, N.; Churchill, C.D.M.; et al. Mathematical and computational modeling in biology at multiple scales. Theor. Biol. Med. Model. 2014, 11, 52. [Google Scholar] [CrossRef]
  11. Hoang-Trong, T.M.; Ullah, A.; Jafri, M.S. Calcium Sparks in the Heart: Dynamics and Regulation. Res. Rep. Biol. 2015, 6, 203–214. [Google Scholar] [CrossRef] [Green Version]
  12. Jafri, M.S. Models of excitation-contraction coupling in cardiac ventricular myocytes. Methods Mol. Biol. 2012, 910, 309–335. [Google Scholar] [CrossRef] [PubMed] [Green Version]
  13. Eisner, D.A.; Caldwell, J.L.; Kistamás, K.; Trafford, A.W. Calcium and Excitation-Contraction Coupling in the Heart. Circ. Res. 2017, 121, 181–195. [Google Scholar] [CrossRef] [PubMed]
  14. Cheng, H.; Lederer, W.J.J.; Cannell, M.B. Calcium Sparks: Elementary Events Underlying Excitation-Contraction Coupling in Heart Muscle. Science 1993, 262, 740–744. [Google Scholar] [CrossRef]
  15. Stuyvers, B.D.; Boyden, P.A.; Keurs, H.E.D.J. Calcium Waves. Physiological Relevance in Cardiac Function. Circ. Res. 2000, 86, 1016–1018. [Google Scholar] [CrossRef] [Green Version]
  16. Cheng, H.; Lederer, M.R.; Lederer, W.J.; Cannell, M.B. Calcium sparks and [Ca2+]i waves in cardiac myocytes. Am. J. Physiol. 1996, 270, C148–C159. [Google Scholar] [CrossRef] [PubMed]
  17. Capogrossi, M.C.; Houser, S.R.; Bahinski, A.; Lakatta, E.G. Synchronous occurrence of spontaneous localized calcium release from the sarcoplasmic reticulum generates action potentials in rat cardiac ventricular myocytes at normal resting membrane potential. Circ. Res. 1987, 61, 498–503. [Google Scholar] [CrossRef] [PubMed] [Green Version]
  18. Miura, M.; Ishide, N.; Oda, H.; Sakurai, M.; Shinozaki, T.; Takishima, T. Spatial features of calcium transients during early and delayed afterdepolarizations. Am. J. Physiol. 1993, 265, H439–H444. [Google Scholar] [CrossRef]
  19. Sutanto, H.; Heijman, J. Integrative Computational Modeling of Cardiomyocyte Calcium Handling and Cardiac Arrhythmias: Current Status and Future Challenges. Cells 2022, 11, 1090. [Google Scholar] [CrossRef]
  20. Li, K.; Zhang, P. Clinical Advances in Congenital Long QT Syndrome. Cardiol. Discov. 2021, 1, 195–201. [Google Scholar] [CrossRef]
  21. Ponce-Balbuena, D.; Deschênes, I. Long QT syndrome—Bench to bedside. Heart Rhythm O2 2021, 2, 89–106. [Google Scholar] [CrossRef] [PubMed]
  22. Wallace, E.; Howard, L.; Liu, M.; O’Brien, T.; Ward, D.; Shen, S.; Prendiville, T. Long QT Syndrome: Genetics and Future Perspective. Pediatr. Cardiol. 2019, 40, 1419–1430. [Google Scholar] [CrossRef] [PubMed] [Green Version]
  23. Sumitomo, N. Current topics in catecholaminergic polymorphic ventricular tachycardia. J. Arrhythmia 2016, 32, 344–351. [Google Scholar] [CrossRef] [PubMed] [Green Version]
  24. Ozawa, J.; Ohno, S.; Fujii, Y.; Makiyama, T.; Suzuki, H.; Saitoh, A.; Horie, M. Differential Diagnosis Between Catecholaminergic Polymorphic Ventricular Tachycardia and Long QT Syndrome Type 1—Modified Schwartz Score. Circ. J. Off. J. Jpn. Circ. Soc. 2018, 82, 2269–2276. [Google Scholar] [CrossRef] [Green Version]
  25. Saito, A.; Ohno, S.; Nuruki, N.; Nomura, Y.; Horie, M.; Yoshinaga, M. Three cases of catecholaminergic polymorphic ventricular tachycardia with prolonged QT intervals including two cases of compound mutations. J. Arrhythmia 2018, 34, 291–293. [Google Scholar] [CrossRef] [PubMed] [Green Version]
  26. Nyegaard, M.; Overgaard, M.T.; Søndergaard, M.T.; Vranas, M.; Behr, E.R.; Hildebrandt, L.L.; Børglum, A.D. Mutations in Calmodulin Cause Ventricular Tachycardia and Sudden Cardiac Death. Am. J. Hum. Genet. 2012, 91, 703–712. [Google Scholar] [CrossRef] [Green Version]
  27. Crotti, L.; Johnson, C.N.; Graf, E.; De Ferrari, G.M.; Cuneo, B.F.; Ovadia, M.; George, A.L. Calmodulin mutations associated with recurrent cardiac arrest in infants. Circulation 2013, 127, 1009–1017. [Google Scholar] [CrossRef] [Green Version]
  28. Makita, N.; Yagihara, N.; Crotti, L.; Johnson, C.N.; Beckmann, B.-M.; Roh, M.S.; Shigemizu, D.; Lichtner, P.; Ishikawa, T.; Aiba, T.; et al. Novel calmodulin mutations associated with congenital arrhythmia susceptibility. Circ. Cardiovasc. Genet. 2014, 7, 466–474. [Google Scholar] [CrossRef] [Green Version]
  29. Marsman, R.; Barc, J.; Beekman, L.; Alders, M.; Dooijes, D.; van den Wijngaard, A.; Ratbi, I.; Sefiani, A.; Bhuiyan, Z.; Wilde, A.; et al. A mutation in CALM1 encoding calmodulin in familial idiopathic ventricular fibrillation in childhood and adolescence. J. Am. Coll. Cardiol. 2014, 63, 259–266. [Google Scholar] [CrossRef] [Green Version]
  30. Reed, G.; Boczek, N.; Etheridge, S.; Ackerman, M. CALM3 mutation associated with long QT syndrome. Heart Rhythm 2015, 12, 419–422. [Google Scholar] [CrossRef]
  31. Limpitikul, W.; Dick, I.; Joshi-Mukherjee, R.; Overgaard, M.; George, A.J.; Yue, D. Calmodulin mutations associated with long QT syndrome prevent inactivation of cardiac L-type Ca(2+) currents and promote proarrhythmic behavior in ventricular myocytes. J. Mol. Cell. Cardiol. 2014, 74, 114–124. [Google Scholar] [CrossRef] [Green Version]
  32. Hwang, H.S.; Nitu, F.R.; Yang, Y.; Walweel, K.; Pereira, L.; Johnson, C.N.; Faggioni, M.; Chazin, W.J.; Laver, D.; George, A.L.; et al. Divergent regulation of ryanodine receptor 2 calcium release channels by arrhythmogenic human calmodulin missense mutants. Circ. Res. 2014, 114, 1114–1124. [Google Scholar] [CrossRef] [Green Version]
  33. Gomez-Hurtado, N.; Kryshtal, D.; Hwang, H.; Johnson, C.; Chazin, W.; Boczek, N.; Tester, D.; Ye, D.; Will, M.; Ackerman, M.; et al. Calmodulin Mutation (CALM1-E141G) Associated with Long QT Syndrome Disrupts Calmodulin Calcium Binding and Impairs L-Type Ca Channel Inactivation. Heart Rhythm 2014, 11, 2135–2136. [Google Scholar] [CrossRef]
  34. Hoang-Trong, M.T.; Ullah, A.; Lederer, W.J.; Jafri, M.S. Cardiac Alternans Occurs through the Synergy of Voltage- and Calcium-Dependent Mechanisms. Membranes 2021, 11, 794. [Google Scholar] [CrossRef] [PubMed]
  35. Sobie, E.A.; Dilly, K.W.; dos Santos Cruz, J.; Lederer, W.J.; Jafri, M.S. Termination of Cardiac Ca2+ Sparks: An Investigative Mathematical Model of Calcium-Induced Calcium Release. Biophys. J. 2002, 83, 59–78. [Google Scholar] [CrossRef] [Green Version]
  36. Groff, J.R.; Smith, G.D. Ryanodine receptor allosteric coupling and the dynamics of calcium sparks. Biophys. J. 2008, 95, 135–154. [Google Scholar] [CrossRef] [Green Version]
  37. Brette, F.; Leroy, J.; Le Guennec, J.Y.; Salle, L. Ca2+ currents in cardiac myocytes: Old story, new insights. Prog. Biophys. Mol. Biol. 2006, 91, 1–82. [Google Scholar] [CrossRef] [PubMed] [Green Version]
  38. Scriven, D.R.; Dan, P.; Moore, E.D. Distribution of proteins implicated in excitation-contraction coupling in rat ventricular myocytes. Biophys. J. 2000, 79, 2682–2691. [Google Scholar] [CrossRef] [PubMed] [Green Version]
  39. Walweel, K.; Gomez-Hurtado, N.; Rebbeck, R.T.; Oo, Y.W.; Beard, N.A.; Molenaar, P.; dos Remedios, C.; van Helden, D.F.; Cornea, R.L.; Knollmann, B.C.; et al. Calmodulin inhibition of human RyR2 channels requires phosphorylation of RyR2-S2808 or RyR2-S2814. J. Mol. Cell. Cardiol. 2019, 130, 96–106. [Google Scholar] [CrossRef] [PubMed]
  40. Sun, L.; Fan, J.S.; Clark, J.W.; Palade, P.T. A model of the L-type Ca2+ channel in rat ventricular myocytes: Ion selectivity and inactivation mechanisms. J. Physiol. 2000, 529 Pt 1, 139–158. [Google Scholar] [CrossRef]
  41. Wagner, E.; Lauterbach, M.A.; Kohl, T.; Westphal, V.; Williams, G.S.B.; Steinbrecher, J.H.; Strreich, J.-H.; Korff, B.; Tuan, H.-T.M.; Hagen, B.; et al. Stimulation emission depletion live-cell super-resolution imaging shows proliferative remodeling of T-tubule membrane structures after myocardial infraction. Circ. Res. 2012, 111, 402–414. [Google Scholar] [CrossRef] [PubMed] [Green Version]
  42. Jurado, L.A.; Chockalingam, P.S.; Jarrett, H.W. Apocalmodulin. Physiol. Rev. 2009, 79, 661–682. [Google Scholar] [CrossRef]
  43. Halling, D.B.; Aracena-Parks, P.; Hamilton, S.L. Regulation of voltage-gated Ca2+ channels by calmodulin. Sci. STKE Signal Transduct. Knowl. Environ. 2005, 2005, re15. [Google Scholar] [CrossRef]
  44. Banerjee, R.; Yoder, J.B.; Yue, D.T.; Amzel, L.M.; Tomaselli, G.F.; Gabelli, S.B.; Ben-Johny, M. Bilobal architecture is a requirement for calmodulin signaling to Ca(V)1.3 channels. Proc. Natl. Acad. Sci. USA 2018, 115, E3026–E3035. [Google Scholar] [CrossRef] [Green Version]
  45. Afshar, Y.; Schmid, F.; Pishevar, A.; Worley, S. Exploiting seeding of random number generators for efficient domain decomposition parallelization of dissipative particle dynamics. Comput. Phys. Commun. 2013, 184, 1119–1128. [Google Scholar] [CrossRef]
  46. DeRemigio, H.; LaMar, M.D.; Kemper, P.; Smith, G.D. Markov chain models of coupled calcium channels: Kronecker representations and iterative solution methods. Phys. Biol. 2008, 5, 036003. [Google Scholar] [CrossRef] [PubMed] [Green Version]
  47. Smith, G.D. Modeling the Stochastic Gating of Ion Channels. Interdisciplinary Applied Mathematics. In Computational Cell Biology; Fall, C.P., Marland, E.S., Wagner, J.M., Tyson, J.J., Eds.; Springer: New York, NY, USA, 2002; Volume 20, pp. 285–319. [Google Scholar]
  48. Kadam, P.; Bhalerao, S. Sample size calculation. Int. J. Ayurveda Res. 2010, 1, 55–57. [Google Scholar] [CrossRef] [PubMed] [Green Version]
  49. Wescott, A.P.; Jafri, M.S.; Lederer, W.J.; Williams, G.S. Ryanodine receptor sensitivity governs the stability and synchrony of local calcium release during cardiac excitation-contraction coupling. J. Mol. Cell Cardiol. 2016, 92, 82–92. [Google Scholar] [CrossRef] [Green Version]
  50. Hilliard, F.A.; Steele, D.S.; Laver, D.; Yang, Z.; Le Marchand, S.J.; Chopra, N.; Piston, D.W.; Huke, S.; Knollmann, B.C. Flecainide inhibits arrhythmogenic Ca2+ waves by open state block of ryanodine receptor Ca2+ release channels and reduction of Ca2+ spark mass. J. Mol. Cell Cardiol. 2010, 48, 293–301. [Google Scholar] [CrossRef] [Green Version]
  51. Sikkel, M.B.; Collins, T.P.; Rowlands, C.; Shah, M.; O’Gara, P.; Williams, A.J.; Harding, S.E.; Lyon, A.R.; MacLeod, K.T. Flecainide reduces Ca2+ spark and wave frequency via inhibition of the sarcolemmal sodium current. Cardiovasc. Res. 2013, 98, 286–296. [Google Scholar] [CrossRef]
  52. Macquaide, N.; Tuan, H.T.; Hotta, J.; Sempels, W.; Lenaerts, I.; Holemans, P.; Hofkens, J.; Jafri, M.S.; Willems, R.; Sipido, K.R. Ryanodine receptor cluster fragmentation and redistribution in persistent atrial fibrillation enhance calcium release. Cardiovasc. Res. 2015, 108, 387–398. [Google Scholar] [CrossRef] [Green Version]
  53. Hove-Madsen, L.; Llach, A.; Bayes-Genís, A.; Roura, S.; Font, E.R.; Arís, A.; Cinca, J. Atrial Fibrillation Is Associated With Increased Spontaneous Calcium Release From the Sarcoplasmic Reticulum in Human Atrial Myocytes. Circulation 2004, 110, 1358–1363. [Google Scholar] [CrossRef] [Green Version]
  54. Badone, B.; Ronchi, C.; Kotta, M.-C.; Sala, L.; Ghidoni, A.; Crotti, L.; Zaza, A. Calmodulinopathy: Functional Effects of CALM Mutations and Their Relationship with Clinical Phenotypes. Front. Cardiovasc. Med. 2018, 5, 176. [Google Scholar] [CrossRef] [Green Version]
  55. Ledford, H.A.; Park, S.; Muir, D.; Woltz, R.L.; Ren, L.; Nguyen, P.T.; Sirish, P.; Wang, W.; Sihn, C.-R.; George, A.L., Jr.; et al. Different arrhythmia-associated calmodulin mutations have distinct effects on cardiac SK channel regulation. J. Gen. Physiol. 2020, 152, e202012667. [Google Scholar] [CrossRef]
  56. Wang, Z.; Vermij, S.H.; Sottas, V.; Shestak, A.; Ross-Kaschitza, D.; Zaklyazminskaya, E.V.; Hudmon, A.; Pitt, G.S.; Rougier, J.-S.; Abriel, H. Calmodulin binds to the N-terminal domain of the cardiac sodium channel Nav1.5. Channels 2020, 14, 268–286. [Google Scholar] [CrossRef]
  57. Kang, P.W.; Chakouri, N.; Diaz, J.; Tomaselli, G.F.; Yue, D.T.; Ben-Johny, M. Elementary mechanisms of calmodulin regulation of Na(V)1.5 producing divergent arrhythmogenic phenotypes. Proc. Natl. Acad. Sci. USA 2021, 118, e2025085118. [Google Scholar] [CrossRef]
  58. Němec, J.; Kim, J.J.; Salama, G. The link between abnormal calcium handling and electrical instability in acquired long QT syndrome--Does calcium precipitate arrhythmic storms? Prog. Biophys. Mol. Biol. 2016, 120, 210–221. [Google Scholar] [CrossRef] [Green Version]
  59. Giudicessi, J.R.; Ackerman, M.J. Calcium Revisited: New Insights into the Molecular Basis of Long-QT Syndrome. Circ. Arrhythmia Electrophysiol. 2016, 9, e002480. [Google Scholar] [CrossRef]
  60. Lin, D.-J.; Lee, W.-S.; Chien, Y.-C.; Chen, T.-Y.; Yang, K.-T. The link between abnormalities of calcium handling proteins and catecholaminergic polymorphic ventricular tachycardia. Tzu-Chi Med. J. 2021, 33, 323–331. [Google Scholar] [CrossRef]
  61. McCoy, M.D.; Hamre, J., 3rd; Klimov, D.K.; Jafri, M.S. Predicting Genetic Variation Severity Using Machine Learning to Interpret Molecular Simulations. Biophys. J. 2021, 120, 189–204. [Google Scholar] [CrossRef]
  62. Tadross, M.R.; Dick, I.E.; Yue, D.T. Mechanism of Local and Global Ca<sup>2+</sup> Sensing by Calmodulin in Complex with a Ca2+ Channel. Cell 2008, 133, 1228–1240. [Google Scholar] [CrossRef] [Green Version]
  63. Lai, M.; Brun, D.; Edelstein, S.J.; Le Novère, N. Modulation of calmodulin lobes by different targets: An allosteric model with hemiconcerted conformational transitions. PLoS Comput. Biol. 2015, 11, e1004063. [Google Scholar] [CrossRef] [Green Version]
  64. Limpitikul, W.B.; Greenstein, J.L.; Yue, D.T.; Dick, I.E.; Winslow, R.L. A bilobal model of Ca2+-dependent inactivation to probe the physiology of L-type Ca2+ channels. J. Gen. Physiol. 2018, 150, 1688–1701. [Google Scholar] [CrossRef] [Green Version]
  65. Kernik, D.C.; Yang, P.-C.; Kurokawa, J.; Wu, J.C.; Clancy, C.E. A computational model of induced pluripotent stem-cell derived cardiomyocytes for high throughput risk stratification of KCNQ1 genetic variants. PLoS Comput. Biol. 2020, 16, e1008109. [Google Scholar] [CrossRef]
  66. Bai, J.; Wang, K.; Liu, Y.; Li, Y.; Liang, C.; Luo, G.; Dong, S.; Yuan, Y.; Zhang, H. Computational Cardiac Modeling Reveals Mechanisms of Ventricular Arrhythmogenesis in Long QT Syndrome Type 8: CACNA1C R858H Mutation Linked to Ventricular Fibrillation. Front. Physiol. 2017, 8, 771. [Google Scholar] [CrossRef]
  67. Sadrieh, A.; Domanski, L.; Pitt-Francis, J.; Mann, S.A.; Hodkinson, E.C.; Ng, C.A.; Perry, M.D.; Taylor, J.A.; Gavaghan, D.; Subbiah, R.N.; et al. Multiscale cardiac modelling reveals the origins of notched T waves in long QT syndrome type 2. Nat. Commun. 2014, 5, 5069. [Google Scholar] [CrossRef] [Green Version]
  68. Grandi, E.; Puglisi, J.L.; Bers, D.M.; Severi, S. Compound mutations in Long QT syndrome assessed by a computer model. In Proceedings of the 2006 Conference on Computers in Cardiology, Valencia, Spain, 17–20 September 2006; pp. 201–204. [Google Scholar]
  69. Hoang-Trong, T.M.; Ullah, A.; Lederer, W.J.; Jafri, M.S. A Stochastic Spatiotemporal Model of Rat Ventricular Myocyte Calcium Dynamics Demonstrated Necessary Features for Calcium Wave Propagation. Membranes 2021, 11, 989. [Google Scholar] [CrossRef]
Figure 1. Cardiac myocyte structure. In the cardiac myocyte (A), CICR occurs at a specialized sub-domain called a dyad (B). The array of L-type calcium channels (LCC) on the T-tubule membrane and ryanodine receptor 2 (RYR2) channels on the sarcoplasmic reticulum (SR) make up the CRU.
Biomolecules 13 00072 g001
Figure 2. Compartmental model of the cardiac myocyte. A schematic representation of the cardiac myocyte compartmental model, which is parameterized using single channel experimental data, is used to simulate the cellular ionic flux. Calcium enters the cell through 20,000 independent CRUs, first by the L-Type Calcium Channel (LCC) in response to a current stimulus and then through Ryanodine Receptor 2 (RYR2) channels on the surface of the junctional Sarcoplasmic Reticulum (jSR). Calcium influx is terminated by a process dominated by CaM-dependent inactivation the LCC. Calcium diffuses into the bulk myoplasm, where it is reloaded into the non-junctional Sarcoplasmic Reticulum (NSR) by sarcoplasmic/endoplasmic reticulum Ca2+-ATPase (SERCA) to diffuse back to the jSR. Additionally, calcium buffers in the bulk myoplasm and NSR account for calcium interactions outside the scope of CICR and cellular ionic homeostasis is maintained by calcium, sodium, and potassium exchangers in the cell membrane.
Biomolecules 13 00072 g002
Figure 3. LCC 6 state model. The six states of a single L-type calcium channel (LCC). The transition from the closed state of C1 to the open state O2 is dependent on the transmembrane voltage. The channel inactivation to state C5 is dependent on voltage, but in the CRU, closing is dominated by the Ca:CaM-dependent transition to C4 (red box). By altering the transition rate to C4, subtle deficiencies in CaM inactivation can be modeled. The default value of k24 is 8 s−1µM−1.
Biomolecules 13 00072 g003
Figure 4. Cellular calcium concentration of cardiac myocytes: (A) 1 Hz pacing, (B) 2 Hz pacing, (C) 4 Hz pacing, (D) 6 Hz pacing. The cardiac myocyte simulations of decreased CDI (75% of transition rate—blue and 90% of transition rate—red) show an increase in cellular calcium over the wild-type cells (black). The effect becomes exaggerated with increased pacing resulting in Ca2+ alternans. Shown are representative simulations out of six repeated simulations with different random number seed values in each case. The different simulation traces for each condition overlap at steady-state pacing.
Biomolecules 13 00072 g004
Figure 5. Calcium concentration in the NSR in cardiac myocytes: (A) 1 Hz pacing, (B) 2 Hz pacing, (C) 4 Hz pacing, (D) 6 Hz pacing. The mutant simulations CDI (75% of transition rate—blue and 90% of transition rate—red) of the cardiac myocyte show an increase in calcium loading in the SR compared to wild type (black). Shown are representative simulations out of six repeated simulations with different random number seed values in each case. The different simulation traces for each condition overlap at steady-state pacing.
Biomolecules 13 00072 g005
Figure 6. Transmembrane voltage in simulation of cardiac myocytes: (A) 1 Hz pacing, (B) 2 Hz pacing, (C) 4 Hz pacing, (D) 6 Hz pacing. Simulations of the wild-type (black) cardiac myocyte and cardiac myocyte with mutant CDI (75% of transition rate—blue and 90% of transition rate—red) show that the transmembrane voltage for the cardiac myocyte displays a slight elongation of the action potential during pacing. APD alternans is seen for the mutant.
Biomolecules 13 00072 g006
Figure 7. Reduced CaM inactivation impact on action potential at different pacing frequencies. (A) APD50 for 1, 2, and 4 Hz. (B) APD90 for 1, 2, and 4 Hz. (C) APD80 for 6 Hz show alternans occurs for the mutant but not wild type. The action potential of cardiac myocytes is elongated in simulations with deficient CaM regulated LCC inactivation. (Black—wild type, 75% of CDI transition rate—blue, and 90% of CDI transition rate—red). Shown are representative simulations out of six repeated simulations with different random number seed values in each case. The different simulation traces for each condition overlap at steady-state pacing. The box and whisker chart shows distribution of data into quartiles (boxes indicating middle quartiles separated by a line indicating the mean and lines or whiskers outside the boxes indicating the upper and lower quartiles. The points outside these quartiles are outliers. Statistical significance at the p < 0.001 significance level for the student’s t-test for equality of means with samples of unknow variance is indicated by the black bars with asterisks.
Biomolecules 13 00072 g007
Figure 8. The cardiac myocyte at 4 Hz pacing for 100 s shows that the simulation reaches steady state after 20 s. (A) Myoplasmic calcium. Pictured here is the simulation from 20 to 30 s. (B) SR calcium. (C) Transmembrane voltage. Shown are normal (black) and mutant cells with diminished CaM-dependent LCC inactivation. (Red—wild type, 75% of CDI transition rate—blue, and 90% of CDI transition rate—red). Shown are representative simulations out of six repeated simulations with different random number seed values in each case. The different simulation traces for each condition overlap at steady-state pacing.
Biomolecules 13 00072 g008
Figure 9. Calcium sparks in the cardiac myocyte at different pacing frequencies recorded for 1 s at steady-state pacing. (A) Spark frequency, (B) spark duration, (C) time to Ca2+ spark peak, and (D) Ca2+ spark peak amplitude. (Black—wild type, 75% of CDI transition rate—blue, and 90% of CDI transition rate—red). The box and whiskers plots show the middle two quartiles with boxes, the upper and lower quartiles with lines, the mean with an ×, and outliers with points. Statistical significance at the p < 0.001 significance level for the student’s t-test for equality of means with samples of unknow variance is indicated by the black bars with asterisks. Shown are representative simulations out of six repeated simulations with different random number seed values in each case. The different simulation traces for each condition overlap at steady-state pacing. The number of data points for each simulation is equivalent to number of sparks is 1000 × the values shown in (A). Only the data for 10% of the 20,000 Ca2+ release sites are not shown because it is impractical to store the large amount of data.
Biomolecules 13 00072 g009
Figure 10. Cellular calcium for beta-adrenergic stimulated cardiac myocytes: (A) 1 Hz pacing, (B) 2 Hz pacing, (C) 4 Hz pacing, (D) 6 Hz pacing. The mutant simulations CDI (75% of transition rate—blue and 90% of transition rate—red) of the cardiac myocyte show that the impacts on cellular calcium concentration of mutant cardiac myocytes is exaggerated under beta-adrenergic stimulation compared to wild type (black). Shown are representative simulations out of six repeated simulations with different random number seed values in each case. The different simulation traces for each condition overlap at steady-state pacing.
Biomolecules 13 00072 g010
Figure 11. NSR calcium in beta-adrenergic stimulated cardiac myocytes: (A) 1 Hz pacing, (B) 2 Hz pacing, (C) 4 Hz pacing, (D) 6 Hz pacing. The wild-type cardiac myocytes (black) show consistent morphology with increased pacing. The mutant simulations CDI (75% of transition rate—blue and 90% of transition rate—red) of the cardiac myocyte show that in beta-adrenergic cardiac myocytes, the NSR calcium dynamics of CDI mutants become severely disrupted in response to pacing. Shown are representative simulations out of six repeated simulations with different random number seed values in each case. The different simulation traces for each condition overlap at steady-state pacing.
Biomolecules 13 00072 g011
Figure 12. Transmembrane voltage in beta-adrenergic stimulated cardiac myocytes: (A) 1 Hz pacing, (B) 2 Hz pacing, (C) 4 Hz pacing, (D) 6 Hz pacing. The wild-type cardiac myocytes (black) show consistent morphology with increased pacing. The mutant simulations CDI (75% of transition rate—blue and 90% of transition rate—red) of the cardiac myocyte show that during pacing, the ability of mutant beta-adrenergic cardiac myocytes to repolarize is diminished and leads to arrhythmia. Shown are representative simulations out of six repeated simulations with different random number seed values in each case. The different simulation traces for each condition overlap at steady-state pacing.
Biomolecules 13 00072 g012
Figure 13. LCC calcium current in cardiac myocyte simulations under beta-adrenergic stimulation: (A) 1 Hz pacing, (B) 2 Hz pacing, (C) 4 Hz pacing, and (D) 6 Hz pacing. The wild-type cardiac myocytes (black) show consistent morphology with increased pacing. The mutant simulations CDI (75% of transition rate—blue and 90% of transition rate—red) of the cardiac myocyte show that the differences in the Ca2+ current through the LCC are undetectable in the cardiac myocyte simulations, but the impact of reduced CDI increased the current during pacing in beta-adrenergic stimulation. Shown are representative simulations out of six repeated simulations with different random number seed values in each case. The different simulation traces for each condition overlap at steady-state pacing.
Biomolecules 13 00072 g013
Figure 14. Flux through RYR2 channels in cardiac myocyte simulations under beta-adrenergic stimulation: (A) 1 Hz pacing, (B) 2 Hz pacing, (C) 4 Hz pacing, (D) 6 Hz pacing. The wild-type cardiac myocytes (black) show consistent morphology with increased pacing. The mutant simulations CDI (75% of transition rate—blue and 90% of transition rate—red) of the cardiac myocyte show that the total calcium flux released through the RYR2 channels of 20,000 CRUs displays an increase in calcium sparks during beta-adrenergic stimulation. An additional increase in the open probability of RYRs comes from the higher calcium concentration in the dyadic subspace from their prolonged APD. Shown are representative simulations out of six repeated simulations with different random number seed values in each case. The different simulation traces for each condition overlap at steady-state pacing.
Biomolecules 13 00072 g014
Figure 15. Na+-Ca2+ exchanger calcium current in myocyte simulations under beta-adrenergic stimulation. (A) Na+-Ca2+ exchanger current at 1 Hz pacing. (B) Na+-Ca2+ exchanger current at 2 Hz pacing. (C) Na+-Ca2+ exchanger current at 4 Hz pacing. (D) Na+-Ca2+ exchanger current at 6 Hz pacing. The wild-type cardiac myocytes (black) show consistent morphology with increased pacing. The mutant simulations CDI (75% of transition rate—blue and 90% of transition rate—red) of the cardiac myocyte show that the currents through the Na+-Ca2+ exchanger in the cell membrane becomes destabilized in mutant beta-adrenergic stimulation, as the increased calcium prevents the current to reach the initial diastolic levels.
Biomolecules 13 00072 g015
Figure 16. APD80 and calcium binding affinity show a monotonic non-linear relation correlation coefficient. (A) Experimental data of APD80 at 0.5 Hz pacing in Guinea pig ventricular myocytes from [1,31,61]. (B) Simulated rat ventricular myocyte data of APD80 at 1 Hz pacing from this study.
Biomolecules 13 00072 g016
Table 1. Disease-associated mutations in CaM.
Mutation *Disease AssociationStructural DomainActivity ChangeFunctional ChangeCa2+ Binding AffinityCa2+-Dependent Inactivation **CaM1CaM2CaM3
WTnone nonenone2.5 µMk24
N54ICPVT4EF Hand II adjacentSmall increase in Calcium binding in C-lobeSignificantly increased calcium waves3.1 µM0.99 × k24x
F90LIVFEF Hand III adjacent Mediates interaction with target peptides x
D96VLQT14EF Hand III Moderate/High disruption of Calcium bindingIncreased AP; depress LTCC inactivation38.0 µM0.74 × k24 x
N98SCPVT4; LQT14EF Hand IIISignificant reduction in calcium bindingRYR2 binding disrupted at low Ca2+11.0 µM0.92 × k24xx
N98ILQT14EF Hand IIIReduced calcium bindingIncreased RYR open probability x
A103VCPVT4EF Hand III x
D130GLQT14EF Hand IVReduced calcium binding Reduced RYR2 binding affinity; increased AP; impaired LTCC inactivation150.0 µM0.41 × k24x x
D132ECPVT4; LQT14EF Hand IVReduced calcium binding x
D134HLQT14EF Hand IVReduced calcium binding x
Q136PCPVT4; LQT14EF Hand IVReduced calcium binding x
E141GLQT14EF Hand IV adjacentReduced calcium bindingImpaired LTCC inactivation x
F142LLQT14EF Hand IV adjacentReduced calcium binding Reduced RYR2 binding affinity; increased AP; depress LTCC inactivation; Alter energetic coupling in C-lobe conformational dynamics15.0 µM0.89 × k24xx
* Mutations in calmodulin (CaM) have been associated with Long QT Syndrome Type 14 (LQT14), idiopathic ventricular fibrillation (IVF) and catecholaminergic polymorphic ventricular tachycardia type 4 (CPVT4). ** The fraction change to CDI is described by a reduction in the CaM bound by Ca2+ assuming rapid equilibrium of Ca2+ binding to calmodulin. The default value of k24 is 8 s−1 µM−1.
Table 2. Calcium buffers.
VariablesValueUnit
Calmodulin2.4d1µM
k C a M + 3.0d11/(µM.s)
k C a M 7.14d11/s
Table 3. Ca2+ spark properties for mutations in CaM at different pacing frequencies.
Frequency1 Hz2 Hz 4 Hz
VariantWTMut90Mut75WTMut90Mut75WTMut90Mut75
Spark Frequency
(sparks/ms)
89.6105.9119.5204229272.9470.7536.5707.9
Spark Duration (ms)22.222.123.123.023.625.025.727.334.1
Time to Peak (ms)0.780.740.730.750.750.680.710.701.02
Peak Amplitude (µM)131.4133.1137.0133.2135.5142.3138.2143.0153.5
Disclaimer/Publisher’s Note: The statements, opinions and data contained in all publications are solely those of the individual author(s) and contributor(s) and not of MDPI and/or the editor(s). MDPI and/or the editor(s) disclaim responsibility for any injury to people or property resulting from any ideas, methods, instructions or products referred to in the content.

