Article

Comparative Transcriptomic Analysis of mRNAs, miRNAs and lncRNAs in the Longissimus dorsi Muscles between Fat-Type and Lean-Type Pigs

1
Shandong Provincial Key Laboratory of Animal Biotechnology and Disease Control and Prevention, Shandong Agricultural University, No. 61 Daizong Street, Taian 271018, China
2
Shandong Key Laboratory of Animal Disease Control and Breeding, Institute of Animal Science and Veterinary Medicine, Shandong Academy of Agricultural Sciences, Jinan 250100, China
*
Author to whom correspondence should be addressed.
Biomolecules 2022, 12(9), 1294; https://doi.org/10.3390/biom12091294
Submission received: 26 June 2022 / Revised: 5 September 2022 / Accepted: 9 September 2022 / Published: 13 September 2022
(This article belongs to the Special Issue Omics Approaches to Understanding Skeletal Muscle Biology)

Abstract

:
In pigs, meat quality and production are two important traits affecting the pig industry and human health. Compared to lean-type pigs, fat-type pigs contain higher intramuscular fat (IMF) contents, better taste and nutritional value. To uncover genetic factors controlling differences related to IMF in pig muscle, we performed RNA-seq analysis on the transcriptomes of the Longissimus dorsi (LD) muscle of Laiwu pigs (LW, fat-type pigs) and commercial Duroc × Landrace × Yorkshire pigs (DLY, lean-type pigs) at 150 d to compare the expression profiles of mRNA, miRNA and lncRNA. A total of 225 mRNAs, 12 miRNAs and 57 lncRNAs were found to be differentially expressed at the criteria of |log2(foldchange)| > 1 and q < 0.05. The mRNA expression of LDHB was significantly higher in the LD muscle of LW compared to DLY pigs with log2(foldchange) being 9.66. Using protein interaction prediction method, we identified more interactions of estrogen-related receptor alpha (ESRRA) associated with upregulated mRNAs, whereas versican (VCAN) and proenkephalin (PENK) were associated with downregulated mRNAs in LW pigs. Integrated analysis on differentially expressed (DE) mRNAs and miRNAs in the LD muscle between LW and DLY pigs revealed two network modules: between five upregulated mRNA genes (GALNT15, FKBP5, PPARGC1A, LOC110258214 and LOC110258215) and six downregulated miRNA genes (ssc-let-7a, ssc-miR190-3p, ssc-miR356-5p, ssc-miR573-5p, ssc-miR204-5p and ssc-miR-10383), and between three downregulated DE mRNA genes (IFRD1, LOC110258600 and LOC102158401) and six upregulated DE miRNA genes (ssc-miR1379-3p, ssc-miR1379-5p, ssc-miR397-5p, ssc-miR1358-5p, ssc-miR299-5p and ssc-miR1156-5p) in LW pigs. Based on the mRNA and ncRNA binding site targeting database, we constructed a regulatory network with miRNA as the center and mRNA and lncRNA as the target genes, including GALNT15/ssc-let-7a/LOC100523888, IFRD1/ssc-miR1379-5p/CD99, etc., forming a ceRNA network in the LD muscles that are differentially expressed between LW and DLY pigs. Collectively, these data may provide resources for further investigation of molecular mechanisms underlying differences in meat traits between lean- and fat-type pigs.

1. Introduction

Pork is a vital source of protein, energy and iron for humans, and occupies an important position in the world meat consumption [1]. Meat quality is attracting more and more attention in recent years. Intramuscular fat (IMF) content is a primary pork quality indicator, affecting meat quality traits including tenderness, juiciness, flavor and nutritional value [2]. IMF refers to the fat extracted from muscle tissue, which is deposited in muscle fiber, outer membrane and inner membrane and is considered to be a late developing fat storage during the process of fat deposition [3]. Meat quality is also influenced by the composition of different types of skeletal muscle fibers including type I (slow/oxidative), type IIa (fast/oxido-glycolic), IIX (between type IIa and IIb) and type IIb (fast/glycolic) [4]. Type I muscle fibers can carry out long-lasting slow activity, as they have more capillaries, lipids, myoglobin than type II muscle, while type II muscle fibers are more capable of rapid muscle contraction because they contain more glycolytic enzymes [5]. The relatively lower expression of MyHC-IIb gene and lower proportion of type IIb fiber is related to the better meat quality of Laiwu (LW) and Jinhua pigs [6].
Compared with traditional lean-type pig breeds, the fat-type breeds contain higher IMF contents, better taste and nutritional value [7,8]. Nevertheless, lean-type pigs have higher lean rates and growth rates than fat-type pigs [9]. Several studies reported the comparative analysis in the transcriptome between lean-type and fat-type pigs, such as Large White vs. Basque pigs [10], Wei vs. Yorkshire pigs [11], Polish Landrace vs. Puławska pigs [12] as well as the proteome of Lantang and Landrace pigs [13] and the transcriptome and proteome of Pietrain and Duroc pigs [14]. Laiwu pigs (LW) are a classical fat-type indigenous pig breed distributed in Shandong province of China, well known for its extremely higher IMF content (about 10%) [15] than commercial Duroc × Landrace × Yorkshire (DLY) pigs, which are lean-type pigs showing higher lean meat rate and faster growth rate [16]. Two studies analyzed the molecular mechanisms underlying IMF deposition in LW pigs by transcriptome, DNA methylome [17] and proteome approaches [18]; however, the causative gene(s) remains to be determined.
With the rapid development of high-throughput sequencing, numerous non-coding RNAs (ncRNAs) including microRNA (miRNA) and long noncoding RNA (lncRNA) have been found to play important roles in IMF deposition and muscle development [19]. MicroRNAs are a family of post-transcriptional gene repressors, which are widely involved in the regulation of gene expression in various biological processes associated with fat synthesis, deposition and metabolism [20]. Competing endogenous RNA (ceRNA) hypothesis postulated that various types of mRNAs, lncRNAs, circRNAs (circular RNAs) and pseudogenes could compete for the same microRNA response elements to mutually regulate gene expression [21]. In one previous study, the potential lncRNAs/circRNAs-miRNAs-mRNAs regulatory networks shared MYOD1, PPARD, miR-423-5p and miR-874, which were associated with skeletal muscle muscular proliferation, differentiation/regeneration and adipogenesis [22].
In this study, the transcriptomes of the Longissimus dorsi muscle were analyzed to identify differences in gene expression profiles of mRNA, miRNA and lncRNA between LW pigs and DLY pigs, to uncover miRNA-mRNA interaction pathways and to construct mRNA-miRNA-lncRNA interaction networks. The data provided in this study may assist in deciphering the molecular mechanism underlying IMF deposition and other meat quality traits in pigs.

2. Materials and Methods

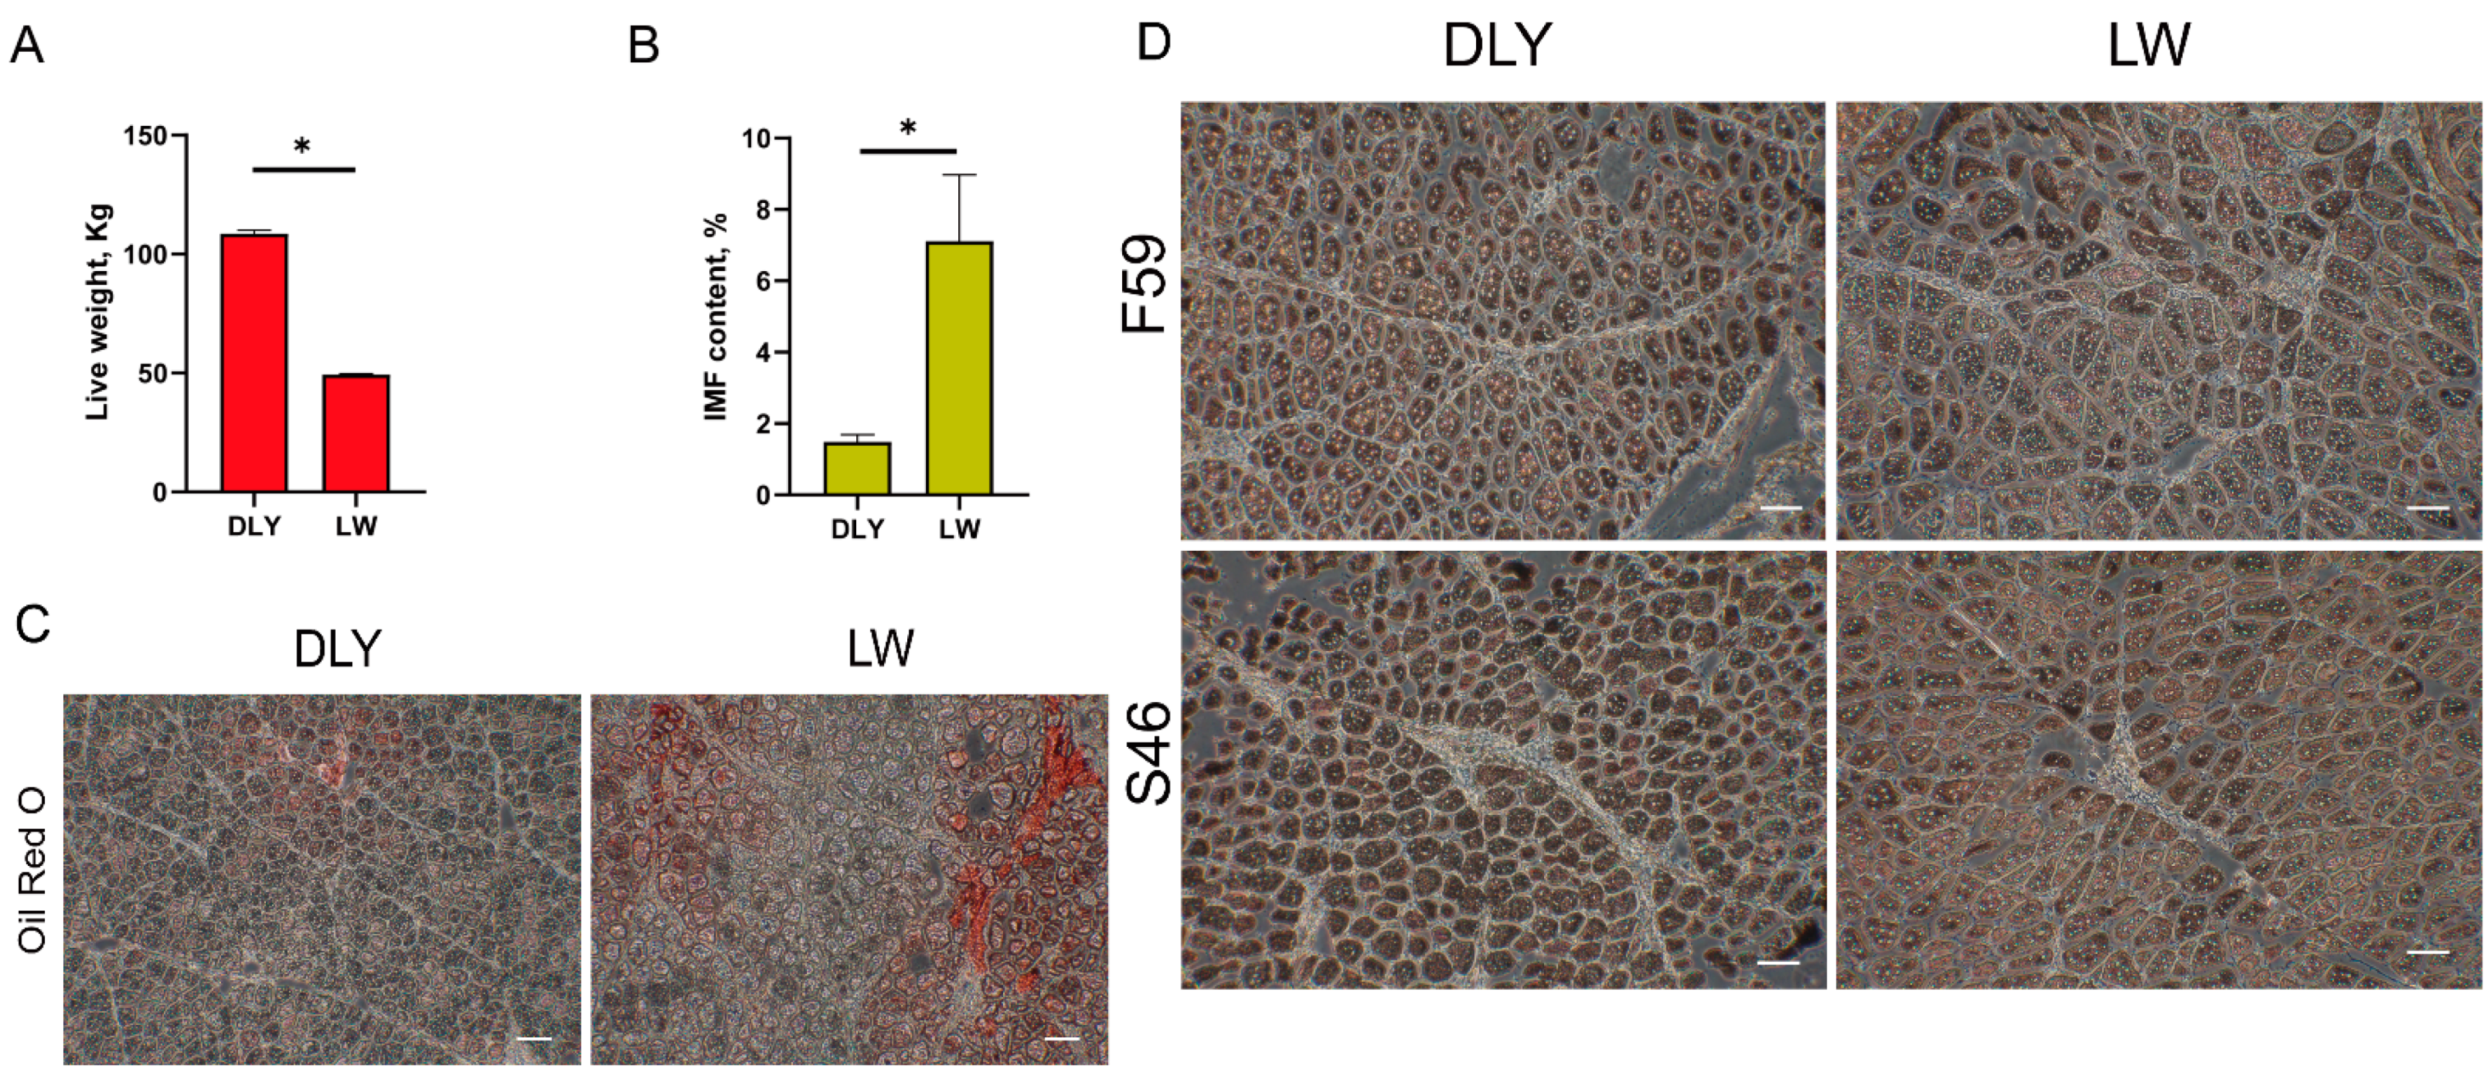
2.1. Animals and Tissue Samples

A total of three castrated male Laiwu pigs with unrelated genetic background reared under identical feeding conditions and environment were randomly selected from the Conservation Center of Laiwu pigs (Laiwu, Shandong, China) at 150 d. Similarly, three castrated male DLY pigs of 150 d of age were randomly selected from Beihe Pig Breeding Co., Ltd. (Laiwu, Shandong, China). The animals were allowed access to food and water ad libitum and were housed under identical conditions. To minimize animal suffering, the pigs were weighed and electrically stunned before death. Immediately after slaughter, about 30 g sample of the Longissimus dorsi muscle (LD) at the third lumbar vertebra of each pig was collected into a 2 mL cryogenic vial (Corning, NY, USA) and frozen in liquid nitrogen for further study [15,23]. For RNA-seq, samples were transported in dry ice to BGI (Shenzhen, China) and stored at −80 °C for total RNA extraction. The same samples were also used for real-time quantitative PCR (RT-qPCR). All animal care and experimental procedures were in accordance with the guidelines for the care and use of laboratory animals prescribed by Shandong Agricultural University and the Ministry of Agriculture of China (No. SDAUA-2021-097).

2.2. IMF Content Measurement

The IMF content in the LD muscle tissues of pigs was measured by Soxhlet petroleum ether extraction method [24]. Briefly, after removing the fascia, blood vessels and connective tissue, skeletal muscle sample was ground using a meat grinder. Ten grams of the sample was dried to a constant weight in a drying oven (Yiheng Scientific Instrument Co., Ltd., Shanghai, China) at 103 °C. Dried meat sample with filter paper package was treated with an appropriate amount of petroleum ether into the Soxhlet bottle and extracted continuously for 6–8 h. Then, the sample was placed in a desiccator overnight and placed in a vacuum drying oven at 80 °C for 12 h and finally weighed. The IMF was calculated by dividing (the sample of dried meat wrapped in the filter paper (g) minus the weight of the dried meat of the filter paper after extraction (g)) by the sample of dried meat (g) multiplied by 100.

2.3. Total RNA Isolation, Library Preparation, and Sequencing

Total RNA was extracted from the LD muscle tissues using Trizol (Invitrogen, Carlsbad, CA, USA) according to manufacturer’s instructions. The quantity and purity of the total RNA were evaluated using Agilent 2100 Bioanalyzer (Agilent Technologies, Santa Clara, CA, USA). Total RNA was divided into two samples after preparation, and each was used for mRNA and lncRNA cDNA library and miRNA library construction, respectively. For mRNA and lncRNA cDNA library, the first step involves the removal of ribosomal RNA (rRNA) using target-specific oligos and RNase H reagents. The cleaved RNA fragments were copied into first strand cDNA using reverse transcriptase (MGIEasy RNA, Shenzhen, China) and random primers, followed by second strand cDNA synthesis using DNA Polymerase I (MGIEasy RNA, Shenzhen, China) and RNase H (MGIEasy RNA, Shenzhen, China). The products were enriched with PCR to create the final cDNA library. For miRNA cDNA library, total RNA was purified to obtain 18–30 nt small RNA, which was ligated to a 5′-adaptor and a 3′-adaptor. The adaptor-ligated small RNAs were subsequently transcribed into cDNA by SuperScript II Reverse Transcriptase (Invitrogen, Carlsbad, CA, USA) and then PCR amplified to enrich the cDNA fragments. The library quality was checked by analyzing the distribution of the fragments size using the Agilent 2100 bioanalyzer, and quantified by RT-qPCR. The qualified libraries were sequenced pair end on the BGISEQ-500 platform (BGI, Shenzhen, China).

2.4. Bioinformatic Analysis of DE mRNA, miRNA and lncRNA and Their Interactions

The raw sequencing data from mRNA, miRNA and lncRNA libraries were filtered with SOAPnuke 1.5.2 (https://github.com/BGI-flexlab/SOAPnuke, accessed on 1 May 2021) [25]. In this step, reads containing sequencing adaptor, low-quality reads (base quality less than or equal to 5) and unknown base (‘N’ base) were removed. After filtering, clean reads were obtained and stored in FASTQ format. The clean reads were mapped to the Sus scrofa reference genome (Sscrofa11.1, https://www.ncbi.nlm.nih.gov/assembly/GCF_000003025.6, accessed on 1 May 2021) using HISAT2 2.0.4 (http://www.ccb.jhu.edu/software/hisat/index.shtml, accessed on 1 May 2021) [26]. The clean tags of miRNA were mapped to the reference genome with Bowtie2 (http://bowtie-bio.sourceforge.net/bowtie2/index.shtml, accessed on 1 May 2021) [27]. FPKM (reads per kilo base of the exon model per million mapped reads) values obtained using Cufflinks 2.1.1 (http://cole-trapnell-lab.github.io/cufflinks/, accessed on 1 May 2021) were used as values for normalized gene expression [28] and annotated with NCBI genome assembly [29].
The statistically significant differentially expressed (DE) mRNAs, miRNAs and lncRNAs were obtained by a q value threshold of <0.05 and |log2 (fold change)| >1 using the DEseq2 software (v1.36, Simon Anders, Heidelberg, Germany) [30]. Analyses of the differentially expressed mRNAs by GO were performed using Gene Ontology database (http://www.geneontology.org/, accessed on 1 May 2021) [31,32], and KEGG pathway analysis was performed by KEGG database [33]. Pathway enrichment statistical analyses were performed using R package phyper (https://stat.ethz.ch/R-manual/R-devel/library/stats/html/Hypergeometric.html, accessed on 1 May 2021) to calculate p value [34]. Multiple testing correction of p value was applied using R package qvalue (https://bioconductor.org/packages/release/bioc/html/qvalue.html, accessed on 1 May 2021) with corrected q values < 0.05 by Bonferroni [35]. The plots of KEGG enrichment were prepared using R package ggplot2 (https://www.rdocumentation.org/packages/ggplot2/versions/3.3.6, accessed on 1 May 2021) [36]. The heatmap was drawn by pheatmap R package (https://cran.r-project.org/web/packages/pheatmap/index.html, accessed on 1 May 2021) according to the gene expression level in different samples. A protein–protein interaction network was constructed by the Search Tool for the Retrieval of Interacting Genes (STRING) online software against the Sus scrofa database. Additionally, Qiagen’s Ingenuity Pathway Analysis (IPA) was used to identify the predicted upstream regulators of DEGs.
We constructed ncRNAs regulatory network to reveal the interaction between ncRNAs and mRNAs in porcine LD muscles. The interaction of miRNAs with mRNAs and lncRNAs was predicted with miRDB (http://www.mirdb.org/, accessed on 1 May 2021), miRcode (http://www.mircode.org/index.php, accessed on 1 May 2021) and TargetScan (http://www.targetscan.org/vert_71/, accessed on 1 May 2021).The prediction of target lncRNAs of mRNAs was performed using RNAplex [37]. The ncRNA networks and lncRNA or miRNA interactions of interest were visualized by Cytoscape (V.3.8.2).

2.5. Immunohistochemistry

The LD muscle tissue sections from LW and DLY pigs were processed according to standard protocols following the procedures as described by Zhang et al. [38]. Mouse monoclonal antibody to S46 (myosin heavy chain, slow developmental; 1:200, AB_528376, DSHB, Iowa city, IA, USA) and mouse monoclonal antibody to F59 (myosin heavy chain, all fast isoforms; 1:200, AB_528373, DSHB, Iowa city, IA, USA) were used to incubate the above prepared sections. After overnight storage at 4 °C, the sections were incubated with goat anti-mouse IgG (PV-9002, ZSGB-Bio Co., Ltd., Beijing, China) for 1 h in a 37 °C thermostat box. The sections were washed with PBS (3 × 5 min) after these incubations. All samples were incubated in diaminobenzidine tetrachloride (DAB kit, PN3122, G-CLONE Co., Ltd., Beijing, China) for 1~3 min and counterstained with hematoxylin and color developed in tap water. The sections were then dehydrated, sealed in clear resin, mounted, and observed microscopically for the distribution of positive cells using a bright field of view.

2.6. Overexpression and Knockdown Assay

The entire coding region of murine GALNT15 gene was amplified, and polymerase Gflex (TaKaRa, Dalian, China) was used to ensure high fidelity (Table S1). The polymerase chain reaction (PCR) fragments were generated by double enzyme (Hind III and Xho I) digestion and ligated with pcDNA3.1(+) expression vectors (Invitrogen, Carlsbad, CA, USA) by T4 DNA ligase (Thermo Fisher Scientific, Waltham, MA, USA), which were transformed into DH5α (TaKaRa, Dalian, China) competent cells. After being confirmed by bidirectional sequencing and purified using an EndoFree Plasmid Midi Kit (Aidlab, Beijing, China), these plasmids were used for transfecting 3T3-L1 cells. The obtained plasmid was named pcDNA3.1(+)-GALNT15. Empty pcDNA3.1(+) vector was used as the control.
For knockdown (KD) assay, siRNA was designed according to murine GALNT15 mRNA (Shanghai GenePharma Co., Ltd., Shanghai, China). The negative control of the siRNA had the same composition with the siRNA sequence but had no homology with GALNT15 mRNA (Table S2). Three pairs of siRNAs were designed. The most effective siRNA was used to analyze the knockdown effect of siRNA on GALNT15 gene.

2.7. Cell Culture and Transfection

The 3T3-L1 cells were planted in a 24-well culture growth (pyruvate-free) DMEM (Gibco, Camarillo, CA, USA) medium supplemented with 10% fetal bovine serum (Biological Industries, Kibbutz Beit-Haemek, Israel) and penicillin–streptomycin (100 U/mL penicillin, 100 mg/L streptomycin) at 37 °C in a humidified atmosphere (5% CO2, 95% air). 3T3-L1 cells were transfected with pcDNA3.1(+)-GALNT5 overexpression plasmid or siRNA when grown to 70~80% confluency using Lipofectamine 3000 (Invitrogen, Carlsbad, CA, USA) according to the manufacturer’s instruction. RT-qPCR and Oil Red O (ORO) staining were performed on the transfected cells. Lipid droplet generation of 3T3-L1 cells and sections were visualized using Oil Red O (Beyotime, Shanghai, China) staining.

2.8. RT-qPCR

The total RNA used for above transcriptome analysis was also used for RT-qPCR. The cDNA was synthesized using a Primescript RT Mix Kit with gDNA Clean (Accurate Biotechnology, Changsha, China), and the resultant cDNA was stored at −20 °C for mRNA and lncRNA expression analysis. Synthesis of the cDNA of miRNA was performed using a miRNA 1st strand cDNA synthesis kit (Accurate Biotechnology, Changsha, China) according to the manufacturer’s protocol. Specific primers of DE mRNAs and DE ncRNAs were designed based on the gene sequences of pigs reported in GenBank using DNAMAN 8.0 and synthesized by Shanghai Bioengineering Co., Ltd., Shanghai, China.
The qPCR for mRNAs and lncRNAs was conducted by mixing 10 μL of 2×SYBR Green Pro Taq HS Premix (Accurate Biotechnology, Changsha, China), 0.4 μL of each primer (forward and reverse, Table S3), 100 ng of cDNA template and RNase free water up to 20 μL and run on a Light Cycler 96 real-time PCR system (Roche, Basel, Switzerland) with the following program: 95 °C for 30 s, followed by 40 cycles of denaturation at 95 °C for 5 s and annealing and extension at gene-specific temperature (Table S3) for 30 s. The qPCR for miRNA was conducted by mixing 10 μL of 2X SYBR Green Pro Taq HS Premix II (Accurate Biotechnology, Hunan, China), 0.4 μL of miRNA specific primer (Table S3), 0.4 μL miRNA qPCR 3′ primer (Accurate Biotechnology, Changsha, China), 100 ng of cDNA template and RNase free water up to 20 μL and run on a Light Cycler 96 real-time PCR system (Roche, Basel, Switzerland) with the following program: 95 °C for 30 s, followed by 40 cycles of denaturation at 95 °C for 5 s and annealing and extension at annealing temperature (Table S3) for 30 s. The melting curves were obtained, and quantitative analysis of the data was performed using the 2−ΔΔCT relative quantification method [39]. The GAPDH and U6 were used as internal reference gene for the relative quantification of mRNA and lncRNA, and miRNA, respectively.

2.9. Statistical Analysis

Statistical analysis was performed using Mann–Whitney U test to compare the live weight and IMF content of LW and DLY pigs (n = 3). Statistical analysis was performed using Student’s t test to compare the mRNA expression level of the genes, each experiment was repeated four times, and at least three independent experiments were performed. The quantitative data were presented as the mean ± SEM and the p value below 0.05 is considered as significant. Correlation analysis and plot between RT-qPCR and RNA-seq was performed using GraphPad Prism 8.0. p value below 0.05 is considered as significant.

3. Results

3.1. Overview of the Transcriptome Sequencing Data of Porcine LD Muscles

At 150 d, the live weight of DLY pigs was significantly higher than that of LW pigs (p < 0.05, Figure 1A), while the IMF content in the LD muscle of DLY pigs was significantly lower than that of LW pigs (p < 0.05, Figure 1B). Oil red O staining showed that the Longissimus dorsi muscle of LW pigs contained higher fat deposition than that of DLY pigs (Figure 1C) and immunohistochemical analysis showed that there were a large number of F59 (fast/type2/glycolytic) myofibers and less F46 (slow/type1/oxidative) myofibers in the muscle tissue of DLY pigs compared to LW pigs (Figure 1D). Three LD muscle tissue samples collected from each of these LW and DLY pigs were used for transcriptome sequencing to identify genes underlying IMF variation and meat quality traits. For each sample, an average of 114.66 million paired-end clean reads and 11.46 Gb of clean data were produced for mRNA and lncRNA cDNA libraries on DNBseq platform. All six samples had at least 90.68% reads equal to or exceeding Q30 and the clean reads ratio of each sample was greater than 92.93% after removing adapters, low quality reads and data containing N, and the total mapping ratio of each sample was greater than 92.38% (Table 1). For miRNA sequencing, an average of 23.89 million clean tag counts of miRNA cDNA libraries were obtained for each LD sample, with more than 98.5% equal to or exceeding Q20, and the total mapping ratio of each sample was greater than 89.07% (Table 2). Furthermore, a total of 30,681 expressed genes were mapped to pig genome, including 20,727 mRNAs, 6702 lncRNAs and 3252 miRNAs. These sequence data were uploaded to NCBI with the accession number PRJNA815878.

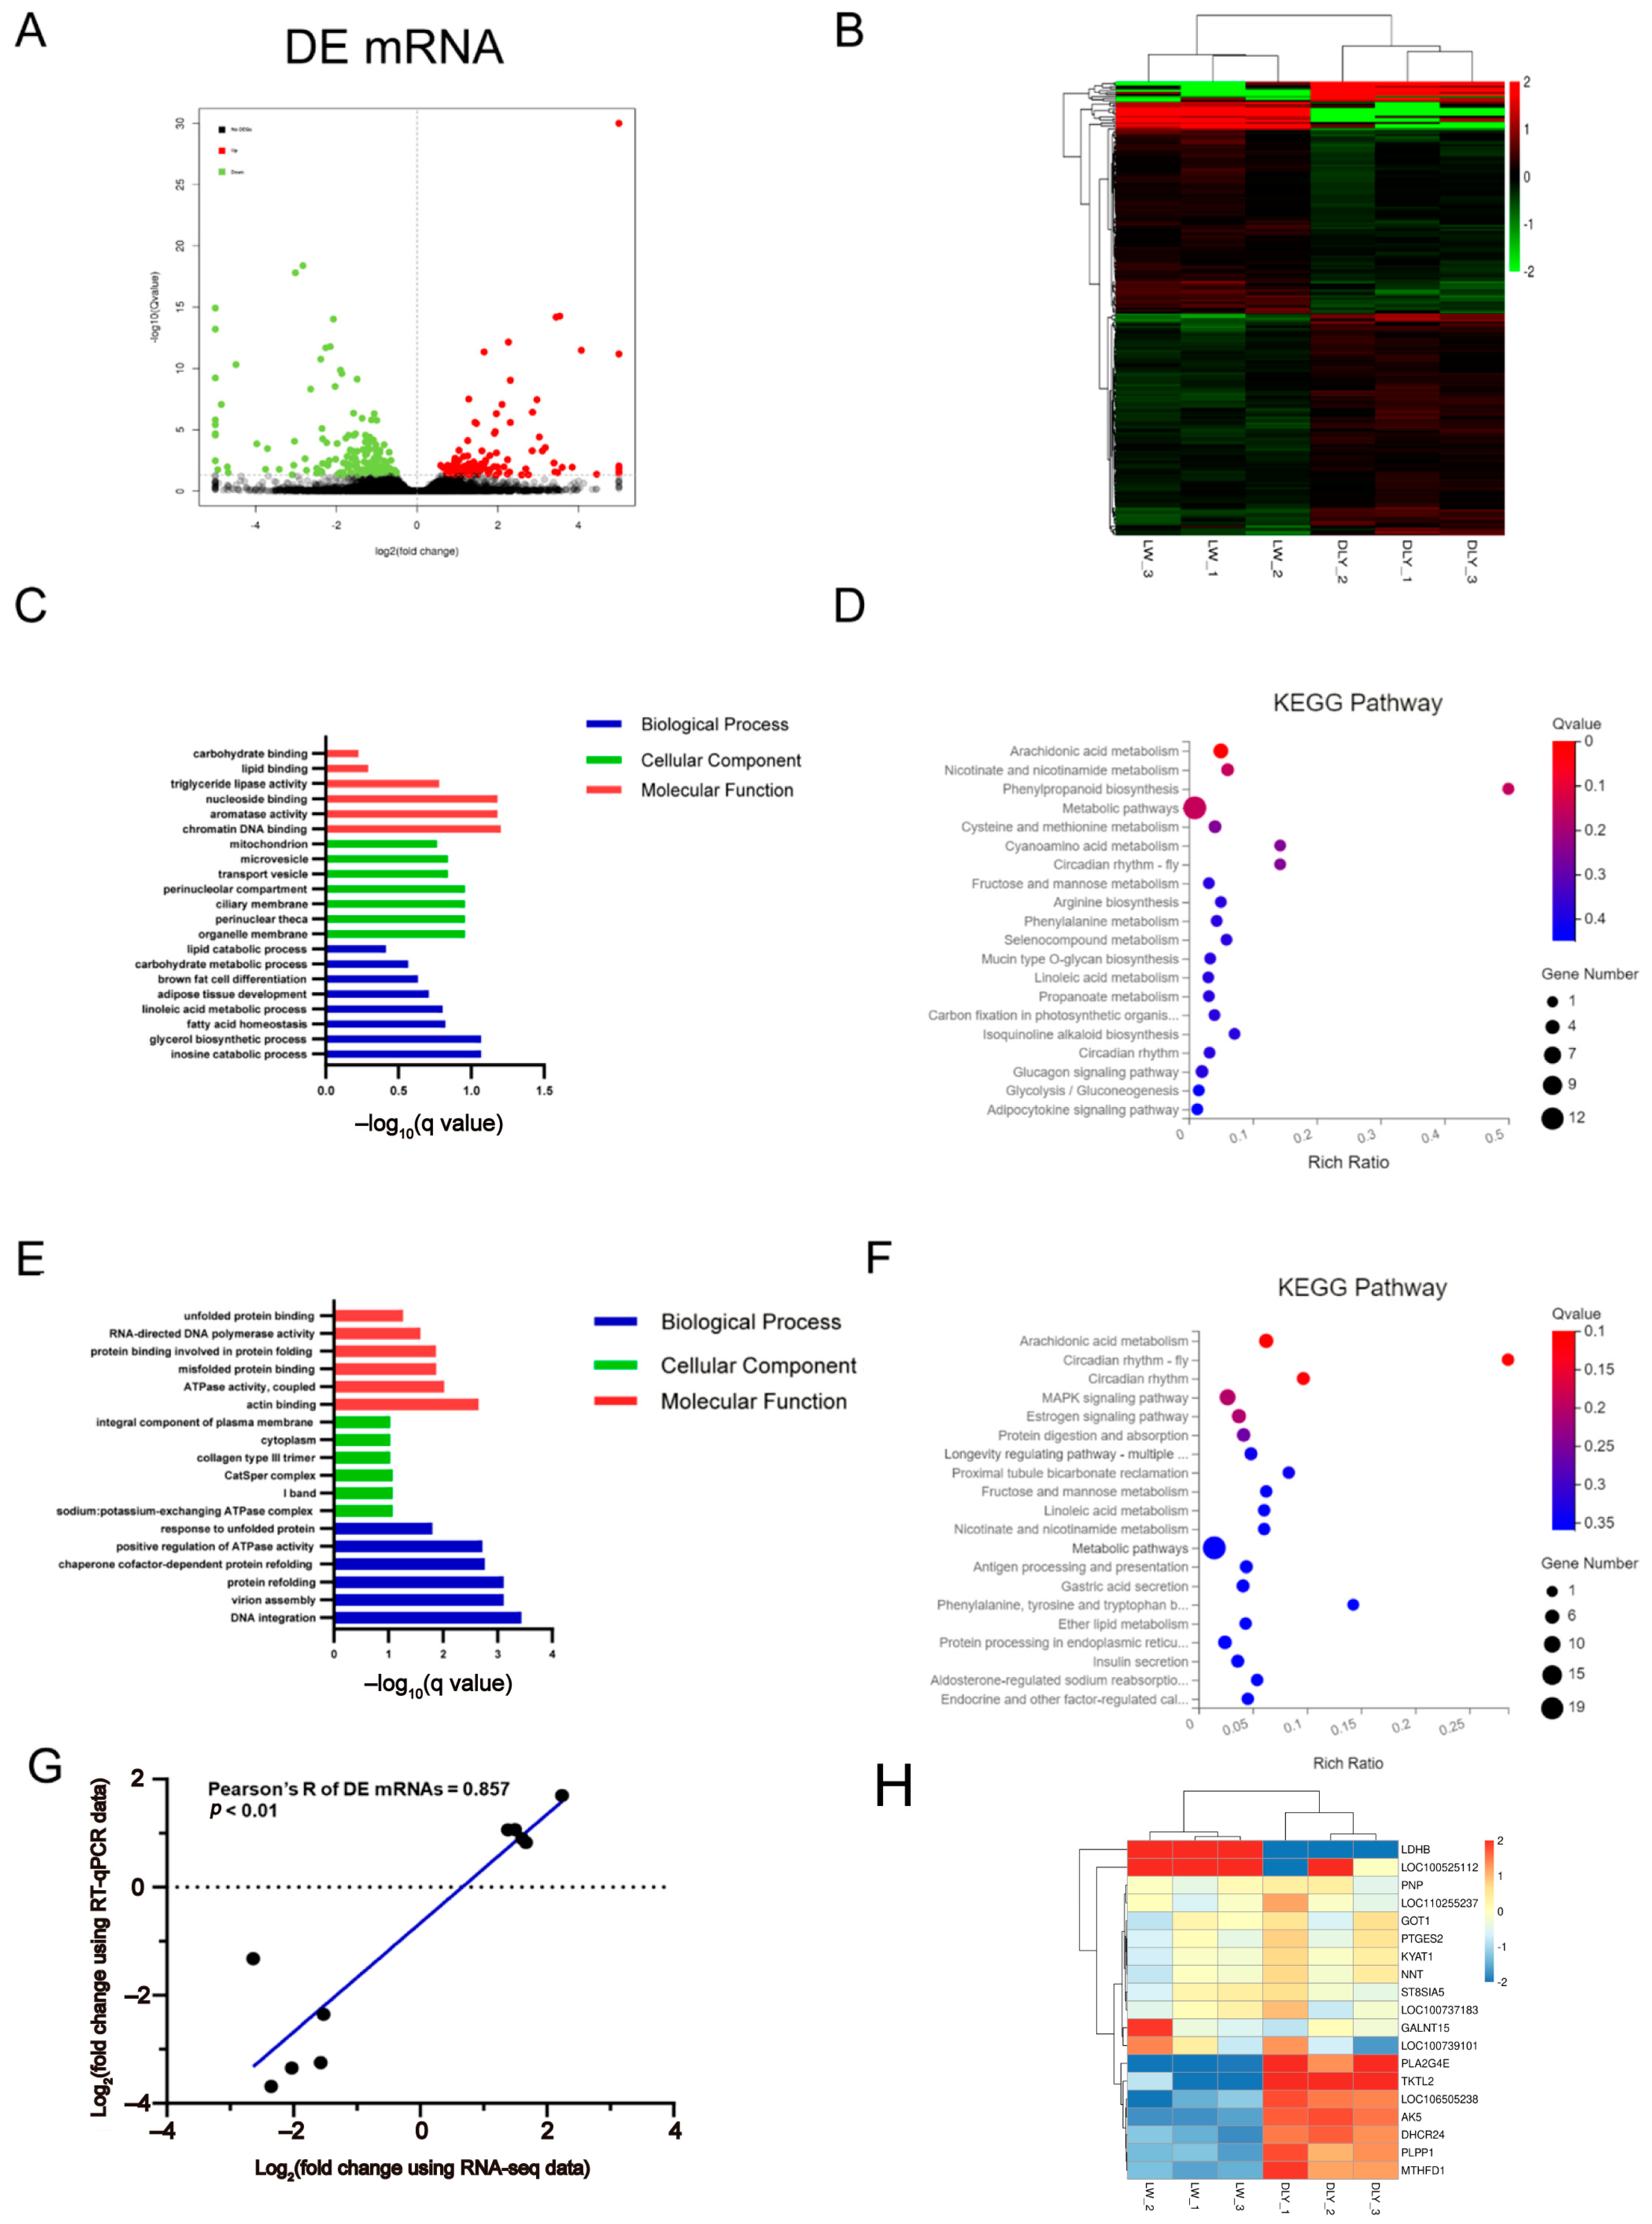
3.2. Differentially Expressed mRNAs in the LD Muscle between LW and DLY Pigs

Compared with DLY pigs, a total of 225 differentially expressed (DE) mRNAs (105 upregulated and 120 downregulated) were revealed in the LD muscle of LW pigs (Figure 2A). According to the q value threshold of <0.05 and log2 (foldchange) > 3, the upregulated and downregulated DE mRNAs in the LD muscle of LW pigs were shown in Table 3 and Table 4, respectively. The greatest fold change in mRNA expression was LDHB (upregulated) (Table 3) and LOC110258854 (downregulated) (Table 4), respectively. According to the expression level, all of the DE mRNAs in porcine LD muscle were clustered in two clades of LW and DLY as visualized by the heatmap plot (Figure 2B). The upregulated and downregulated DE mRNAs between LW and DLY pigs were further analyzed by GO and KEGG pathway approaches. For the upregulated DE mRNAs expressed in the LD muscle of LW pigs, GO terms were mainly enriched in chromatin DNA binding, nucleoside binding and aromatase activity, organelle membrane, glycerol biosynthetic process, inosine catabolic process and fatty acid homeostasis (Figure 2C), and KEGG pathways were related to processes required for metabolic pathways, glucagon signaling and adipocytokine signaling pathways (Figure 2D). For the downregulated DE mRNAs expressed in the LD muscle of LW pigs, GO terms were mainly enriched in actin-binding and DNA integration (Figure 2E), and KEGG pathways were related to processes required for metabolic pathways and MAPK signaling pathway (Figure 2F). Ten of the randomly selected DE mRNAs were validated by RT-qPCR, showing a significant correlation of 0.857 (p < 0.01) (Figure 2G). Metabolic pathway plays a critical role in skeletal muscle contraction, development and IMF deposition [40]. The DE mRNAs enriched into metabolic pathways include PTGES2, PNP, GALNT15, KYAT1, NNT, LDHB, ST8SIA5, GOT1, PLA2G4E, PLPP1, TKTL2, DHCR24, MTHFD1, AK5, LOC106505238, etc. (Figure 2H).
A network of protein–protein interactions (PPI) was constructed to reveal the interactions among DE mRNA genes. The highest number of interactions was observed for estrogen related receptor alpha (ESRRA) in upregulated DE mRNAs in the LW pigs. For the downregulated DE mRNAs in LW pigs, the highest number of interactions was observed for versican (VCAN) and proenkephalin (PENK) (Figure 3A). As is predicted by the ingenuity pathway analysis (IPA), ESRRA and VCAN were regulated by peroxisome proliferative activated receptor, gamma, coactivator 1 alpha (PPARGC1A), whereas FKBP prolyl isomerase 5 (FKBP5) was regulated by vascular endothelial growth factor (VEGF) family and growth hormone (Figure 3B).

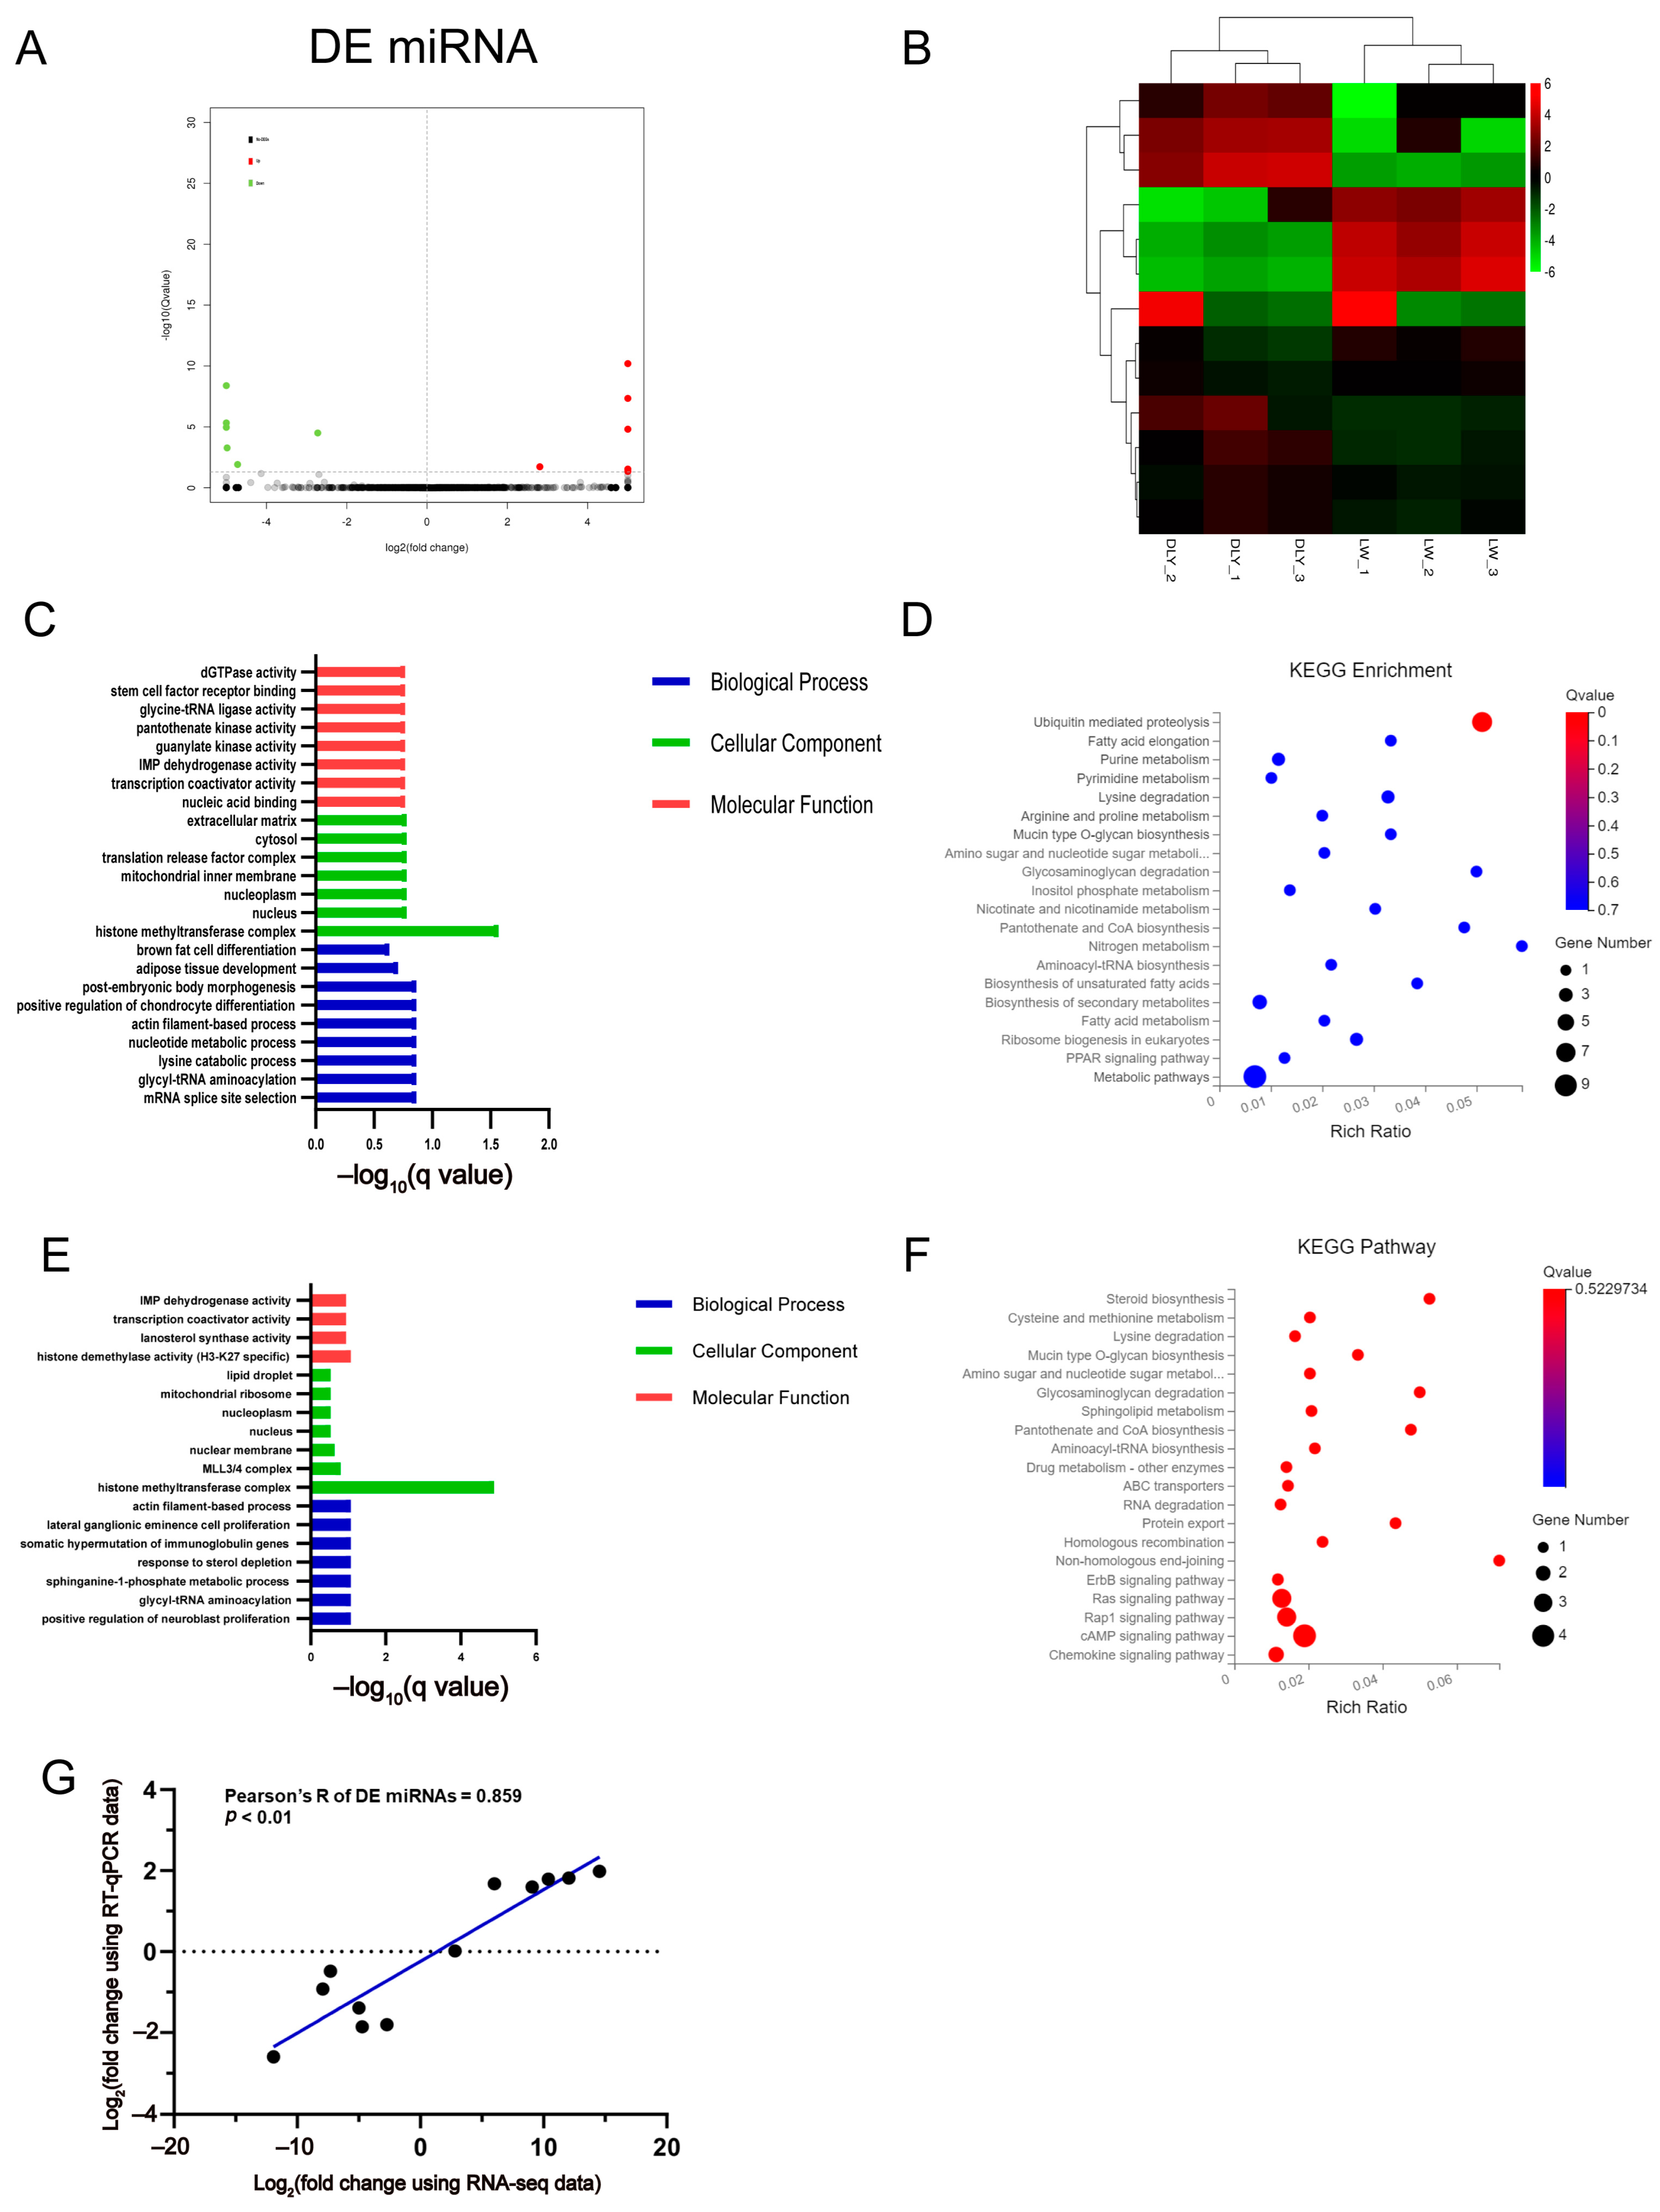
3.3. Differentially Expressed miRNAs in the LD Muscle between LW and DLY Pigs

Six upregulated and six downregulated DE miRNAs were identified in the LD muscles of LW pigs compared to DLY pigs (Figure 4A) and were clustered into two clades of LW and DLY pigs, respectively (Figure 4B). The greatest fold change in miRNA expression was ssc-miR1379-5p (upregulated) and ssc-miR204-5p (downregulated), respectively, and all of the DE miRNAs in porcine LD muscle are shown in Table 5 and Table 6. Predictive analysis using the ncRNA targeting database revealed 341 target genes of DE miRNAs, among which 208 genes were targeted by upregulated miRNAs and 212 genes by downregulated miRNAs, and 79 genes were overlapped. GO and KEGG enrichment analysis on these genes indicated that they were mainly enriched in histone methyltransferase complex (Figure 4C), metabolic pathways (Figure 4E) and ubiquitin mediated proteolysis (Figure 4D), and cAMP, RAP1 and Ras signaling pathways (Figure 4F). All of the DE miRNAs were validated by RT-qPCR, showing a significant correlation of 0.859 (p < 0.01) (Figure 4G).

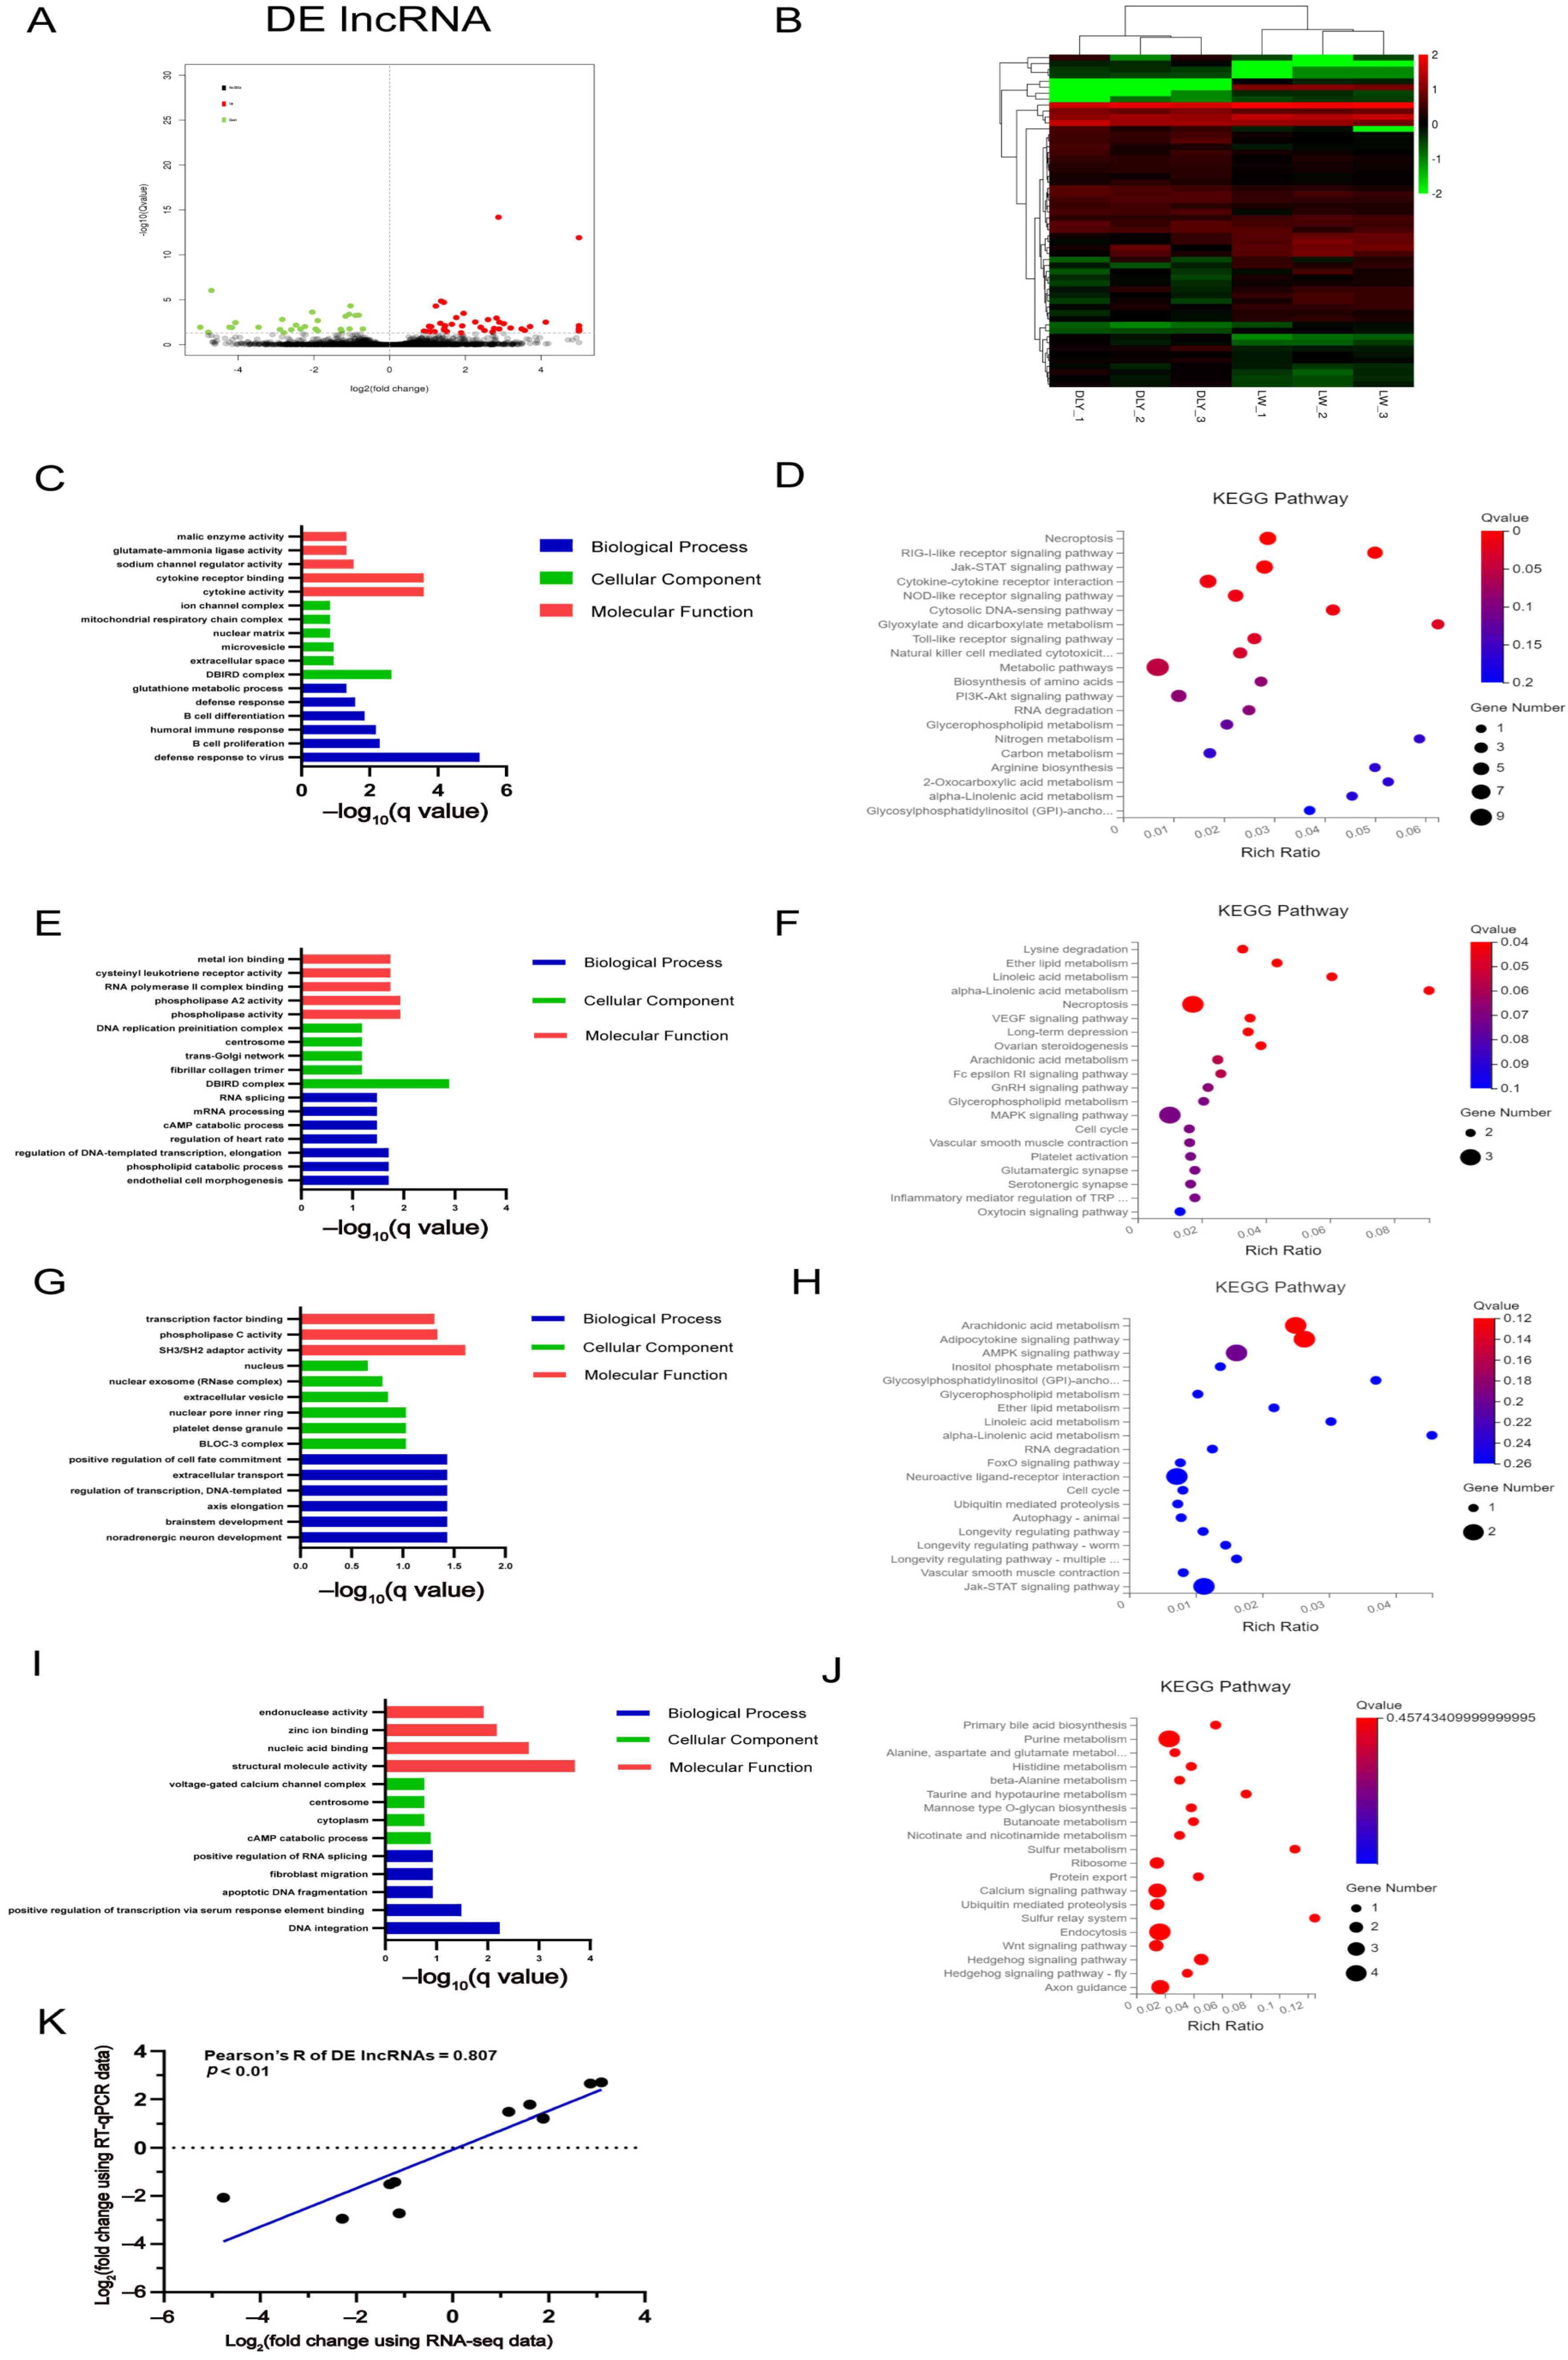
3.4. Differentially Expressed lncRNAs in the LD muscle between LW and DLY Pigs

A total of 57 DE lncRNAs, 32 upregulated and 25 downregulated, were identified in the LD muscles of LW pigs compared to DLY pigs (Figure 5A) and were clustered into two clades of LW and DLY pigs, respectively (Figure 5B). The greatest fold change in lncRNA expression was LOC110257307 (upregulated) and LOC110259141 (downregulated), respectively; and all of the DE lncRNAs in porcine LD muscle are shown in Table 7 and Table 8. Furthermore, 239 genes targeted in cis by DE lncRNAs were predicted, including 139 genes targeted by upregulated DE lncRNAs and 111 genes targeted by downregulated lncRNAs (11 genes were overlapped). A total of 163 genes targeted in trans by DE lncRNAs were predicted, including 40 genes targeted by upregulated DE lncRNAs and 123 genes targeted by downregulated DE lncRNAs.
GO and KEGG analysis revealed that defense responses to virus (Figure 5C) and metabolic pathways (Figure 5D) were mainly enriched by cis targeted genes of DE lncRNAs upregulated in LW pigs. DBird complex (Figure 5E) and necroptosis and MAPK signaling pathways (Figure 5F) were mainly enriched by cis targeted genes of DE lncRNAs downregulated in LW pigs. SH3/SH2 adaptor activity (Figure 5G) and adipocytokine signaling pathway and JAK-STAT signaling pathway (Figure 5H) were mainly enriched by trans targeted genes of DE lncRNAs upregulated in LW pigs. Structural molecule activity (Figure 5I) and purine metabolism and endocytosis (Figure 5J) were mainly enriched by trans targeted genes of DE lncRNAs downregulated in LW pigs. Ten of the randomly selected DE lncRNAs were validated by RT-qPCR, showing a significant correlation of 0.807 (p < 0.01) (Figure 5K).

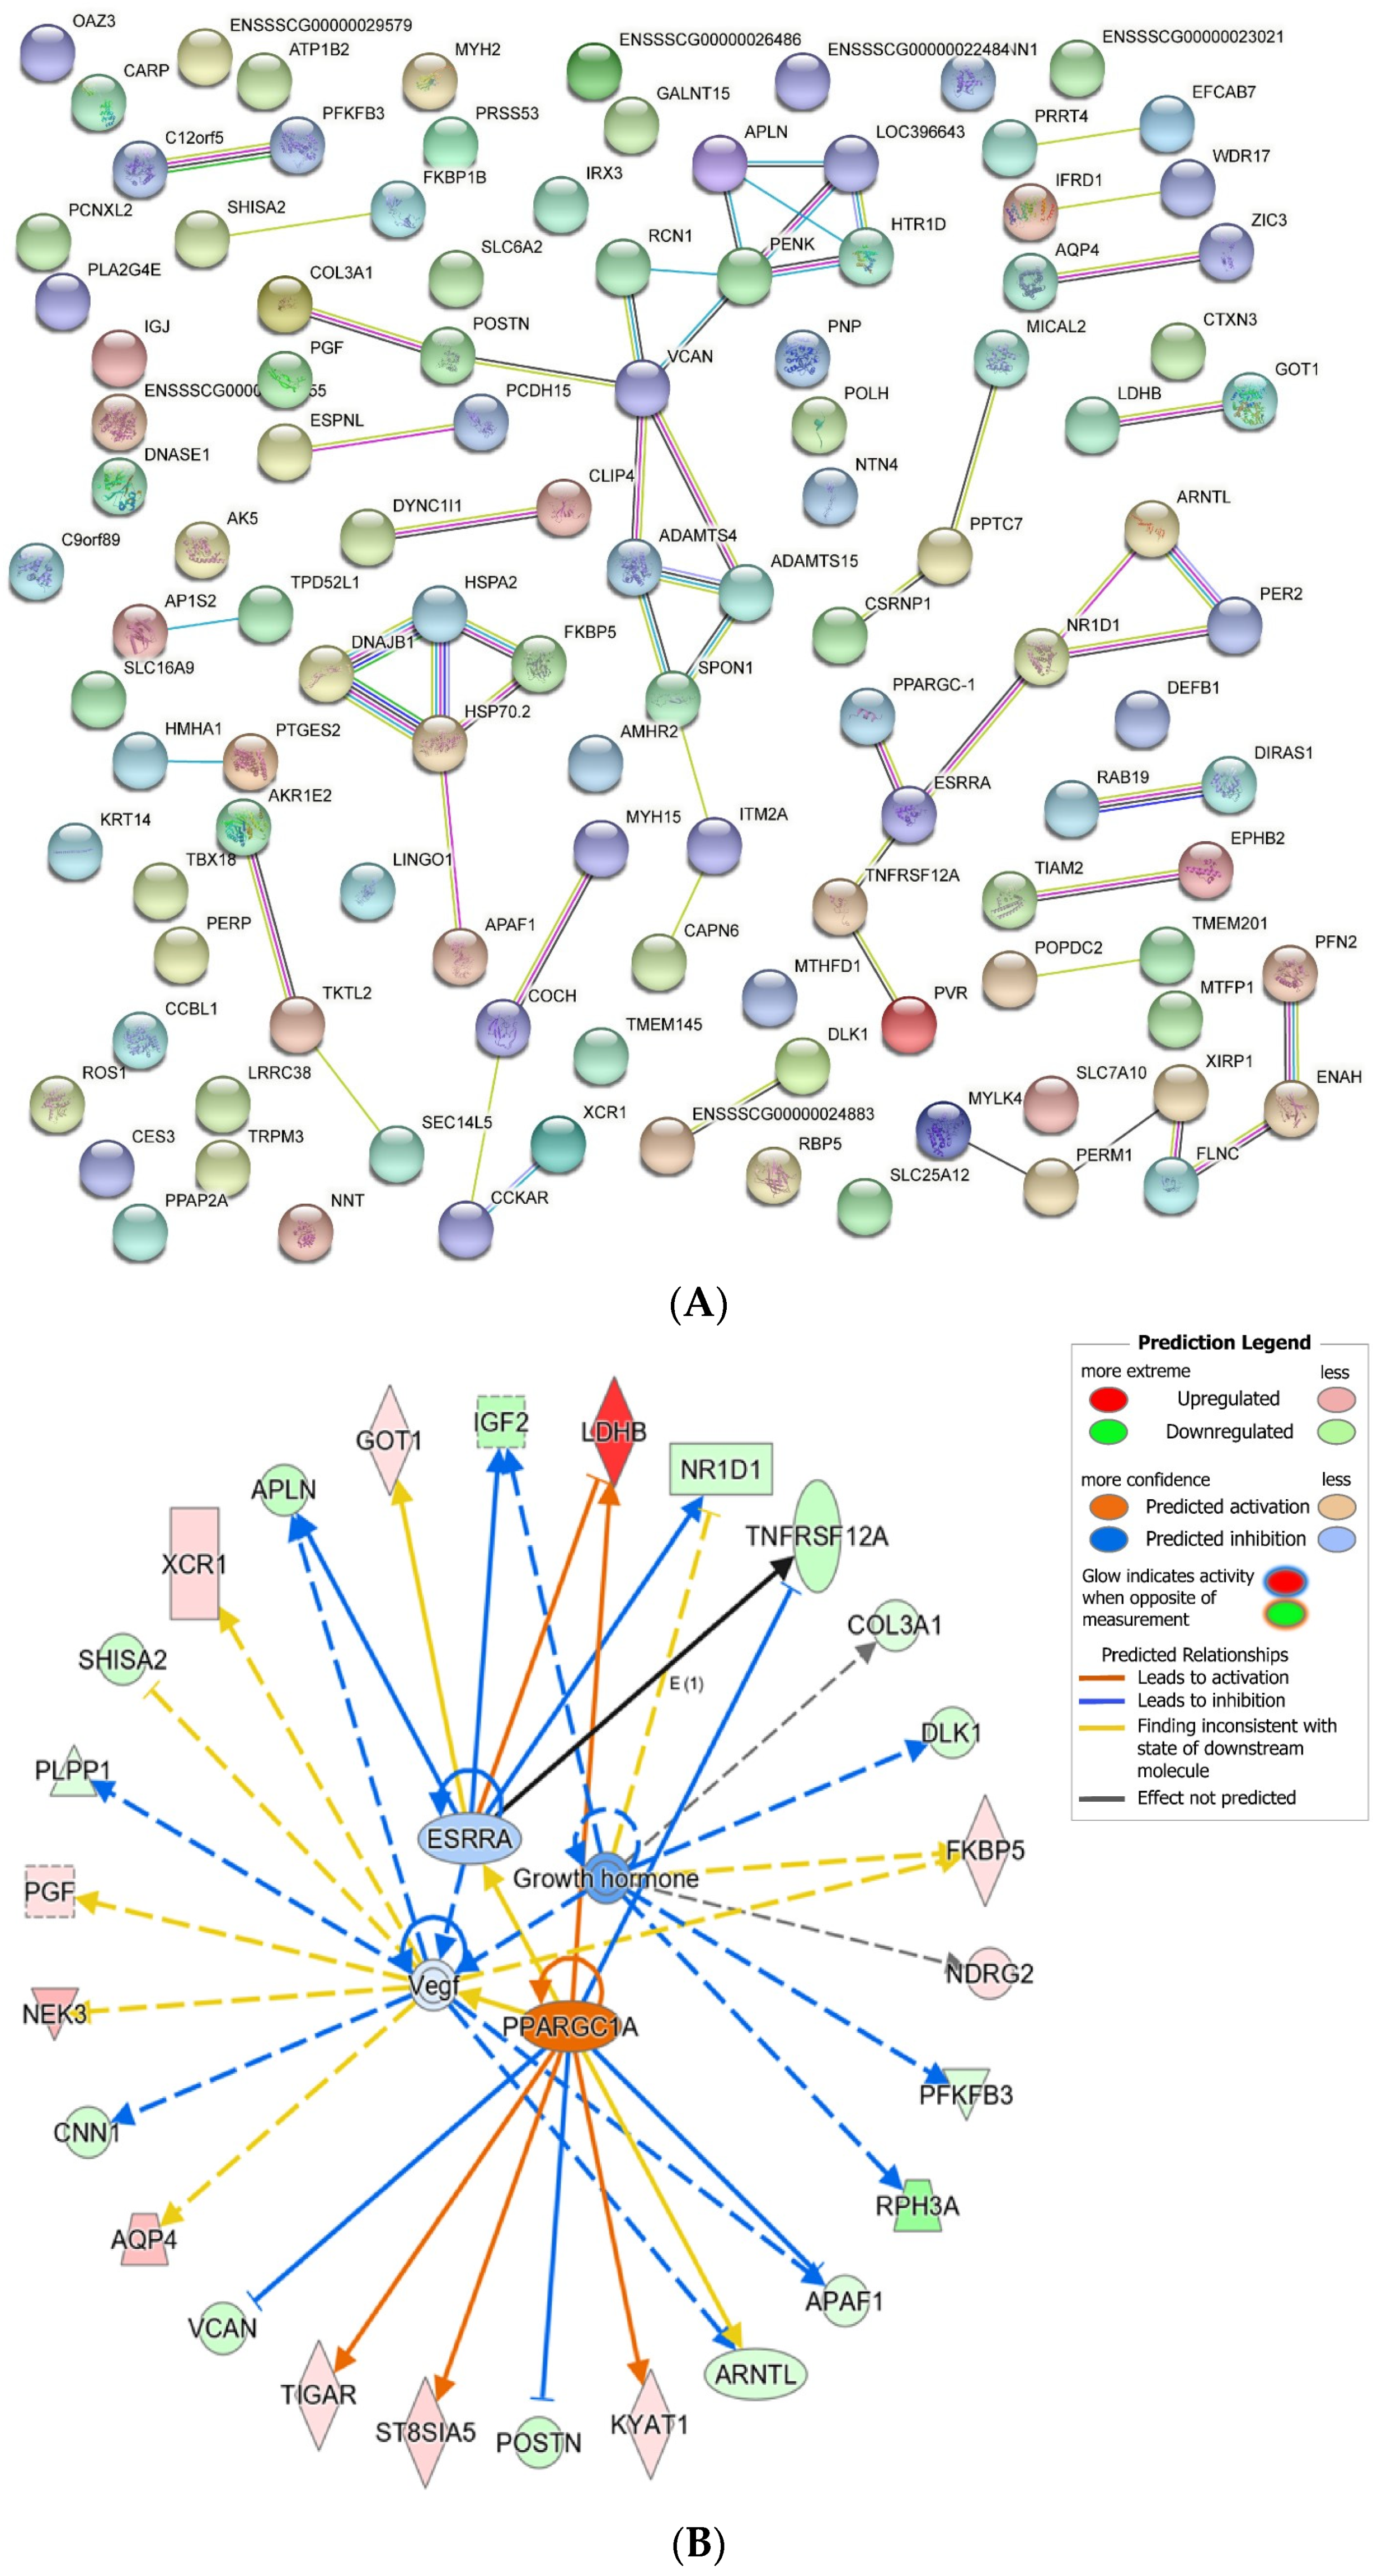
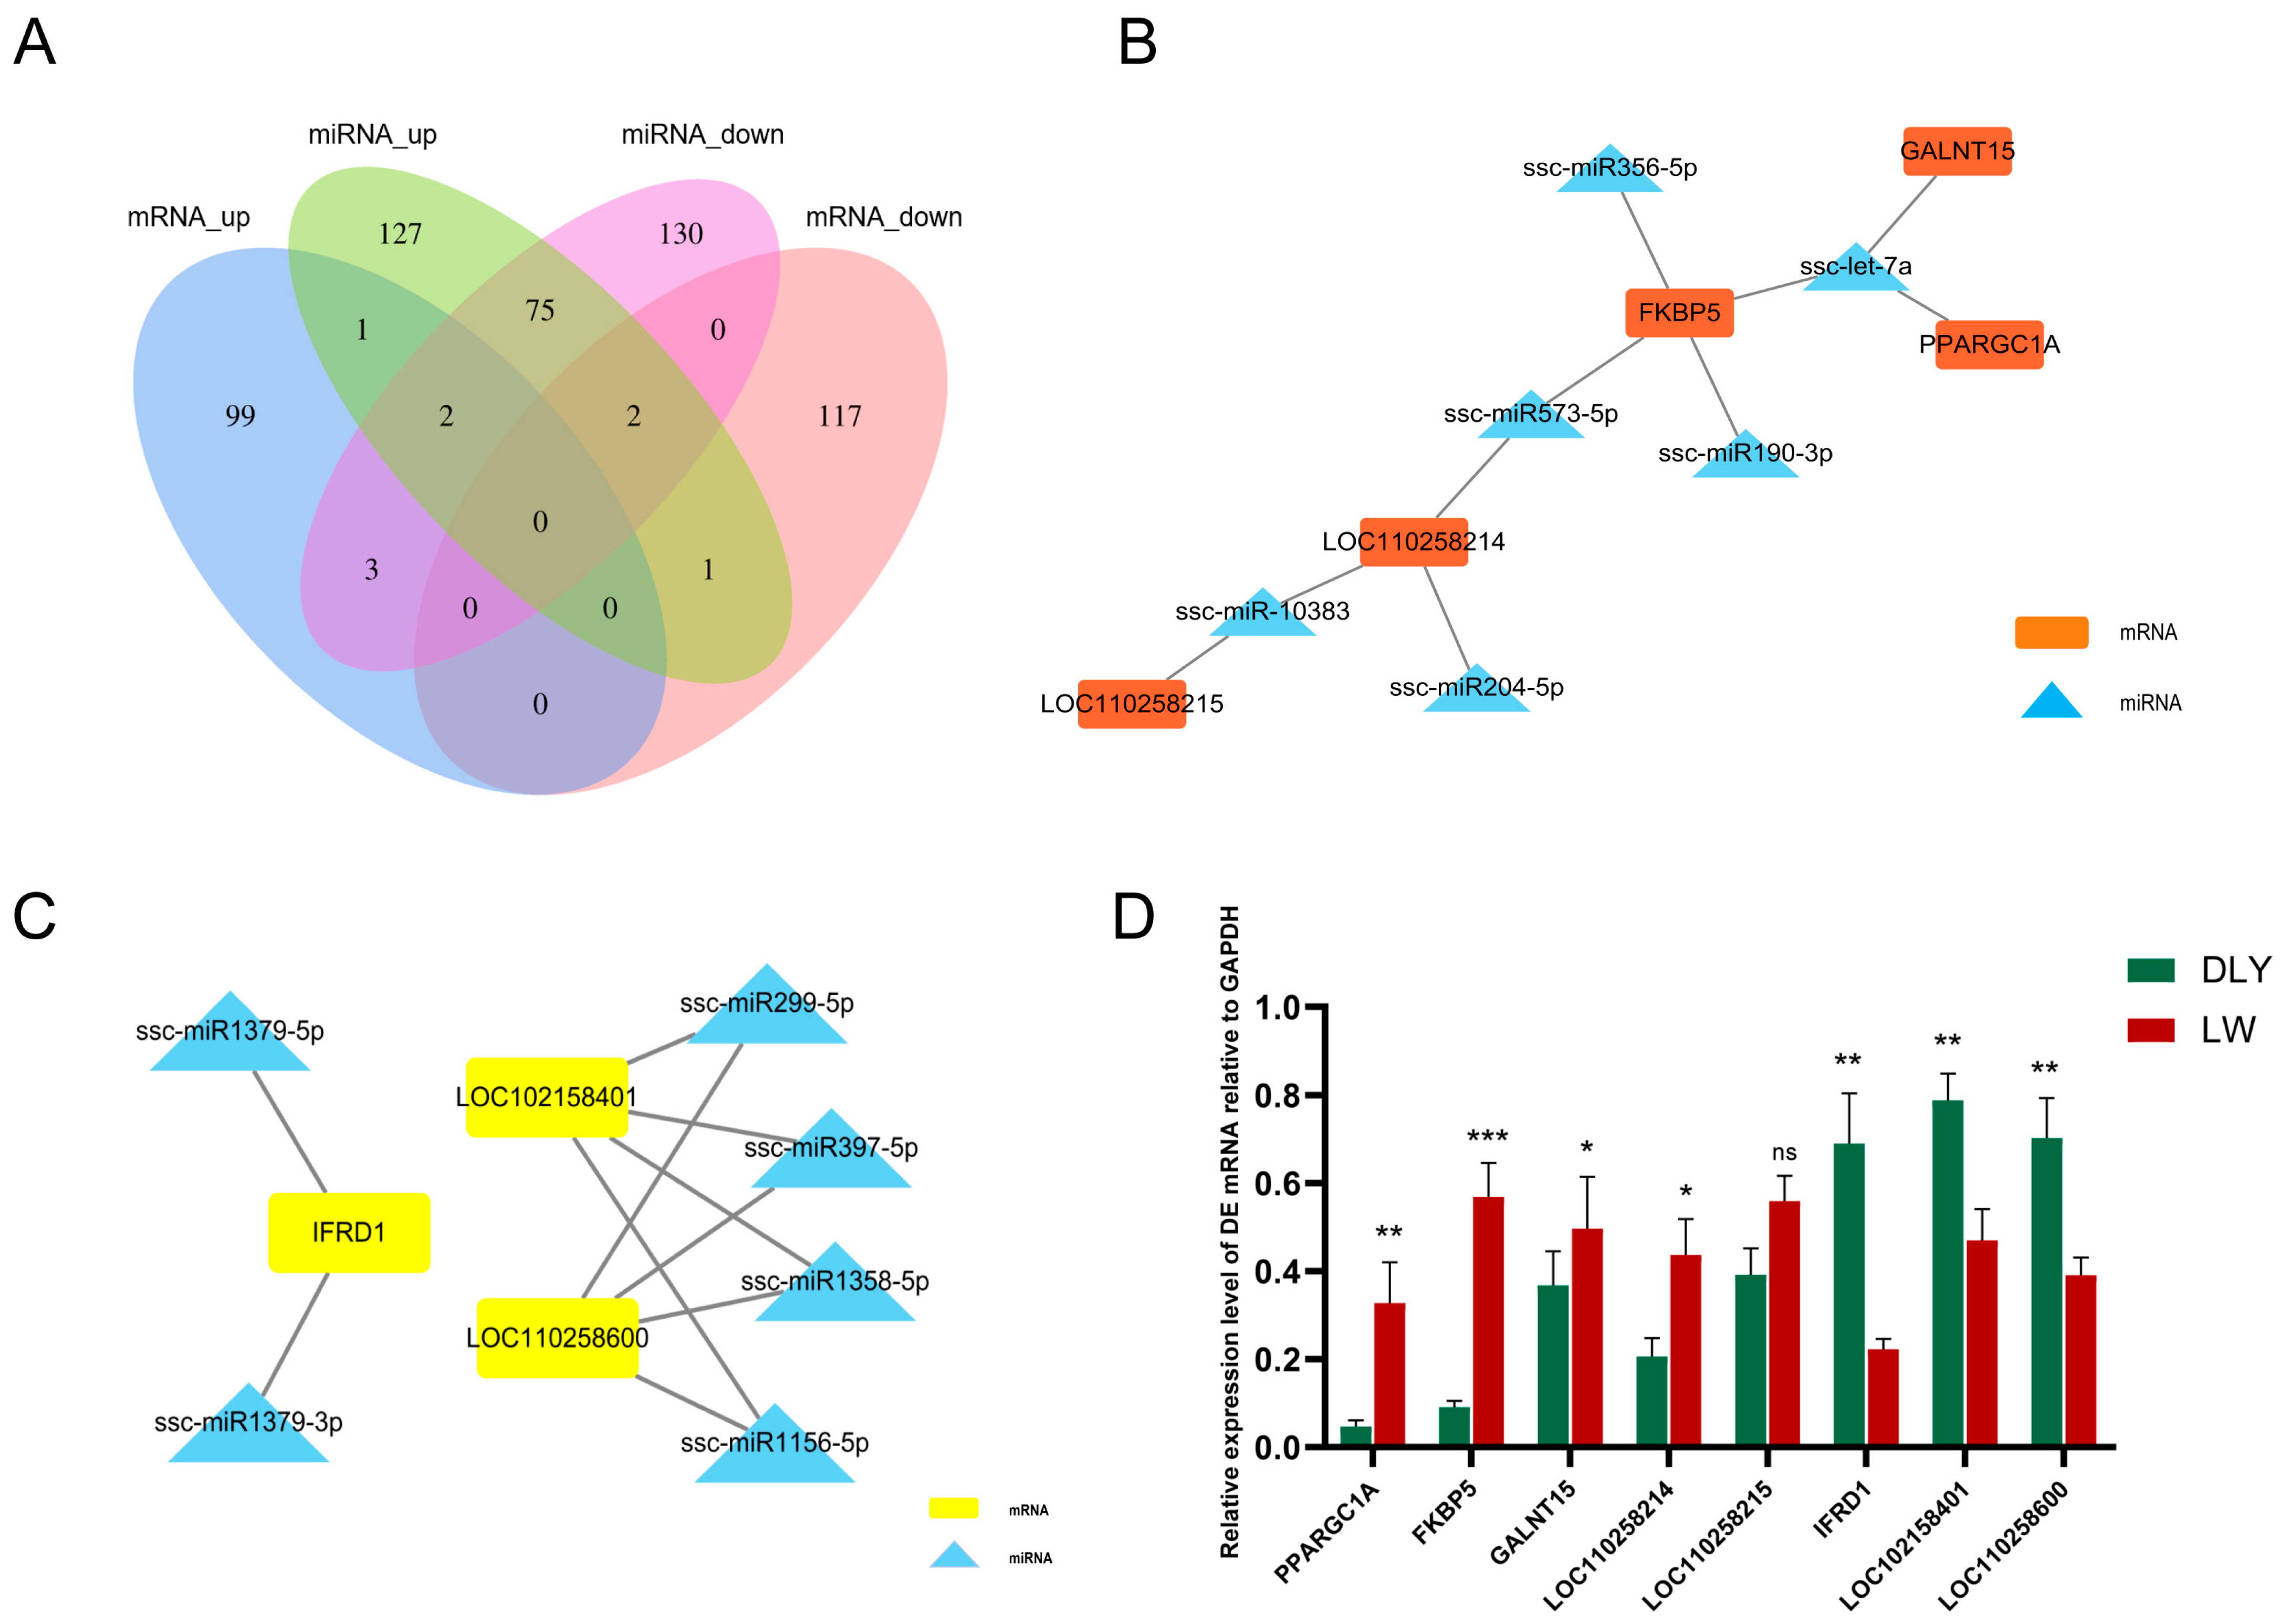
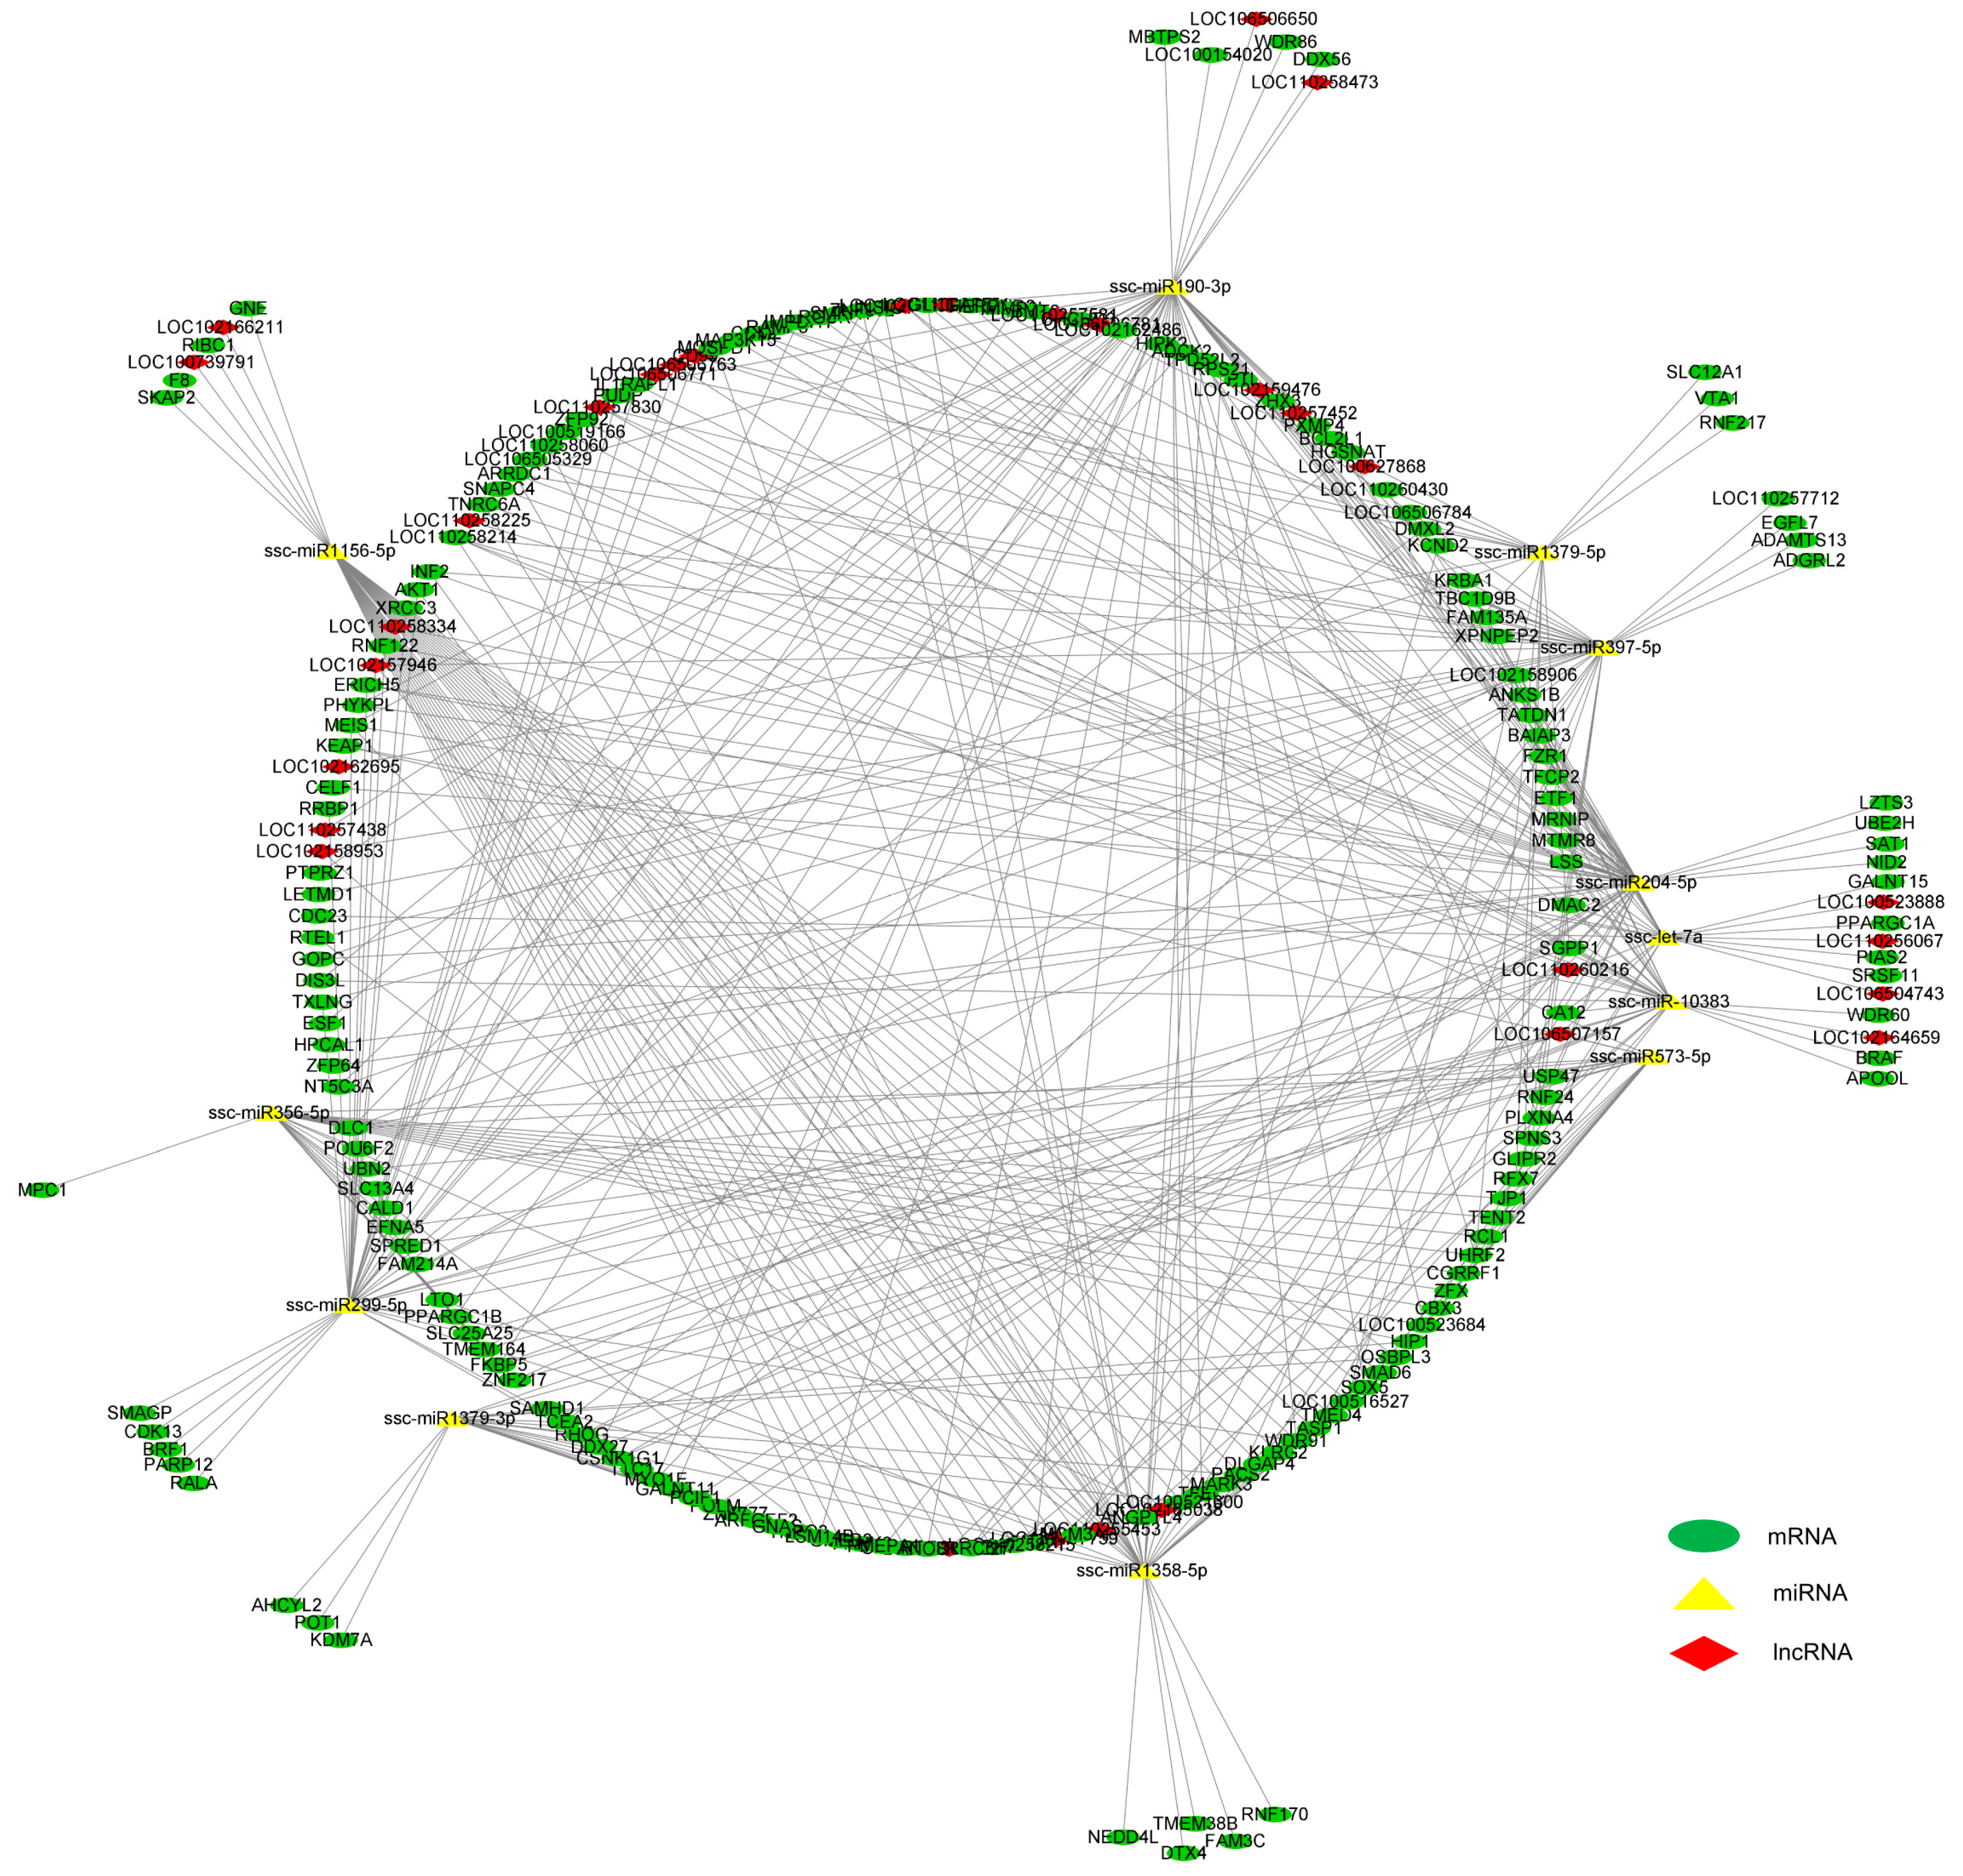
3.5. Integrated Analysis on DE mRNAs, miRNAs, and lncRNAs in the LD Muscle between LW and DLY Pigs

The mRNA-miRNA regulatory networks were constructed according to gene expression patterns in the LD muscle of LW pigs: “mRNA up-miRNA down” and “mRNA down-miRNA up”. Five upregulated mRNA genes, including GALNT15, FKBP5, PPARGC1A, LOC110258214 and LOC110258215, and six downregulated miRNA genes, including ssc-let-7a, ssc-miR190-3p, ssc-miR356-5p, ssc-miR573-5p, ssc-miR204-5p, and ssc-miR-10383, formed one regulatory network (Figure 6A,B). Three downregulated DE mRNA genes, including IFRD1, LOC110258600 and LOC102158401, and six upregulated DE miRNAs, including ssc-miR1379-3p, ssc-miR1379-5p, ssc-miR397-5p, ssc-miR1358-5p, ssc-miR299-5p and ssc-miR1156-5p, formed another network (Figure 6A,C). The expression changes of these mRNA (Figure 6D) and miRNA genes (Figure 4G) in the LD muscle between LW and DLY pigs were validated by RT-qPCR. Based on the mRNA and ncRNA binding site targeting database, we constructed a regulatory network with miRNA as the center and mRNA and lncRNA as the target genes (Figure 7), forming a ceRNA network in the LD muscles that are differentially expressed between LW and DLY pigs.

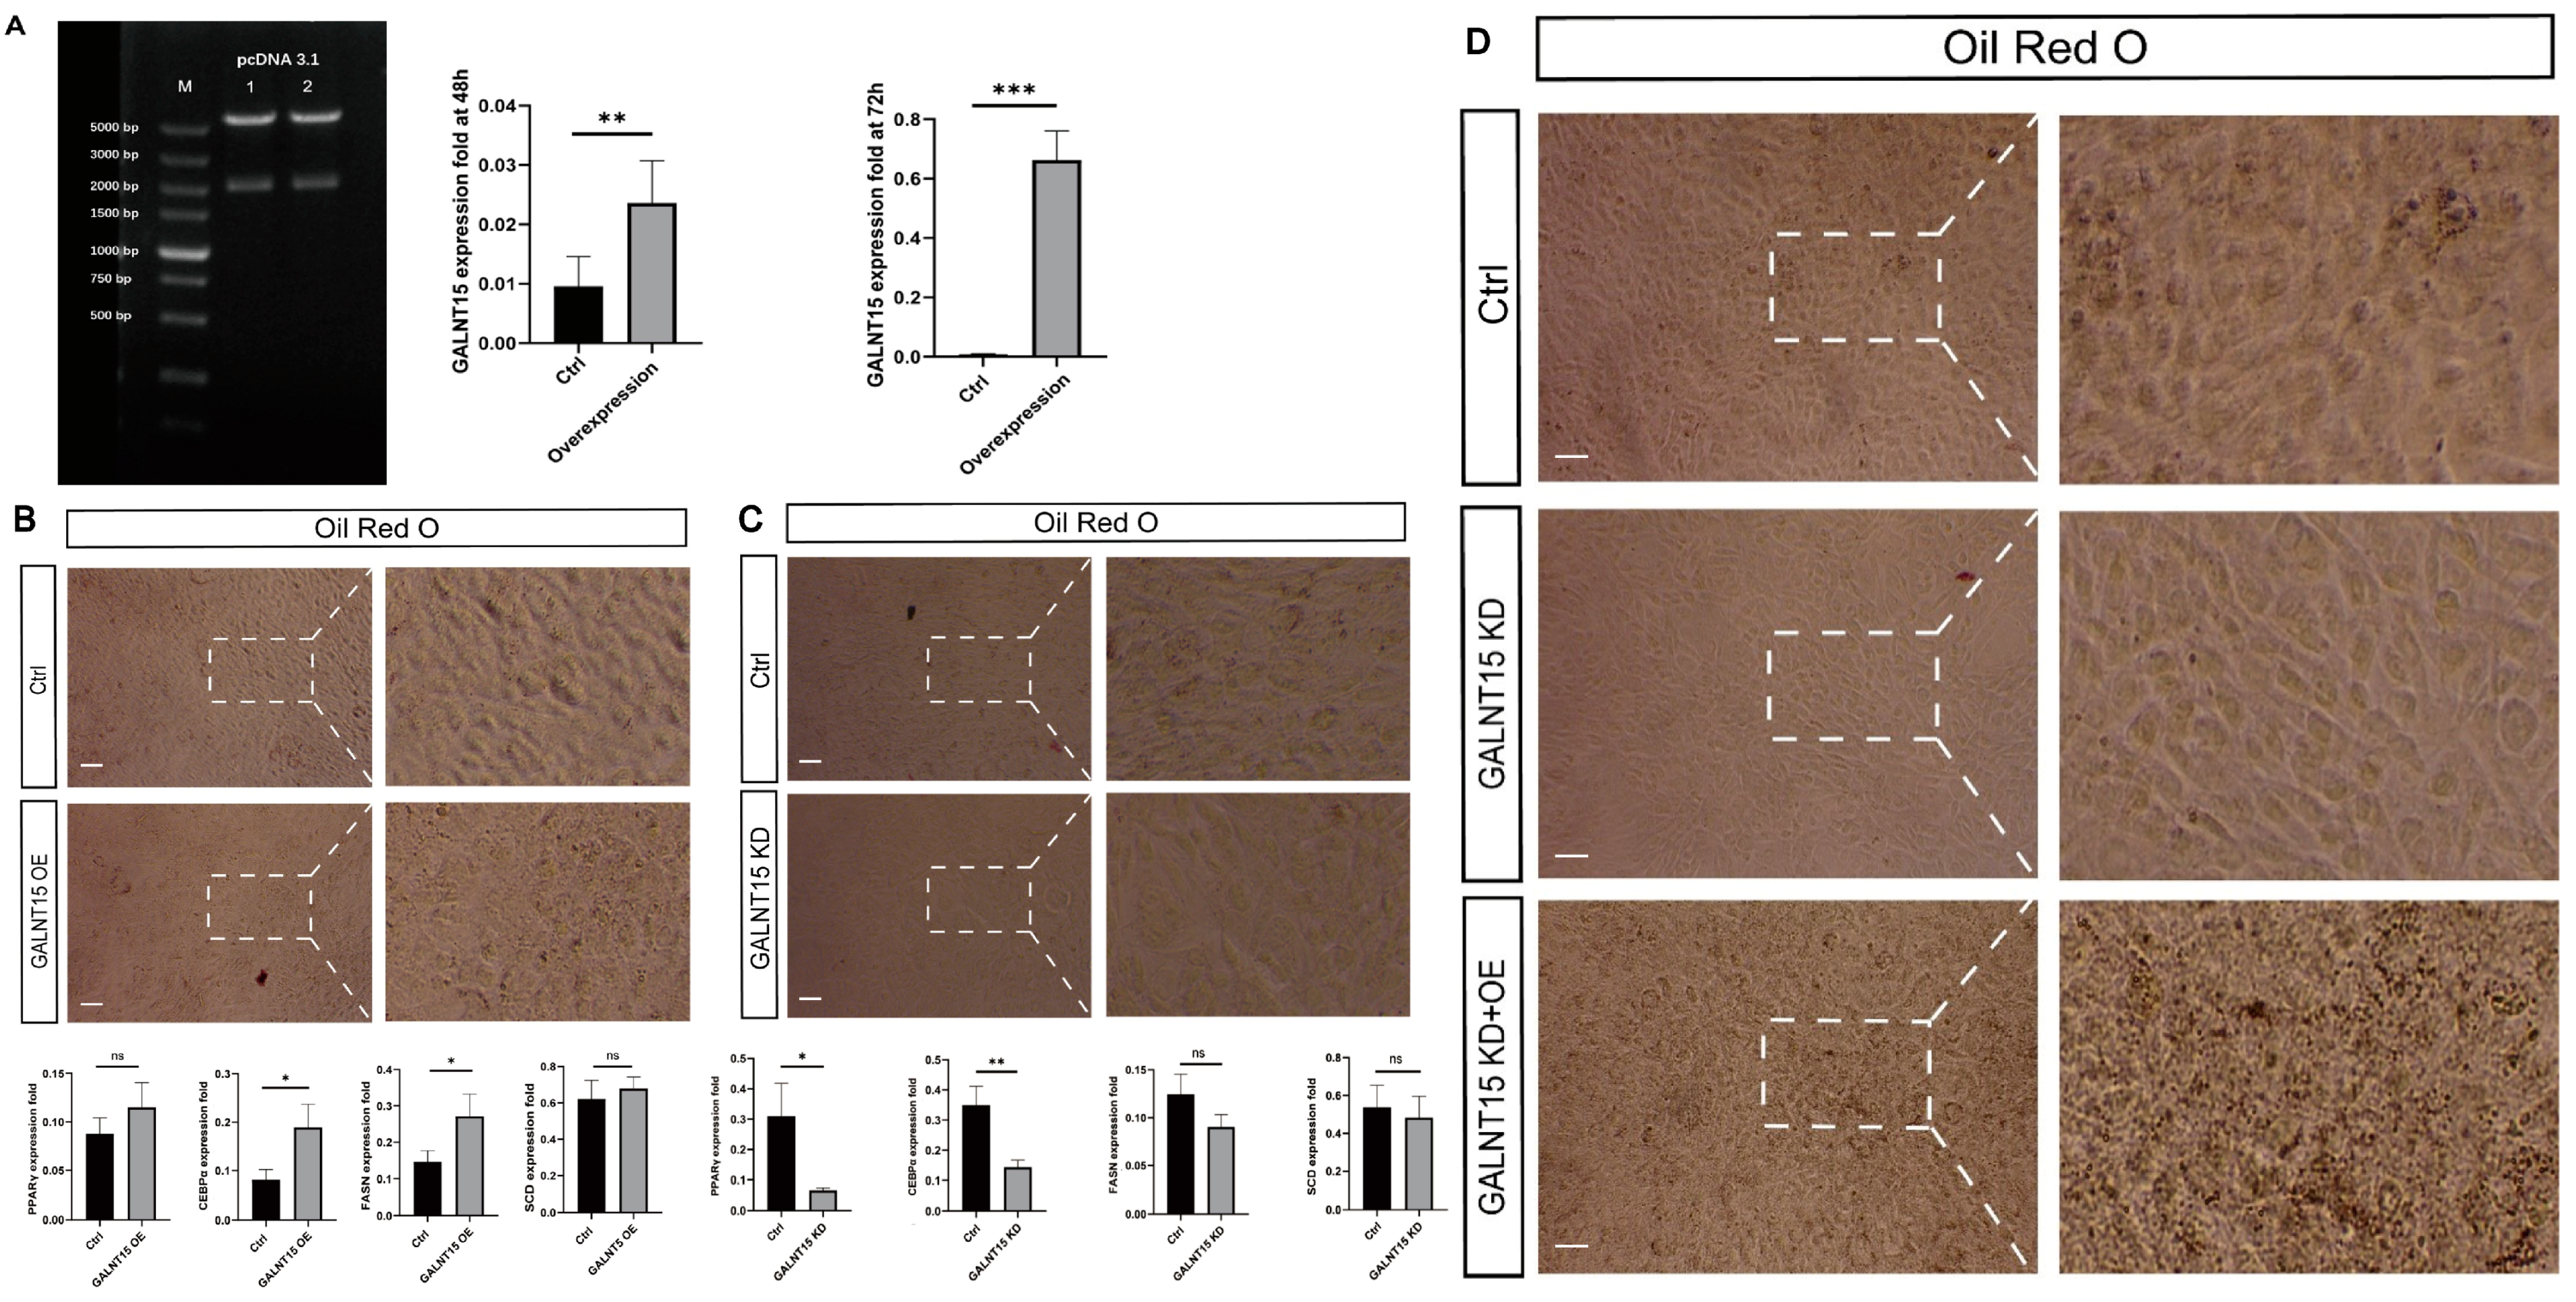
3.6. The Role of GALNT15 in Lipid Deposition

By prediction, GALNT15, PPARGC1A and FKBP5, are targets of ssc-let-7a (Figure 6B), among which the role of PPARGC1A and FKBP5 in lipid deposition has been confirmed [41,42]. We further tested the role of GALNT15 in lipid deposition. 3T3-L1 cells transfected with overexpression vector pcDNA3.1(+)-GALNT15 showed increased expression of GALNT15 (Figure 8A), more cells containing oil droplets and significantly upregulated mRNA expression of adipogenic marker genes CEBPα and FASN (Figure 8B). Knockdown (KD) of GALNT15 dramatically downregulated the level of oil droplets in 3T3-L1 cells and the mRNA expression of adipogenic marker genes (PPARγ, CEBPα, FASN and SCD) (Figure 8C), while overexpression of GALNT15 in these cells recovered the oil droplet level. (Figure 8D). These results indicated that GALNT15 plays a positive role in the process of lipid deposition.

4. Discussion

Analysis of transcriptome profiling of mRNA and noncoding RNA is more and more widely used as a strategy to investigate the mechanism of IMF deposition and muscle development [43]. IMF is the total lipid associated with all cells present in a meat tissue, including extramyocellular lipids and intramyocellular lipids [44]. We found that, at 150d, the IMF of the Longissimus dorsi muscle between LW and DLY pigs was different, and LW pigs had more IMF content and slow myofibers and less fast myofibers in the LD muscle. Studies suggest that the difference in IMF is caused by differences in transcript abundance of genes [45], and there is a significant positive correlation between the content of IMF and the expression of lipid metabolism genes [46]. Due to that IMF deposition greatly differs between fat- and lean-type pig breeds, in this study, to identify other genes especially noncoding RNA genes, we further systematically compared the transcriptomes of mRNA, miRNA and lncRNA in the LD muscle between LW and DLY pigs of 150 d, a time point when intramuscular fat is rapidly deposited in LW pigs [23].
Lean- and fat-type pigs exhibit various differences except IMF, which is caused by genetic background as well as other factors including nutrition and farm management. Omics comparisons between lean- and fat-type pigs were reported in several pig breeds [10,11,12,13,14]. To reveal genes underlying differences in IMF and other meat quality traits between LW and DLY pigs, the individuals of both breeds were sampled from the farms within the same region, and the pigs were reared with the same diet (crude protein 16.5% and digestive energy 13.63 MJ/Kg) and slaughtered at the same date (150 d). To control variations within groups, three individuals with similar live weight and IMF were used for transcriptome analysis. By using these samples with great difference in IMF between LW and DLY pigs, we identified differentially expressed mRNAs, miRNAs and lncRNAs genes that are related to IMF deposition and skeletal muscle development and constructed a regulatory network of these three types of genes, which provides resource data for further elucidating mechanisms underlying meat quality variations between lean- and fat- types of pigs.
Comparison of the mRNA transcriptome changes in the LD muscle between LW and DLY pigs identified 225 DE genes, with LDHB showing the greatest upregulation in LW pigs. LDHB encodes the B subunit of lactate dehydrogenase enzyme, which catalyzes the interconversion of pyruvate and lactate with concomitant interconversion of NADH and NAD+ in a post-glycolysis process [47]. Consistently, the mRNA expression of LDHB is significantly lower in Pietrain pigs than Duroc and Duroc–Pietrain crossbred pigs [48] and LDHB expression is positively correlated with IMF in pigs crossed by (Pietrain × Duroc) boars and (Landrace × Yorkshire) sows [49], suggesting an important role of LDHB in porcine fat deposition traits. KEGG enrichment analysis showed that the upregulated mRNAs were mainly enriched in metabolic pathways (PTGES2, PNP, GALNT15, KYAT1, NNT, LDHB, ST8SIA5, GOT1, LOC100525112, LOC100737183, LOC100739101, LOC110255237) and adipocytokine signaling pathways (PPARGC1A). GO enrichment analysis showed that the upregulated mRNAs were mainly enriched in glycerol biosynthetic process (GOT1) and fatty acid homeostasis (GOT1). Adipocytokine signaling is a crucial pathway for IMF deposition and lipid metabolism [50]. GOT1 (glutamic-oxaloacetic transaminase 1)-related pathways are glucose metabolism and metabolism. One recent study showed that GOT1 regulates adipocyte differentiation by altering NADPH content [51]. A recent study showed that PTGES2 (Prostaglandin E synthase 2) is essential for effective skeletal muscle stem cell function, augmenting regeneration and strength [52]. NNT (mitochondrial nicotinamide nucleotide hydrogenase) is the major enzyme that generates NADH in mitochondria, and catalyzes the transfer of a hydride between NADH and NADP+ [53]. KEGG enrichment analysis showed that the downregulated mRNA genes were mainly enriched in metabolic pathways (PLA2G4E, PLPP1, TKTL2, DHCR24, MTHFD1, AK5, LOC106505238) and the MAPK signaling pathway (PLA2G4E, FLNC, HSPA2, PFN2, HSP70.2, HSPA6, IGF2). It has been reported that the MAPK pathway is the main regulator of skeletal muscle development [54]. PLA2G4E is one of the important members of the PLA2 family, and it regulates skeletal muscle and metabolic diseases [55]. AK5 (adenylate kinase 5) and AMP signaling are necessary for energy communication between mitochondria, myofibrils and nuclei, as well as metabolic programs that promote cardiac differentiation in stem cells [56]. GO enrichment analysis showed that the downregulated mRNA genes were mainly enriched in actin binding (XIRP1, SLC6A2, FLNC, ENAH, MYH15, DBN1, PFN2, CNN1, ANKRD1, DNASE1), consistent with a report that actin participates in maintaining muscle function and ensuring muscle contraction [57].
To better understand the potential relationship between DE genes, we subsequently performed PPI network analysis and revealed that the most frequently involved gene in the interaction was ESRRA that was upregulated in LW pigs. ESRRA acts as a site-specific transcription factor and interacts with members of the PGC-1 family of transcription cofactors to regulate the expression of most genes involved in cellular energy production as well as mitochondrial biogenesis [58]. By co-activating with ESRRA, PPARGC1A promotes LDHB transcription and regulates skeletal muscle metabolism [59]. PPARGC1A also enhances lipid oxidation to provide energy for sustained muscle contraction and regulates glucose metabolism [60]. In this study, the mRNA expression of PPARGC1A in the LD muscle was higher in LW pigs compared to DLY pigs, suggesting a regulatory role of PPARGC1A in skeletal muscle development. In the gene network constructed by downregulated genes in LW pigs, VCAN and PENK were most frequently involved in the interaction. VCAN was involved in cell adhesion, proliferation, migration and angiogenesis [61,62]. PENK encodes small endogenous opioid peptides and plays a critical role in cell proliferation and differentiation [63]. As an endoplasmic reticulum localized protein, SHISA2 regulates the fusion of muscle satellite cell-derived primary myoblasts [64]. Furthermore, VEGF factors and growth hormone were predicted as upstream regulators of FKBP5, which is closely related to the growth and development of skeletal muscle cells or tissues. In 3T3-L1 cells, overexpression of FKBP5 promotes lipid deposition [42]. In pigs, the expression of FKBP5 is responsive to glucocorticoid receptor NR3C1 [65,66]; it is involved in activating T lymphocyte [67] and significantly contributes to the breeding value for residual feed intake [68]. Their roles in porcine skeletal muscle development require further study.
The regulation of miRNA in a variety of biological processes has attracted more attention. KEGG enrichment analysis showed that the target genes of downregulated miRNA were enriched in metabolic pathways (IMPDH1, GNE, HGSNAT, SAT1, MTMR8, NT5C3A, PANK2, PHYKPL, GALNT11) and the PPAR signaling pathway (ANGPTL4). The PPAR pathway is closely related to glucose homeostasis and lipid metabolism [69]. ANGPTL4 (angiopoietin-like protein family 4) has been shown to regulate lipoprotein metabolism through the inhibition of lipoprotein lipase (LPL) [70]. GO enrichment analysis showed that the target genes of downregulated miRNA included adipose tissue development (SLC25A25). SLC25A25 is reported to regulate lipid metabolism by PGC1-α [71]. KEGG enrichment analysis showed that the target genes of upregulated miRNA were enriched in the cAMP pathway (GNAS, GLI3, AKT1, LOC106505329) and Ras signaling pathways (AKT1, RALA, BCL2L1). The cAMP signaling pathway plays an important role in regulating muscle development and skeletal muscle differentiation [72]. Activation of the PI3K/protein kinase B (Akt) pathway by Ras induces muscle growth but does not alter fiber-type distribution [73]. Studies have shown that AKT1 and AKT2 are indispensable for the regulation of preadipocyte and adipocyte number [74]. GO enrichment analysis showed that the target genes of upregulated miRNA were enriched in histone methyltransferase complex (KDM6A, ZFP64, NCOA6, KMT2C, ZNF335, LOC100626655). Histone methyltransferase complexes are widely involved in the regulation of muscle development [75,76]. Mutations in KDM6A and KMT2D can reduce myocyte differentiation in vitro and damage muscle fiber regeneration in vivo [77].
Integrated analysis of DE mRNA and DE miRNA revealed a targeted relationship among five upregulated DE mRNAs and six downregulated DE miRNAs, of which ssc-let-7a is the most abundant and stable miRNA in porcine muscle development [78,79] and it was predicted to target FKBP5, PPARGC1A and GALNT15 genes. Among these genes, an increase in GLANT15 expression was reported in adipose-derived stromal cells through a differentiation period of 21 d [80]. In this study, we tested the role of GALNT15 in 3T3-L1 cells and found that it played a positive role in lipid deposition, which is consistent with the higher expression of GALNT15 in LW pigs. Among these miRNAs, loss of miR-204 increases insulin secretion and regulates lipid metabolism [81], while downregulated miR-204 promotes skeletal muscle regeneration [82]. However, further studies are needed to verify the role of ssc-miR204-5p in porcine IMF deposition and skeletal muscle development. Three downregulated DE mRNAs and six upregulated DE miRNAs constitute another target relationship, of which IFRD1 was the common target of both ssc-miR1379-5p and ssc-miR1379-3p. It has been reported that IFRD1 can stimulate skeletal muscle regeneration and, as a regulator of MyoD and NF-κB, participate in myoblast differentiation [83], suggesting a possible role in skeletal muscle growth.
LncRNA could participate in a variety of biological processes through different mechanisms [84,85,86]. In this study, we analyzed the interaction between lncRNA and mRNA in cis- and trans-interactions. In GO and KEGG analysis, the enrichment of cis-target genes of DE lncRNA mainly includes metabolic pathways (NT5M, OPLAH, ME3, GLUL, ACO2, PEMT, LOC100525869, LOC110259864, PLA2G4E, PLA2G4D, AMY2, LOC100624333), the PI3K-Akt signaling pathway (ITGB6) and the MAPK signaling pathway (PLA2G4E, PLA2G4D, TNFRSF1A). The metabolic pathways mainly include glycerol and phospholipid metabolism. PI3K-Akt and MAPK pathways have been shown to be involved in mediating muscle fiber types and glucose metabolism [87,88]. Some trans-target genes of lncRNA are enriched in the AMPK signaling pathway (IRS1, LEPR) and adipocytokine signaling pathway (IRS1, LEPR), which have been shown to be involved in the regulation of lipid deposition and muscle development [89], suggesting a possible role of these DE lncRNA in regulating porcine meat quality traits. IRS1 has been shown to be necessary for myoblast differentiation and glucose metabolism [90]. LEPR (leptin receptor) mutations have been shown to be associated with lipid metabolism [91]. In this study, we constructed an mRNA–miRNA–lncRNA regulatory network and found potential pathways that may regulate intramuscular fat deposition and muscle development in pigs. Similarly, a comparison of the expression profiling of mRNAs, lncRNAs and circRNAs in the LD muscle of Beijing Black and Yorkshire pigs at 210 d identified DE mRNAs that are mainly enriched in the ECM–receptor interaction, focal adhesion, AMPK signaling pathway, PI3K-Akt signaling pathway, adipocytokine signaling pathway, fatty acid metabolism, and PPAR signaling pathway [92].
Although some genes and pathways identified by this study, such as FKBP5, PI3K-Akt signaling and adipocytokine signaling pathways, were also reported in other pig breeds, still a lot of other genes of mRNA, miRNA and lncRNA expressed in the LD muscle were only identified by comparison between LW and DLY pigs. This is likely caused by specific differences in LW pigs that have super capability of fat deposition and in the age of pigs used for comparison. Whether these genes play similar roles in IMF deposition and other meat quality traits needs further investigations with more individuals of different pig breeds.

5. Conclusions

In this study, we performed a comparative transcriptome analysis of mRNA, miRNA and lncRNA in the Longissimus dorsi muscle between lean- and fat-type pigs, and found that some upregulated DE mRNAs including LDHB, GALNT15, FKBP5, PPARGC1A, ESRRA, and their interacting DE miRNAs and lncRNAs were associated with intramuscular fat deposition, and some downregulated DE mRNAs, including IFRD1, VCAN, PENK, LOC110258600, LOC102158401, and their interacting DE miRNAs and lncRNAs were associated with skeletal muscle development. It is necessary to elucidate the role of ESRRA and PPARGC1A in regulating LDHB transcription in porcine skeletal muscle metabolism and intramuscular fat deposition using more samples and pig breeds. The miRNA ssc-let-7a may regulate the expression of GALNT15, PPARGC1A and FKBP5 to affect fat deposition in pigs, which requires further investigations using 3T3-L1 and porcine preadipocytes. Furthermore, it is essential to uncover the regulatory mechanism of these genes and to identify variations in important cis DNA elements to elucidate the differences in meat quality traits between lean- and fat- types of pigs. The results of this study are helpful for the identification of genes underlying IMF variations in pigs.

Supplementary Materials

The following supporting information can be downloaded at: https://www.mdpi.com/article/10.3390/biom12091294/s1, Table S1. Primers for overexpression plasmid, Table S2. Sequence for siRNA, Table S3. Primers for RT-qPCR.

Author Contributions

Conceptualization, Y.J.; investigation, J.Z., J.W., C.M. and W.W.; supervision, H.W. and Y.J.; funding acquisition, Y.J.; writing—original draft, J.Z.; writing—review and editing, H.W. and Y.J. All authors have read and agreed to the published version of the manuscript.

Funding

This research was funded by the Agricultural Elite Breed Project of Shandong Province (No. 2019LZGC019).

Institutional Review Board Statement

The study was conducted in accordance with the Declaration of Helsinki, and approved by the Institutional Review Board of Shandong Agricultural University and the Ministry of Agriculture of China (protocol code SDAUA-2021-097 and date of approval 1 March 2021).

Informed Consent Statement

Not applicable.

Data Availability Statement

The transcriptome data can be accessed from NCBI (https://www.ncbi.nlm.nih.gov/) with the accession number PRJNA815878.

Conflicts of Interest

The authors declare no conflict of interest.

References

  1. Chang, K.C.; Da Costa, N.; Blackley, R.; Southwood, O.; Evans, G.; Plastow, G.; Wood, J.D.; Richardson, R.I. Relationships of Myosin Heavy Chain Fibre Types to Meat Quality Traits in Traditional and Modern Pigs. Meat Sci. 2003, 64, 93–103. [Google Scholar] [CrossRef]
  2. Joo, S.T.; Kim, G.D.; Hwang, Y.H.; Ryu, Y.C. Control of Fresh Meat Quality through Manipulation of Muscle Fiber Characteristics. Meat Sci. 2013, 95, 828–836. [Google Scholar] [CrossRef]
  3. Hausman, G.J.; Basu, U.; Du, M.; Fernyhough-Culver, M.; Dodson, M.V. Intermuscular and Intramuscular Adipose Tissues: Bad vs. Good Adipose Tissues. Adipocyte 2014, 3, 242–255. [Google Scholar] [CrossRef]
  4. Schiaffino, S.; Reggiani, C. Fiber Types in Mammalian Skeletal Muscles. Physiol. Rev. 2011, 91, 1447–1531. [Google Scholar] [CrossRef]
  5. Qaisar, R.; Bhaskaran, S.; Van Remmen, H. Muscle Fiber Type Diversification during Exercise and Regeneration. Free Radic. Biol. Med. 2016, 98, 56–67. [Google Scholar] [CrossRef]
  6. Guo, J.; Shan, T.; Wu, T.; Zhu, L.N.; Ren, Y.; An, S.; Wang, Y. Comparisons of Different Muscle Metabolic Enzymes and Muscle Fiber Types in Jinhua and Landrace Pigs. J. Anim. Sci. 2011, 89, 185–191. [Google Scholar] [CrossRef]
  7. Criado-Mesas, L.; Ballester, M.; Crespo-Piazuelo, D.; Castelló, A.; Fernández, A.I.; Folch, J.M. Identification of EQTLs Associated with Lipid Metabolism in Longissimus Dorsi Muscle of Pigs with Different Genetic Backgrounds. Sci. Rep. 2020, 10, 9845. [Google Scholar] [CrossRef]
  8. Liu, Y.; Yang, X.; Jing, X.; He, X.; Wang, L.; Liu, Y.; Liu, D. Transcriptomics Analysis on Excellent Meat Quality Traits of Skeletal Muscles of the Chinese Indigenous Min Pig Compared with the Large White Breed. Int. J. Mol. Sci. 2018, 19, 21. [Google Scholar] [CrossRef]
  9. Zhao, X.; Mo, D.; Li, A.; Gong, W.; Xiao, S.; Zhang, Y.; Qin, L.; Niu, Y.; Guo, Y.; Liu, X.; et al. Comparative Analyses by Sequencing of Transcriptomes during Skeletal Muscle Development between Pig Breeds Differing in Muscle Growth Rate and Fatness. PLoS ONE 2011, 6, e19774. [Google Scholar] [CrossRef]
  10. Damon, M.; Wyszynska-Koko, J.; Vincent, A.; Hérault, F.; Lebret, B. Comparison of Muscle Transcriptome between Pigs with Divergent Meat Quality Phenotypes Identifies Genes Related to Muscle Metabolism and Structure. PLoS ONE 2012, 7, e33763. [Google Scholar] [CrossRef] [Green Version]
  11. Xu, J.; Wang, C.; Jin, E.; Gu, Y.; Li, S.; Li, Q. Identification of Differentially Expressed Genes in Longissimus Dorsi Muscle between Wei and Yorkshire Pigs Using RNA Sequencing. Genes Genom. 2018, 40, 413–421. [Google Scholar] [CrossRef]
  12. Piórkowska, K.; Żukowski, K.; Ropka-Molik, K.; Tyra, M. Detection of Genetic Variants between Different Polish Landrace and Puławska Pigs by Means of RNA-Seq Analysis. Anim. Genet. 2018, 49, 215–225. [Google Scholar] [CrossRef]
  13. Li, A.; Mo, D.; Zhao, X.; Jiang, W.; Cong, P.; He, Z.; Xiao, S.; Liu, X.; Chen, Y. Comparison of the Longissimus Muscle Proteome between Obese and Lean Pigs at 180 Days. Mamm. Genome 2013, 24, 72–79. [Google Scholar] [CrossRef]
  14. Liu, J.; Damon, M.; Guitton, N.; Guisle, I.; Ecolan, P.; Vincent, A.; Cherel, P.; Gondret, F. Differentially-Expressed Genes in Pig Longissimus Muscles with Contrasting Levels of Fat, as Identified by Combined Transcriptomic, Reverse Transcription PCR, and Proteomic Analyses. J. Agric. Food Chem. 2009, 57, 3808–3817. [Google Scholar] [CrossRef]
  15. Ma, C.; Wang, W.; Wang, Y.; Sun, Y.; Kang, L.; Zhang, Q.; Jiang, Y. TMT-Labeled Quantitative Proteomic Analyses on the Longissimus Dorsi to Identify the Proteins Underlying Intramuscular Fat Content in Pigs. J. Proteom. 2020, 213, 103630. [Google Scholar] [CrossRef]
  16. Yang, Y.; Yan, J.; Fan, X.; Chen, J.; Wang, Z.; Liu, X.; Yi, G.; Liu, Y.; Niu, Y.; Zhang, L.; et al. The Genome Variation and Developmental Transcriptome Maps Reveal Genetic Differentiation of Skeletal Muscle in Pigs. PLoS Genet. 2021, 17, e1009910. [Google Scholar] [CrossRef]
  17. Chen, W.; Fang, G.F.; Wang, S.D.; Wang, H.; Zeng, Y. qing Longissimus Lumborum Muscle Transcriptome Analysis of Laiwu and Yorkshire Pigs Differing in Intramuscular Fat Content. Genes Genom. 2017, 39, 759–766. [Google Scholar] [CrossRef]
  18. Qiu, K.; Xu, D.; Wang, L.; Zhang, X.; Jiao, N.; Gong, L.; Yin, J. Association Analysis of Single-Cell RNA Sequencing and Proteomics Reveals a Vital Role of Ca2+ Signaling in the Determination of Skeletal Muscle Development Potential. Cells 2020, 9, 1045. [Google Scholar] [CrossRef]
  19. Cech, T.R.; Steitz, J.A. The Noncoding RNA Revolution—Trashing Old Rules to Forge New Ones. Cell 2014, 157, 77–94. [Google Scholar] [CrossRef]
  20. Agbu, P.; Carthew, R.W. MicroRNA-Mediated Regulation of Glucose and Lipid Metabolism. Nat. Rev. Mol. Cell Biol. 2021, 22, 425–438. [Google Scholar] [CrossRef]
  21. Qi, K.; Liu, Y.; Li, C.; Li, X.; Li, X.; Wang, K.; Qiao, R.; Han, X. Construction of CircRNA-Related CeRNA Networks in Longissimus Dorsi Muscle of Queshan Black and Large White Pigs. Mol. Genet. Genom. 2021, 297, 101–112. [Google Scholar] [CrossRef] [PubMed]
  22. Wang, J.; Ren, Q.; Hua, L.; Chen, J.; Zhang, J.; Bai, H.; Li, H.; Xu, B.; Shi, Z.; Cao, H.; et al. Comprehensive Analysis of Differentially Expressed MRNA, LncRNA and CircRNA and Their CeRNA Networks in the Longissimus Dorsi Muscle of Two Different Pig Breeds. Int. J. Mol. Sci. 2019, 20, 1107. [Google Scholar] [CrossRef]
  23. Wang, Y.; Ma, C.; Sun, Y.; Li, Y.; Kang, L.; Jiang, Y. Dynamic Transcriptome and DNA Methylome Analyses on Longissimus Dorsi to Identify Genes Underlying Intramuscular Fat Content in Pigs. BMC Genom. 2017, 18, 780. [Google Scholar] [CrossRef]
  24. Wang, Y.; Ning, C.; Wang, C.; Guo, J.; Wang, J.; Wu, Y. Genome-Wide Association Study for Intramuscular Fat Content in Chinese Lulai Black Pigs. Asian Australas. J. Anim. Sci. 2019, 32, 607–613. [Google Scholar] [CrossRef] [PubMed]
  25. Li, R.; Li, Y.; Kristiansen, K.; Wang, J. SOAP: Short Oligonucleotide Alignment Program. Bioinformatics 2008, 24, 713–714. [Google Scholar] [CrossRef] [PubMed]
  26. Kim, D.; Langmead, B.; Salzberg, S.L. HISAT: A Fast Spliced Aligner with Low Memory Requirements. Nat. Methods 2015, 12, 357–360. [Google Scholar] [CrossRef]
  27. Langmead, B.; Salzberg, S.L. Fast Gapped-Read Alignment with Bowtie 2. Nat. Methods 2012, 9, 357–359. [Google Scholar] [CrossRef]
  28. Sahraeian, S.M.E.; Mohiyuddin, M.; Sebra, R.; Tilgner, H.; Afshar, P.T.; Au, K.F.; Bani Asadi, N.; Gerstein, M.B.; Wong, W.H.; Snyder, M.P.; et al. Gaining Comprehensive Biological Insight into the Transcriptome by Performing a Broad-Spectrum RNA-Seq Analysis. Nat. Commun. 2017, 8, 59. [Google Scholar] [CrossRef]
  29. Mortazavi, A.; Williams, B.A.; McCue, K.; Schaeffer, L.; Wold, B. Mapping and Quantifying Mammalian Transcriptomes by RNA-Seq. Nat. Methods 2008, 5, 621–628. [Google Scholar] [CrossRef]
  30. Love, M.I.; Huber, W.; Anders, S. Moderated Estimation of Fold Change and Dispersion for RNA-Seq Data with DESeq2. Genome Biol. 2014, 15, 550. [Google Scholar] [CrossRef] [Green Version]
  31. Gene, T.; Consortium, O. Gene Ontology: Tool for the Unification of Biology. Nat. Genet. 2000, 25, 25–29. [Google Scholar] [CrossRef]
  32. Carbon, S.; Douglass, E.; Good, B.M.; Unni, D.R.; Harris, N.L.; Mungall, C.J.; Basu, S.; Chisholm, R.L.; Dodson, R.J.; Hartline, E.; et al. The Gene Ontology Resource: Enriching a GOld Mine. Nucleic Acids Res. 2021, 49, D325–D334. [Google Scholar] [CrossRef]
  33. Kanehisa, M.; Araki, M.; Goto, S.; Hattori, M.; Hirakawa, M.; Itoh, M.; Katayama, T.; Kawashima, S.; Okuda, S.; Tokimatsu, T.; et al. KEGG for Linking Genomes to Life and the Environment. Nucleic Acids Res. 2008, 36, 480–484. [Google Scholar] [CrossRef] [PubMed]
  34. Kachitvichyanukul, V.; Schmeiser, B. Computer Generation of Hypergeometric Random Variates. J. Stat. Comput. Simul. 1985, 22, 127–145. [Google Scholar] [CrossRef]
  35. Abdi, H. The Bonferonni and Šidák Corrections for Multiple Comparisons. Encycl. Meas. Stat. 2007, 103–107. [Google Scholar] [CrossRef]
  36. Wickham, H. Ggplot2: Elegant Graphics for Data Analysis—Bookreview. J. Stat. Softw. 2010, 35, 1–3. [Google Scholar]
  37. Tafer, H.; Hofacker, I.L. RNAplex: A Fast Tool for RNA-RNA Interaction Search. Bioinformatics 2008, 24, 2657–2663. [Google Scholar] [CrossRef]
  38. Zhang, H.; Wang, S.; Zhou, Q.; Liao, Y.; Luo, W.; Peng, Z.; Ren, R.; Wang, H. Disturbance of Calcium Homeostasis and Myogenesis Caused by TET2 Deletion in Muscle Stem Cells. Cell Death Discov. 2022, 8, 1–14. [Google Scholar] [CrossRef]
  39. Schmittgen, T.D.; Livak, K.J. Analyzing Real-Time PCR Data by the Comparative CT Method. Nat. Protoc. 2008, 3, 1101–1108. [Google Scholar] [CrossRef]
  40. Rakus, D.; Gizak, A.; Deshmukh, A.; Wïniewski, J.R. Absolute Quantitative Profiling of the Key Metabolic Pathways in Slow and Fast Skeletal Muscle. J. Proteome Res. 2015, 14, 1400–1411. [Google Scholar] [CrossRef]
  41. Spiegelman, B.M.; Puigserver, P.; Wu, Z. Regulation of Adipogenesis and Energy Balance by PPARγ and PGC-1. Int. J. Obes. 2000, 24, S8–S10. [Google Scholar] [CrossRef] [PubMed] [Green Version]
  42. Stechschulte, L.A.; Hinds, T.D.; Khuder, S.S.; Shou, W.; Najjar, S.M.; Sanchez, E.R. FKBP51 Controls Cellular Adipogenesis through P38 Kinase-Mediated Phosphorylation of GRα and PPARγ. Mol. Endocrinol. 2014, 28, 1265–1275. [Google Scholar] [CrossRef] [PubMed]
  43. Fatica, A.; Bozzoni, I. Long Non-Coding RNAs: New Players in Cell Differentiation and Development. Nat. Rev. Genet. 2014, 15, 7–21. [Google Scholar] [CrossRef]
  44. Gao, S.-Z.; Zhao, S.-M. Physiology, Affecting Factors and Strategies for Control of Pig Meat Intramuscular Fat. Recent Pat. Food. Nutr. Agric. 2009, 1, 59–74. [Google Scholar] [PubMed]
  45. Cui, J.; Chen, W.; Liu, J.; Xu, T.; Zeng, Y. Study on Quantitative Expression of PPARγ and ADRP in Muscle and Its Association with Intramuscular Fat Deposition of Pig. Springer Plus 2016, 5, 1501. [Google Scholar] [CrossRef] [PubMed]
  46. Wang, H.; Wang, J.; Yang, D.D.; Liu, Z.L.; Zeng, Y.Q.; Chen, W. Expression of Lipid Metabolism Genes Provides New Insights into Intramuscular Fat Deposition in Laiwu Pigs. Asian Australas. J. Anim. Sci. 2020, 33, 390–397. [Google Scholar] [CrossRef]
  47. Elustondo, P.A.; White, A.E.; Hughes, M.E.; Brebner, K.; Pavlov, E.; Kane, D.A. Physical and Functional Association of Lactate Dehydrogenase (LDH) with Skeletal Muscle Mitochondria. J. Biol. Chem. 2013, 288, 25309–25317. [Google Scholar] [CrossRef]
  48. Liu, X.; Trakooljul, N.; Muráni, E.; Krischek, C.; Schellander, K.; Wicke, M.; Wimmers, K.; Ponsuksili, S. Molecular Changes in Mitochondrial Respiratory Activity and Metabolic Enzyme Activity in Muscle of Four Pig Breeds with Distinct Metabolic Types. J. Bioenerg. Biomembr. 2016, 48, 55–65. [Google Scholar] [CrossRef]
  49. Wu, W.; Zhang, Z.; Chao, Z.; Li, B.; Li, R.; Jiang, A.; Kim, K.H.; Liu, H. Transcriptome Analysis Reveals the Genetic Basis of Skeletal Muscle Glycolytic Potential Based on a Pig Model. Gene 2021, 766, 145157. [Google Scholar] [CrossRef]
  50. Liu, L.; Qian, K.; Wang, C. Discovery of Porcine MiRNA-196a/b May Influence Porcine Adipogenesis in Longissimus Dorsi Muscle by MiRNA Sequencing. Anim. Genet. 2017, 48, 175–181. [Google Scholar] [CrossRef]
  51. Yang, Y.; Cheng, Z.; Zhang, W.; Hei, W.; Lu, C.; Cai, C.; Zhao, Y.; Gao, P.; Guo, X.; Cao, G.; et al. Glutamic-Oxaloacetic Transaminase 1 Regulates Adipocyte Differentiation by Altering Nicotinamide Adenine Dinucleotide Phosphate Content. Anim. Biosci. 2022, 35, 155–165. [Google Scholar] [CrossRef] [PubMed]
  52. Ho, A.T.V.; Palla, A.R.; Blake, M.R.; Yucel, N.D.; Wang, Y.X.; Magnusson, K.E.G.; Holbrook, C.A.; Kraft, P.E.; Delp, S.L.; Blau, H.M. Prostaglandin E2 is Essential for Efficacious Skeletal Muscle Stem-Cell Function, Augmenting Regeneration & Strength. Proc. Natl. Acad. Sci. USA 2017, 114, 6675–6684. [Google Scholar] [CrossRef] [PubMed]
  53. Kampjut, D.; Sazanov, L.A. Structure and Mechanism of Mitochondrial Proton-Translocating Transhydrogenase. Nature 2019, 573, 291–295. [Google Scholar] [CrossRef] [PubMed]
  54. Keren, A.; Tamir, Y.; Bengal, E. The P38 MAPK Signaling Pathway: A Major Regulator of Skeletal Muscle Development. Mol. Cell. Endocrinol. 2006, 252, 224–230. [Google Scholar] [CrossRef]
  55. Cervera, I.P.; Gabriel, B.M.; Aldiss, P.; Morton, N.M. The Phospholipase A2 Family’s Role in Metabolic Diseases: Focus on Skeletal Muscle. Physiol. Rep. 2021, 9, e14662. [Google Scholar] [CrossRef]
  56. Dzeja, P.P.; Chung, S.; Faustino, R.S.; Behfar, A.; Terzic, A. Developmental Enhancement of Adenylate Kinase-AMPK Metabolic Signaling Axis Supports Stem Cell Cardiac Differentiation. PLoS ONE 2011, 6, e19300. [Google Scholar] [CrossRef]
  57. Várkuti, B.H.; Yang, Z.; Kintses, B.; Erdélyi, P.; Bárdos-Nagy, I.; Kovács, A.L.; Hári, P.; Kellermayer, M.; Vellai, T.; Málnási-Csizmadia, A. A Novel Actin Binding Site of Myosin Required for Effective Muscle Contraction. Nat. Struct. Mol. Biol. 2012, 19, 299–306. [Google Scholar] [CrossRef]
  58. Mirebeau-Prunier, D.; Le Pennec, S.; Jacques, C.; Gueguen, N.; Poirier, J.; Malthiery, Y.; Savagner, F. Estrogen-Related Receptor α and PGC-1-Related Coactivator Constitute a Novel Complex Mediating the Biogenesis of Functional Mitochondria. FEBS J. 2010, 277, 713–725. [Google Scholar] [CrossRef]
  59. Summermatter, S.; Santos, G.; Pérez-Schindler, J.; Handschin, C. Skeletal Muscle PGC-1α Controls Whole-Body Lactate Homeostasis through Estrogen-Related Receptor α- Dependent Activation of LDH B and Repression of LDH A. Proc. Natl. Acad. Sci. USA 2013, 110, 8738–8743. [Google Scholar] [CrossRef]
  60. Uldry, M.; Yang, W.; St-Pierre, J.; Lin, J.; Seale, P.; Spiegelman, B.M. Complementary Action of the PGC-1 Coactivators in Mitochondrial Biogenesis and Brown Fat Differentiation. Cell Metab. 2006, 3, 333–341. [Google Scholar] [CrossRef]
  61. Ceafalan, L.C.; Dobre, M.; Milanesi, E.; Niculae, A.M.; Manole, E.; Gherghiceanu, M.; Hinescu, M.E. Gene Expression Profile of Adhesion and Extracellular Matrix Molecules during Early Stages of Skeletal Muscle Regeneration. J. Cell. Mol. Med. 2020, 24, 10140–10150. [Google Scholar] [CrossRef] [PubMed]
  62. Stupka, N.; Kintakas, C.; White, J.D.; Fraser, F.W.; Hanciu, M.; Aramaki-Hattori, N.; Martin, S.; Coles, C.; Collier, F.; Ward, A.C.; et al. Versican Processing by a Disintegrin-like and Metalloproteinase Domain with Thrombospondin-1 Repeats Proteinases-5 and-15 Facilitates Myoblast Fusion. J. Biol. Chem. 2013, 288, 1907–1917. [Google Scholar] [CrossRef] [PubMed]
  63. Wan, Y.; White, C.; Robert, N.; Rogers, M.B.; Szabo-Rogers, H.L. Localization of Tfap2β, Casq2, Penk, Zic1, and Zic3 Expression in the Developing Retina, Muscle, and Sclera of the Embryonic Mouse Eye. J. Histochem. Cytochem. 2019, 67, 863–871. [Google Scholar] [CrossRef]
  64. Liu, Z.; Wang, C.; Liu, X.; Kuang, S. Shisa2 Regulates the Fusion of Muscle Progenitors. Stem Cell Res. 2018, 31, 31–41. [Google Scholar] [CrossRef]
  65. Sautron, V.; Terenina, E.; Gress, L.; Lippi, Y.; Billon, Y.; Larzul, C.; Liaubet, L.; Villa-Vialaneix, N.; Mormède, P. Time Course of the Response to ACTH in Pig: Biological and Transcriptomic Study. BMC Genom. 2015, 16, 961. [Google Scholar] [CrossRef]
  66. Ruiz-Conca, M.; Gardela, J.; Martínez, C.A.; Wright, D.; López-Bejar, M.; Rodríguez-Martínez, H.; Álvarez-Rodríguez, M. Natural Mating Differentially Triggers Expression of Glucocorticoid Receptor (Nr3c1)-Related Genes in the Preovulatory Porcine Female Reproductive Tract. Int. J. Mol. Sci. 2020, 21, 4437. [Google Scholar] [CrossRef] [PubMed]
  67. Zhao, J.; Long, X.; Yang, Y.; Pan, H.; Zhang, L.; Guo, Z.; Wang, J.; Lan, J. Identification and Characterization of a Pig FKBP5 Gene with a Novel Expression Pattern in Lymphocytes and Granulocytes. Anim. Biotechnol. 2019, 30, 302–310. [Google Scholar] [CrossRef]
  68. Messad, F.; Louveau, I.; Koffi, B.; Gilbert, H.; Gondret, F. Investigation of Muscle Transcriptomes Using Gradient Boosting Machine Learning Identifies Molecular Predictors of Feed Efficiency in Growing Pigs. BMC Genom. 2019, 20, 659. [Google Scholar] [CrossRef]
  69. Lemberger, T.; Desvergne, B.; Wahli, W. Peroxisome Proliferator-Activated Receptors: A Nuclear Receptor Signaling Pathway in Lipid Physiology. Annu. Rev. Cell Dev. Biol. 1996, 12, 335–363. [Google Scholar] [CrossRef]
  70. Catoire, M.; Alex, S.; Paraskevopulos, N.; Mattijssen, F.; Evers-Van Gogh, I.; Schaart, G.; Jeppesen, J.; Kneppers, A.; Mensink, M.; Voshol, P.J.; et al. Fatty Acid-Inducible ANGPTL4 Governs Lipid Metabolic Response to Exercise. Proc. Natl. Acad. Sci. USA 2014, 111, 1043–1052. [Google Scholar] [CrossRef]
  71. Tavares, C.D.J.; Aigner, S.; Sharabi, K.; Sathe, S.; Mutlu, B.; Yeo, G.W.; Puigserver, P. Transcriptome-Wide Analysis of PGC-1α-Binding RNAs Identifies Genes Linked to Glucagon Metabolic Action. Proc. Natl. Acad. Sci. USA 2020, 117, 22204–22213. [Google Scholar] [CrossRef]
  72. Berdeaux, R.; Stewart, R. CAMP Signaling in Skeletal Muscle Adaptation: Hypertrophy, Metabolism, and Regeneration. Am. J. Physiol. Endocrinol. Metab. 2012, 303, E1–E17. [Google Scholar] [CrossRef] [PubMed]
  73. Bassel-Duby, R.; Olson, E.N. Signaling Pathways in Skeletal Muscle Remodeling. Annu. Rev. Biochem. 2006, 75, 19–37. [Google Scholar] [CrossRef] [PubMed]
  74. Fischer-Posovszky, P.; Tews, D.; Horenburg, S.; Debatin, K.M.; Wabitsch, M. Differential Function of Akt1 and Akt2 in Human Adipocytes. Mol. Cell. Endocrinol. 2012, 358, 135–143. [Google Scholar] [CrossRef] [PubMed]
  75. McKinnell, I.W.; Ishibashi, J.; Le Grand, F.; Punch, V.G.J.; Addicks, G.C.; Greenblatt, J.F.; Dilworth, F.J.; Rudnicki, M.A. Pax7 Activates Myogenic Genes by Recruitment of a Histone Methyltransferase Complex. Nat. Cell Biol. 2008, 10, 77–84. [Google Scholar] [CrossRef]
  76. Rudnicki, M.A.; Le Grand, F.; McKinnell, I.; Kuang, S. The Molecular Regulation of Muscle Stem Cell Function. Cold Spring Harb. Symp. Quant. Biol. 2008, 73, 323–331. [Google Scholar] [CrossRef]
  77. Wright, A.; Hall, A.; Daly, T.; Fontelonga, T.; Potter, S.; Schafer, C.; Lindsley, A.; Hung, C.; Bodamer, O.; Gussoni, E. Lysine Methyltransferase 2D Regulates Muscle Fiber Size and Muscle Cell Differentiation. FASEB J. 2021, 35, e21955. [Google Scholar] [CrossRef]
  78. Sun, T.; Fu, M.; Bookout, A.L.; Kliewer, S.A.; Mangelsdorf, D.J. MicroRNA Let-7 Regulates 3T3-L1 Adipogenesis. Mol. Endocrinol. 2009, 23, 925–931. [Google Scholar] [CrossRef]
  79. Timoneda, O.; Balcells, I.; Córdoba, S.; Lló, A.C.; Sánchez, A. Determination of Reference MicroRNAs for Relative Quantification in Porcine Tissues. PLoS ONE 2012, 7, e44413. [Google Scholar] [CrossRef]
  80. Ambele, M.A.; Dessels, C.; Durandt, C.; Pepper, M.S. Genome-Wide Analysis of Gene Expression during Adipogenesis in Human Adipose-Derived Stromal Cells Reveals Novel Patterns of Gene Expression during Adipocyte Differentiation. Stem Cell Res. 2016, 16, 725–734. [Google Scholar] [CrossRef]
  81. Jo, S.H.; Chen, J.; Xu, G.; Grayson, T.B.; Thielen, L.A.; Shalev, A. MiR-204 Controls Glucagon-like Peptide 1 Receptor Expression and Agonist Function. Diabetes 2018, 67, 256–264. [Google Scholar] [CrossRef] [Green Version]
  82. Tan, Y.; Shen, L.; Gan, M.; Fan, Y.; Cheng, X.; Zheng, T.; Niu, L.; Chen, L.; Jiang, D.; Li, X.; et al. Downregulated MiR-204 Promotes Skeletal Muscle Regeneration. Biomed. Res. Int. 2020, 2020, 3183296. [Google Scholar] [CrossRef]
  83. Micheli, L.; Leonardi, L.; Conti, F.; Maresca, G.; Colazingari, S.; Mattei, E.; Lira, S.A.; Farioli-Vecchioli, S.; Caruso, M.; Tirone, F. PC4/Tis7/IFRD1 Stimulates Skeletal Muscle Regeneration and is Involved in Myoblast Differentiation as a Regulator of MyoD and NF-ΚB. J. Biol. Chem. 2011, 286, 5691–5707. [Google Scholar] [CrossRef] [PubMed]
  84. Muñoz, M.; García-Casco, J.M.; Caraballo, C.; Fernández-Barroso, M.Á.; Sánchez-Esquiliche, F.; Gómez, F.; del Carmen Rodríguez, M.; Silió, L. Identification of Candidate Genes and Regulatory Factors Underlying Intramuscular Fat Content Through Longissimus Dorsi Transcriptome Analyses in Heavy Iberian Pigs. Front. Genet. 2018, 9, 608. [Google Scholar] [CrossRef] [PubMed]
  85. Li, R.; Li, B.; Jiang, A.; Cao, Y.; Hou, L.; Zhang, Z.; Zhang, X.; Liu, H.; Kim, K.H.; Wu, W. Exploring the LncRNAs Related to Skeletal Muscle Fiber Types and Meat Quality Traits in Pigs. Genes 2020, 11, 883. [Google Scholar] [CrossRef] [PubMed]
  86. Huang, W.; Zhang, X.; Li, A.; Xie, L.; Miao, X. Genome-Wide Analysis of MRNAs and LncRNAs of Intramuscular Fat Related to Lipid Metabolism in Two Pig Breeds. Cell. Physiol. Biochem. 2018, 50, 2406–2422. [Google Scholar] [CrossRef]
  87. Sacheck, J.M.; Ohtsuka, A.; McLary, S.C.; Goldberg, A.L. IGF-I Stimulates Muscle Growth by Suppressing Protein Breakdown and Expression of Atrophy-Related Ubiquitin Ligases, Atrogin-1 and MuRF1. Am. J. Physiol. Endocrinol. Metab. 2004, 287, 591–601. [Google Scholar] [CrossRef]
  88. Fang, H.; Judd, R.L. Adiponectin Regulation and Function. Compr. Physiol. 2018, 8, 1031–1063. [Google Scholar] [CrossRef]
  89. Shen, B.; Zhao, C.; Wang, Y.; Peng, Y.; Cheng, J.; Li, Z.; Wu, L.; Jin, M.; Feng, H. Aucubin Inhibited Lipid Accumulation and Oxidative Stress via Nrf2/HO-1 and AMPK Signalling Pathways. J. Cell. Mol. Med. 2019, 23, 4063–4075. [Google Scholar] [CrossRef]
  90. Bouzakri, K.; Zachrisson, A.; Al-Khalili, L.; Zhang, B.B.; Koistinen, H.A.; Krook, A.; Zierath, J.R. SiRNA-Based Gene Silencing Reveals Specialized Roles of IRS-1/Akt2 and IRS-2/Akt1 in Glucose and Lipid Metabolism in Human Skeletal Muscle. Cell Metab. 2006, 4, 89–96. [Google Scholar] [CrossRef]
  91. Stefan, N.; Vozarova, B.; Del Parigi, A.; Ossowski, V.; Thompson, D.B.; Hanson, R.L.; Ravussin, E.; Tataranni, P.A. The Gln223Arg Polymorphism of the Leptin Receptor in Pima Indians: Influence on Energy Expenditure, Physical Activity and Lipid Metabolism. Int. J. Obes. 2002, 26, 1629–1632. [Google Scholar] [CrossRef] [PubMed] [Green Version]
  92. Hou, X.; Wang, L.; Zhao, F.; Wang, L.; Zhang, L. Genome-Wide Expression Profiling of mRNAs, LncRNAs and CircRNAs in Skeletal Muscle of Two Different Pig Breeds. Animals 2021, 11, 3169. [Google Scholar] [CrossRef] [PubMed]
Figure 1. Sample description of the Longissimus dorsi muscle from Duroc × Landrace × Yorkshire (DLY) and Laiwu (LW) pigs. Differences in the live weight (A) and intramuscular fat content (IMF) (B) in the Longissimus dorsi (LD) muscles between LW and DLY pigs. * p < 0.05. (C) Representative images of ORO staining in Longissimus dorsi of DLY and LW pigs (Scale bars, 100 μm). n = 3 biological samples. (D) Immunohistochemical localization of F59 and S46 in Longissimus dorsi of DLY and LW pigs (Scale bars, 100 μm). n = 3 biological samples.
Biomolecules 12 01294 g001
Figure 2. Expression profiles and bioinformatic analysis of DE mRNAs. (A) The volcano plots of the significantly differentially expressed mRNAs at the criteria of |log2(foldchange)| > 1 and q value < 0.05. (B) Heatmap plots of the significantly differentially expressed mRNAs. GO (C) and KEGG (D) analysis diagram of DE mRNAs upregulated in LW pigs. GO (E) and KEGG (F) analysis diagram of DE mRNAs downregulated in LW pigs. (G) Validation by RT-qPCR of 10 randomly selected DE mRNAs from RNA-seq. (H) Heatmap plots of the DE mRNAs in metabolic pathway.
Biomolecules 12 01294 g002
Figure 3. Interaction network for DE mRNAs. (A) Protein-protein interaction of DE mRNAs. The network nodes are proteins and the edges represent the predicted functional associations. (B) The gene interaction network of DE mRNAs by the ingenuity pathway analysis (IPA). The solid line represents direct interaction; dotted line represents indirect interaction.
Biomolecules 12 01294 g003
Figure 4. Expression profiles of DE miRNAs and bioinformatic analysis of their targeted genes. (A) The volcano plots of the significantly differentially expressed miRNAs at the criteria of |log2(foldchange)| > 1 and q value < 0.05. (B) Heatmap plots of the significantly differentially expressed miRNAs. GO (C) and KEGG (D) analysis diagram of the target genes of DE miRNAs downregulated in LW pigs. GO (E) and KEGG (F) analysis diagram of the target genes of DE miRNAs upregulated in LW pigs. (G) Validation by RT-qPCR of 12 DE miRNAs from RNA-seq.
Biomolecules 12 01294 g004
Figure 5. Expression profiles of DE lncRNAs and bioinformatic analysis of its targeted genes. (A) The volcano plots of the significantly differentially expressed lncRNAs at the criteria of |log2(foldchange)| > 1 and q value < 0.05. (B) Heatmap plots of the significantly differentially expressed lncRNAs. GO (C) and KEGG (D) analysis diagram of the cis target genes of DE lncRNAs upregulated in LW pigs. GO (E) and KEGG (F) analysis diagram of the cis target genes of DE lncRNAs downregulated in LW pigs. GO (G) and KEGG (H) analysis diagram of the trans target genes of DE lncRNAs upregulated in LW pigs. GO (I) and KEGG (J) analysis diagram of the trans target genes of DE lncRNAs downregulated in LW pigs. (K) Validation by RT-qPCR of 10 DE lncRNAs from RNA-seq.
Biomolecules 12 01294 g005
Figure 6. mRNA-miRNA network constructed with DE miRNAs and DE mRNAs in the Longissimus dorsi muscle of pigs. (A) Venn plots showing the number of overlapping targeted genes of DE miRNAs and DE mRNAs. (B) Cytoscape showing the interactions of upregulated DE mRNA and downregulated DE miRNA, five mRNAs and six miRNAs are targeted in this sub-network. The red and blue nodes represent mRNAs and miRNAs, respectively. (C) Cytoscape showing the interactions of downregulated DE mRNA and upregulated of DE miRNA; three mRNAs and six miRNAs are targeted in this sub-network. The yellow and blue nodes represent mRNAs and miRNAs, respectively. (D) Verification of the above DE mRNAs. * p < 0.05, ** p < 0.01, *** p < 0.001; ns, not significant.
Biomolecules 12 01294 g006
Figure 7. mRNA–miRNA–lncRNA regulatory networks in the Longissimus dorsi muscle of pigs. Green circulars indicate mRNAs, red diamonds indicate lncRNAs, yellow triangles indicate miRNAs, and the lines represent the targeting interactions between them.
Biomolecules 12 01294 g007
Figure 8. GALNT15 promotes adipogenesis in 3T3-L1 cells. (A) Double enzyme digestion verification of GALNT15 overexpression plasmid. M: DNA marker. Lines 1 and 2: two replicates of pcDNA3.1(+)-GALNT15 plasmid. (B) Representative images of ORO staining in 3T3-L1 cells treated with control (Ctrl) or GALNT15 OE for 48 h (Scale bars, 100 μm). n = 3 biological samples. RT-qPCR analysis of GALNT15 OE for adipogenic marker genes. (C) Representative images of ORO staining in 3T3-L1 cells treated with Ctrl or GALNT15 KD for 48 h (Scale bars, 100 μm). n = 3 biological samples. RT-qPCR analysis of GALNT15 KD for adipogenic marker genes. (D) Representative images of ORO staining in 3T3-L1 cells treated with Ctrl, GALNT15 KD and GALNT15 KD+OE. n = 3 biological samples. Error Bar indicated SEM, * p < 0.05, ** p < 0.01, *** p < 0.001. ns, not significant.
Biomolecules 12 01294 g008
Table 1. Statistics of cDNA libraries of mRNA and lncRNA of Longissimus dorsi muscle samples from LW and DLY pigs.
SampleDLY_1DLY_2DLY_3LW_1LW_2LW_3
Total raw reads (M)122.44122.44122.44124.94122.44124.94
Total clean reads (M)113.94113.95113.85116.11113.82116.32
Total clean data (Gb)11.3911.4011.3911.6111.3811.63
Total mapping (%)93.2193.1093.7492.3892.6192.44
Clean reads Q20 (%)97.5097.4797.3797.4597.3897.50
Clean reads Q30 (%)91.2491.1790.6891.0090.7091.06
Clean reads ratio (%)93.0693.0792.9892.9392.9693.11
Table 2. Statistics of cDNA libraries of miRNA of Longissimus dorsi muscle samples from LW and DLY pigs.
SampleDLY_1DLY_2DLY_3LW_1LW_2LW_3
Raw Tag Count25,165,82425,165,82425,165,82425,165,82425,165,82425,165,824
Clean Tag Count23,786,35122,838,32224,113,82524,039,05124,316,15624,243,603
Total mapping (%)90.7193.4592.1391.3089.0791.26
Q20 of Clean Tag (%)98.7098.6098.6098.5098.7098.70
Percentage of Clean Tag (%)94.5290.7595.8295.5296.6296.34
Table 3. The upregulated mRNAs in the Longissimus dorsi muscle sample of LW pigs according to q value threshold of <0.05 and log2 (foldchange) > 3.
Gene IDGenesLog2 (Foldchange)q ValueDLY Average Read CountsLW Average Read Counts
100621540LDHB9.6672793986.38 × 10−120.19158.17
110258214LOC1102582146.9866981875.01 × 10−167391.5549,658.91
396643SSTR36.0432820760.0101014240.1912.68
110255206LOC1102552065.9353607260.0159043850.1911.72
100737113LOC1007371135.8568044460.0152360880.7241.86
100737631LOC1007376315.780090550.0159043850.1910.51
106506226LOC1065062265.2659418640.0317361799.43362.74
102159048SYCP2L5.1811708670.0291723680.6523.6
100514305STPG25.0951502380.0317361790.3812.88
110256818LOC1102568184.4513497640.0459986390.7115.63
100158003LOC1001580034.0706324293.88 × 10−12146.322458.62
100525112LOC1005251123.8479208920.0130439171.9427.88
110255992SPATA323.5969184690.015500723.0737.2
102162178LOC1021621783.5382009942.77 × 10−1511127.83
100514435RAB193.4828998960.0362869622.1724.23
100513679NEK33.4474405196.95 × 10−1522.96250.51
100155596HRK3.4200512360.0298482721.6817.98
100513483DCAF163.3952590040.0055341462.4525.75
100156672NEK53.1788633453.65 × 10−410.2993.2
100156863ZIC33.110418386.68 × 10−412.58108.64
100126277AQP43.0308039424.32 × 10−5118.82971.11
Table 4. The downregulated mRNAs in the Longissimus dorsi muscle sample of LW pigs according to q value threshold of <0.05 and log2 (foldchange) < −3.
Gene IDGenesLog2 (Foldchange)q ValueDLY Average Read CountsLW Average Read Counts
110258854LOC110258854−23.27981.28 × 10−6108.470
106510102LOC106510102−7.509145.68 × 10−14172.70.95
100737845FBXL13−7.444033.85 × 10−659.490.34
106510322LOC106510322−7.220452.85 × 10−525.850.17
100517716SLC6A2−6.053052.91 × 10−582.521.24
110257759LOC110257759−5.926070.00369120.570.34
100626756ACBD7−5.259869.63 × 10−10158.714.14
100157711LOC100157711−5.162062.77 × 10−15533.314.89
100624179COCH−4.937510.02058428.480.93
397171OCA2−4.847091.48 × 10−7183.526.38
100621079MYH15−4.698010.01208833.341.28
100518260UNC79−4.677150.03897863.762.49
106505804LOC106505804−4.484741.50 × 10−10146.116.53
100157276ADAMTS4−3.969581.96 × 10−4188.5212.03
100623128CCKAR−3.751710.01771717.121.27
100514811PLA2G4E−3.706054.49 × 10−491.77.03
100736858RPH3A−3.413250.01723916.881.58
110256933LOC110256933−3.055820.00921539.664.77
100620172IRX5−3.035761.13 × 10−485.8110.46
110256218LOC110256218−3.011931.96 × 10−18740.7391.83
Table 5. The upregulated miRNAs in the Longissimus dorsi muscle of LW pigs.
GenesLog2
(Foldchange)
q ValueDLY Average
Read Counts
LW Average
Read Counts
ssc-miR1379-5p14.537521766.38 × 10−110.19286.08
ssc-miR1379-3p12.049167871.55 × 10−50.1950.99
ssc-miR1156-5p10.388017290.0452240240.1915.71
ssc-miR1358-5p9.0815574094.56 × 10−80.37175.8
ssc-miR397-5p6.0091547150.0292080880.3720.77
ssc-miR299-5p2.8082145790.018798556136.45869.54
Table 6. The downregulated miRNAs in the Longissimus dorsi muscle sample of LW pigs.
GenesLog2
(Foldchange)
q ValueDLY Average
Read Counts
LW Average
Read Counts
ssc-miR204-5p−11.914385134.70 × 10−650.80
ssc-let-7a−7.9127245054.10 × 10−968,300.09257.16
ssc-miR190-3p−7.3099171161.09 × 10−5100.650.61
ssc-miR573-5p−4.9917467795.32 × 10−452.531.53
ssc-miR356-5p−4.7192635920.01220220542.261.5
ssc-miR-10383−2.7231366381.40 × 10−77773.921083.98
Table 7. The upregulated lncRNAs in the Longissimus dorsi muscle sample of LW pigs.
Gene IDGenesLog2 (Foldchange)q ValueDLY Average Read CountsLW Average Read Counts
110257307LOC1102573076.4359580.0122090.1916.81
110258489LOC1102584896.2507080.0066160.1914.76
110255522LOC1102555225.8339160.0159840.1910.96
110259865LOC1102598655.7037560.0290370.1910
102167235LOC1021672354.0853080.0057531.4224.06
102160723LOC1021607233.6577970.0122091.6520.77
110257281LOC1102572813.4646250.0122093.2235.57
102159627LOC1021596273.4590350.0122068.9598.4
102162221ZNF6483.0944870.00661616.78143.37
110259814LOC1102598142.941170.0032988.4664.97
100157061LOC1001570612.8689180.0035017.9458.03
110260631LOC1102606312.8602030.0122097.2952.92
106509142LOC1065091422.8244311.47 × 10−1232.41229.59
110257827LOC1102578272.7485340.0010384.95570.9
110255857LOC1102558572.7303410.02151435.06232.65
110257909LOC1102579092.6910430.0075213.7188.55
110259137LOC1102591372.6483920.02986719.6122.89
110260388LOC1102603882.5536430.005825635.21
110260634LOC1102606342.477260.0226589.9555.39
110257745LOC1102577452.3499050.0150746.6934.11
110256935LOC1102569352.2115550.00327846.14213.71
110259691LOC1102596911.9116880.0014848.79183.58
106505263LOC1065052631.8870820.01489919.6572.68
110255980LOC1102559801.6069070.0139532.6399.38
102163278LOC1021632781.4241820.03240926.9472.28
110261569LOC1102615691.3800770.03239960.42157.25
106507563LOC1065075631.304650.02542570.18173.37
100622439LOC1006224391.1705220.004696241.41543.4
Table 8. The downregulated lncRNAs in the Longissimus dorsi muscle sample of LW pigs.
Gene IDGenesLog2 (Foldchange)q ValueDLY Average Read CountsLW Average Read Counts
110259141LOC110259141−6.215260.00799112.480.17
110260256LOC110260256−4.76514.39 × 10−765.942.43
110260878LOC110260878−4.290110.01220617.590.9
110256028LOC110256028−4.211420.00224544.642.41
110260798LOC110260798−4.123820.0014848.522.78
110261211LOC110261211−3.520910.01114820.91.82
102159118LOC102159118−3.145390.03265348.755.51
110261331LOC110261331−2.945410.01227233.064.29
110260773LOC110260773−2.873340.00171359.88.16
106510214LOC106510214−2.848260.02765335.234.89
106506422LOC106506422−2.637060.01114862.9910.13
100627270LOC100627270−2.390840.01471543.038.2
110257276LOC110257276−2.337420.03023680.5915.95
100623270LOC100623270−2.294080.00970236.817.51
102165609LOC102165609−2.086995.73 × 10−4237.955.99
110256124LOC110256124−1.950870.0285742.0210.87
106509650LOC106509650−1.938490.00275824.96215.22
106508816LOC106508816−1.340550.030236111.4444
106505720LOC106505720−1.302120.041647342.85139.04
110257277LOC110257277−1.203350.0065882752.421195.28
110255759LOC110255759−1.109270.032409200.9193.13
110255800LOC110255800−1.10870.009503818.25379.43
102163738LOC102163738−1.077910.005457293.6139.08
Publisher’s Note: MDPI stays neutral with regard to jurisdictional claims in published maps and institutional affiliations.

