
Fast and Deep Diagnosis Using Blood-Based ATR-FTIR Spectroscopy for Digestive Tract Cancers

Abstract
:1. Introduction
2. Materials and Methods
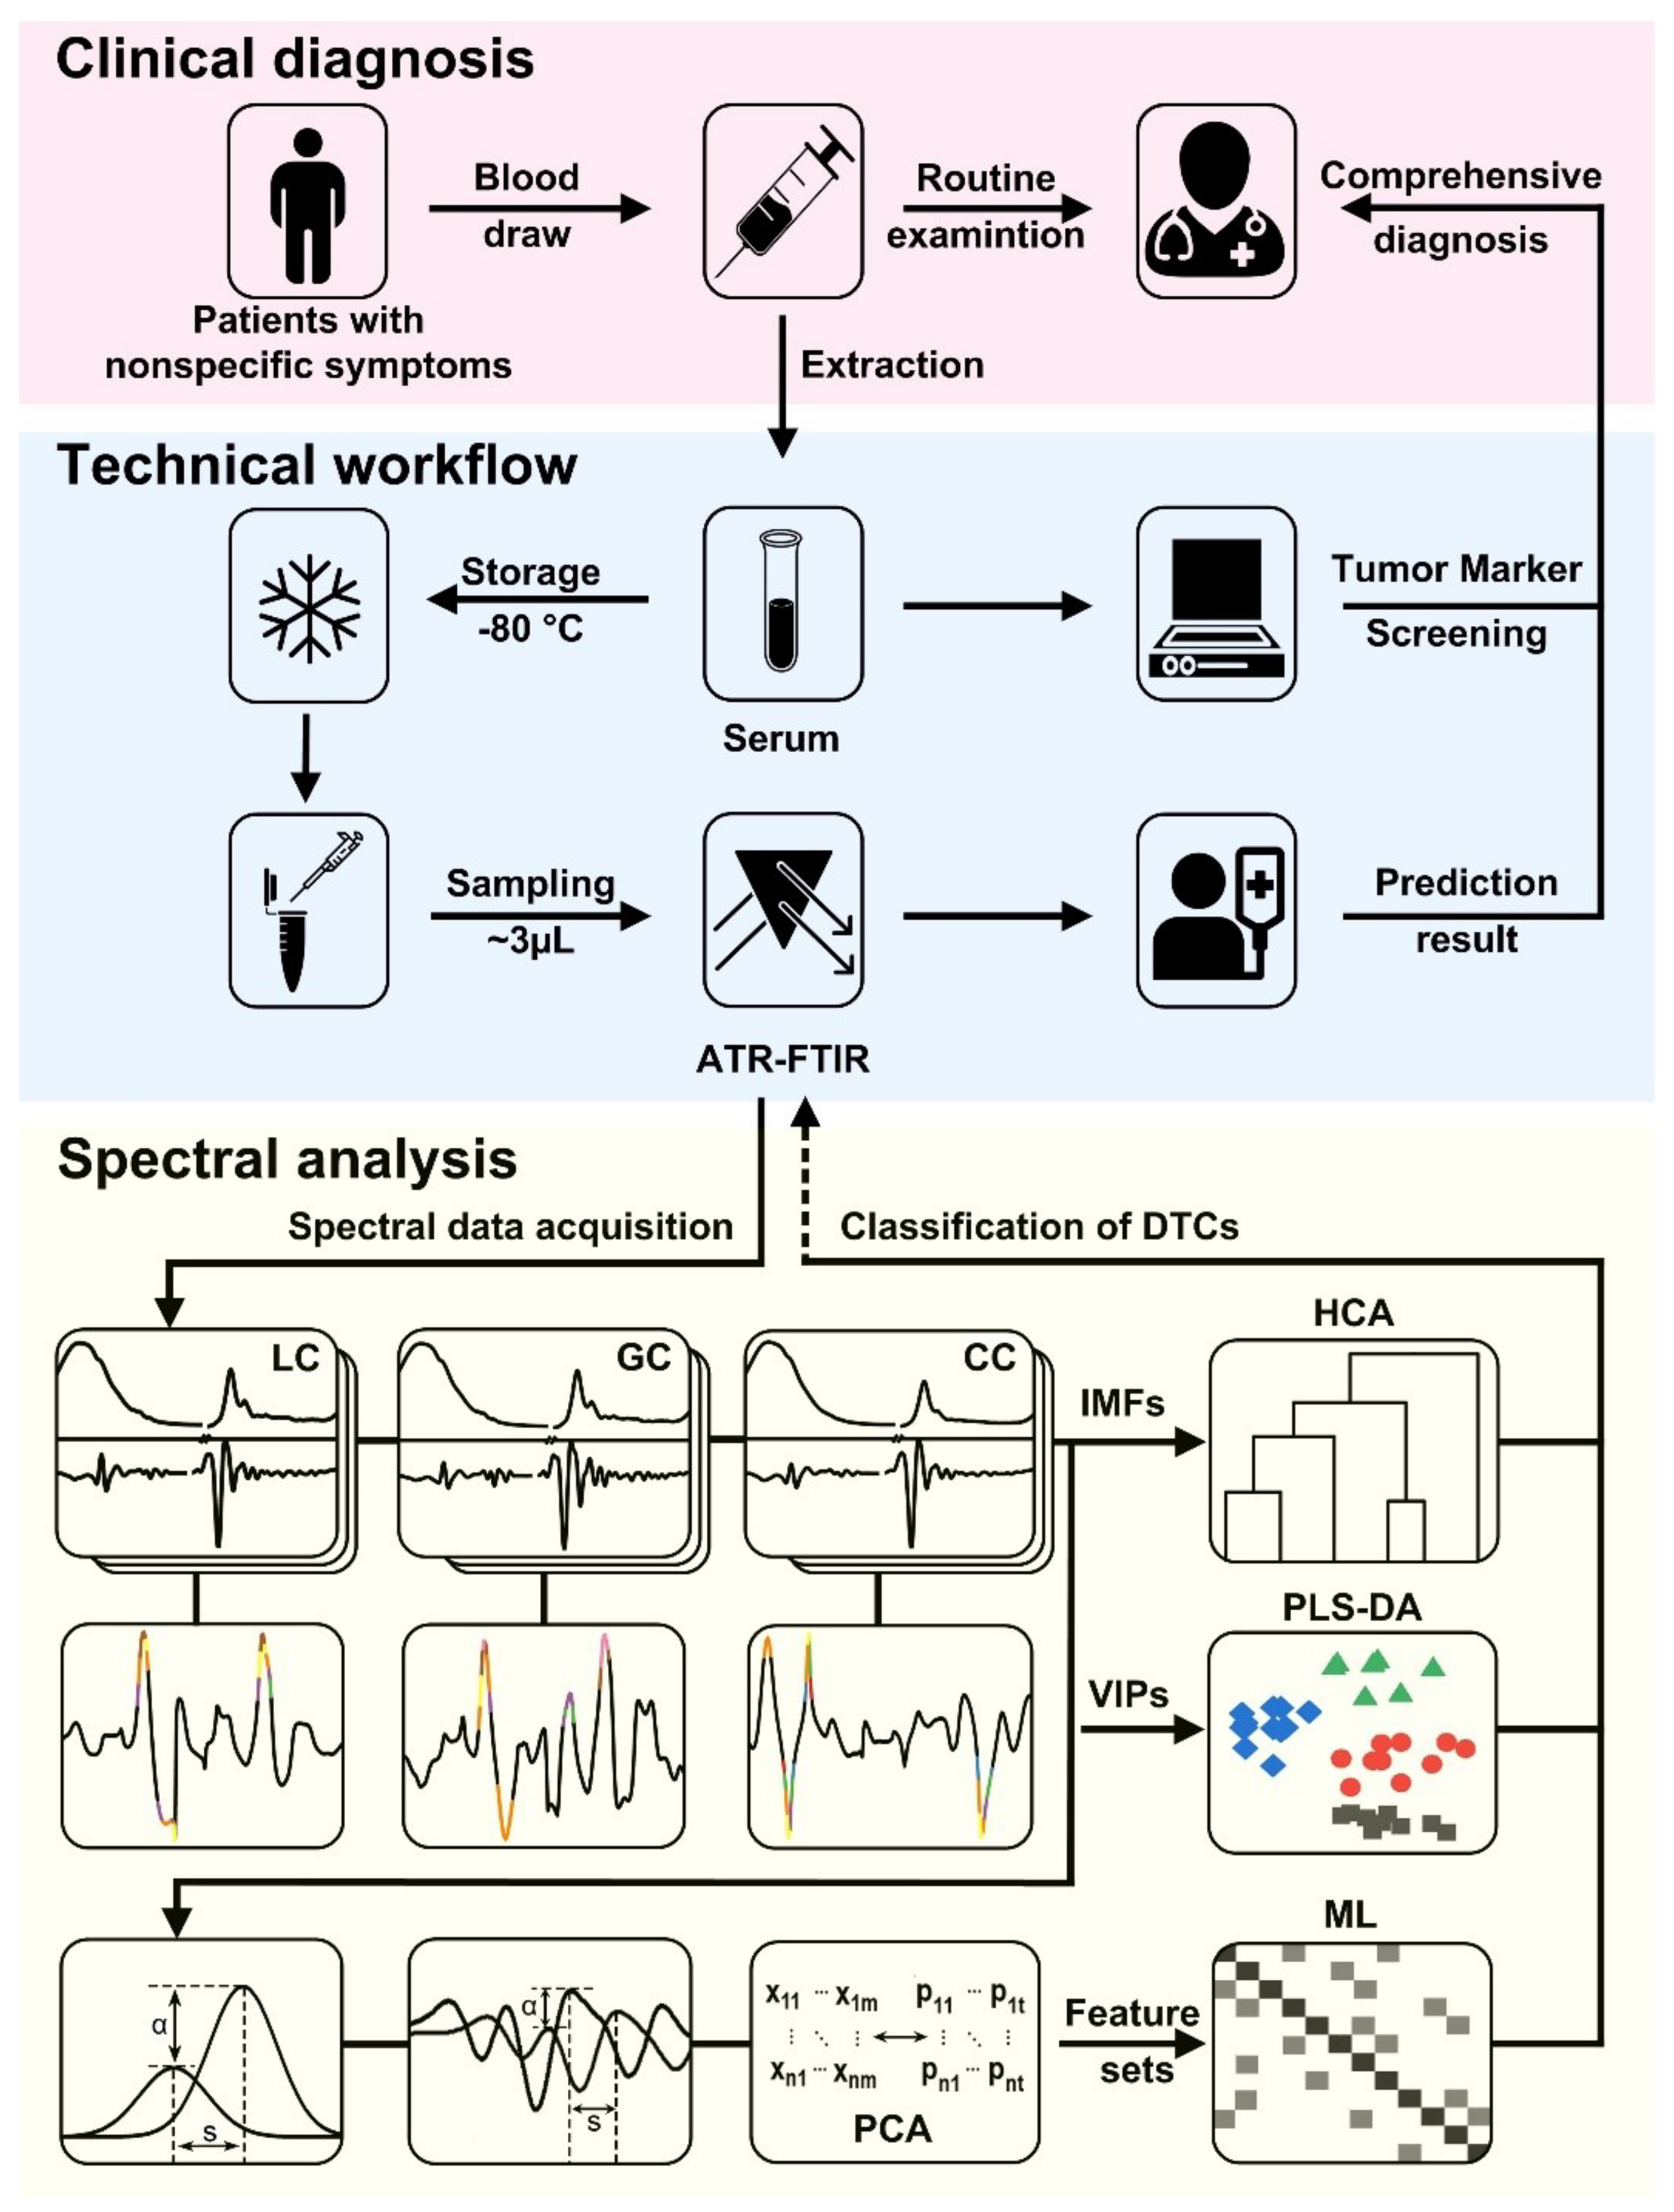
2.1. In-Situ FTIR Measurement
2.2. Study Participants
2.3. Blood-Sample Preparation and ATR-FTIR Spectroscopy
2.4. Multivariate and Statistical Analysis
3. Results
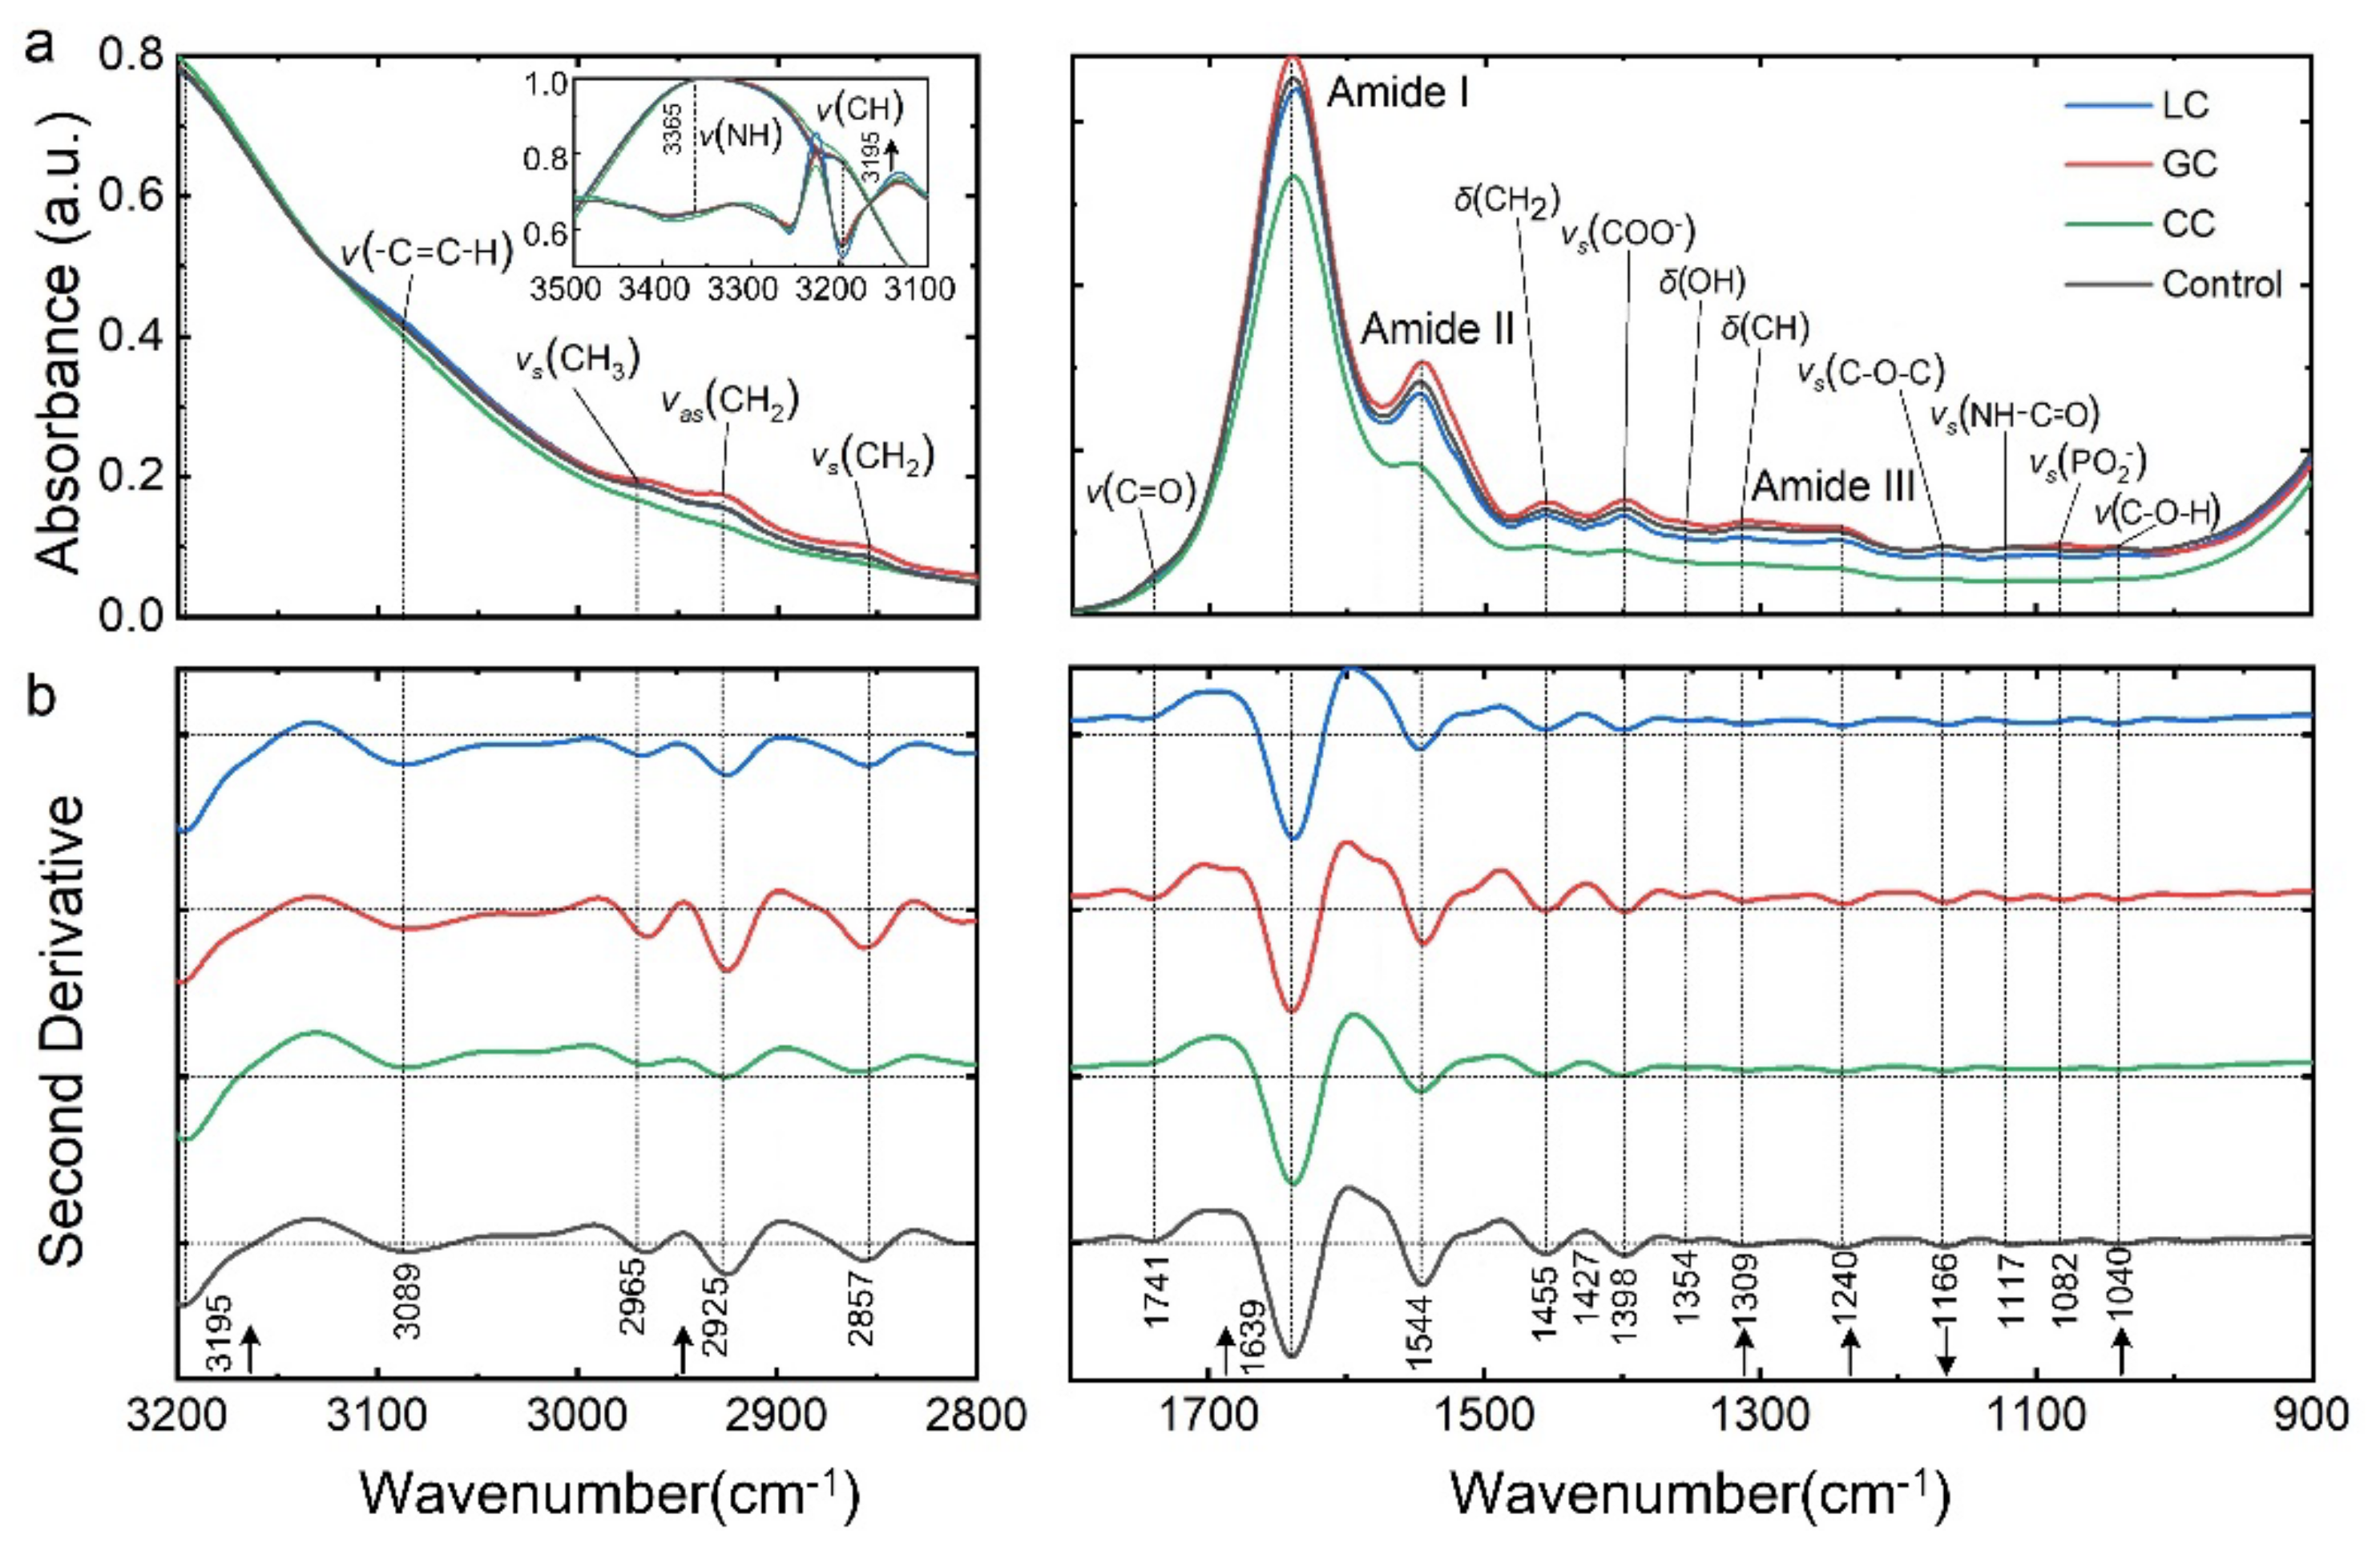
3.1. Spectrally Resolved Band Assignments and Differential Interpretation of DTCs
3.2. Comparison of FTIR Spectral and Clinical Tumor Marker Screening
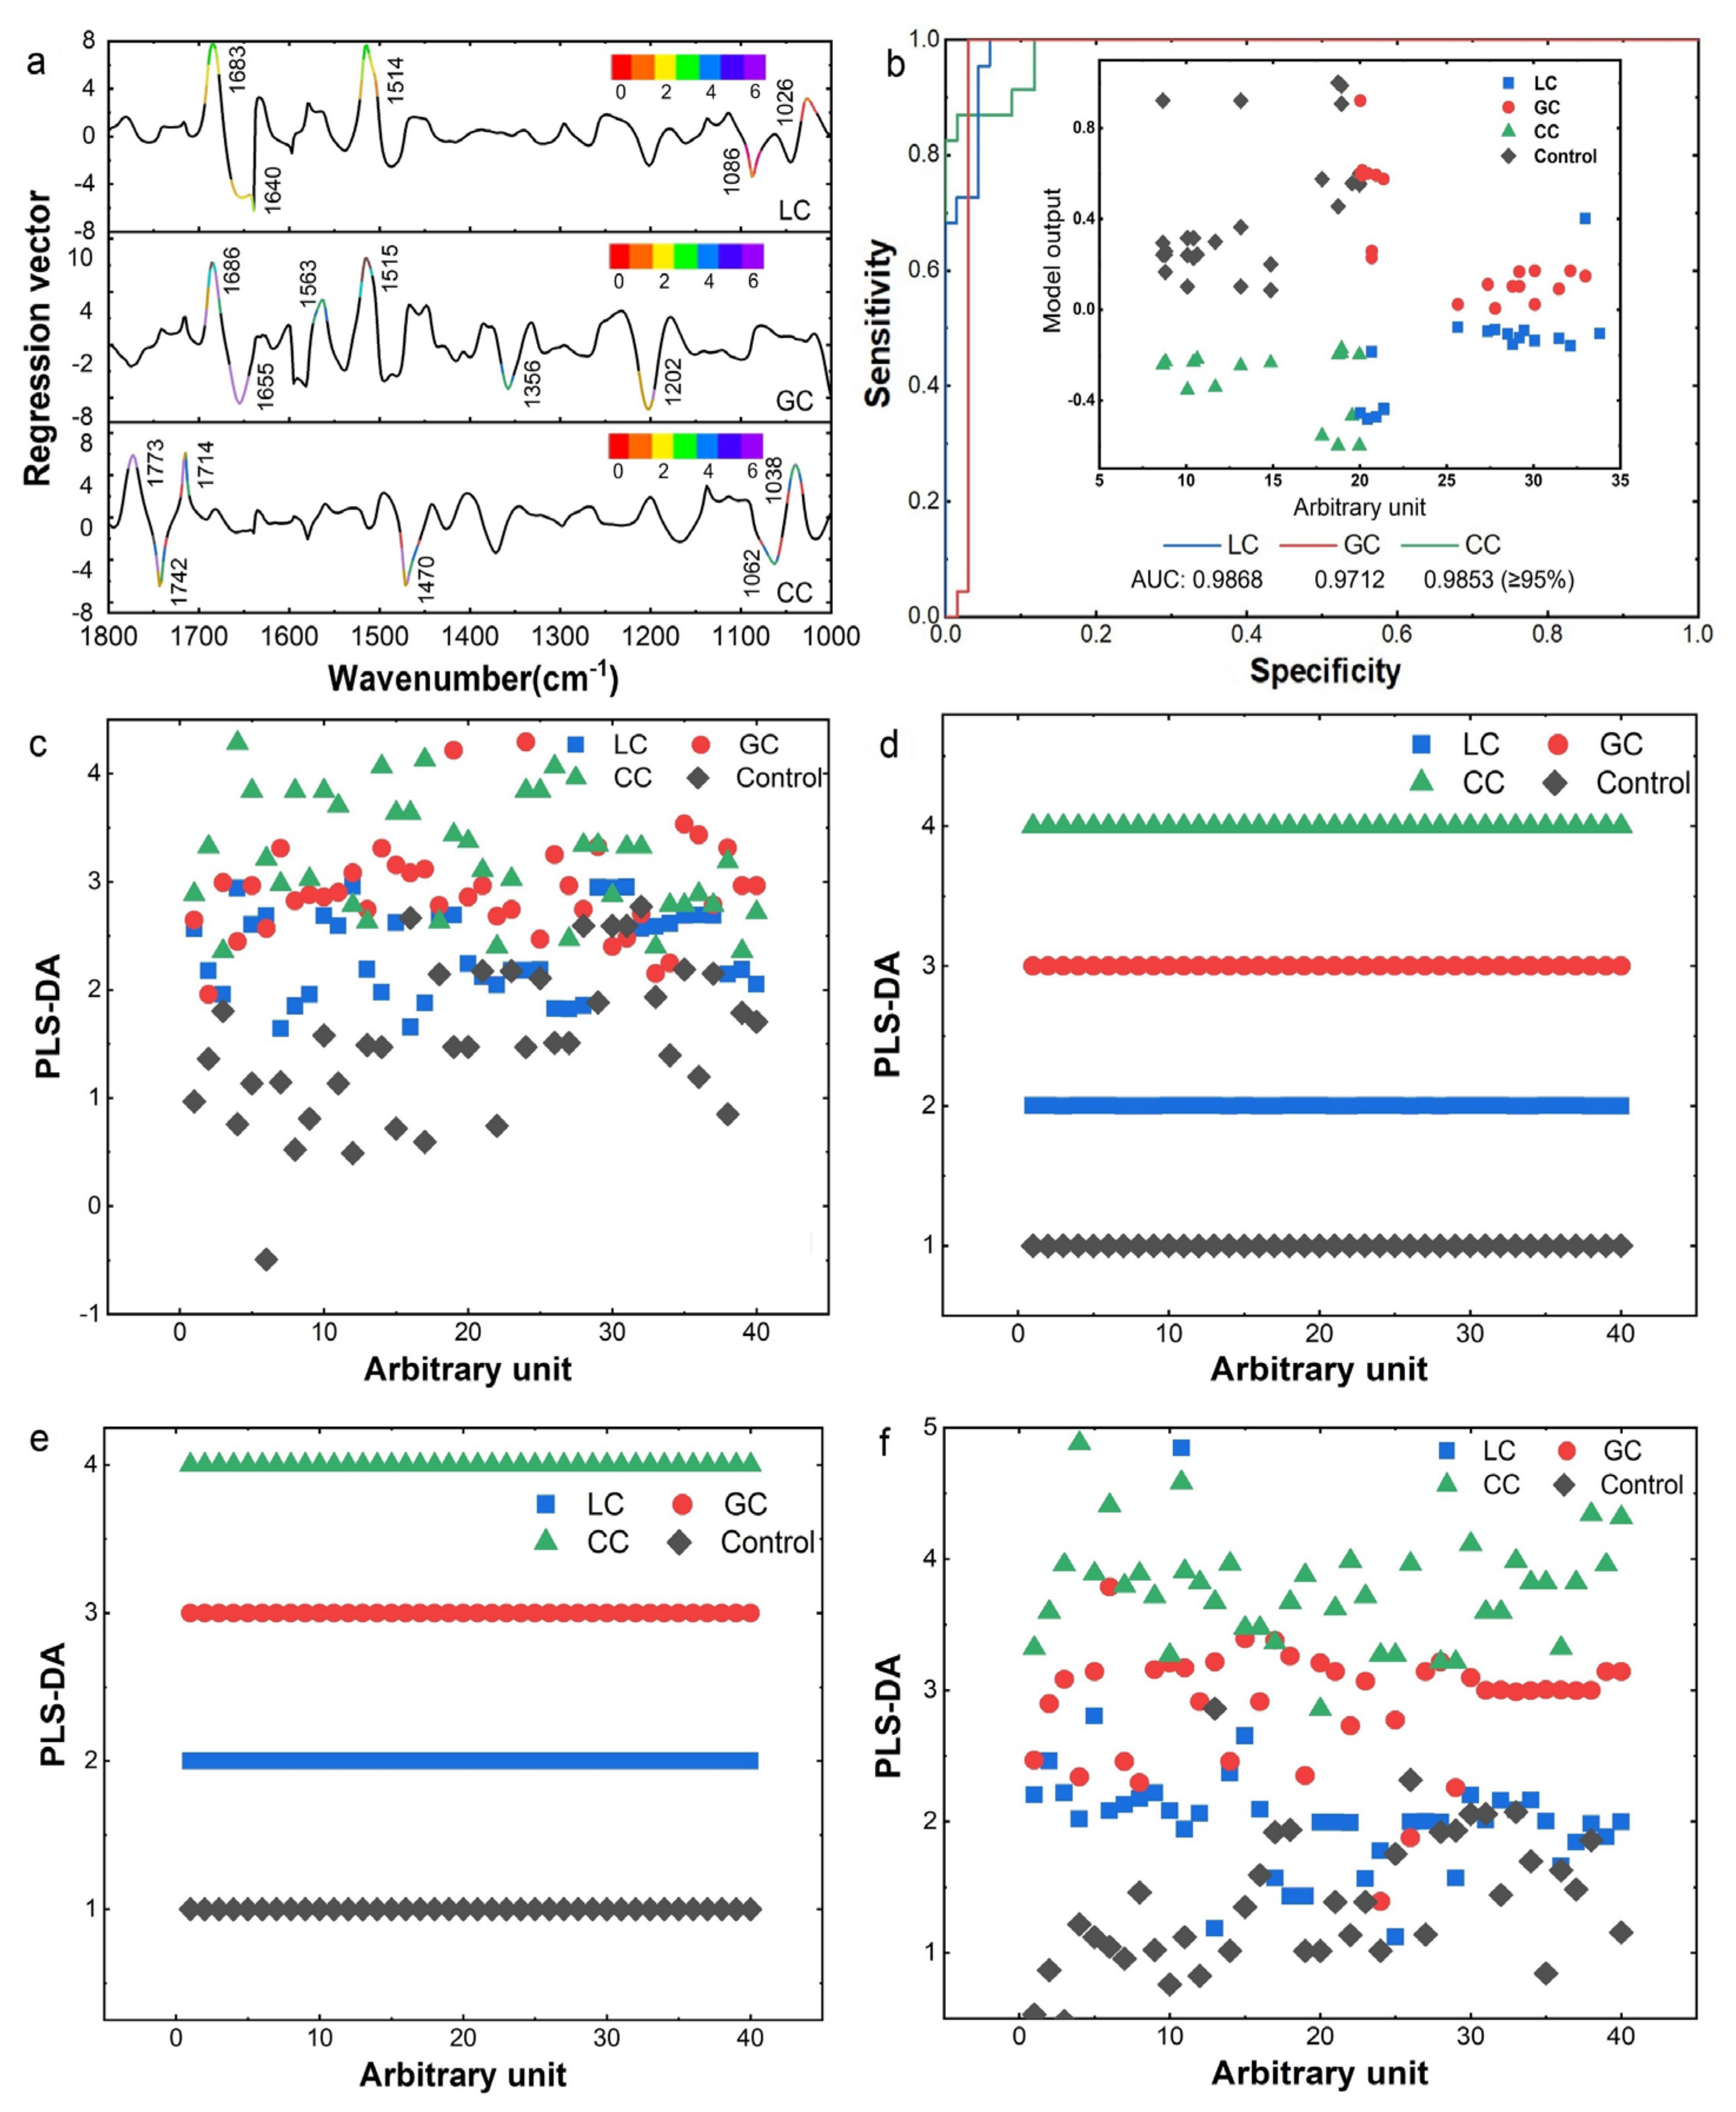
3.3. IMF-Based Identification of DTCs
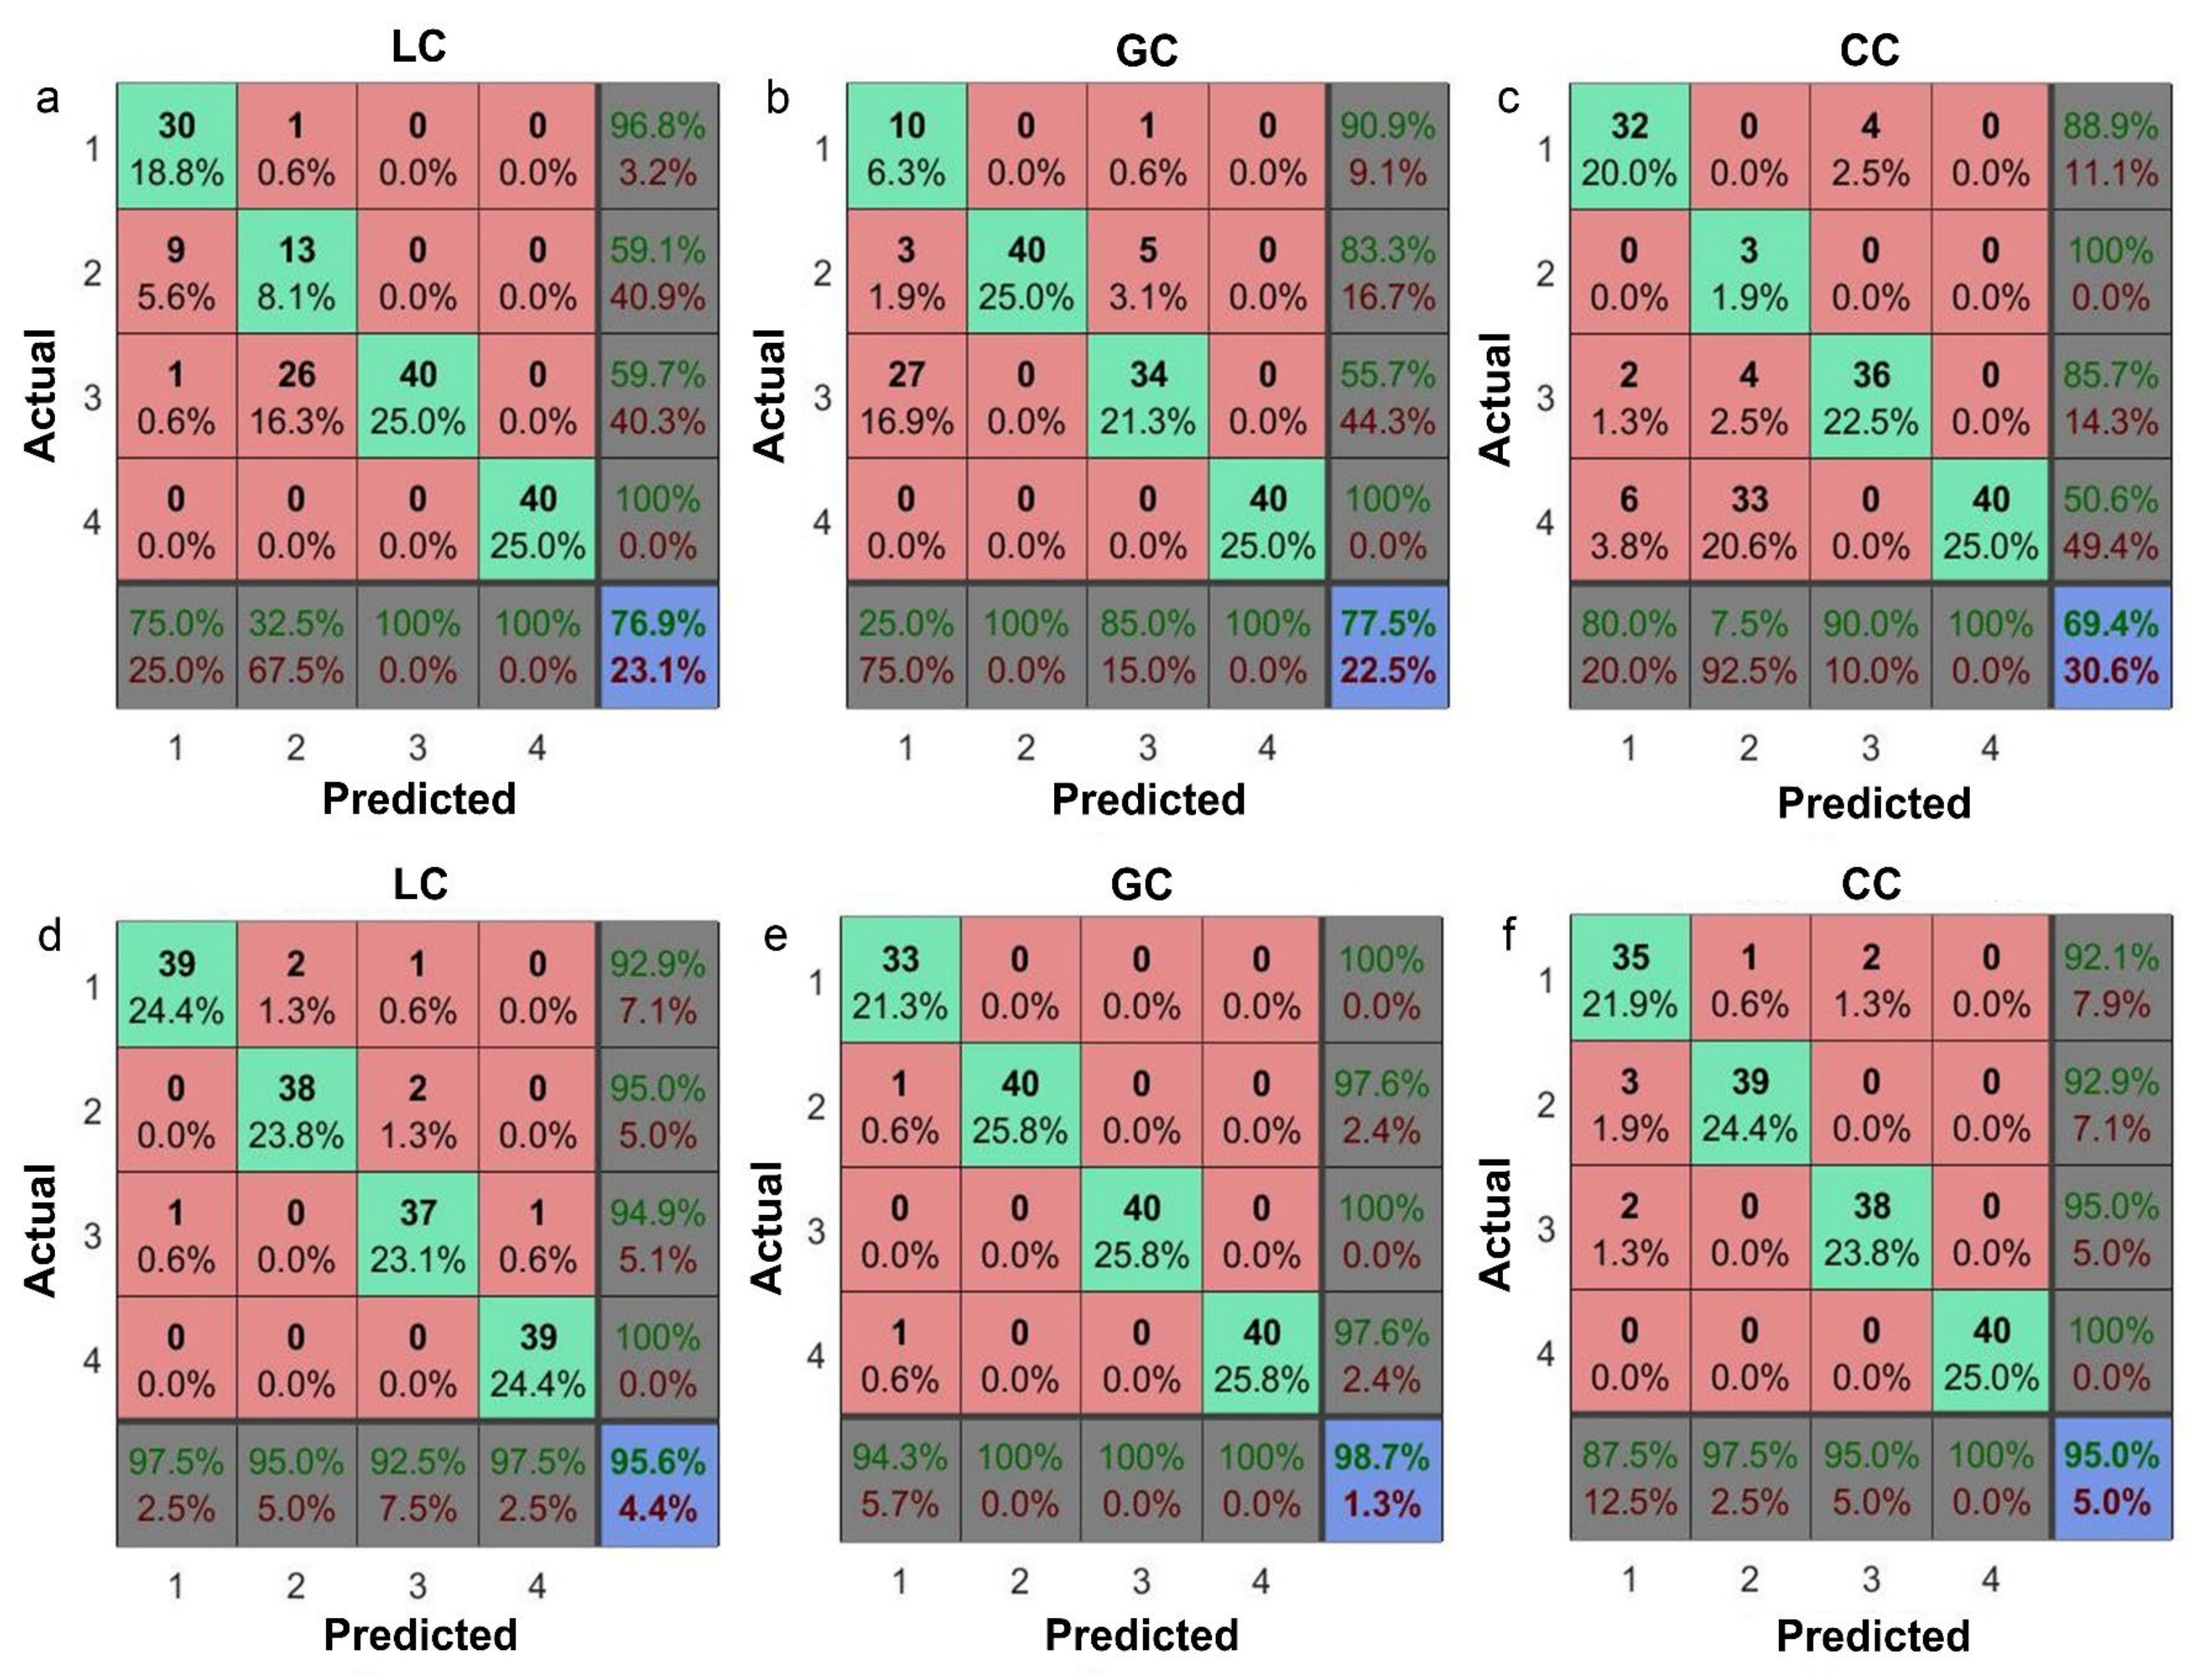
3.4. Machine Learning for Classification of Different Pathological Stage
4. Discussion
5. Conclusions
Supplementary Materials
Author Contributions
Funding
Institutional Review Board Statement
Informed Consent Statement
Data Availability Statement
Acknowledgments
Conflicts of Interest
References
- Wallace, T.A.; Martin, D.N.; Ambs, S. Interactions among genes, tumor biology and the environment in cancer health disparities: Examining the evidence on a national and global scale. Carcinogenesis 2011, 32, 1107–1121. [Google Scholar] [CrossRef] [PubMed] [Green Version]
- Yan, M.; Wang, W. Radiomic Analysis of CT Predicts Tumor Response in Human Lung Cancer with Radiotherapy. J. Digit. Imaging 2020, 33, 1401–1403. [Google Scholar] [CrossRef] [PubMed]
- Ren, Y.; Cao, Y.; Hu, W.; Wei, X.; Shen, X. Diagnostic accuracy of computed tomography imaging for the detection of differences between peripheral small cell lung cancer and peripheral non-small cell lung cancer. Int. J. Clin. Oncol. 2017, 22, 865–871. [Google Scholar] [CrossRef] [PubMed] [Green Version]
- Siegel, R.L.; Miller, K.D.; Fuchs, H.E.; Jemal, A. Cancer statistics, 2022. CA Cancer J. Clin. 2022, 72, 7–33. [Google Scholar] [CrossRef] [PubMed]
- Cao, W.; Chen, H.D.; Yu, Y.W.; Li, N.; Chen, W.Q. Changing profiles of cancer burden worldwide and in China: A secondary analysis of the global cancer statistics 2020. Chin. Med. J. Engl. 2021, 134, 783–791. [Google Scholar] [CrossRef] [PubMed]
- Belczacka, I.; Latosinska, A.; Metzger, J.; Marx, D.; Vlahou, A.; Mischak, H.; Frantzi, M. Proteomics biomarkers for solid tumors: Current status and future prospects. Mass. Spectrom. Rev. 2019, 38, 49–78. [Google Scholar] [CrossRef]
- Zhang, A.H.; Sun, H.; Qiu, S.; Wang, X.J. Metabolomics in noninvasive breast cancer. Clin. Chim. Acta 2013, 424, 3–7. [Google Scholar] [CrossRef] [Green Version]
- Qiu, Y.; Zhou, B.; Su, M.; Baxter, S.; Zheng, X.; Zhao, X.; Yen, Y.; Jia, W. Mass spectrometry-based quantitative metabolomics revealed a distinct lipid profile in breast cancer patients. Int. J. Mol. Sci. 2013, 14, 8047–8061. [Google Scholar] [CrossRef] [Green Version]
- Heitzer, E.; Speicher, M.R. One size does not fit all: Size-based plasma DNA diagnostics. Sci. Transl. Med. 2018, 10, 466. [Google Scholar] [CrossRef]
- Schaffner, F.; Merlin, J.L.; Bubnoff, N.V. Tumor Liquid Biopsies; Recent Results in Cancer Research; Springer: Cham, Switzerland, 2020. [Google Scholar] [CrossRef]
- Yoo, B.C.; Kim, K.H.; Woo, S.M.; Myung, J.K. Clinical multi-omics strategies for the effective cancer management. J. Proteom. 2018, 188, 97–106. [Google Scholar] [CrossRef]
- Zachariou, M.; Minadakis, G.; Oulas, A.; Afxenti, S.; Spyrou, G.M. Integrating multi-source information on a single network to detect disease-related clusters of molecular mechanisms. J. Proteom. 2018, 188, 15–29. [Google Scholar] [CrossRef] [PubMed]
- Pupeza, I.; Huber, M.; Trubetskov, M.; Schweinberger, W.; Hussain, S.A.; Hofer, C.; Fritsch, K.; Poetzlberger, M.; Vamos, L.; Fill, E.; et al. Field-resolved infrared spectroscopy of biological systems. Nature 2020, 577, 52–59. [Google Scholar] [CrossRef] [PubMed]
- Butler, H.J.; Brennan, P.M.; Cameron, J.M.; Finlayson, D.; Hegarty, M.G.; Jenkinson, M.D.; Palmer, D.S.; Smith, B.R.; Baker, M.J. Development of high-throughput ATR-FTIR technology for rapid triage of brain cancer. Nat. Commun. 2019, 10, 4501. [Google Scholar] [CrossRef] [PubMed] [Green Version]
- Kong, X.; Wang, F.; Guo, S.; Wang, H.; Lü, Z.; Xu, C.; Guan, Y.; Kong, L.; Li, J.; Wei, G.; et al. Structural and spectral morphometry and diagnosis of lung tumors. Infrared Phys. Technol. 2022, 124, 104229. [Google Scholar] [CrossRef]
- Ollesch, J.; Theegarten, D.; Altmayer, M.; Darwiche, K.; Hager, T.; Stamatis, G.; Gerwert, K.; Gerwert, K. An infrared spectroscopic blood test for non-small cell lung carcinoma and subtyping into pulmonary squamous cell carcinoma or adenocarcinoma. Biomed. Spectrosc. Imaging 2016, 5, 129–144. [Google Scholar] [CrossRef] [Green Version]
- Gajjar, K.; Trevisan, J.; Owens, G.; Keating, P.J.; Wood, N.J.; Stringfellow, H.F.; Martin-Hirsch, P.L.; Martin, F.L. Fourier-transform infrared spectroscopy coupled with a classification machine for the analysis of blood plasma or serum: A novel diagnostic approach for ovarian cancer. Analyst 2013, 138, 3917–3926. [Google Scholar] [CrossRef]
- Zelig, U.; Barlev, E.; Bar, O.; Gross, I.; Flomen, F.; Mordechai, S.; Kapelushnik, J.; Nathan, I.; Kashtan, H.; Wasserberg, N.; et al. Early detection of breast cancer using total biochemical analysis of peripheral blood components: A preliminary study. BMC Cancer 2015, 15, 408. [Google Scholar] [CrossRef] [Green Version]
- Krafft, C.; Wilhelm, K.; Eremin, A.; Nestel, S.; von Bubnoff, N.; Schultze-Seemann, W.; Popp, J.; Nazarenko, I. A specific spectral signature of serum and plasma-derived extracellular vesicles for cancer screening. Nanomedicine 2017, 13, 835–841. [Google Scholar] [CrossRef]
- Sahu, R.K.; Zelig, U.; Huleihel, M.; Brosh, N.; Talyshinsky, M.; Ben-Harosh, M.; Mordechai, S.; Kapelushnik, J. Continuous monitoring of WBC (biochemistry) in an adult leukemia patient using advanced FTIR-spectroscopy. Leuk. Res. 2006, 30, 687–693. [Google Scholar] [CrossRef]
- Dong, L.; Sun, X.; Chao, Z.; Zhang, S.; Zheng, J.; Gurung, R.; Du, J.; Shi, J.; Xu, Y.; Zhang, Y.; et al. Evaluation of FTIR spectroscopy as diagnostic tool for colorectal cancer using spectral analysis. Spectrochim. Acta A Mol. Biomol. Spectrosc. 2014, 122, 288–294. [Google Scholar] [CrossRef]
- Lewis, P.D.; Lewis, K.E.; Ghosal, R.; Bayliss, S.; Lloyd, A.J.; Wills, J.; Godfrey, R.; Kloer, P.; Mur, L.A. Evaluation of FTIR spectroscopy as a diagnostic tool for lung cancer using sputum. BMC Cancer 2010, 10, 640. [Google Scholar] [CrossRef] [PubMed] [Green Version]
- Hands, J.R.; Clemens, G.; Stables, R.; Ashton, K.; Brodbelt, A.; Davis, C.; Dawson, T.P.; Jenkinson, M.D.; Lea, R.W.; Walker, C.; et al. Brain tumour differentiation: Rapid stratified serum diagnostics via attenuated total reflection Fourier-transform infrared spectroscopy. J. Neurooncol. 2016, 127, 463–472. [Google Scholar] [CrossRef] [PubMed] [Green Version]
- Sbroscia, M.; Di Gioacchino, M.; Ascenzi, P.; Crucitti, P.; di Masi, A.; Giovannoni, I.; Longo, F.; Mariotti, D.; Naciu, A.M.; Palermo, A.; et al. Thyroid cancer diagnosis by Raman spectroscopy. Sci. Rep. 2020, 10, 13342. [Google Scholar] [CrossRef] [PubMed]
- Smith, B.R.; Ashton, K.M.; Brodbelt, A.; Dawson, T.; Jenkinson, M.D.; Hunt, N.T.; Palmer, D.S.; Baker, M.J. Combining random forest and 2D correlation analysis to identify serum spectral signatures for neuro-oncology. Analyst 2016, 141, 3668–3678. [Google Scholar] [CrossRef] [PubMed] [Green Version]
- Xie, H.; Deng, B.; Du, G.; Fu, Y.; He, Y.; Guo, H.; Peng, G.; Xue, Y.; Zhou, G.; Ren, Y.; et al. X-ray biomedical imaging beamline at SSRF. J. Instrum. 2013, 8, C08003. [Google Scholar] [CrossRef] [Green Version]
- Guo, S.; Xiu, J.; Kong, L.; Kong, X.; Wang, H.; Lü, Z.; Xu, F.; Li, J.; Ji, T.; Wang, F.; et al. Micro-tomographic and infrared spectral data mining for breast cancer diagnosis. Opt. Laser Eng. 2022, 160, 107305. [Google Scholar] [CrossRef]
- Zhang, L.; Xiao, M.; Wang, Y.; Peng, S.; Chen, Y.; Zhang, D.; Zhang, D.; Guo, Y.; Wang, X.; Luo, H.; et al. Fast Screening and Primary Diagnosis of COVID-19 by ATR-FT-IR. Anal. Chem. 2021, 93, 2191–2199. [Google Scholar] [CrossRef]
- Huber, M.; Kepesidis, K.V.; Voronina, L.; Bozic, M.; Trubetskov, M.; Harbeck, N.; Krausz, F.; Zigman, M. Stability of person-specific blood-based infrared molecular fingerprints opens up prospects for health monitoring. Nat. Commun. 2021, 12, 1511. [Google Scholar] [CrossRef]
- Bonnier, F.; Blasco, H.; Wasselet, C.; Brachet, G.; Respaud, R.; Carvalho, L.F.; Bertrand, D.; Baker, M.J.; Byrne, H.J.; Chourpa, I. Ultra-filtration of human serum for improved quantitative analysis of low molecular weight biomarkers using ATR-IR spectroscopy. Analyst 2017, 142, 1285–1298. [Google Scholar] [CrossRef]
- Guleken, Z.; Bulut, H.; Gultekin, G.I.; Arikan, S.; Yaylim, I.; Hakan, M.T.; Sonmez, D.; Tarhan, N.; Depciuch, J. Assessment of structural protein expression by FTIR and biochemical assays as biomarkers of metabolites response in gastric and colon cancer. Talanta 2021, 231, 122353. [Google Scholar] [CrossRef] [PubMed]
- Fogarty, S.W.; Patel, I.I.; Trevisan, J.; Nakamura, T.; Hirschmugl, C.J.; Fullwood, N.J.; Martin, F.L. Sub-cellular spectrochemical imaging of isolated human corneal cells employing synchrotron radiation-based Fourier-transform infrared microspectroscopy. Analyst 2013, 138, 240–248. [Google Scholar] [CrossRef] [PubMed]
- Patel, I.I.; Shearer, D.A.; Fogarty, S.W.; Fullwood, N.J.; Quaroni, L.; Martin, F.L.; Weisz, J. Infrared microspectroscopy identifies biomolecular changes associated with chronic oxidative stress in mammary epithelium and stroma of breast tissues from healthy young women: Implications for latent stages of breast carcinogenesis. Cancer Biol. Ther. 2014, 15, 225–235. [Google Scholar] [CrossRef] [PubMed] [Green Version]
- Bro, R.; Smilde, A.K. Principal component analysis. Anal. Methods 2014, 6, 2812–2831. [Google Scholar] [CrossRef] [Green Version]
- Ballabio, D.; Consonni, V. Classification tools in chemistry. Part 1: Linear models. PLS-DA. Anal. Methods 2013, 5, 3790–3798. [Google Scholar] [CrossRef]
- Lee, L.C.; Liong, C.Y.; Jemain, A.A. Partial least squares-discriminant analysis (PLS-DA) for classification of high-dimensional (HD) data: A review of contemporary practice strategies and knowledge gaps. Analyst 2018, 143, 3526–3539. [Google Scholar] [CrossRef]
- Chawla, N.V.; Bowyer, K.W.; Hall, L.O.; Kegelmeyer, W.P. Smote: Synthetic minority over-sampling technique. J. Artif. Intell. Res. 2002, 16, 321–357. [Google Scholar] [CrossRef]
- Wang, S.; Liu, S.; Zhang, J.; Che, X.; Yuan, Y.; Wang, Z.; Kong, D. A new method of diesel fuel brands identification: SMOTE oversampling combined with XGBoost ensemble learning. Fuel 2020, 282, 118848. [Google Scholar] [CrossRef]
- De Caigny, A.; Coussement, K.; De Bock, K.W. A new hybrid classification algorithm for customer churn prediction based on logistic regression and decision trees. Eur. J. Oper. Res. 2018, 269, 760–772. [Google Scholar] [CrossRef]
- Swami, A.; Jain, R. Scikit-learn: Machine Learning in Python. J. Mach. Learn. Res. 2013, 12, 2825–2830. [Google Scholar] [CrossRef]
- Huber, M.; Kepesidis, K.V.; Voronina, L.; Fleischmann, F.; Fill, E.; Hermann, J.; Koch, I.; Milger-Kneidinger, K.; Kolben, T.; Schulz, G.B.; et al. Infrared molecular fingerprinting of blood-based liquid biopsies for the detection of cancer. eLife 2021, 10, e68758. [Google Scholar] [CrossRef]
- Cameron, J.M.; Butler, H.J.; Smith, B.R.; Hegarty, M.G.; Jenkinson, M.D.; Syed, K.; Brennan, P.M.; Ashton, K.; Dawson, T.; Palmer, D.S.; et al. Developing infrared spectroscopic detection for stratifying brain tumour patients: Glioblastoma multiforme vs. lymphoma. Analyst 2019, 144, 6736–6750. [Google Scholar] [CrossRef] [PubMed]


| Assignments | Band Locations/(cm−1) | Relative Absorbance (a.u.) | ||||||
|---|---|---|---|---|---|---|---|---|
| LC (p) | GC (p) | CC (p) | Control | LC | GC | CC | Control | |
| amide A | 3366.2 (**) | 3364.2 | 3364.2 | 3346.3 | 1 | 1 | 1 | 1 |
| νas (CH3) | 2962.4 (***) | 2956.7 (**) | 2960.6 (***) | 2954.8 | 1.06 | 1.12 | 0.94 | 1.07 |
| νas (CH2) | 2927.8 (**) | 2925.8 | 2923.9 (**) | 2925.8 | 1 | 1.06 | 0.82 | 0.83 |
| amide I | 1637.5 | 1639.4 (**) | 1638.2 (*) | 1637.6 | 1 | 1 | 1 | 1 |
| amide II | 1548.8 (**) | 1544.9 (**) | 1554.5 (***) | 1546.9 | 0.98 | 1.04 | 0.79 | 1.03 |
| δ (CH2) | 1456.2 (***) | 1455.6 (***) | 1460.0 (***) | 1452.3 | 1.11 | 1.05 | 0.83 | 0.83 |
| νs (COO−) | 1400.0 (***) | 1398.3 (**) | 1402.2 (***) | 1397.6 | 0.95 | 1.05 | 0.73 | 1.02 |
| amide III | 1315.4 (***) | 1309.6 (**) | 1313.4 (***) | 1311.5 | 0.93 | 1.26 | 0.73 | 1.02 |
| νas (PO2−) | 1245.9 (**) | 1247.9 | 1244.0 (***) | 1247.2 | 0.87 | 1 | 0.67 | 0.91 |
| νs (C-O-C) | 1168.8 (**) | 1164.9 (***) | 1167.3 (*) | 1166.9 | 0.83 | 1 | 0.67 | 0.91 |
| νs (PO2−) | 1089.7 (**) | 1083.9 (***) | 1081.8 (***) | 1091.6 | 0.92 | 1 | 0.58 | 0.91 |
| Serum Biochemistry | Structural Formula | Function Groups | LC | GC | CC | |||||
|---|---|---|---|---|---|---|---|---|---|---|
| Test Item | Reference Range | Results | FTIR Band (Δ) | Absorb (%) | FTIR Band (Δ) | Absorb (%) | FTIR Band (Δ) | Absorb (%) | ||
| CEA | 0–5 ng/mL | LC: 1.37 (±0.07) GC: 34.83 (±0.12) CC: 68.70 (±0.25) |  | δ(NH) ν(C-O-H) | 1508.1↑ 1041.9↑ | 0.74↑ 0.68↑ | 1508.0↑ 1039.7 | 0.72↑ 0.69↑ | 1508.1↑ 1041.2↑ | 0.73↑ 0.68 |
| CA | 0–35 U/mL | LC: 54.74 (±0.21) GC: 201.02 (±0.63) CC: 423.79 (±0.47) | 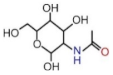 | νs(NH-C=O) δout(NH) | 1119.4↑ 984.8↑ | 0.68↑ 0.70↑ | 1119.4↑ 986.1↑ | 0.67↑ 0.69↑ | 1118.2↑ 986.1↑ | 0.66↑ 0.70↑ |
| AFP | 0–9 ng/mL | LC: 701.01 (±0.52) | 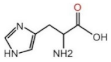 | ν(C=O) | 1638.2↓ | 0.02↑ | ||||
| Methods | Accuracies of Classification | ||
|---|---|---|---|
| Raw IR Data (%) | SD-IR Data (%) | Combined Data(%) | |
| BP | 72.3 (±0.31) | 91.4 (±0.24) | 97.1 (±0.11) |
| KNN | 81.1 (±0.14) | 85.6 (±0.09) | 93.8 (±0.06) |
| RF | 76.3 (±0.18) | 87.0 (±0.13) | 92.7 (±0.03) |
| DT | 73.0 (±0.26) | 84.5 (±0.14) | 92.7 (±0.19) |
| Logistic | 71.1 (±0.29) | 85.6 (±0.26) | 96.6 (±0.06) |
| SVM | 74.5 (±0.15) | 82.4 (±0.13) | 97.7 (±0.19) |
| MVLR | 87.5 (±0.09) | 96.4 (±0.04) | 100.0 (±0) |
| PLS-DA | 88.2 (±0.05) | 97.9 (±0.02) | 100.0 (±0) |
Publisher’s Note: MDPI stays neutral with regard to jurisdictional claims in published maps and institutional affiliations. |
© 2022 by the authors. Licensee MDPI, Basel, Switzerland. This article is an open access article distributed under the terms and conditions of the Creative Commons Attribution (CC BY) license (https://creativecommons.org/licenses/by/4.0/).
Share and Cite
Guo, S.; Wei, G.; Chen, W.; Lei, C.; Xu, C.; Guan, Y.; Ji, T.; Wang, F.; Liu, H. Fast and Deep Diagnosis Using Blood-Based ATR-FTIR Spectroscopy for Digestive Tract Cancers. Biomolecules 2022, 12, 1815. https://doi.org/10.3390/biom12121815
Guo S, Wei G, Chen W, Lei C, Xu C, Guan Y, Ji T, Wang F, Liu H. Fast and Deep Diagnosis Using Blood-Based ATR-FTIR Spectroscopy for Digestive Tract Cancers. Biomolecules. 2022; 12(12):1815. https://doi.org/10.3390/biom12121815
Chicago/Turabian StyleGuo, Shanshan, Gongxiang Wei, Wenqiang Chen, Chengbin Lei, Cong Xu, Yu Guan, Te Ji, Fuli Wang, and Huiqiang Liu. 2022. "Fast and Deep Diagnosis Using Blood-Based ATR-FTIR Spectroscopy for Digestive Tract Cancers" Biomolecules 12, no. 12: 1815. https://doi.org/10.3390/biom12121815