Article

The Effect of Positive Charge Distribution on the Cryoprotective Activity of Dehydrins

by
Margaret A. Smith
1 and
Steffen P. Graether
1,2,*
1
Department of Molecular and Cellular Biology, University of Guelph, Guelph, ON N1G 2W1, Canada
2
Graduate Program in Bioinformatics, University of Guelph, Guelph, ON N1G 2W1, Canada
*
Author to whom correspondence should be addressed.
Biomolecules 2022, 12(10), 1510; https://doi.org/10.3390/biom12101510
Submission received: 27 September 2022 / Revised: 14 October 2022 / Accepted: 16 October 2022 / Published: 19 October 2022

Abstract

:
Dehydrins are intrinsically disordered proteins expressed ubiquitously throughout the plant kingdom in response to desiccation. Dehydrins have been found to have a cryoprotective effect on lactate dehydrogenase (LDH) in vitro, which is in large part influenced by their hydrodynamic radius rather than the order of the amino acids within the sequence (alternatively, this may be a sequence specific effect). However, it seems that a different mechanism may underpin the cryoprotection that they confer to the cold-labile yeast frataxin homolog-1 (Yfh1). Circular dichroism spectroscopy (CD) was used to assess the degree of helicity of Yfh1 at 1 °C, both alone and in the presence of several dehydrin constructs. Three constructs were compared to the wild type: YSK2-K→R (lysine residues substituted with arginine), YSK2-Neutral (locally neutralized charge), and YSK2-SpaceK (evenly distributed positive charge). The results show that sequence rearrangements and minor substitutions have little impact on the ability of the dehydrin to preserve LDH activity. However, when the positive charge of the dehydrin is locally neutralized or evenly distributed, the dehydrin becomes less efficient at promoting structure in Yfh1 at low temperatures. This suggests that a stabilizing, charge-based interaction occurs between dehydrins and Yfh1. Dehydrins are intrinsically disordered proteins, expressed by certain organisms to improve desiccation tolerance. These proteins are thought to serve many cellular roles, such as the stabilization of membranes, DNA, and proteins. However, the molecular mechanisms underlying the function of dehydrins are not well understood. Here, we examine the importance of positive charges in dehydrin sequences by making substitutions and comparing their effects in the cryoprotection of two different proteins.

1. Introduction

The plant kingdom has developed robust defense mechanisms to protect against many abiotic stresses, such as dehydration, which can be caused by drought and low temperatures. During water loss, plants face multiple problems, such as compromised membranes, increased concentration of reactive oxygen species, and a weakened hydrophobic effect [1]. One component of the dehydration defense mechanism is a group of intrinsically disordered proteins known as the late embryogenesis abundant (LEA) proteins, which includes the dehydrins studied here. LEA proteins were first identified in Gossypium hirsutum during late embryogenesis, a growth stage marked by naturally low water content [2]. They have since been found throughout the plant kingdom, not only during late embryogenesis but in vegetative tissue as well [3]. The role of LEA proteins has been studied in a number of transgenic plants through overexpression and knockout experiments [4,5,6,7,8,9,10]. Under cold and/or drought conditions, these plants display enhanced growth and survival, and reduced electrolyte leakage and lipid peroxidation compared to their non-transgenic counterparts. While the mechanism by which LEA proteins accomplish this in vivo is uncertain, in vitro evidence has shown that LEA proteins are able to scavenge ions and stabilize biomacromolecules [3,11,12,13].
Several groups of LEA proteins exist, defined by the presence of conserved sequence motifs. Among the most studied LEA proteins are those in group 2, also known as dehydrins (dehydration-induced proteins). Dehydrins are defined by the presence of a lysine-rich sequence motif known as the K-segment ([XKXGXX(D/E)KIK(D/E)KXPG], where X is any amino acid) [14]. In addition to this segment, dehydrins may have Y- and/or S-segments named after a central aromatic residue, such as tyrosine, and a string of 5–7 serine residues, respectively. As motifs, their sequence can be described as [D(D/E)(Y/H/F)GNPX] and [LHR(S/T)GS4–6(S/D/E)(D/E)3], respectively. More recently, an F-segment has been identified [15,16]. Like the Y-segment, the F-segment possesses aromatic residues ([EXXDRGXFDFX(G/K)]). These conserved segments are separated by poorly conserved ϕ-segments, which are rich in glycine and other polar amino acids, but are low in non-polar amino acids and generally lack cysteine. Dehydrins can be sorted into seven sequence architecture groups: YnSKn, FnSKn, YnKn, SKn, FnKn, Kn, and KnS. These groups are representative of which segments are present and how many of each are present is denoted by the ‘n’.
Dehydrins are overwhelmingly polar and lack the hydrophobic core that necessitates folding in ordered proteins. Instead, they are intrinsically disordered proteins (IDPs), specifically of the random coil type [12,17]. Random coil IDPs have no stable secondary structure and their tertiary structure is said to resemble spaghetti in boiling water [18]. The high glycine content of dehydrins give them considerable flexibility to randomly sample different conformations, limited mainly by backbone constraints and electrostatic repulsion. Their flexibility allows them to form very specific interactions with a multitude of binding partners. However, this comes at the cost of a significant loss of entropy, which makes these interactions highly reversible [19]. This, coupled with IDPs not having folded structure to be lost under denaturing conditions, makes dehydrins well suited as chaperones. One proposed role is as a macromolecule stabilizer under cold stress.
The cold denaturation of proteins is thought to occur when the surrounding water loses enough entropy that the entropic gain of protein unfolding outweighs the entropic loss of water organizing around exposed hydrophobic residues [20]. Lactate dehydrogenase (LDH) is commonly used to test the ability of a dehydrin to prevent cold-induced denaturation [17,21,22,23,24,25,26,27,28,29,30,31,32,33,34,35,36,37]. Typically, cryoprotection is measured by calculating the PD50 value (the concentration of additive required to recover 50% of the untreated LDH activity), where lower values represent more efficient protein cryoprotection.
Several studies have attempted to dissect the role of dehydrin segments in cryoprotection. Some studies have implicated the K-segment because a decrease in cryoprotective efficiency was observed when a K-segment was deleted [30,32]. Others have studied the cryoprotective efficiency of K-segment peptides and found it to be reduced when the hydrophobic residues were substituted with hydrophilic residues [35,37]. However, it appears likely that the greatest factor in cryoprotective efficiency, at least where LDH is concerned, is hydrodynamic radius [33]. When the ϕ-segment of a K2 dehydrin was removed, the dehydrin became a less effective cryoprotectant of LDH, despite retaining the same number of K-segments [31]. A follow-up study found that the cryoprotection of LDH by dehydrins could be largely explained as a relationship between the hydrodynamic radius and PD50 [33]. Additionally, polyethylene glycol (PEG), the disordered polar polymer, displays a similar relationship between hydrodynamic radius and cryoprotective efficiency [33].
One drawback to using LDH in cryoprotection assays is that it aggregates under cold stress, making it difficult to study the unfolding and protection processes. This prompted us to seek out an additional cold-labile protein for dehydrin cryoprotection assays that could be performed; the candidate that was used was yeast frataxin homolog 1 (Yfh1), a model protein for studying the cold denaturation of proteins [38]. Under physiological conditions, Yfh1 can begin to denature at 7 °C, such that denaturation studies can be carried out above freezing temperatures and without the need for destabilizing agents [38]. With respect to Yfh1, we found that the cryoprotective effects of dehydrins interestingly did not align with those observed when using LDH [36]. When the sequence of the dehydrins being studied was randomly scrambled, the scrambled variants were not necessarily as efficient cryoprotectants of Yfh1 as their non-scrambled counterparts, and two dehydrins were similarly efficient in their cryoprotection of Yfh1, despite having a three-fold difference in their hydrodynamic radii.
Here, we examine the importance of YSK2 sequence order in a dehydrin in its contribution to the cryoprotection, with an emphasis on the distribution of positive charges. Variants of the YSK2 dehydrin from Vitis riparia, a model dehydrin in our research, were constructed with substitutions and strategically rearranged sequence, and cryoprotection was studied using LDH in a freeze/thaw assay and Yfh1 in a low temperature denaturation assay.

2. Materials and Methods

2.1. Dehydrin Construct Design and Cloning

Protein sequences were submitted to Invitrogen GeneArt to be optimized for expression in E. coli. The genes were subsequently subcloned into pET-22b(+) (Novagen) and the success of the digestion and ligation were confirmed by DNA sequencing. The YSK2 gene, courtesy of Dr. Annette Nassuth (University of Guelph, Guelph, ON, Canada), had been previously cloned into pET22b-YSK2 as described in Livernois et al. [39]. Note that the sequence used here contains a H63N substitution relative to the UniProt sequence Q9M605. The pETYF-1 plasmid was a generous gift from Dr. Grazia Isaya (University of Minnesota Rochester, Rochester, MN). This plasmid encodes a truncated version of the mature Yfh1 (residues 54–174) and had previously been subcloned into pET24a(+) (Novagen) as described by Palmer et al. [36].

2.2. Dehydrin Expression and Purification

The YSK2 and YSK2 constructs were expressed and purified using a slight modification of Livernois et al. [39]. Briefly, the cells were lysed by boiling for 20 min with agitation every 5 min and were subsequently cooled on ice. Sodium acetate (pH 5.0) was added to a final concentration of 20 mM and the supernatant was filtered before continuing with purification. The filtered supernatant was loaded onto a 5 mL HiTrap SP HP column (Cytiva, Vancouver, BC, Canada) equilibrated with 20 mM sodium acetate, pH 5.0 (buffer A). Elution occurred over a gradient of 0–1 M NaCl (Buffer B: 20 mM sodium acetate, pH 5.0, 1 M NaCl). Fractions containing the protein of interest were desalted into Milli-Q water using a HiPrep 26/10 column (Cytiva). After concentrating the eluted protein fraction, reversed-phase HPLC was performed. The protein sample was purified using a BioBasic C4 column (Thermo Scientific, Ottawa, ON, Canada), which was equilibrated with Buffer A (0.1% trifluoroacetic acid (TFA) (w/v)). The protein was eluted using a 1–100% Buffer B (0.1% TFA (w/v) in acetonitrile) gradient. Sample purity was determined using 12% SDS-PAGE and the fractions containing the protein of interest were pooled, flash frozen and lyophilized. The proteins were stored at −20 °C until use.

2.3. Yfh1 Expression and Purification

Yfh1 was purified as described by Palmer et al. [36] Briefly, plasmid containing cells were grown at 37 °C to an OD600 of 0.6–0.8 prior to the addition of 0.4 mM IPTG. The cells were induced overnight at 16 °C with shaking. After centrifugation at 6000× g for 15 min, the media were decanted and the cell pellets were resuspended in 20 mM Tris, pH 8.0, 50 mM NaCl with an EDTA-free protease inhibitor tablet (Roche, Mississauga, ON, Canada) and 0.5 mM EDTA. Cells were lysed by sonication. The supernatant was collected by centrifugation at 20,000× g for 20 min at 4 °C, and was subsequently filtered through a 0.22 μM PVDF membrane. The filtered supernatant was run through a HiTrap Q FF anion exchange column (Cytiva) equilibrated with Buffer A (20 mM Tris HCl, pH 8, 50 mM NaCl) and eluted over a linear NaCl gradient of 50–600 mM (Buffer B: 20 mM Tris HCl, pH 8, 600 mM NaCl). Fractions containing Yfh1 were identified by 12% SDS-PAGE, then pooled, concentrated to ~3 mL, and passed through a Superdex 75 10/300 GL column (Cytiva) equilibrated with 10 mM Tris, pH 7.4, 100 mM NaCl buffer. Fractions containing the protein of interest were pooled and desalted into 10 mM Tris, pH 7.4, at room temperature using a HiPrep 26/10 desalting column (Cytiva). The Yfh1 was then concentrated to 3 mL using an Amicon ultra 15 mL centrifugal filter (10,000 Da molecular weight cut-off; Millipore, Etobicoke, ON, Canada), aliquoted, flash frozen, and stored at −20 °C until use.

2.4. LDH Cryoprotection

The LDH cryoprotection experiment was performed as previously described by Hughes and Graether [31] with small modifications. Briefly, 100 μg/mL of LDH from rabbit muscle (Sigma-Aldrich, Oakville, ON, Canada) was suspended in 10 mM Na2HPO4, pH 7.4, to a final volume of 500 μL, dialyzed overnight at 4 °C against 2 L of 10 mM Na2HPO4, pH 7.4, and lastly diluted twofold. The wild-type YSK2 and the dehydrin constructs (YSK2-SpaceK, YSK2-Neutral, and YSK2-K→R) had their concentrations determined using the BCA assay (Pierce, Ottawa, ON, Canada), and were then adjusted to a range of concentrations (5, 20, 50, 80, 120, 560, and 1000 μg/mL). LDH (to a final concentration of 5 μg/mL) and dehydrin were combined, 8 μL each, and all experiments were performed in triplicate. Each sample was then flash frozen for 30 s and thawed at 16 °C for 5 min. The cycle was repeated a total of five times for each sample. A volume of 724 μL of reaction buffer (680.6 μL of 30 mM Na2HPO4, pH 7.4, 21.7 μL of 2 mM NADH, and 21.7 μL of 10 mM pyruvic acid) was then added to each sample immediately before measuring A340 over the course of 2.5 min, with readings being taken each second using a Cary 100 UV-Vis spectrophotometer. The percent LDH activity was found by dividing the initial reaction velocity of the frozen samples by that of the positive control that had not been frozen. The data were plotted as %LDH activity vs. log(dehydrin concentration). The result was a sigmoidal curve fitted using %LDH activity = a/(1 + e(−(x−xo)/b)), where x is the dehydrin concentration and a, b, and xo were fitted variables.

2.5. Circular Dichroism

Prior to analysis, dehydrin samples were dissolved in 10 mM Tris, pH 7.4, and dialyzed overnight at 4 °C against 10 mM Tris, pH 7.4, to remove any contaminating salts. The dialyzed samples were filtered through an Ultrafree 0.22 μM PVDF membrane (Millipore). The Pierce BCA Protein Assay was used in conjunction with a BSA standard curve to determine dehydrin concentration. Yfh1 concentration was detected using A280 with an extinction coefficient of 15,470 M−1 cm−1, as predicted by the ExPASy server.
Circular dichroism (CD) was performed using a JASCO-815 spectropolarimeter (Jasco Inc., Easton, MD) and quartz cuvettes with 1 mm pathlengths. Spectra were collected from 190–250 nm using a bandwidth of 1 nm and a scan speed of 50 nm/min. Six accumulations were collected for each sample. Spectra of 10 μM Yfh1 were collected at 25 °C and 1 °C. Spectra of 10 μM Yfh1 in the presence and absence of YSK2, YSK2-SpaceK, YSK2-Neutral, and YSK2-K→R collected over a range of dehydrin concentrations (5, 7.5, 10, 15, 20, and 25 μM). The contribution of the dehydrins to the CD signal was subtracted, and the percent α-helicity of Yfh1 was then estimated using %α-helicity = 100 × (3000 − [θ]222)/39000, where [θ]222 is the molar ellipticity of Yfh1 at 222 nm in deg × cm2/dmol [40].

2.6. NMR Experiments

15N-HSQC-NMR spectra of 15N-YSK2 were collected in the presence and absence of Yfh1. The expression and purification of 15N-YSK2 was performed as described above with one exception. Upon reaching an OD600 of 0.6–0.8, the cells were washed and resuspended in M9-minimal media [39] containing 15N-NH4Cl, and then induced with IPTG. Samples were suspended in NMR buffer (50 mM Na2HPO4, 10 mM NaCl, pH 6.0, 0.01% (w/v) sodium azide, 0.1 mM DSS and 5% D2O (v/v)). One sample contained 0.5 mM 15N-labelled YSK2 alone, and the other contained 0.5 mM of 15N-labelled YSK2 and 0.5 mM of unlabeled Yfh1. Both experiments were performed at 300 K. Spectra were collected on a Bruker Avance DRX600 spectrometer with a cryogenic probe. Chemical shift assignments of YSK2 were obtained from Findlater and Graether [41]. The data were processed using NMRPipe v11.1 software [42] and analyzed with CCPNMR v2.4 [43].

3. Results

3.1. Construct Design and Structure

Three constructs were designed based on the wild-type sequence of YSK2 (Figure 1). The YSK2-K→R construct had all lysine residues substituted with arginine to examine the importance of positive charge versus the need for a lysine residue (Figure 1A). The YSK2-SpaceK and YSK2-Neutral constructs have the same amino acid composition as YSK2; however, the residues have been rearranged (Figure 1B). In the YSK2-SpaceK, the lysine residues are spaced evenly throughout the sequence, separated by ten residues, such that the positive charge is no longer clustered in the K-segments. In YSK2-Neutral, the aspartate and glutamate residues have been moved to be next to the lysine residues in the K-segments to locally neutralize the charge.
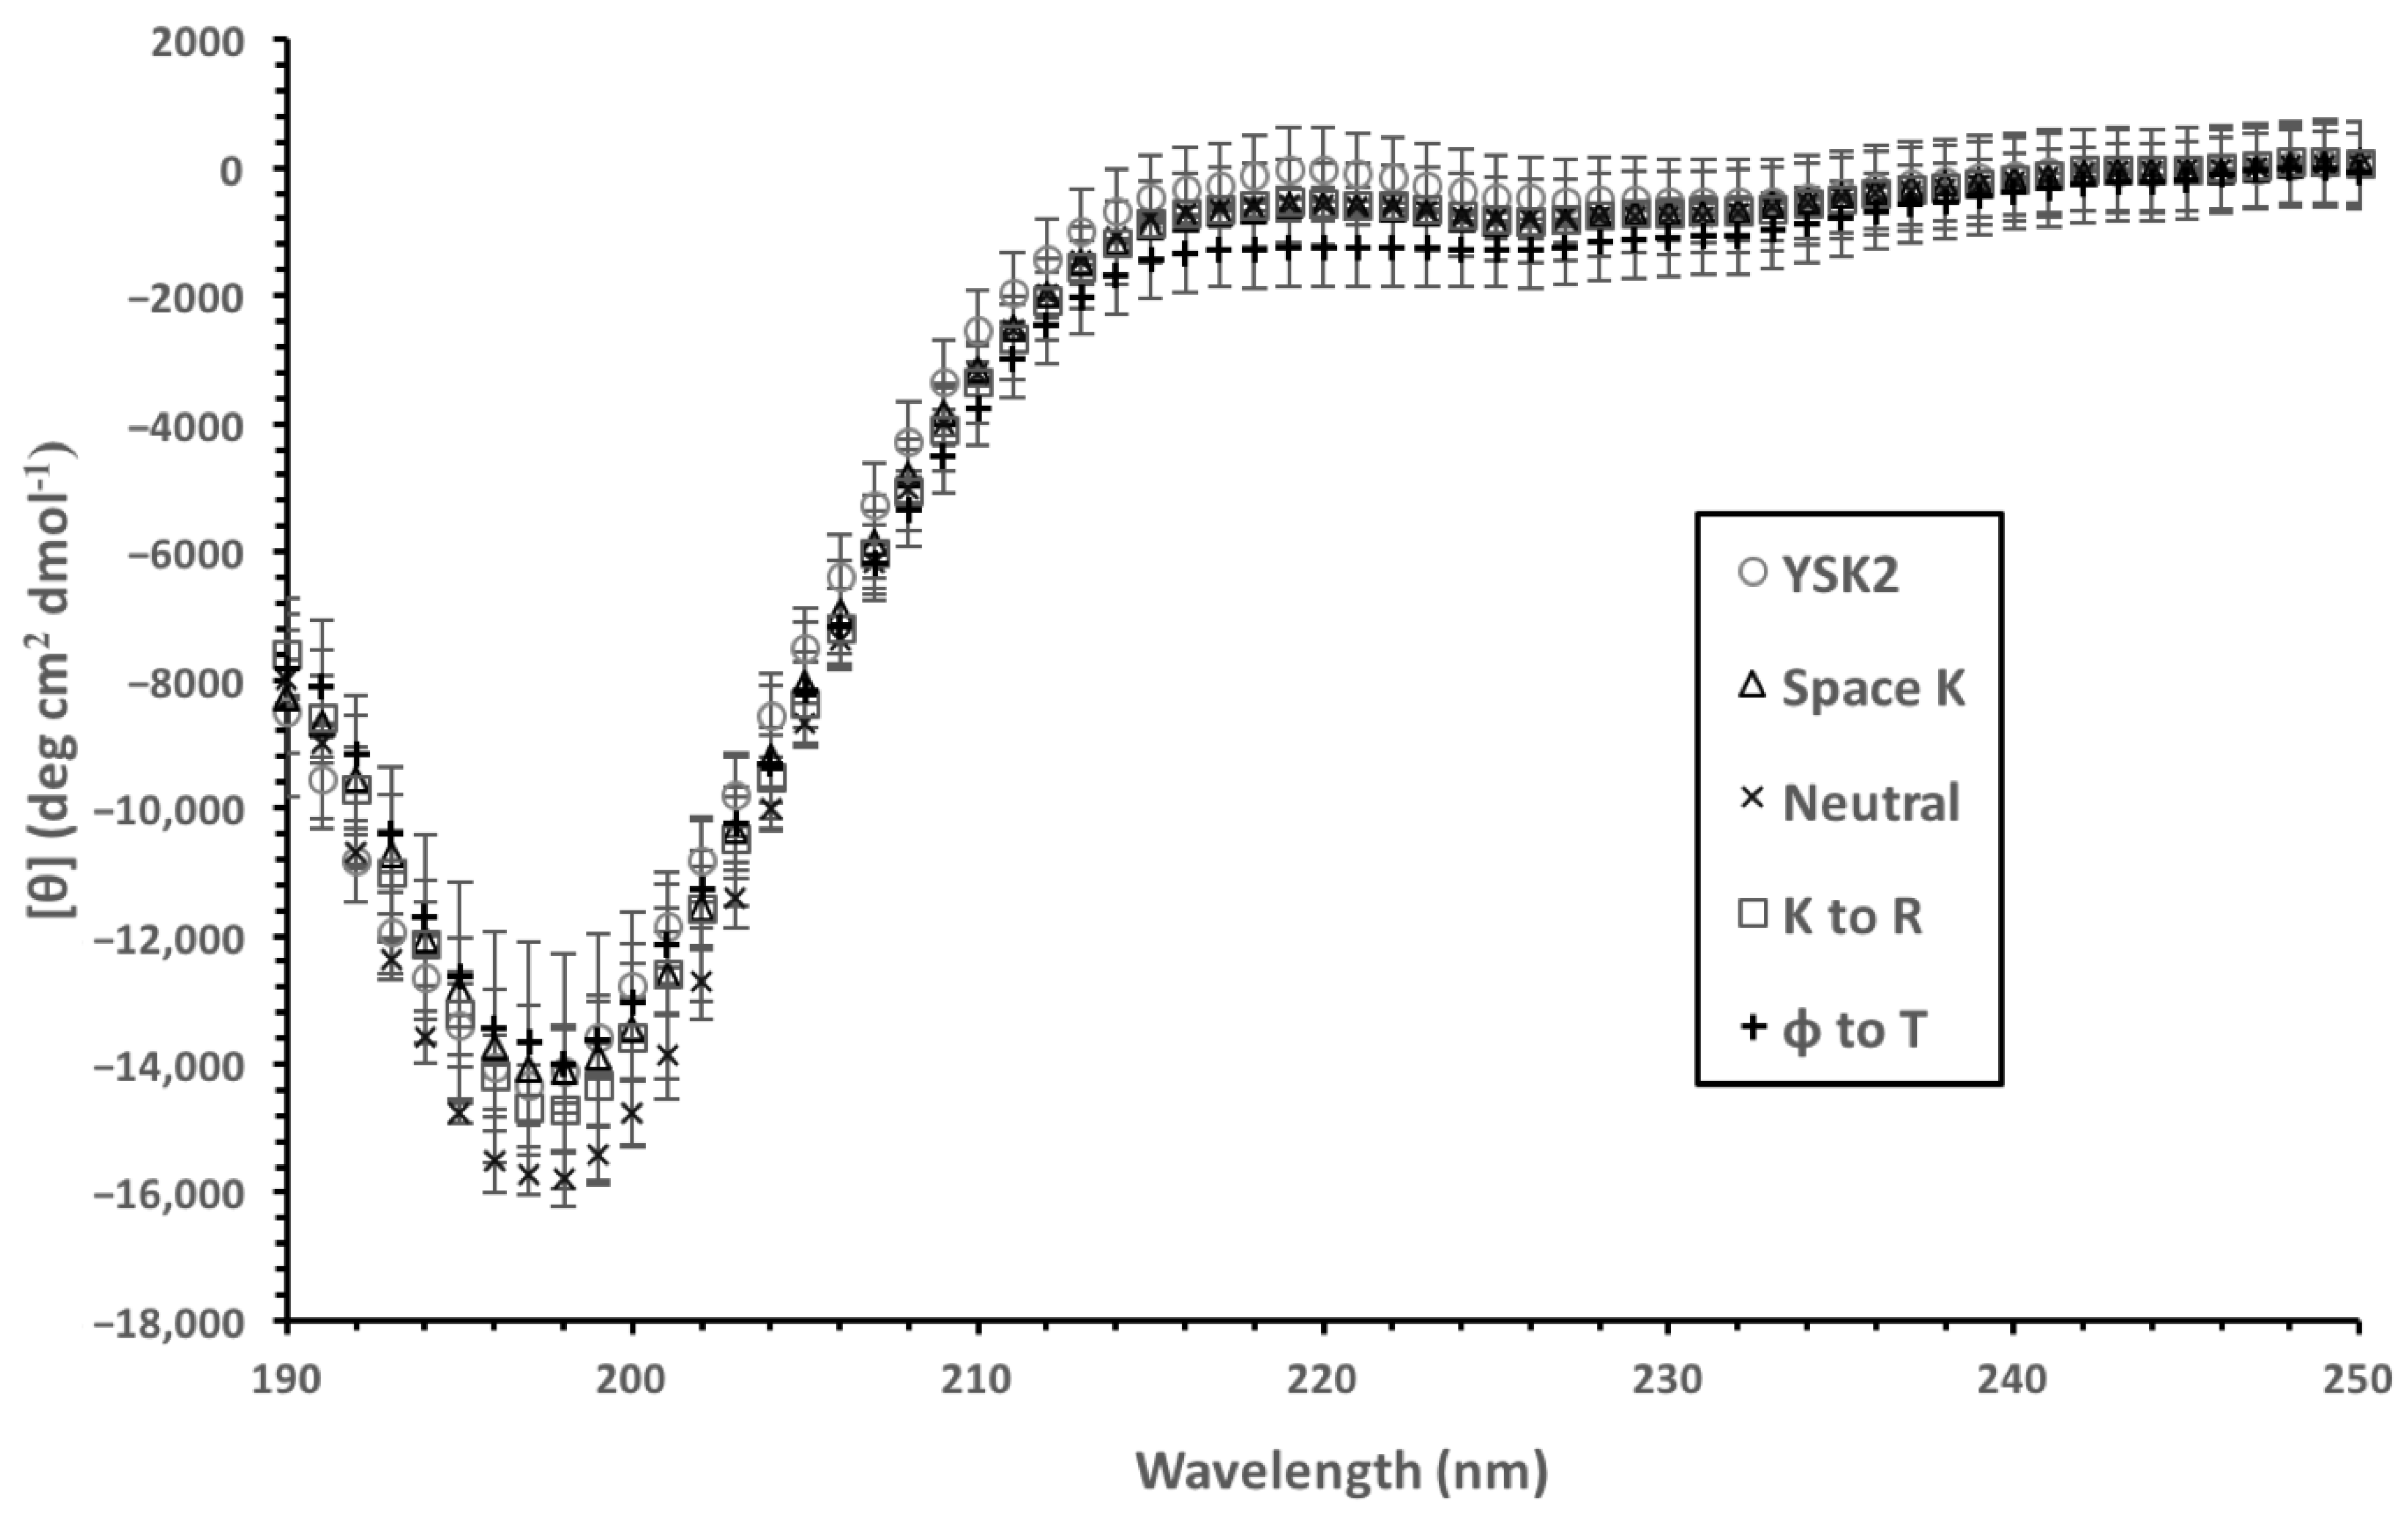
With the introduction of a large number of changes in an IDP sequence, there is a concern that the level of disorder may inadvertently change, which could affect the cryoprotection assay results [36]. To ensure that the constructs were similarly disordered as the wild-type YSK2, the CD spectra were collected and compared (Figure 2). All spectra displayed attributes characteristic of disordered proteins, including very little ellipticity above 210 nm and a minimum near 200 nm [44]. The spectra are very similar in shape between the four proteins, with all minima centered at 198 nm. The only exception was the molar ellipticity values, which were −14,000 deg·cm2/dmol for YSK2, YSK2-SpaceK, and YSK2-K→R, with YSK2-Neutral having a minimum of −16,000 deg·cm2/dmol, suggesting that this construct may be slightly more disordered. Based on these results, it is assumed that the degree of disorder of the constructs should not be a conflating variable.

3.2. LDH Cryoprotection

We first examined the effects the constructs may have in the LDH cryoprotection assay. The treatment of LDH with multiple freeze/thaw cycles results in very little enzymatic activity while the addition of proteins results in the conservation of different levels of activity. The results are shown in Figure 3 over a range of protein concentrations as a percent conservation of the untreated LDH activity. All four dehydrins had similarly shaped curves, with different enhancements of LDH activity relative to the LDH control at high dehydrin concentrations. The wild-type YSK2 showed the lowest value, at about 130%. YSK2-SpaceK plateaued at about 140%, while YSK2-K→R and YSK2-Neutral did so at about 150%. BSA, a known cryoprotectant [45], only increased LDH activity to 120% of the control level. Therefore, the degree to which these constructs retained the original LDH activity was slightly better than the wild-type YSK2 and BSA. The fits to the data (described in Section 2) were then used to extract the PD50 values of all of the proteins. Each of the dehydrin constructs had a similar PD50 of 2 to 3 μM, while BSA had a PD50 of 0.8 μM, showing that the efficiency of protection by the constructs was essentially unaffected by the mutations.

3.3. Yfh1 Secondary Structure

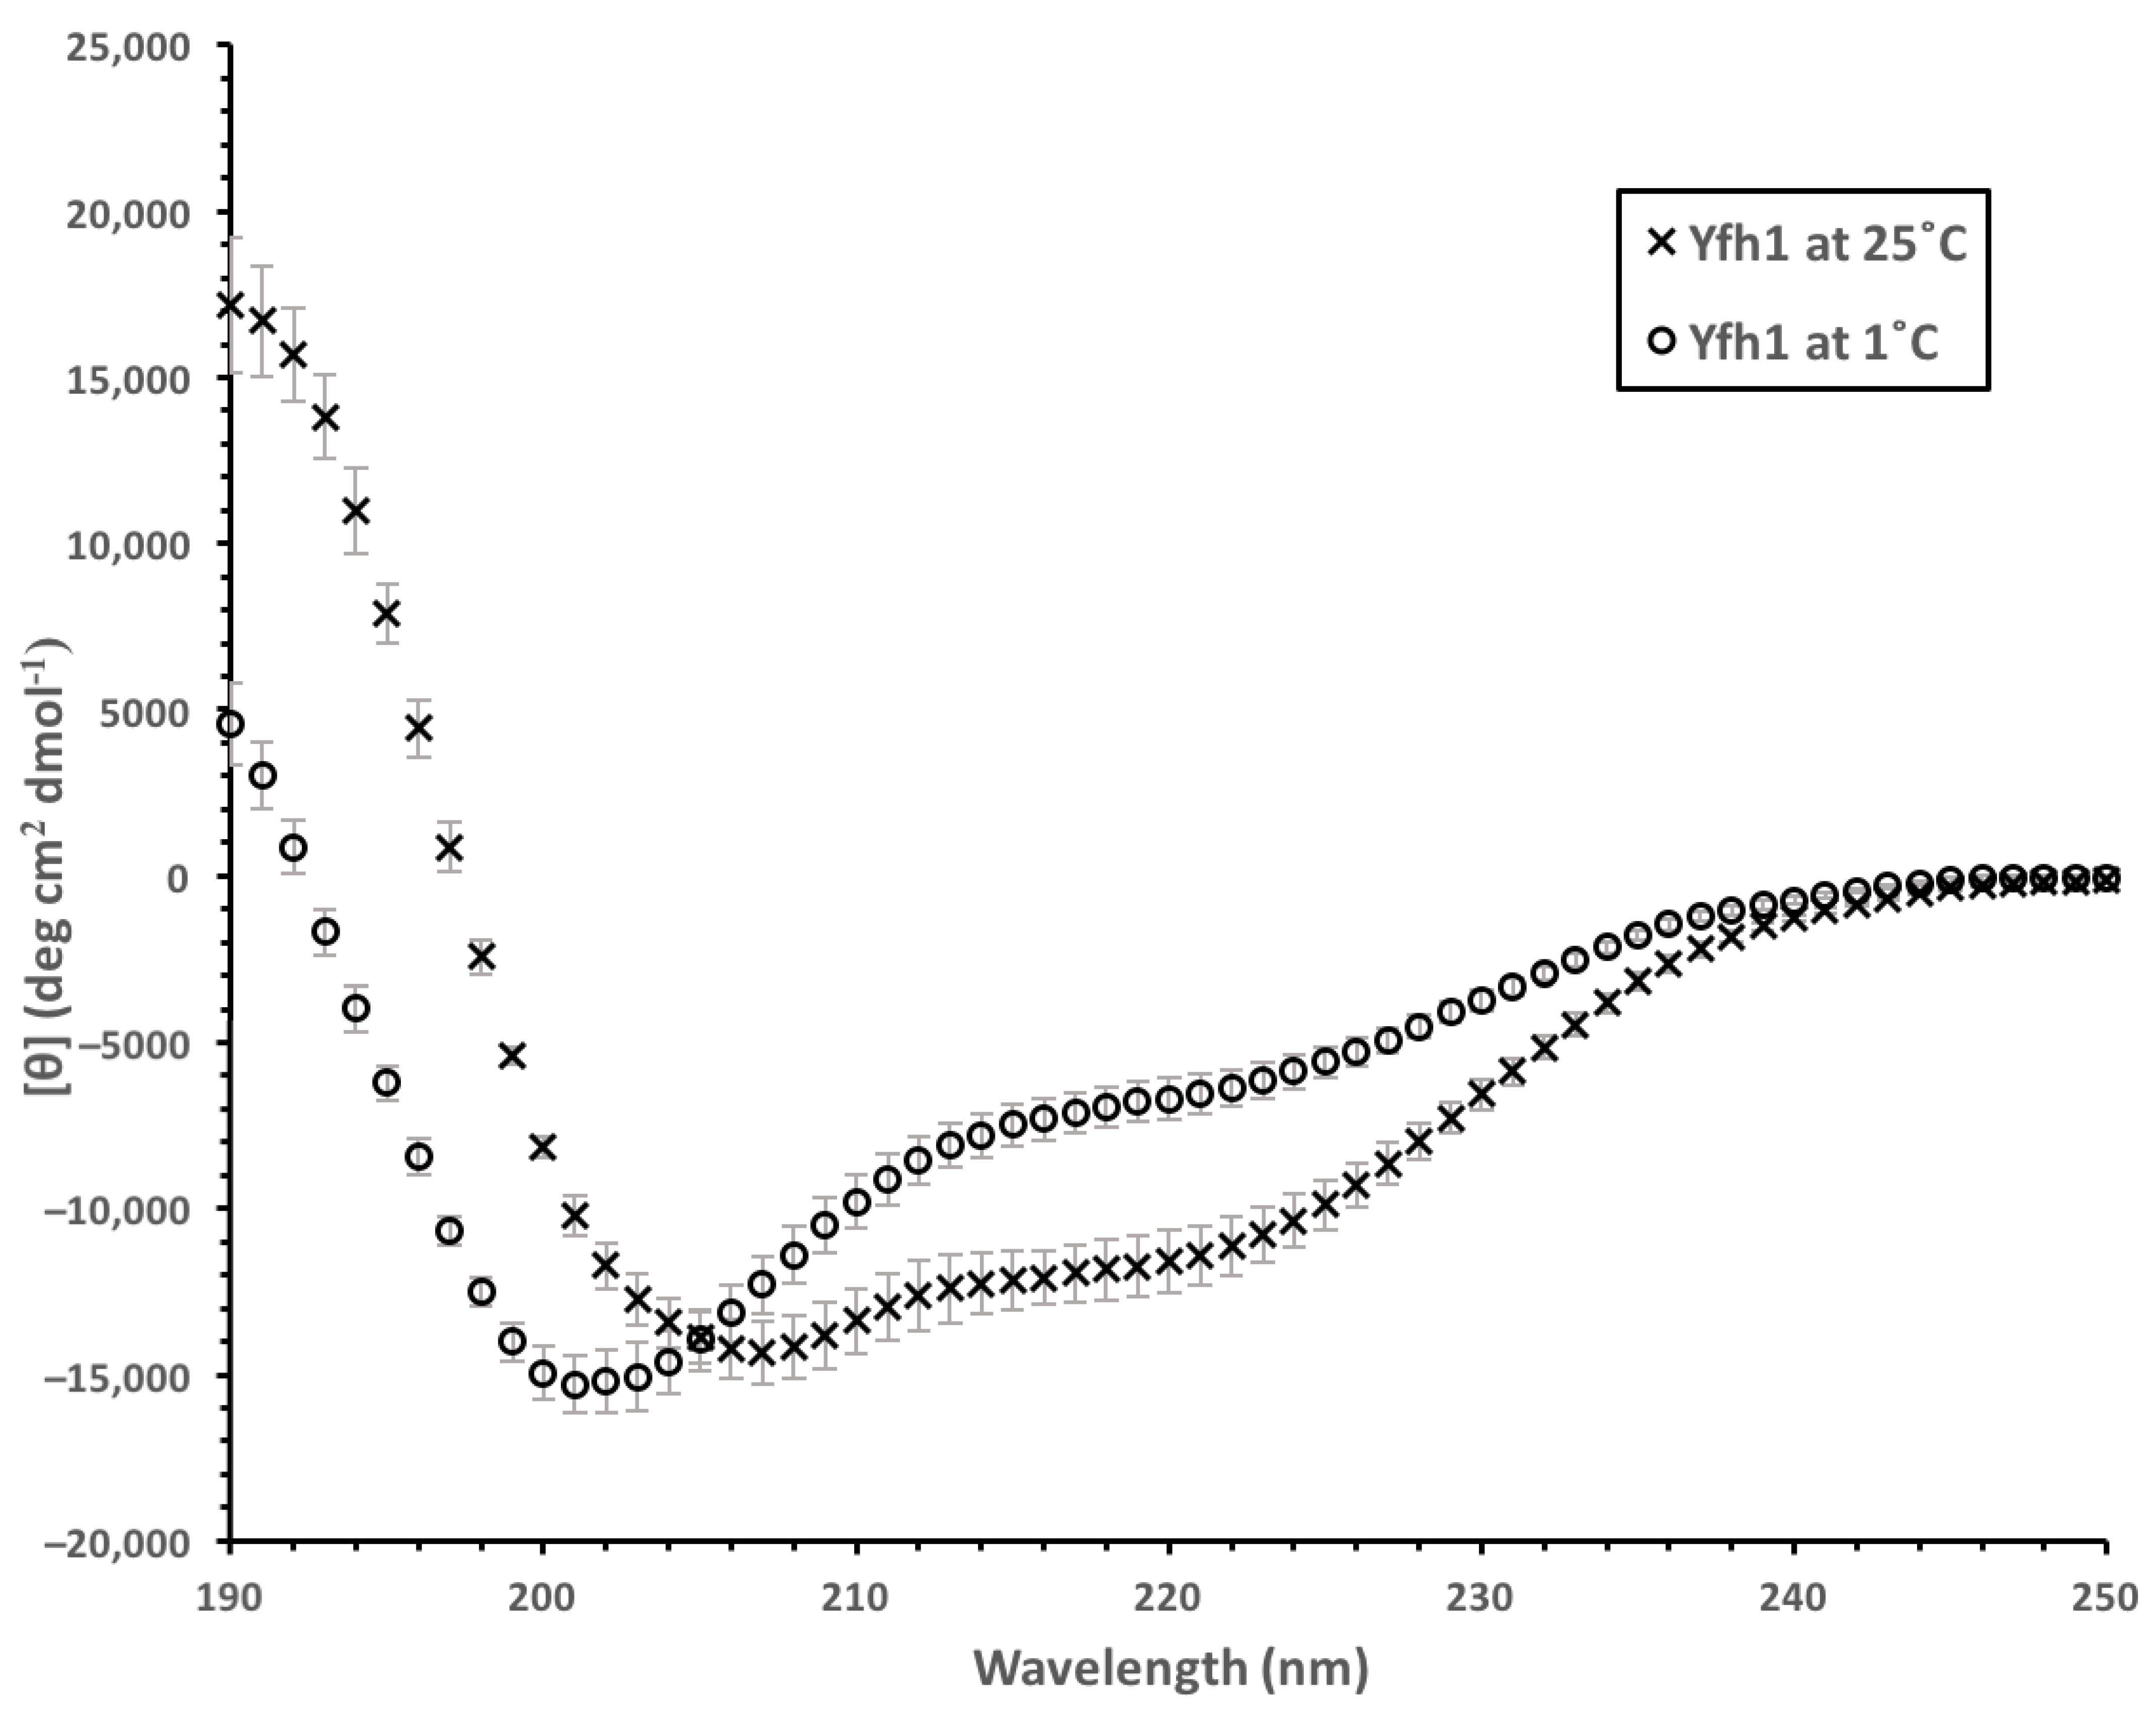
Yfh1 was selected for this study because it begins to denature at temperatures starting at 7 °C at low salt concentrations [38] and does not aggregate, therefore making it amenable to spectrophotoscopic techniques. We compared the α-helical structure of Yfh1 at 25 °C and 1 °C using CD spectroscopy. When suspended in 10 mM Tris (pH 7.4), the CD spectrum of Yfh1 acquires characteristics associated with disorder at 1 °C that were not present at 25 °C (Figure 4). At 25 °C, Yfh1 is predominantly α-helical, with minima at 208 and 222 nm and a maximum around 190 nm [46], reflecting an α-helical content of 35%. At 1 °C, however, the ellipticity above 210 nm decreases significantly, and the minimum shifts to 201 nm. At 1 °C the ellipticity at 222 nm corresponds to an estimated helical content of 24%. The loss of structure at 1 °C was reversed when the temperature was raised.

3.4. Yfh1 Secondary Structure in the Presence of Dehydrins

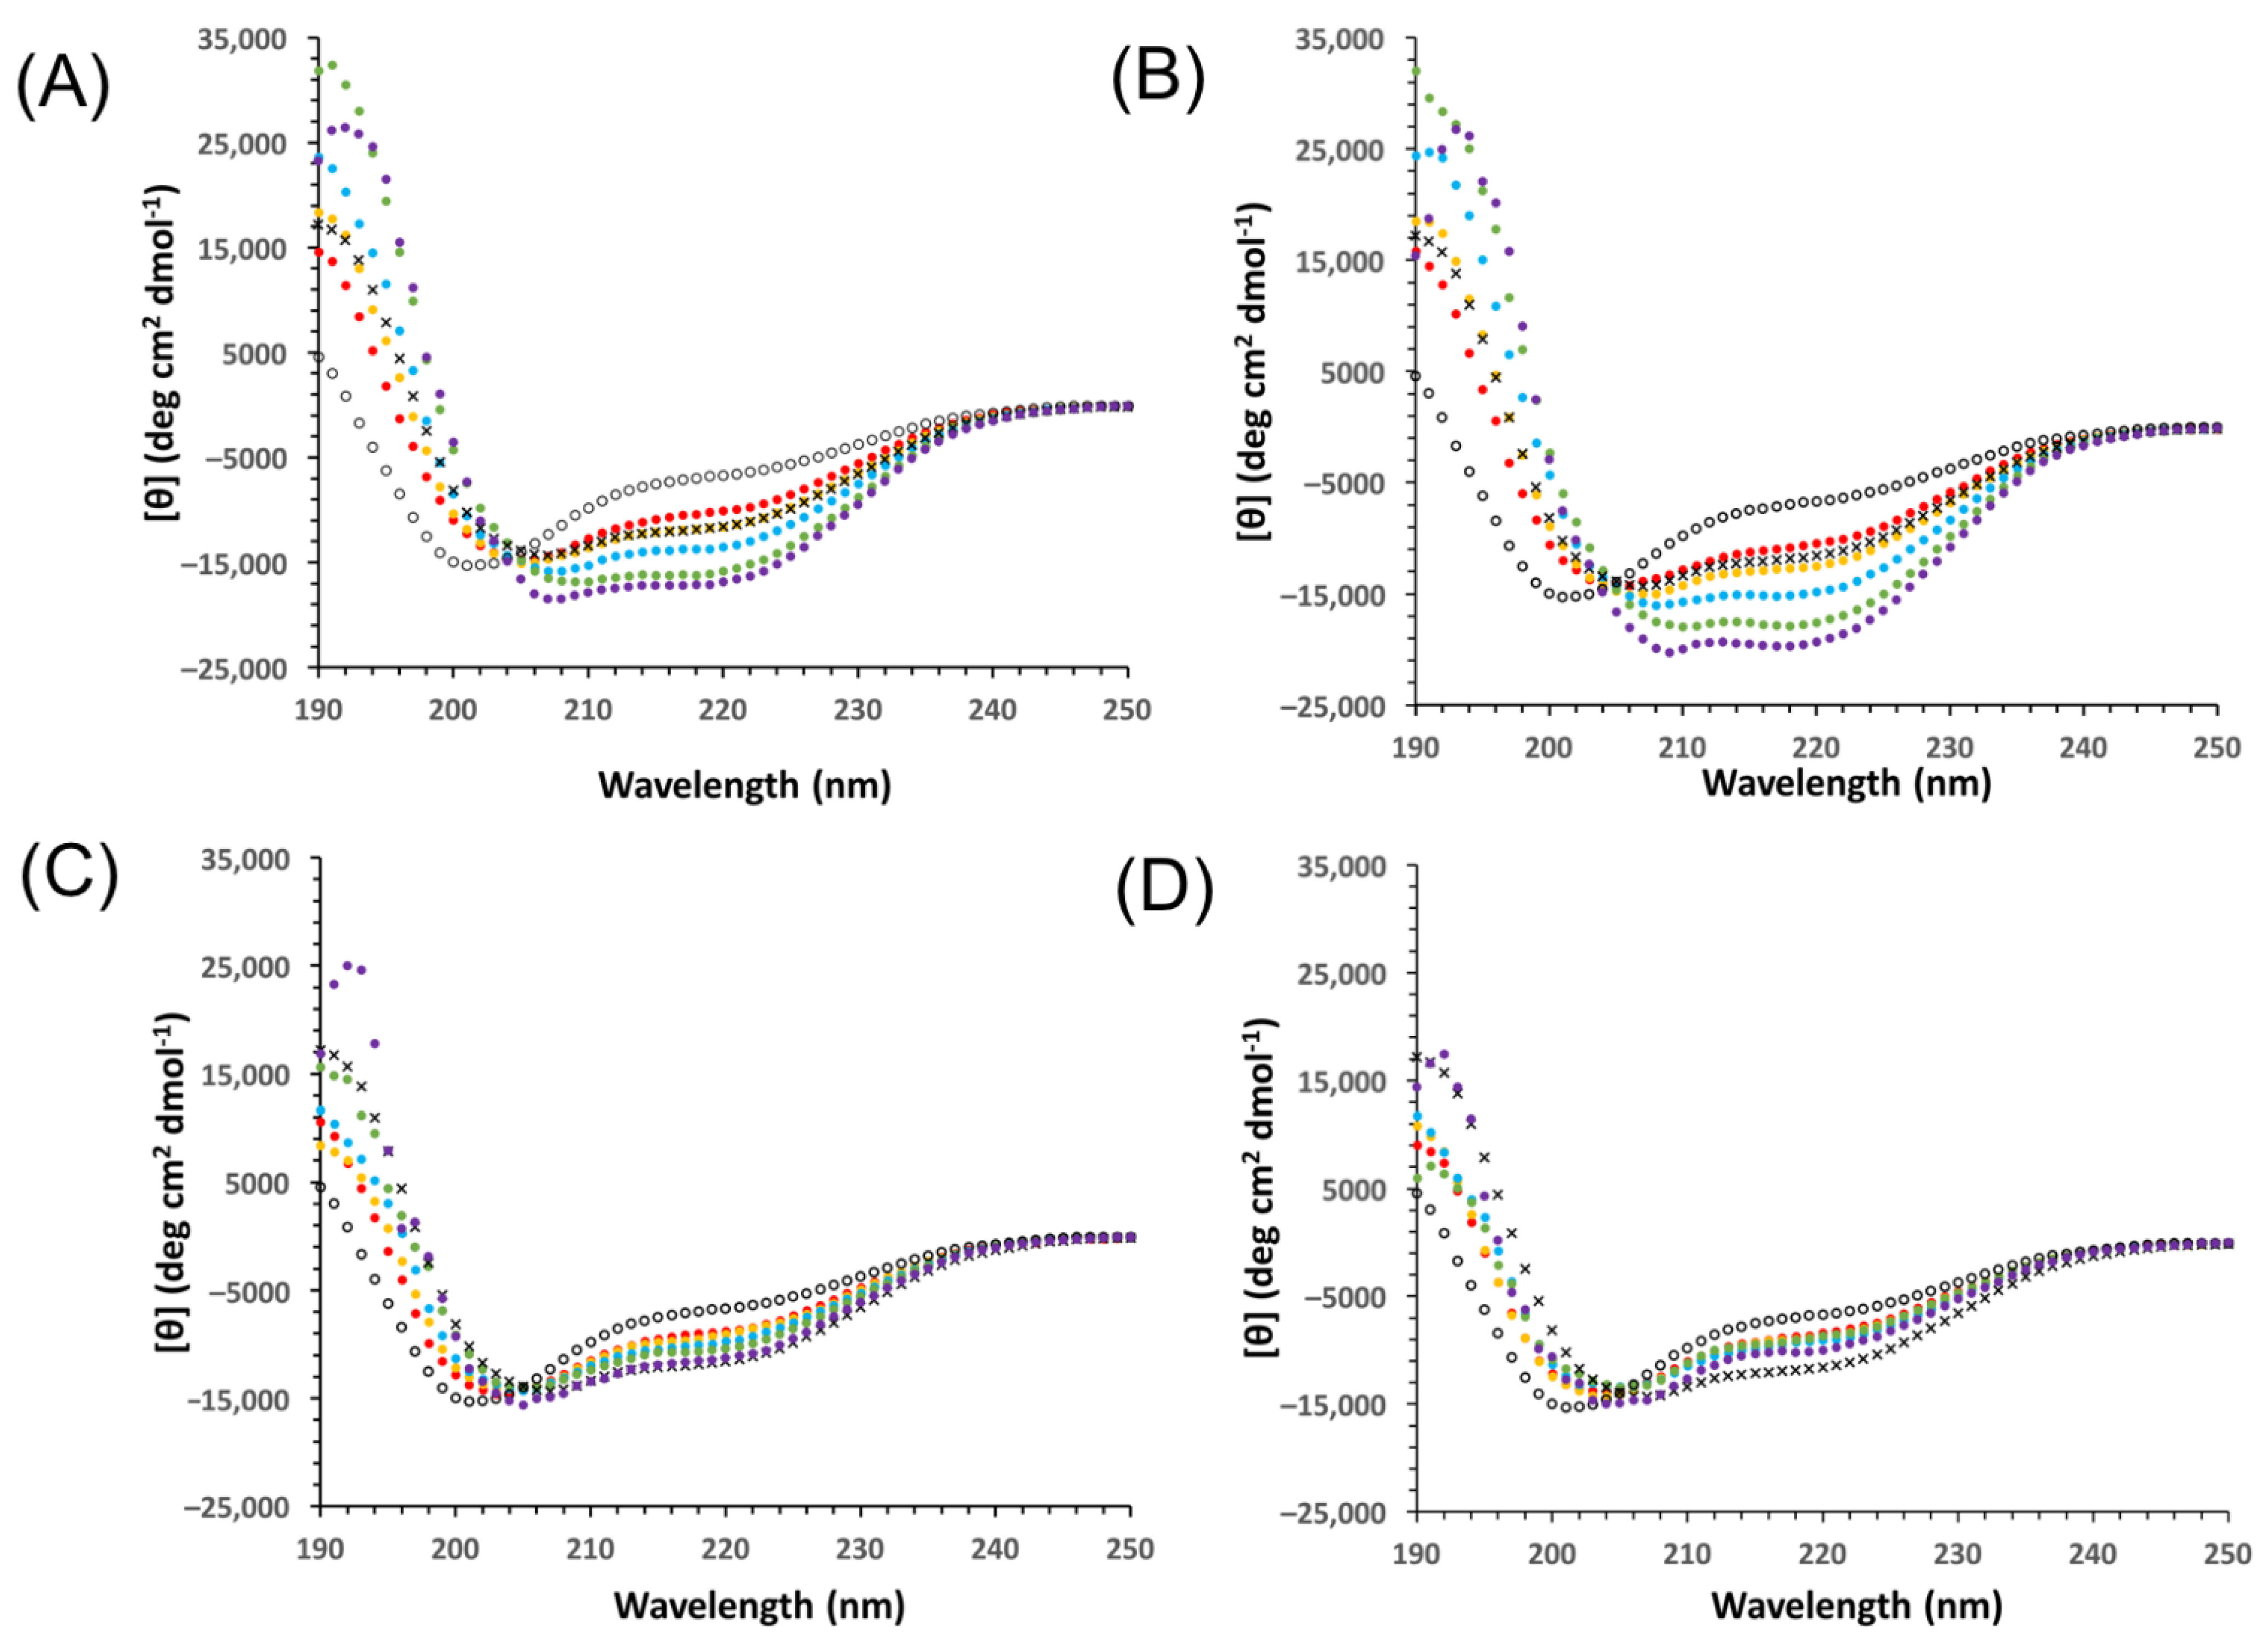
We next examined the ability of YSK2 and the constructs to restore Yfh1 secondary structure at several different concentrations of the constructs. The wild-type YSK2 and the YSK2-K→R were the most effective at enhancing α-helicity in Yfh1 at 1 °C (Figure 5A,B). Both proteins increased helicity at each concentration tested; the minima at 208 and 222 nm became increasingly negative, and the maximum at 190 nm became increasingly positive. In contrast, YSK2-SpaceK and YSK2-Neutral were able to increase the Yfh1 helical content, though to a lesser extent (Figure 5C,D). Spectral data for the 25 μM sample were excluded due to excessive noise at <205 nm. The retention of secondary structure for YSK2-SpaceK (Figure 5D) required 25 μM of protein to maintain helicity to the same level as Yfh1 at 25 °C, while the YSK2-Neutral construct was not able to maintain Yfh1 structure at 1 °C to the same level as Yfh1 alone at 25 °C.
We next calculated the percent helicity of Yfh1 in the presence of these proteins (Figure 6). In their absence, Yfh1 was 24% α-helical at 1 °C, and 35% at 25 °C. The addition of dehydrins caused the helicity to increase with increasing concentration, though the effect plateaued at different levels. As seen in the figure, the most effective proteins were YSK2 and YSK2-K→R. With the addition of 7.5 μM YSK2, the spectrum of Yfh1 at 1 °C was nearly indistinguishable from that of Yfh1 at 25 °C, whereas at 7.5 μM the YSK2-K→R construct already increased the helicity beyond that of Yfh1 at 25 °C by 2.5%. At each concentration of the dehydrins, the total helical content of Yfh1 continued to increase significantly. The α-helicity of Yfh1 in the presence of 25 μM of YSK2 starts to plateau at ~50% helical content. The YSK2-K→R construct reached an even higher helical content of 55%, but instead of plateauing began to decrease the helical content to 49% at 25 μM of dehydrin.
The other two constructs, YSK2-SpaceK and YSK2-Neutral, were not as effective at inducing helicity. While YSK2-SpaceK increased the helicity of Yfh1 at 1 °C at each concentration, only the 25 μM Yfh1 protein at 1 °C was restored to the same helicity as the protein at 25 °C, and even then, the effect appeared to plateau. The effect of YSK2-Neutral plateaued at 28%, and therefore had the weakest protective effect of all of the constructs.
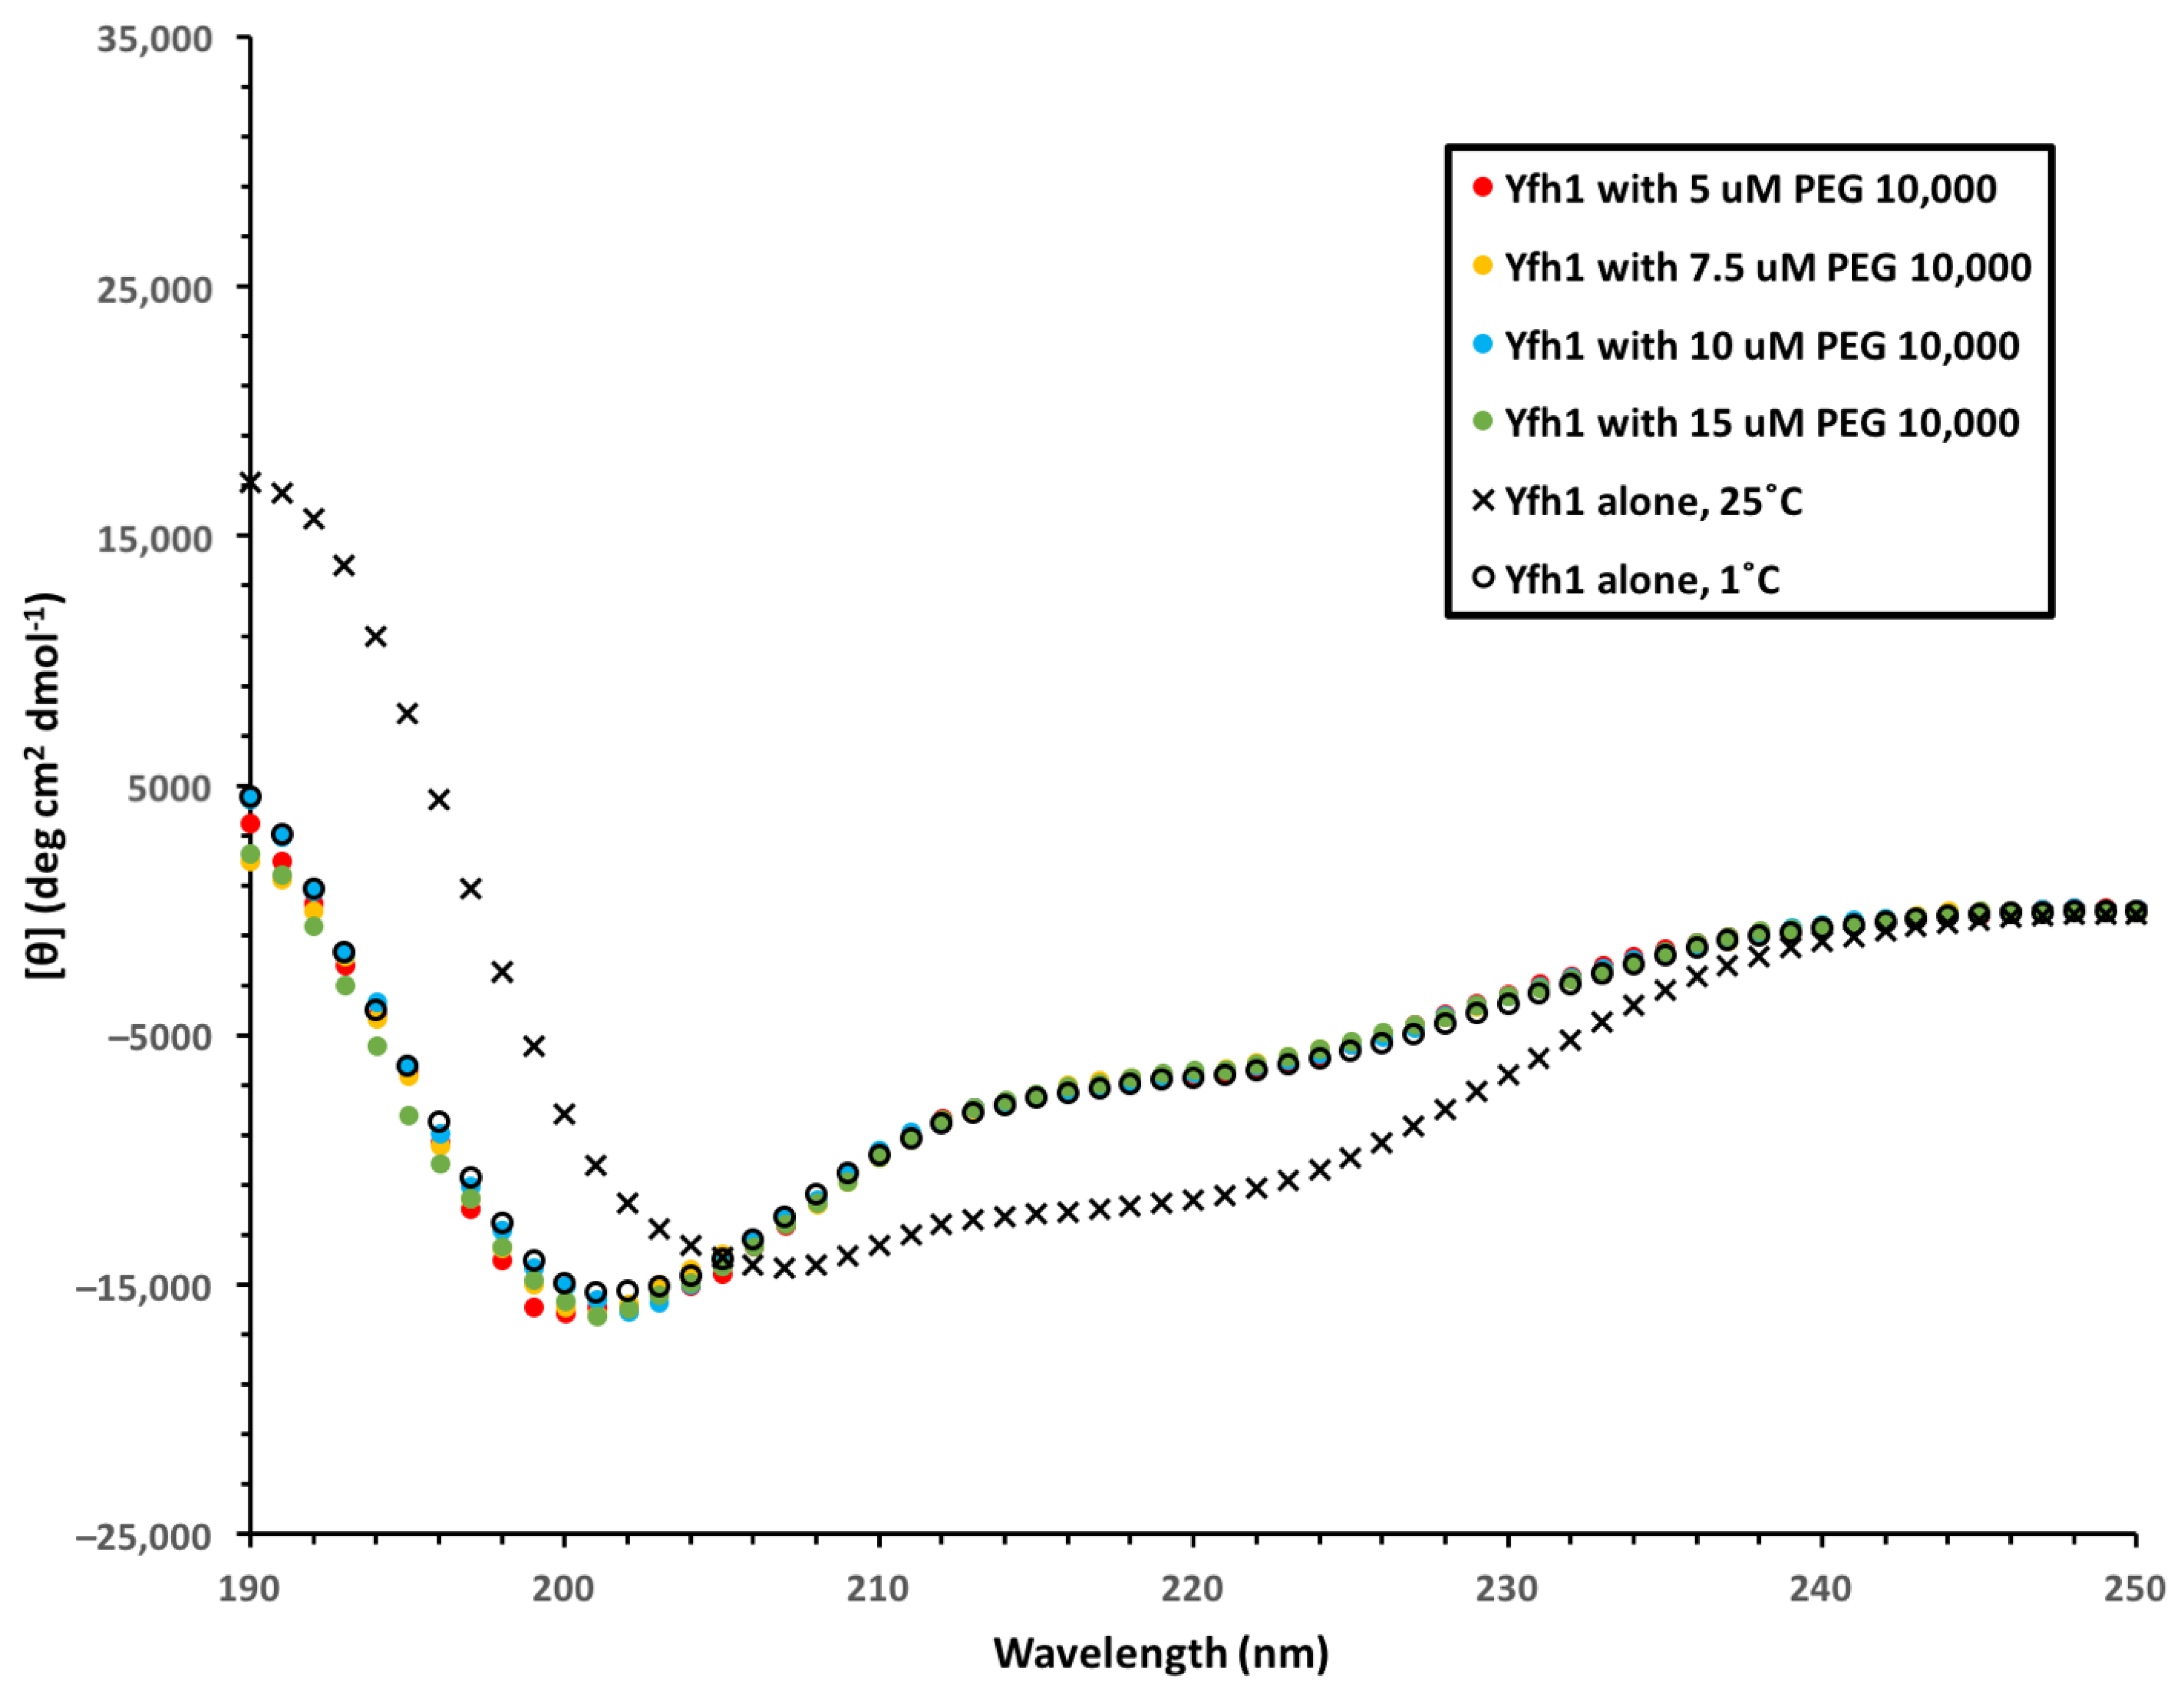
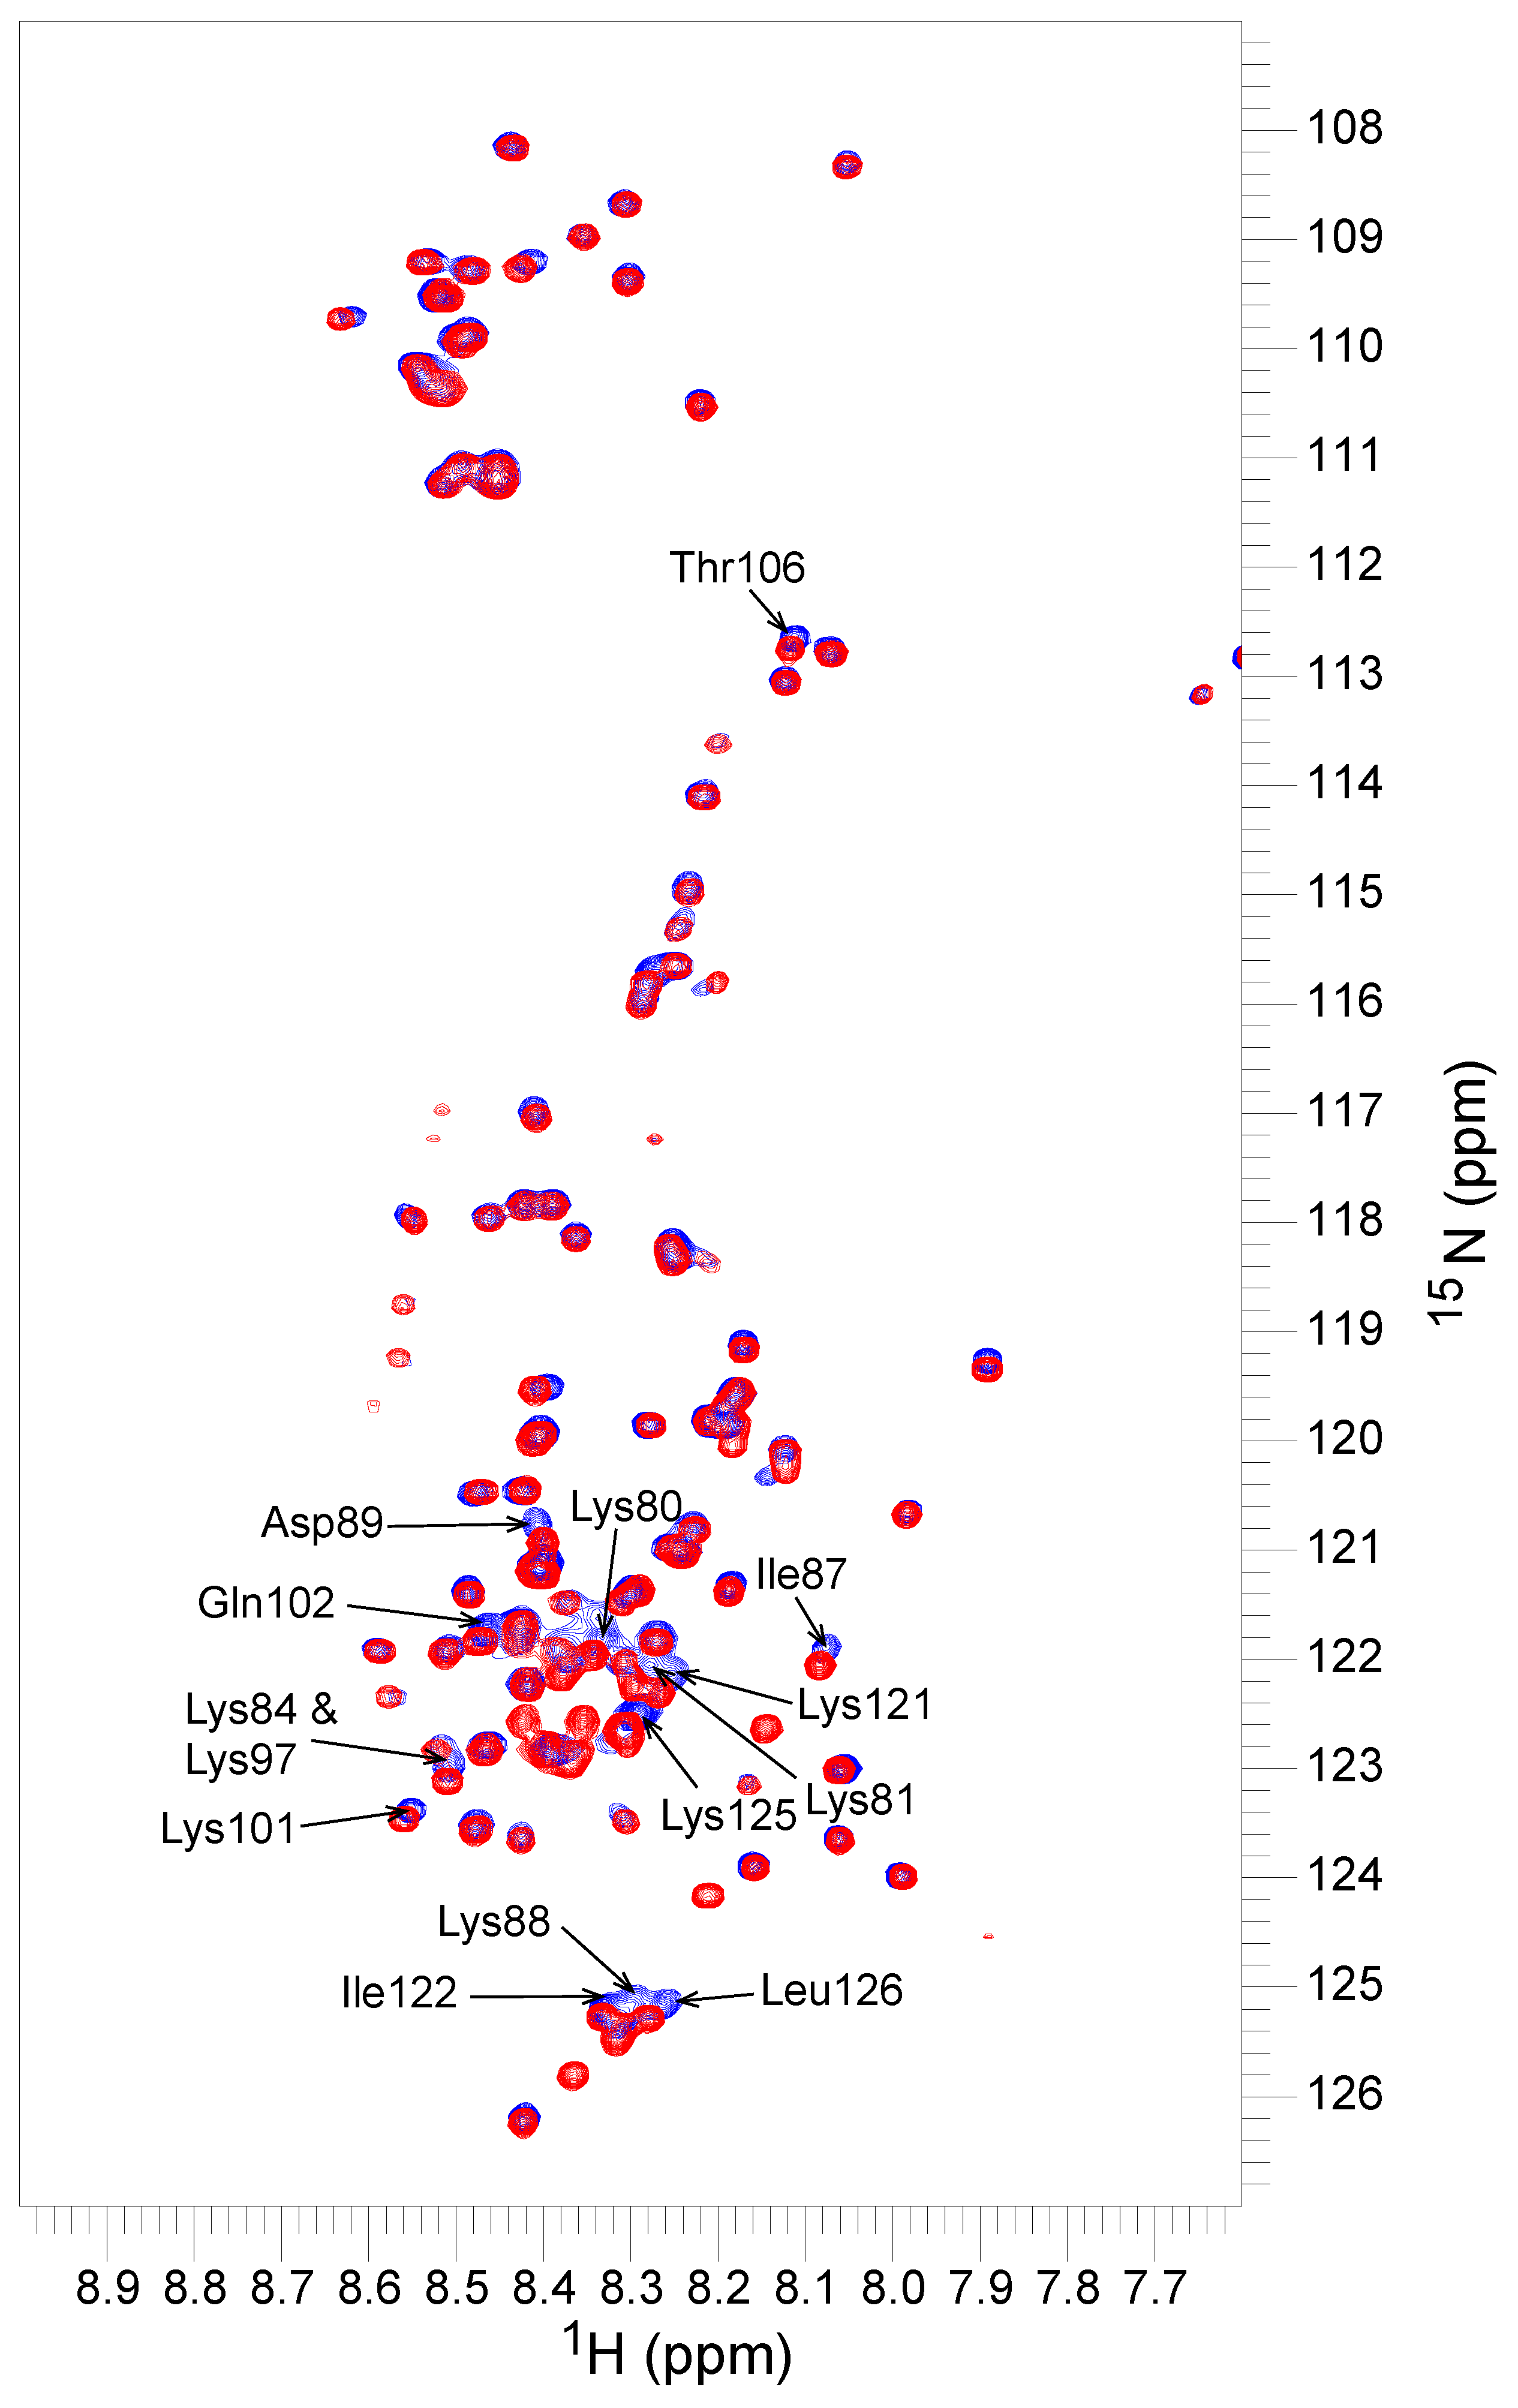
We performed experiments to examine whether there are cryoprotective mechanisms protecting LDH and Yfh1 in common from cold damage caused by a temperature of 1 °C. In the first experiment, we examined whether polyethylene glycol 10,000 (PEG 10,000) is able to effectively protect Yfh1 as it does LDH [36]. The results here show that PEG 10,000, which has a similar hydrodynamic radius (Rh) to YSK2, was completely ineffective at promoting helicity in Yfh1 at 1 °C (Figure 7); there was essentially no difference in the spectra in the presence or absence of this polymer as measured by CD. Next, we examined whether Yfh1 is protected by dehydrins without a binding interaction, as is the case of LDH cryoprotection [31]. We collected 15N-HSQC spectra of 15N-labelled YSK2 alone and in the presence of an equimolar amount of unlabeled Yfh1 (Figure 8). As the spectra show, many resonances were unaffected by the presence of Yfh1, but several small changes in chemical shift were observed.

4. Discussion

4.1. Dehydrin Construct Design

Prior experiments with LDH showed [31,33] that the cryoprotective effects for it can be largely explained by a molecular shield effect [47,48]. However, using another protein that is sensitive to cold denaturation, Yfh1, our previous study showed that the size of the dehydrin is not a factor in cryoprotection, suggesting that the protective shield effect is not a universal one [36]. To examine the possibility that dehydrins confer cryoprotection to Yfh1 in a way that is distinct from LDH, three constructs were designed to probe the significance of positive charge, since lysine residues are highly conserved in dehydrins (Figure 1). YSK2-SpaceK and YSK2-Neutral have an amino acid composition identical to that of YSK2, but specific residues have been moved to either distribute the positively charged lysines evenly throughout the sequence (YSK2-SpaceK) or to offset the charge of the lysine residues by moving the aspartates and glutamates adjacent to the lysines (YSK2-Neutral). In both cases, the expectation was that the changes may interrupt a charge-based interaction between the dehydrins and Yfh1, which would in turn result in poorer cryoprotection. The other construct (YSK2-K→R) had all lysine residues substituted with arginine. The creation of the YSK2-K→R construct sought to address whether lysine itself is important in this cryoprotective effect, or if it is merely the distribution of positive charge within the K-segments. These lysine residues are well conserved and are not substituted for arginine in wild-type dehydrins, implying that they serve some purpose that arginine cannot fulfill [14].

4.2. Yfh1 Cryoprotection Is Affected by Charge Distribution

As has been previously reported [38], the lowering of the temperature results in Yfh1 losing secondary structure, mainly observed as a loss in α-helicity, and we observed similar results here (Figure 4). At 1 °C, the Yfh1 CD spectrum took on characteristics associated with disorder, such as a large decrease in ellipticity above 210 nm and a shift in the minima from 207 to 201 nm. We exploited this property to see whether a dehydrin can act as a cryoprotectant by protecting the structure of Yfh1 by maintaining its α-helicity.
The temperature instability of Yfh1 has been attributed to a cluster of negatively charged residues (Glu89, Glu103, Glu112) that sit on adjacent β-strands and cause steric repulsion, allowing water access to the hydrophobic core and causing the onset of cold denaturation at temperatures above 0 °C [49]. Thus, a cluster of positively charged residues, similar to what is seen in the K-segments, could potentially allow for an interaction that alleviates some of that charge repulsion, thereby stabilizing Yfh1. Conversely, the absence of concentrated positive charge, due to it being more distributed or locally neutralized, could disrupt that interaction. We hypothesized that YSK2-SpaceK and YSK2-Neutral would be less effective cryoprotectants than YSK2 and YSK2-K→R based on the assumption that the distribution of positive charge is a significant part of the cryoprotective mechanism with respect to Yfh1 but not whether it is a lysine or arginine. This was demonstrated by the results (Figure 5 and Figure 6). With YSK2-Neutral and YSK2-SpaceK the helicity of Yfh1 maximally increased to ~30 and 35%, respectively, while YSK2 and YSK2-K→R maximally increased the helicity to ~50% or more.
Surprisingly, the YSK2-K→R protein was more effective at protection than the wild-type dehydrin (Figure 6), suggesting that positive charge is more significant than the lysines themselves, and that the potential involvement of the K-segment is coincidental rather than a product of evolutionary design. This is reasonable because Yfh1 is a yeast protein that would not come in contact with plant dehydrins in the natural world. However, dehydrins are often cationic, and within eukaryotic cells, the majority of proteins are anionic [50], suggesting that the charge of dehydrins has evolved to protect many proteins.
With YSK2-K→R appearing to be more effective at promoting helicity in Yfh1 than YSK2, the question arises as to why lysine residues are conserved in K-segments instead of arginine. However, by 25 μM YSK2-K→R, the helicity of Yfh1 began to decrease compared to 20 μM. One possible reason for this is that arginine has more potential to hydrogen bond compared to lysine, which has been cited as useful for protein stabilization [51]. On the other hand, the hydrogen bonding potential coupled with the planar structure of arginine makes it capable of self-association in a way that lysine, which has a tetrahedral structure, cannot [52]. Arginine is able to form hydrogen bonds with the protein backbone, and the guanidinium group is able to form ionic interactions with itself and participate in π–π stacking; by contrast, lysine residues repel each other and do not perform π–π stacking [52,53,54]. It could be argued that the arginine residues allow YSK2-K→R to be a marginally more efficient cryoprotectant towards Yfh1 at low concentrations, but at high concentrations the K→R construct could self-associate and the cryoprotection decreases. Another possibility is that the strong conservation of lysine in the K-segments could be significant for another function, such as membrane binding [55], and that the positive charges could incidentally also be advantageous for forming stabilizing interactions with various acidic proteins during cold stress.
YSK2-SpaceK and YSK2-Neutral were significantly less efficient at increasing the helicity of Yfh1 at cold temperatures (Figure 6). For YSK2-SpaceK, this is likely due to the different charge distributions compared to YSK2. If the dehydrins stabilize Yfh1 by relieving electrostatic repulsion, then having the positive charge spread throughout the dehydrin may reduce the effectiveness of this interaction since fewer lysines would be able to participate in a binding interaction with a local cluster of negative charges in the protected protein. For YSK2-Neutral, the negatively charged residues could offset the influence of the lysines by neutralizing the local charge, possibly preventing any interaction with the cluster of negative charges on Yfh1. This could explain why it had the least amount of protection.

4.3. Yfh1 Is Not Protected by a Molecular Shield Effect

In a previous study we showed that in the LDH cryoprotection assay PEG molecules of a similar Rh to the dehydrins had similarly efficient levels of recovered activity [33]. PEG may stabilize proteins by coordinating with positive residues and binding to hydrophobic clefts [56,57]. The encapsulating layer of PEG molecules can prevent the proteins from coming into contact with others and causing aggregation. None of these stabilizing interactions would alleviate negative electrostatic repulsion in Yfh1 under the conditions used for this experiment because Yfh1 was not aggregating. It is not surprising that PEG 10,000 was unable to protect Yfh1 from cold denaturation (Figure 7), and therefore the molecular shield effect is not at play.
We provide here a second piece of evidence that the molecular shield effect is not important. Previous NMR studies have shown that there is no interaction between K2 and LDH [31]. Even using a threefold molar excess of LDH, no change in chemical shifts was observed in the 15N-K2 spectrum. The 15N-HSQC-NMR spectrum of labelled YSK2 in the presence of Yfh1 (Figure 8) revealed that in contrast to LDH, there is a weak interaction as demonstrated by several small shifts in the peaks of YSK2. Nearly all of these shifts are found in the K-segments, suggesting that the interaction may be located in this conserved motif. In fact, the only significant shifts that were not part of the K-segment were residues located in the ϕ-segment between the two K-segments.

5. Conclusions

The results presented here show that dehydrins protect Yfh1 in a different manner than they do LDH, and that dehydrins likely contribute to more than one mechanism of cryoprotection. This is demonstrated by all constructs having a similar PD50 when used to preserve LDH activity in the freeze/thaw assay, emphasizing the importance of Rh over sequence order. In the Yfh1 cryoprotection, the YSK2 constructs with more dispersed (YSK2-SpaceK), or locally neutralized positive charge (YSK2-Neutral) were less effective at promoting helicity in Yfh1 at cold temperatures than the proteins with clustered positive charges (YSK2 and YSK2-K→R). This suggests an interaction between the dehydrins and Yfh1 that may help to alleviate the destabilizing negative charge cluster. The 15N-HSQC NMR spectrum of YSK2 in the presence of Yfh1 supports the idea that a weak interaction may be taking place. The data suggest that future studies must aim to better characterize the binding interaction.

Author Contributions

The experiments were designed by M.A.S. and S.P.G. Experiments were performed and analyzed by M.A.S. The original manuscript was prepared by M.A.S. Both authors were involved in review and editing. All authors have read and agreed to the published version of the manuscript.

Funding

This work was supported by an NSERC Discovery Grant (2016-04253) to S.P.G.

Institutional Review Board Statement

Not applicable.

Informed Consent Statement

Not applicable.

Data Availability Statement

Data available from the authors upon request.

Acknowledgments

We thank Rod Merrill (University of Guelph, Guelph, ON, Canada) for the use of the CD spectropolarimeter. We also thank Grazia Isaya (Mayo Clinic, Rochester, MN, USA) for providing the pETYF-1 plasmid containing Yfh1 and Annette Nassuth (University of Guelph, Guelph, ON, Canada) for providing the YSK2 gene.

Conflicts of Interest

The authors declare no conflict of interest.

References

  1. Steponkus, P.L.; Uemura, M.; Joseph, R.A.; Gilmour, S.J.; Thomashow, M.F. Mode of action of the COR15a gene on the freezing tolerance of Arabidopsis thaliana. Proc. Natl. Acad. Sci. USA 1998, 95, 14570–14575. [Google Scholar] [CrossRef] [PubMed] [Green Version]
  2. Galau, G.A.; Hughes, D.W.; Dure, L., III. Abscisic acid induction of cloned cotton late embryogenesis-abundant (Lea) mRNAs. Plant Mol. Biol. 1986, 7, 155–170. [Google Scholar] [CrossRef]
  3. Tunnacliffe, A.; Wise, M.J. The continuing conundrum of the LEA proteins. Die Nat. 2007, 94, 791–812. [Google Scholar] [CrossRef] [PubMed]
  4. Cheng, Z.; Targolli, J.; Huang, X.; Wu, R. Wheat LEA genes, PMA80 and PMA1959, enhance dehydration tolerance of transgenic rice (Oryza sativa L.). Mol. Breed. 2002, 10, 71–82. [Google Scholar] [CrossRef]
  5. Hara, M.; Terashima, S.; Fukaya, T.; Kuboi, T. Enhancement of cold tolerance and inhibition of lipid peroxidation by citrus dehydrin in transgenic tobacco. Planta 2003, 217, 290–298. [Google Scholar] [CrossRef] [PubMed]
  6. Puhakainen, T.; Hess, M.W.; Mäkelä, P.; Svensson, J.; Heino, P.; Palva, E.T. Overexpression of Multiple Dehydrin Genes Enhances Tolerance to Freezing Stress in Arabidopsis. Plant Mol. Biol. 2004, 54, 743–753. [Google Scholar] [CrossRef]
  7. Ismail, A.M.; Hall, A.E.; Close, T.J. Chilling Tolerance during Emergence of Cowpea Associated with a Dehydrin and Slow Electrolyte Leakage. Crop Sci. 1997, 37, 1270–1277. [Google Scholar] [CrossRef]
  8. Xu, J.; Zhang, Y.; Guan, Z.; Wei, W.; Han, L.; Chai, T. Expression and function of two dehydrins under environmental stresses in Brassica juncea L. Mol. Breed. 2007, 21, 431–438. [Google Scholar] [CrossRef]
  9. Xing, X.; Liu, Y.; Kong, X.; Liu, Y.; Li, D. Overexpression of a maize dehydrin gene, ZmDHN2b, in tobacco enhances tolerance to low temperature. Plant Growth Regul. 2011, 65, 109–118. [Google Scholar] [CrossRef]
  10. Bao, F.; Du, D.; An, Y.; Yang, W.; Wang, J.; Cheng, T.; Zhang, Q. Overexpression of Prunus mume Dehydrin Genes in Tobacco Enhances Tolerance to Cold and Drought. Front. Plant Sci. 2017, 8, 151. [Google Scholar] [CrossRef]
  11. Hincha, D.K.; Thalhammer, A. LEA proteins: IDPs with versatile functions in cellular dehydration tolerance. Biochem. Soc. Trans. 2012, 40, 1000–1003. [Google Scholar] [CrossRef] [PubMed] [Green Version]
  12. Graether, S.P.; Boddington, K.F. Disorder and function: A review of the dehydrin protein family. Front. Plant Sci. 2014, 5, 576. [Google Scholar] [CrossRef] [PubMed] [Green Version]
  13. Smith, M.A.; Graether, S.P. The Disordered Dehydrin and Its Role in Plant Protection: A Biochemical Perspective. Biomolecules 2022, 12, 294. [Google Scholar] [CrossRef]
  14. Malik, A.A.; Veltri, M.; Boddington, K.F.; Singh, K.K.; Graether, S.P. Genome Analysis of Conserved Dehydrin Motifs in Vascular Plants. Front. Plant Sci. 2017, 8, 709. [Google Scholar] [CrossRef] [PubMed] [Green Version]
  15. Strimbeck, G.R. Hiding in plain sight: The F segment and other conserved features of seed plant SKn dehydrins. Planta 2017, 245, 1061–1066. [Google Scholar] [CrossRef] [PubMed] [Green Version]
  16. Riley, A.C.; Ashlock, D.A.; Graether, S.P. Evolution of the modular, disordered stress proteins known as dehydrins. PLoS ONE 2019, 14, e0211813. [Google Scholar] [CrossRef] [Green Version]
  17. Hara, M.; Terashima, S.; Kuboi, T. Characterization and cryoprotective activity of cold-responsive dehydrin from Citrus unshiu. J. Plant Physiol. 2001, 158, 1333–1339. [Google Scholar] [CrossRef]
  18. Uversky, V.N. A decade and a half of protein intrinsic disorder: Biology still waits for physics. Protein Sci. 2013, 22, 693–724. [Google Scholar] [CrossRef] [Green Version]
  19. Tompa, P. The interplay between structure and function in intrinsically unstructured proteins. FEBS Lett. 2005, 579, 3346–3354. [Google Scholar] [CrossRef] [Green Version]
  20. Graziano, G. On the molecular origin of cold denaturation of globular proteins. Phys. Chem. Chem. Phys. 2010, 12, 14245–14252. [Google Scholar] [CrossRef]
  21. Lin, C.; Thomashow, M.F. A cold-regulated Arabidopsis gene encodes A polypeptide having potent cryoprotective activity. Biochem. Biophys. Res. Commun. 1992, 183, 1103–1108. [Google Scholar] [CrossRef]
  22. Kazuoka, T.; Oeda, K. Purification and Characterization of COR85-Oligomeric Complex from Cold-Acclimated Spinach. Plant Cell Physiol. 1994, 35, 601–611. [Google Scholar] [CrossRef]
  23. Houde, M.; Daniel, C.; Lachapelle, M.; Allard, F.; Laliberte, S.; Sarhan, F. Immunolocalization of freezing-tolerance-associated proteins in the cytoplasm and nucleoplasm of wheat crown tissues. Plant J. 1995, 8, 583–593. [Google Scholar] [CrossRef] [PubMed]
  24. Wisniewski, M.; Webb, R.; Balsamo, R.; Close, T.J.; Yu, X.M.; Griffith, M. Purification, immunolocalization, cryoprotective, and antifreeze activity of PCA60: A dehydrin from peach (Prunus persica). Physiol. Plant. 1999, 105, 600–608. [Google Scholar] [CrossRef]
  25. Bravo, L.A.; Gallardo, J.; Navarrete, A.; Olave, N.; Martínez, J.; Alberdi, M.; Close, T.J.; Corcuera, L.J. Cryoprotective activity of a cold-induced dehydrin purified from barley. Physiol. Plant. 2003, 118, 262–269. [Google Scholar] [CrossRef]
  26. Momma, M.; Kaneko, S.; Haraguchi, K.; Matsukura, U. Peptide mapping and assessment of cryoprotective activity of 26/27-kDa dehydrin from soybean seeds. Biosci. Biotech. Bioch. 2003, 67, 1832–1835. [Google Scholar] [CrossRef] [Green Version]
  27. Sanchez-Ballesta, M.T.; Rodrigo, M.J.; Lafuente, M.T.; Granell, A.A.; Zacarias, L. Dehydrin from Citrus, Which Confers in Vitro Dehydration and Freezing Protection Activity, Is Constitutive and Highly Expressed in the Flavedo of Fruit but Responsive to Cold and Water Stress in Leaves. J. Agric. Food Chem. 2004, 52, 1950–1957. [Google Scholar] [CrossRef]
  28. Goyal, K.; Walton, L.J.; Tunnacliffe, A. LEA proteins prevent protein aggregation due to water stress. Biochem. J. 2005, 388, 151–157. [Google Scholar] [CrossRef] [Green Version]
  29. Kovacs, D.; Kalmár, É.; Torok, Z.; Tompa, P. Chaperone Activity of ERD10 and ERD14, Two Disordered Stress-Related Plant Proteins. Plant Physiol. 2008, 147, 381–390. [Google Scholar] [CrossRef]
  30. Reyes, J.L.; Campos, F.; Wei, H.U.I.; Arora, R.; Yang, Y.; Karlson, D.T.; Covarrubias, A.A. Functional dissection of hydrophilins during in vitro freeze protection. Plant Cell Environ. 2008, 31, 1781–1790. [Google Scholar] [CrossRef]
  31. Hughes, S.; Graether, S.P. Cryoprotective mechanism of a small intrinsically disordered dehydrin protein. Protein Sci. 2010, 20, 42–50. [Google Scholar] [CrossRef] [PubMed] [Green Version]
  32. Drira, M.; Saibi, W.; Brini, F.; Gargouri, A.; Masmoudi, K.; Hanin, M. The K-Segments of the Wheat Dehydrin DHN-5 are Essential for the Protection of Lactate Dehydrogenase and β-Glucosidase Activities In Vitro. Mol. Biotechnol. 2013, 54, 643–650. [Google Scholar] [CrossRef] [PubMed]
  33. Hughes, S.L.; Schart, V.; Malcolmson, J.; Hogarth, K.A.; Martynowicz DMTralman-Baker, E.; Patel, S.N.; Graether, S.P. The importance of size and disorder in the cryoprotective effects of dehydrins. Plant Physiol. 2013, 163, 1376–1386. [Google Scholar] [CrossRef] [PubMed] [Green Version]
  34. Shi, J.; Liu, M.; Chen, Y.; Wang, J.; Lu, C. Heterologous expression of the dehydrin-like protein gene AmCIP from Ammopiptanthus mongolicus enhances viability of Escherichia coli and tobacco under cold stress. Plant Growth Regul. 2015, 79, 71–80. [Google Scholar] [CrossRef]
  35. Hara, M.; Endo, T.; Kamiya, K.; Kameyama, A. The role of hydrophobic amino acids of K-segments in the cryoprotection of lactate dehydrogenase by dehydrins. J. Plant Physiol. 2017, 210, 18–23. [Google Scholar] [CrossRef]
  36. Palmer, S.R.; De Villa, R.; Graether, S.P. Sequence composition versus sequence order in the cryoprotective function of an intrinsically disordered stress-response protein. Protein Sci. 2019, 28, 1448–1459. [Google Scholar] [CrossRef]
  37. Ohkubo, T.; Kameyama, A.; Kamiya, K.; Kondo, M.; Hara, M. F-segments of Arabidopsis dehydrins show cryoprotective activities for lactate dehydrogenase depending on the hydrophobic residues. Phytochemistry 2020, 173, 112300. [Google Scholar] [CrossRef]
  38. Pastore, A.; Martin, S.R.; Politou, A.; Kondapalli, K.C.; Stemmler, T.; Temussi, P.A. Unbiased cold denaturation: Low-and high-temperature unfolding of yeast frataxin under physiological conditions. J. Am. Chem. Soc. 2007, 129, 5374–5375. [Google Scholar] [CrossRef] [Green Version]
  39. Livernois, A.M.; Hnatchuk, D.J.; Findlater, E.E.; Graether, S.P. Obtaining highly purified intrinsically disordered protein by boiling lysis and single step ion exchange. Anal. Biochem. 2009, 392, 70–76. [Google Scholar] [CrossRef]
  40. Morrow, J.A.; Segall, M.L.; Lund-Katz, S.; Phillips, M.C.; Knapp, M.; Rupp, B.; Weisgraber, K.H. Differences in Stability among the Human Apolipoprotein E Isoforms Determined by the Amino-Terminal Domain. Biochemistry 2000, 39, 11657–11666. [Google Scholar] [CrossRef]
  41. Findlater, E.E.; Graether, S.P. NMR assignments of the intrinsically disordered K2 and YSK2 dehydrins. Biomol. NMR Assign. 2009, 3, 273–275. [Google Scholar] [CrossRef] [PubMed]
  42. Delaglio, F.; Grzesiek, S.; Vuister, G.W.; Zhu, G.; Pfeifer, J.; Bax, A. NMRPipe: A multidimensional spectral processing system based on UNIX pipes. J. Biomol. NMR 1995, 6, 277–293. [Google Scholar] [CrossRef] [PubMed]
  43. Vranken, W.; Boucher, W.; Stevens, T.J.; Fogh, R.H.; Pajon, A.; Llinas, M.; Ulrich, E.L.; Markley, J.L.; Ionides, J.; Laue, E.D. The CCPN data model for NMR spectroscopy: Development of a software pipeline. Proteins Struct. Funct. Bioinform. 2005, 59, 687–696. [Google Scholar] [CrossRef] [PubMed]
  44. Venyaminov, S.; Baikalov, I.; Shen, Z.; Wu, C.; Yang, J. Circular Dichroic Analysis of Denatured Proteins: Inclusion of Denatured Proteins in the Reference Set. Anal. Biochem. 1993, 214, 17–24. [Google Scholar] [CrossRef]
  45. Tamiya, T.; Okahashi, N.; Sakuma, R.; Aoyama, T.; Akahane, T.; Matsumoto, J.J. Freeze denaturation of enzymes and its prevention with additives. Cryobiology 1985, 22, 446–456. [Google Scholar] [CrossRef]
  46. Holzwarth, G.; Doty, P. The Ultraviolet Circular Dichroism of Polypeptides1. J. Am. Chem. Soc. 1965, 87, 218–228. [Google Scholar] [CrossRef]
  47. Wise, M.J.; Tunnacliffe, A. POPP the question: What do LEA proteins do? Trends Plant Sci. 2004, 9, 13–17. [Google Scholar] [CrossRef]
  48. Chakrabortee, S.; Tripathi, R.; Watson, M.; Schierle, G.S.K.; Kurniawan, D.P.; Kaminski, C.F.; Wise, M.J.; Tunnacliffe, A. Intrinsically disordered proteins as molecular shields. Mol. BioSyst. 2011, 8, 210–219. [Google Scholar] [CrossRef] [Green Version]
  49. Sanfelice, D.; Morandi, E.; Pastore, A.; Niccolai, N.; Temussi, P.A. Cold Denaturation Unveiled: Molecular Mechanism of the Asymmetric Unfolding of Yeast Frataxin. ChemPhysChem 2015, 16, 3599–3602. [Google Scholar] [CrossRef] [Green Version]
  50. Kiraga, J.; Mackiewicz, P.; Mackiewicz, D.; Kowalczuk, M.; Biecek, P.; Polak, N.; Smolarczyk, K.; Dudek, M.R.; Cebrat, S. The relationships between the isoelectric point and: Length of proteins, taxonomy and ecology of organisms. BMC Genom. 2007, 8, 163. [Google Scholar] [CrossRef]
  51. White, S.H. Amino acid preferences of small proteins: Implications for protein stability and evolution. J. Mol. Biol. 1992, 227, 991–995. [Google Scholar] [CrossRef]
  52. Tesei, G.; Vazdar, M.; Jensen, M.R.; Cragnell, C.; Mason, P.E.; Heyda, J.; Skepö, M.; Jungwirth, P.; Lund, M. Self-association of a highly charged arginine-rich cell-penetrating peptide. Proc. Natl. Acad. Sci. USA 2017, 114, 11428–11433. [Google Scholar] [CrossRef] [PubMed] [Green Version]
  53. Vazdar, M.; Uhlig, F.; Jungwirth, P. Like-Charge Ion Pairing in Water: An Ab Initio Molecular Dynamics Study of Aqueous Guanidinium Cations. J. Phys. Chem. Lett. 2012, 3, 2021–2024. [Google Scholar] [CrossRef]
  54. Ferrari, L.; Stucchi, R.; Konstantoulea, K.; van de Kamp, G.; Kos, R.; Geerts, W.J.; van Bezouwen, L.S.; Förster, F.G.; Altelaar, M.; Hoogenraad, C.C.; et al. Arginine π-stacking drives binding to fibrils of the Alzheimer protein Tau. Nat. Commun. 2020, 11, 571. [Google Scholar] [CrossRef] [PubMed] [Green Version]
  55. Clarke, M.W.; Boddington, K.F.; Warnica, J.M.; Atkinson, J.; McKenna, S.; Madge, J.; Barker, C.H.; Graether, S.P. Structural and Functional Insights into the Cryoprotection of Membranes by the Intrinsically Disordered Dehydrins. J. Biol. Chem. 2015, 290, 26900–26913. [Google Scholar] [CrossRef] [PubMed] [Green Version]
  56. Hasek, J. Poly(ethylene glycol) interactions with proteins. Z. Kristallogr. Suppl. 2006, 23, 613–618. [Google Scholar] [CrossRef]
  57. Rawat, S.; Suri, C.R.; Sahoo, D.K. Molecular mechanism of polyethylene glycol mediated stabilization of protein. Biochem. Biophys. Res. Commun. 2010, 392, 561–566. [Google Scholar] [CrossRef]
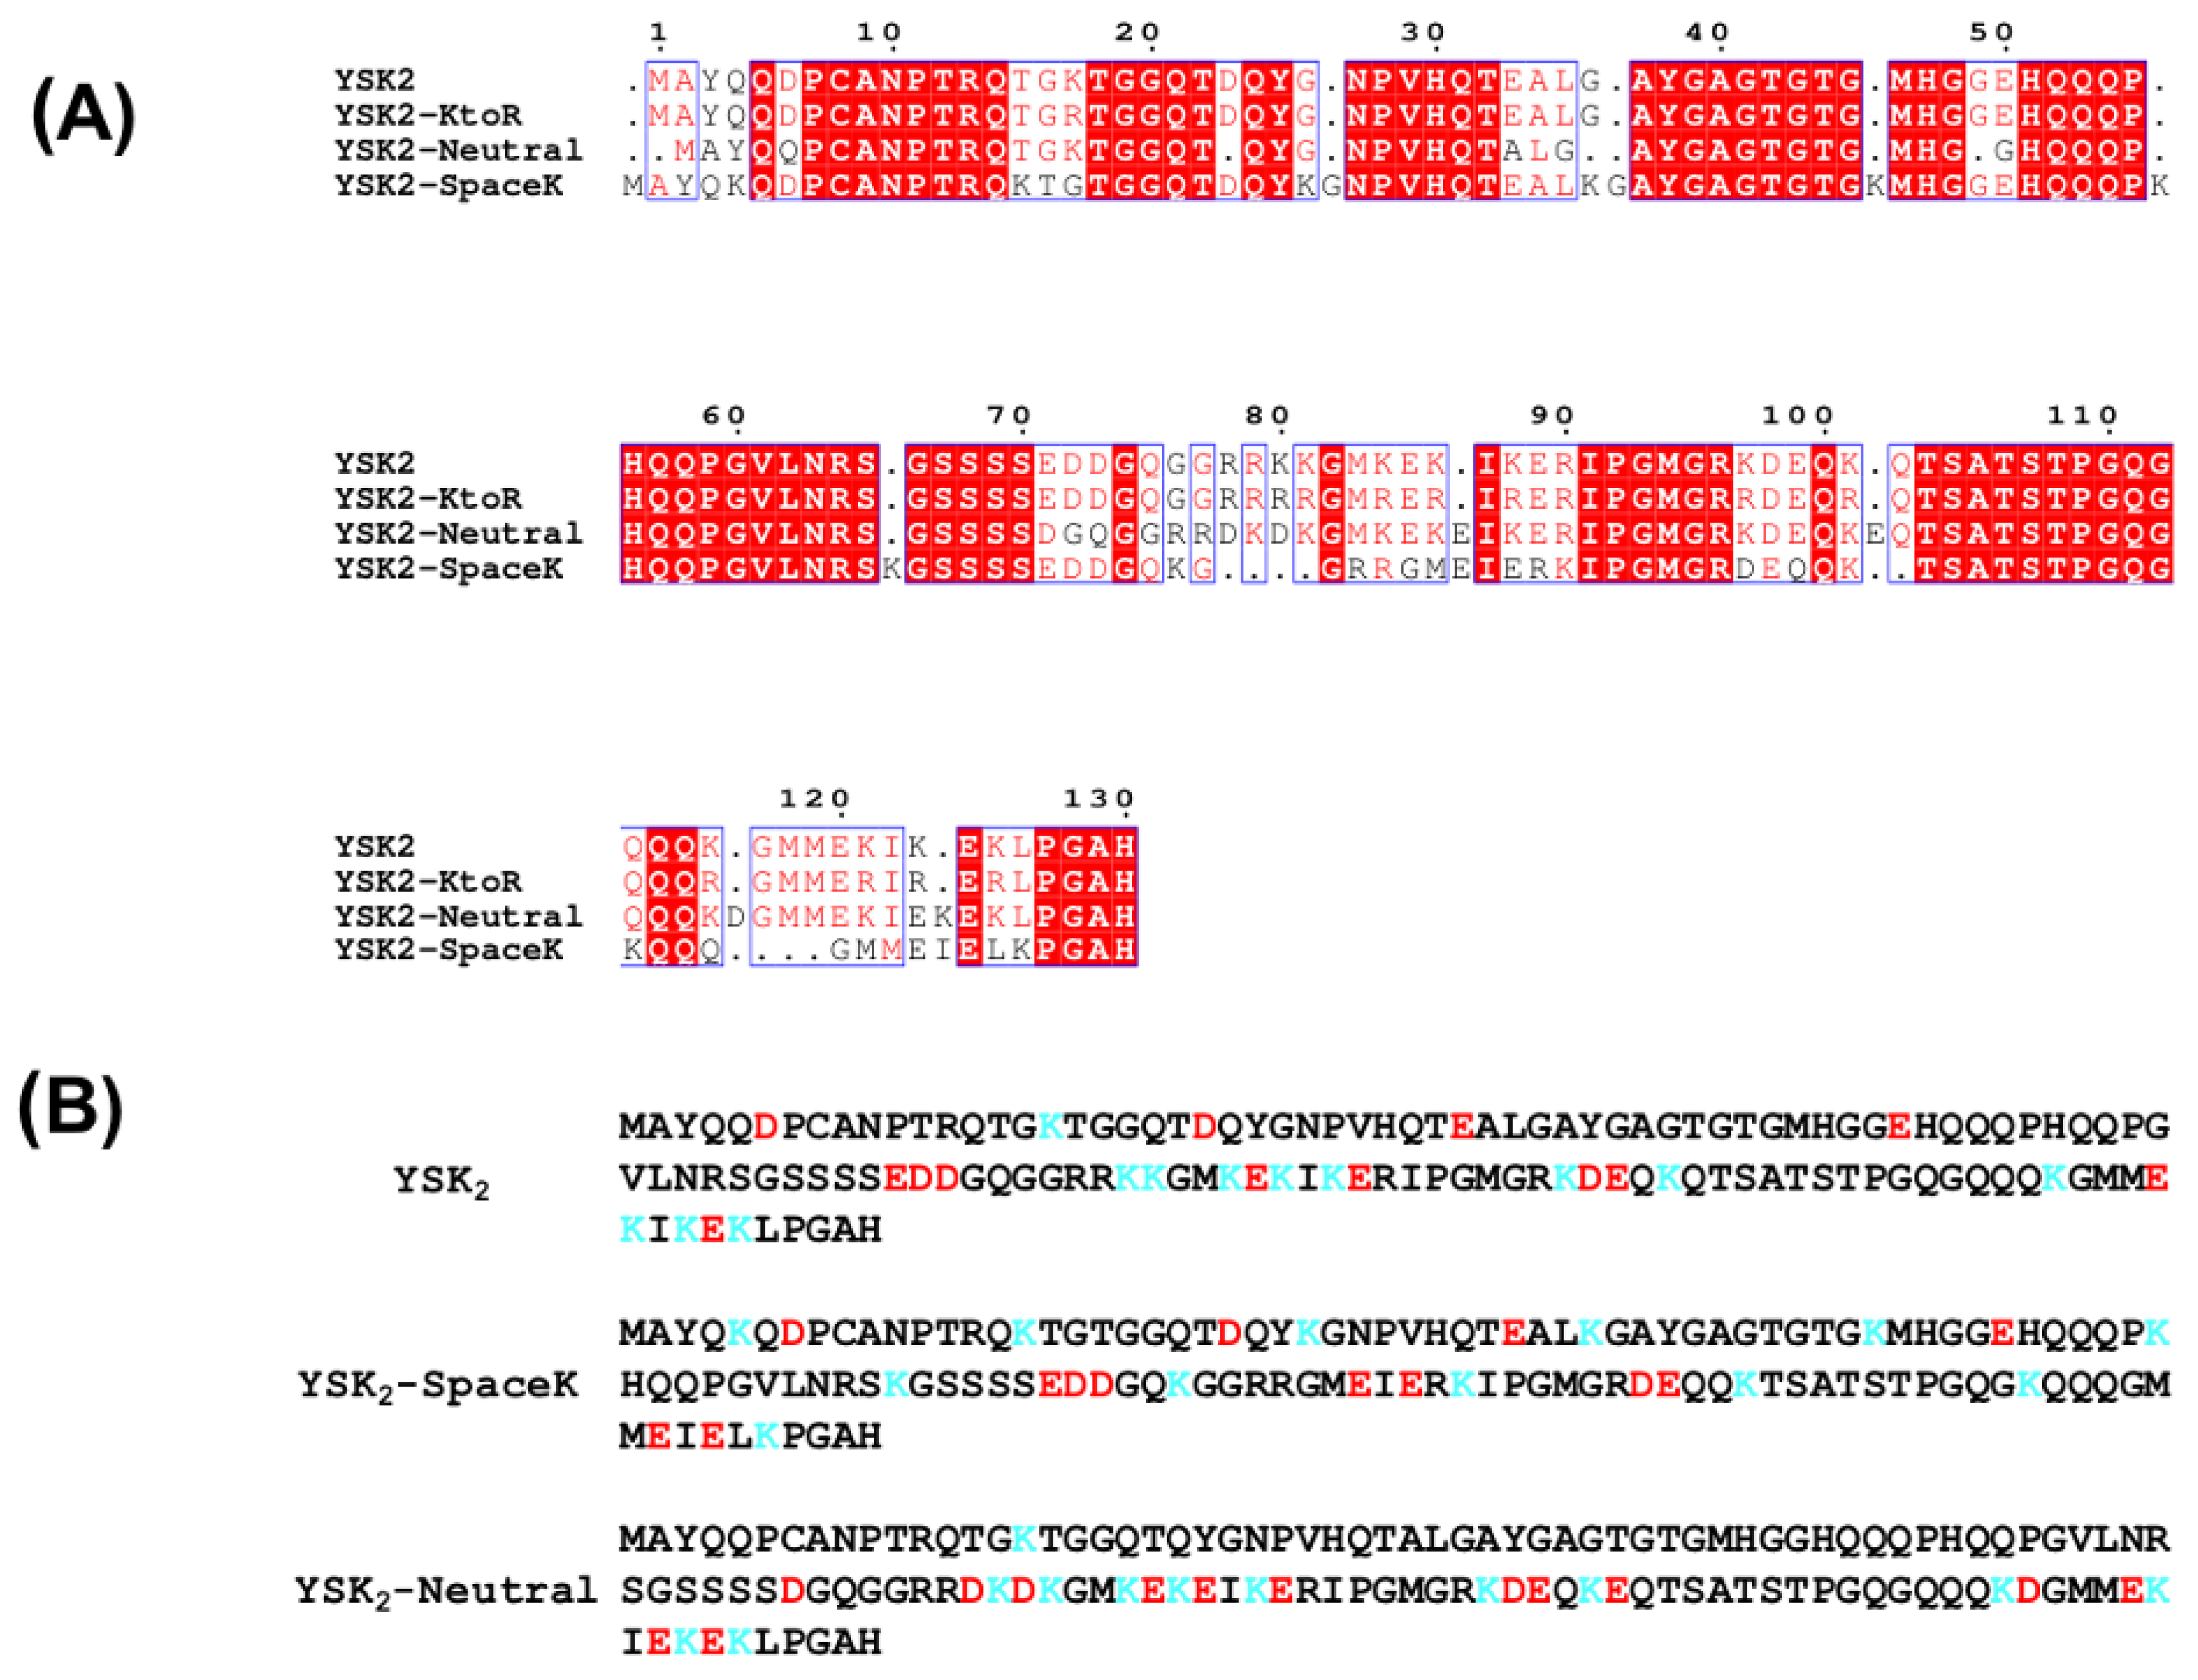
Figure 1. Sequences of wild-type YSK2 and the three constructs. (A) Multiple sequence alignment of YSK2, YSK2K→R, YSK2-SpaceK, and YSK2-Neutral. The alignment was performed using ClustalW and the image was created using ESPript. Conserved regions are shown bounded by a blue box. White letters on a red background show residues conserved among all sequences, while red letters on a white background show residues that are similar. (B) Distribution of lysine and negatively charged residues in the YSK2-SpaceK and YSK2-Neutral constructs. All negatively charged residues are shown in red and all lysine residues are shown in blue.
Biomolecules 12 01510 g001
Figure 2. Comparison of the disorder of the wild-type YSK2 and the constructs. CD spectra of 10 μM protein in 10 mM Tris, pH 7.4, were collected at 25 °C. Symbols are shown as an inset. Each spectrum is an average of three replicates with six accumulations each. Error bars represent the standard deviation.
Biomolecules 12 01510 g002
Figure 3. Cryoprotection of LDH by the YSK2 constructs. The LDH assay was performed as described by [31]. The legend is shown as a figure inset. Lines were fitted using the equation described in Section 2, where the percent LDH preservation is relative to untreated LDH in the absence of additives. Red line, YSK2-K→R; solid black line, YSK2-Neutral; YSK2-SpaceK, yellow line; YSK2, dashed line with diamond symbols; BSA, dashed line with square symbols.
Biomolecules 12 01510 g003
Figure 4. Spectra of Yfh1 at 25 and 1 °C. CD spectra of 10 μM Yfh1 at 25 °C and 1 °C in 10 mM Tris, pH 7.4. The spectra shown here are an average of eight replicates with error bars representing standard deviation.
Biomolecules 12 01510 g004
Figure 5. Yfh1 spectra in the presence of YSK2 constructs. CD spectra of 10 μM Yfh1 at 1 °C in the presence of 5 (red), 7.5 (yellow), 10 (blue), 15 (green), and 20 μM (purple). (A) Yfh1 spectra in the presence of YSK2, (B) Yfh1 spectra in the presence of YSK2-K→R, (C) Yfh1 spectra in the presence of YSK2-SpaceK and (D) Yfh1 spectra in the presence of YSK2-Neutral. The panels also contain the spectra of 10 μM Yfh1 alone at 1 °C (black circles) and at 25 °C (black × symbols). Each spectrum is an average of three replicates. All samples were in 10 mM Tris, pH 7.4, buffer.
Biomolecules 12 01510 g005
Figure 6. The Relationship between Yfh1 helicity and construct concentration. The CD spectrum of 10 μM Yfh1 was determined at 1 °C in 10 mM Tris, pH 7.4, in the presence and absence of the various dehydrin constructs. The equation described in Section 2 was used to find the percent α-helicity of Yfh1. Three replicates were used to create this image and the standard deviation is represented by the error bars. The dashed line indicates the helicity of Yfh1 alone at 25 °C, while the dotted line indicates the helicity of Yfh1 alone at 1 °C. YSK2, light blue line; YSK2-SpaceK, red line; YSK2-Neutral, green line; YSK2-K→R, yellow line.
Biomolecules 12 01510 g006
Figure 7. The effect of PEG 10,000 on Yfh1 Structure. CD spectra of 10 μM Yfh1 in the presence of various concentrations of PEG 10,000 at 1 °C in 10 mM Tris, pH 7.4.
Biomolecules 12 01510 g007
Figure 8. 15N-HSQC spectra of YSK2 in the presence and absence of Yfh1. 15N-HSQC spectra overlap of 0.5 mM 15N-labelled YSK2 alone (red) and in the presence of 0.5 mM Yfh1 (blue). All samples are in pH 6.0 phosphate buffer. Data were collected at 300 K.
Biomolecules 12 01510 g008
Publisher’s Note: MDPI stays neutral with regard to jurisdictional claims in published maps and institutional affiliations.