
Pulsed Electric Field (PEF) Enhances Iron Uptake by the Yeast Saccharomyces cerevisiae

 ,
,  ,
,  and
and
Abstract
1. Introduction
2. Results and Discussion
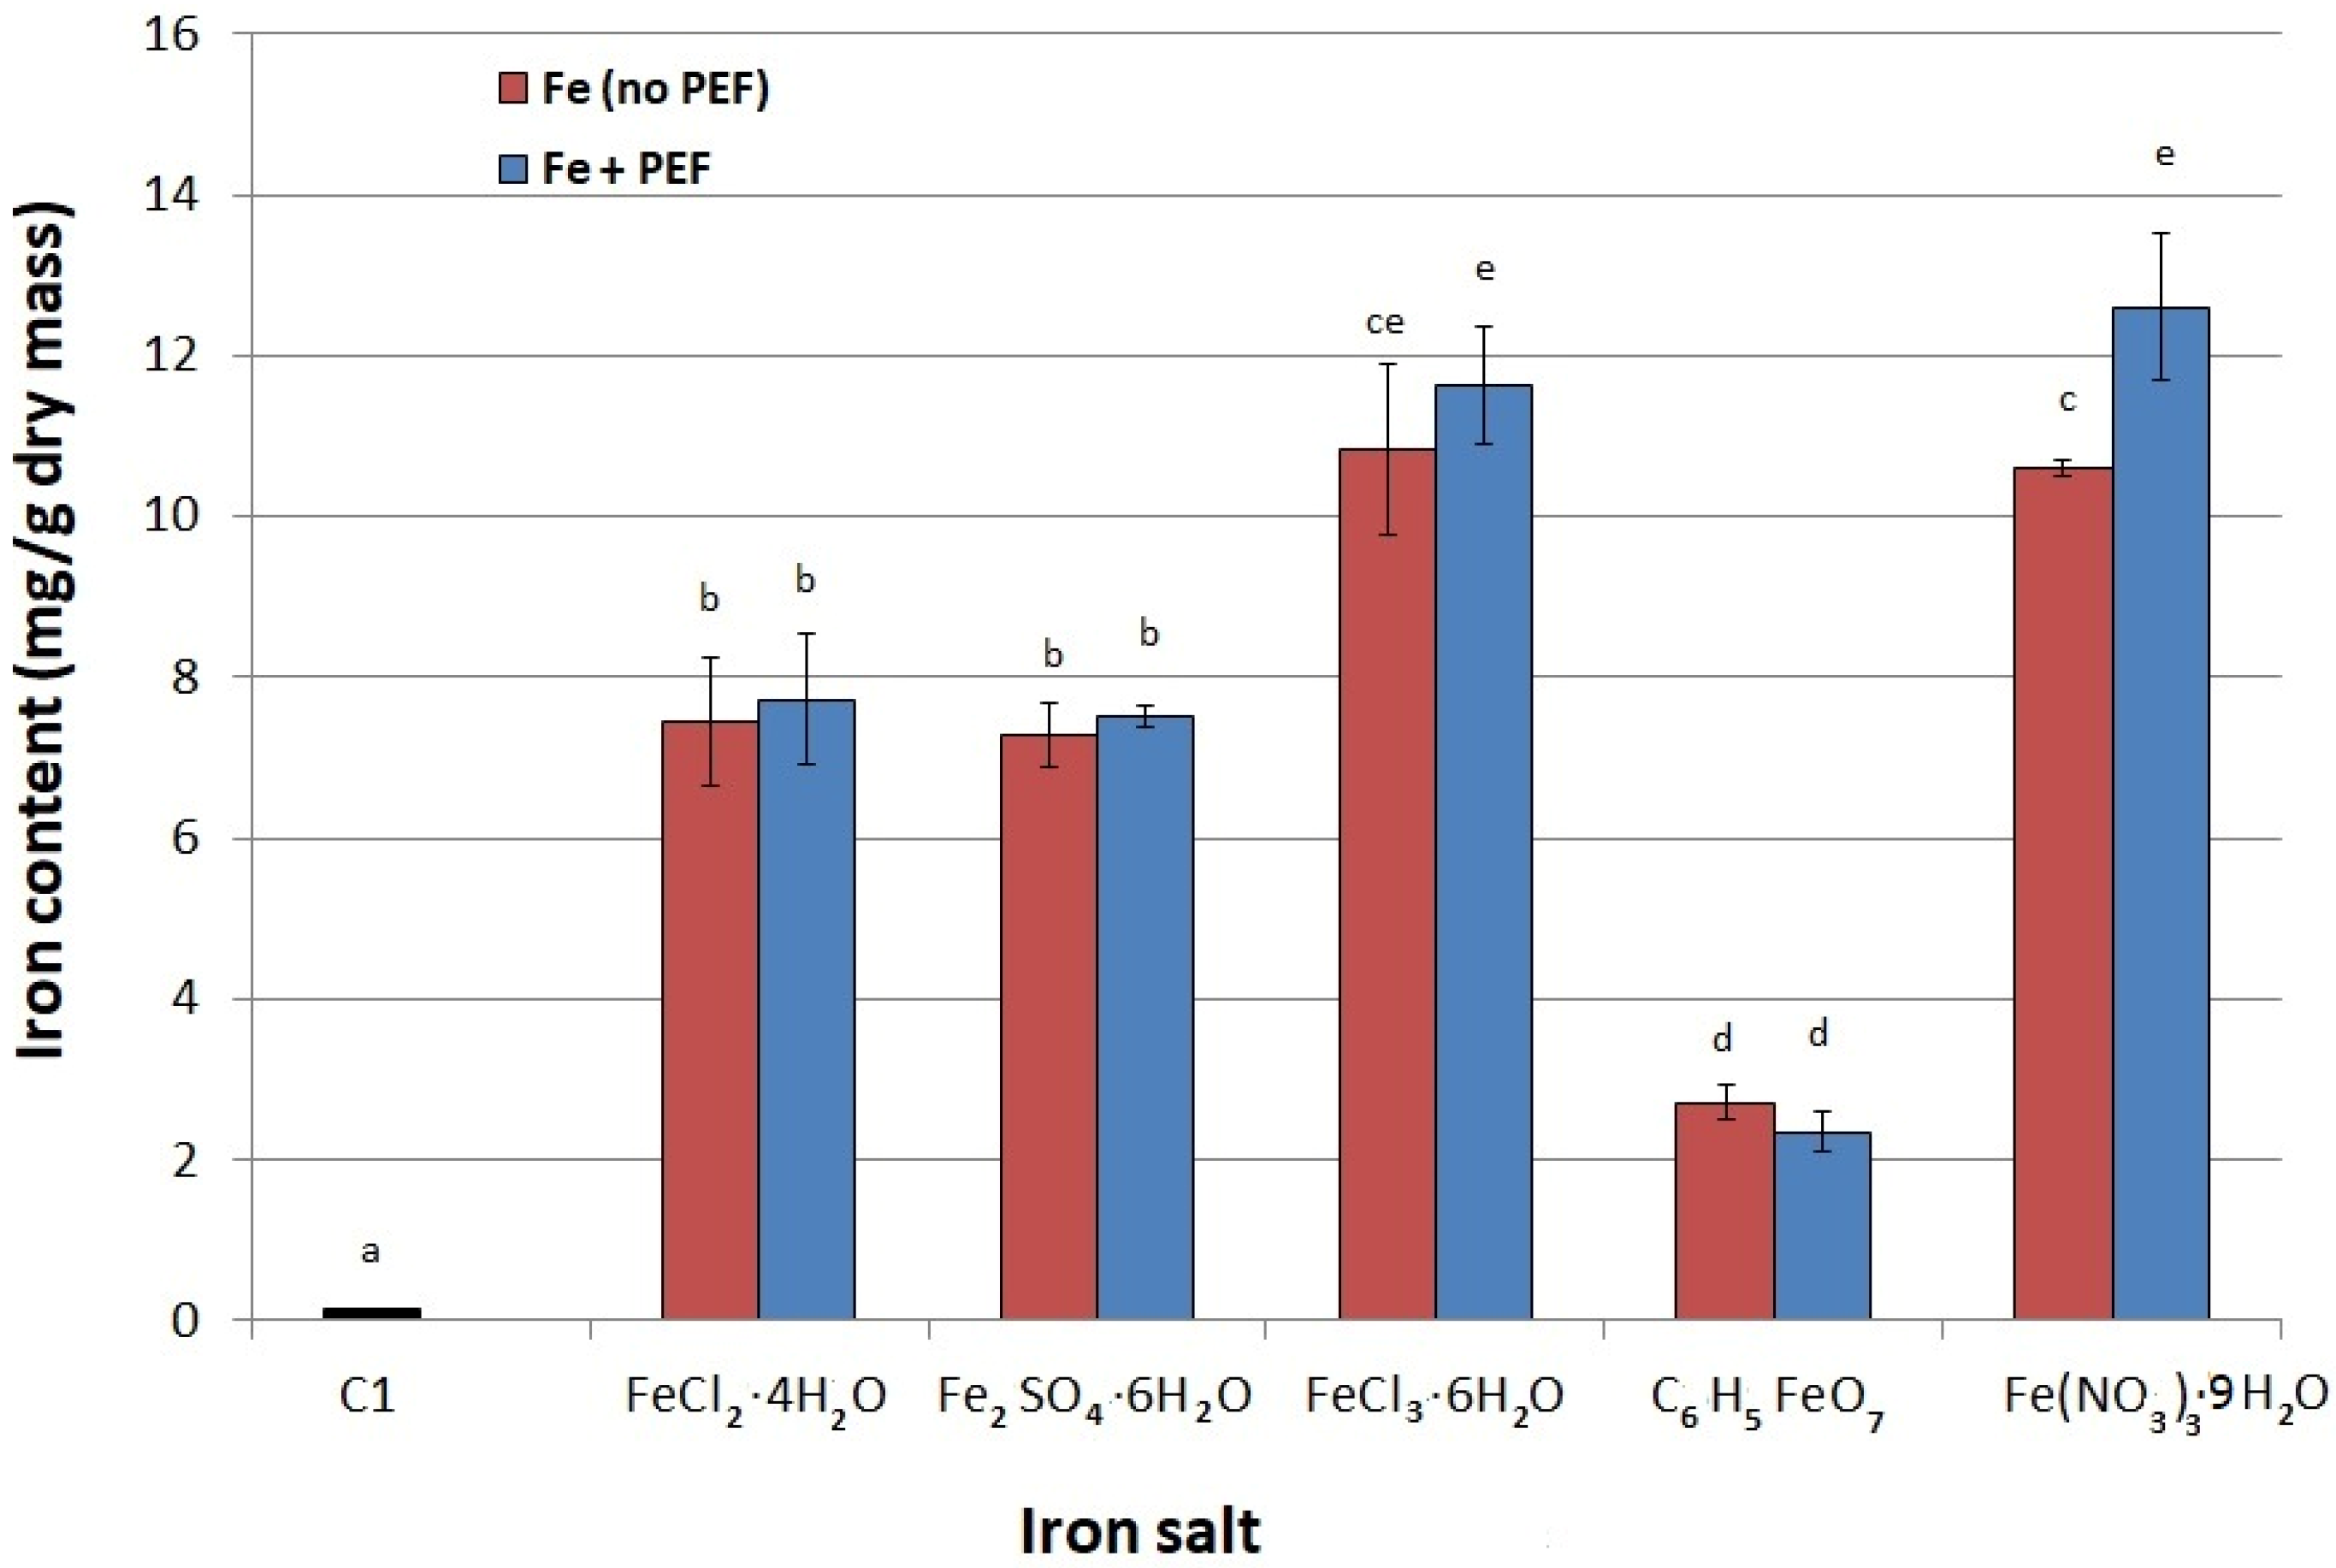
2.1. Selection of Iron Salt
2.2. Conditions of PEF Treatment
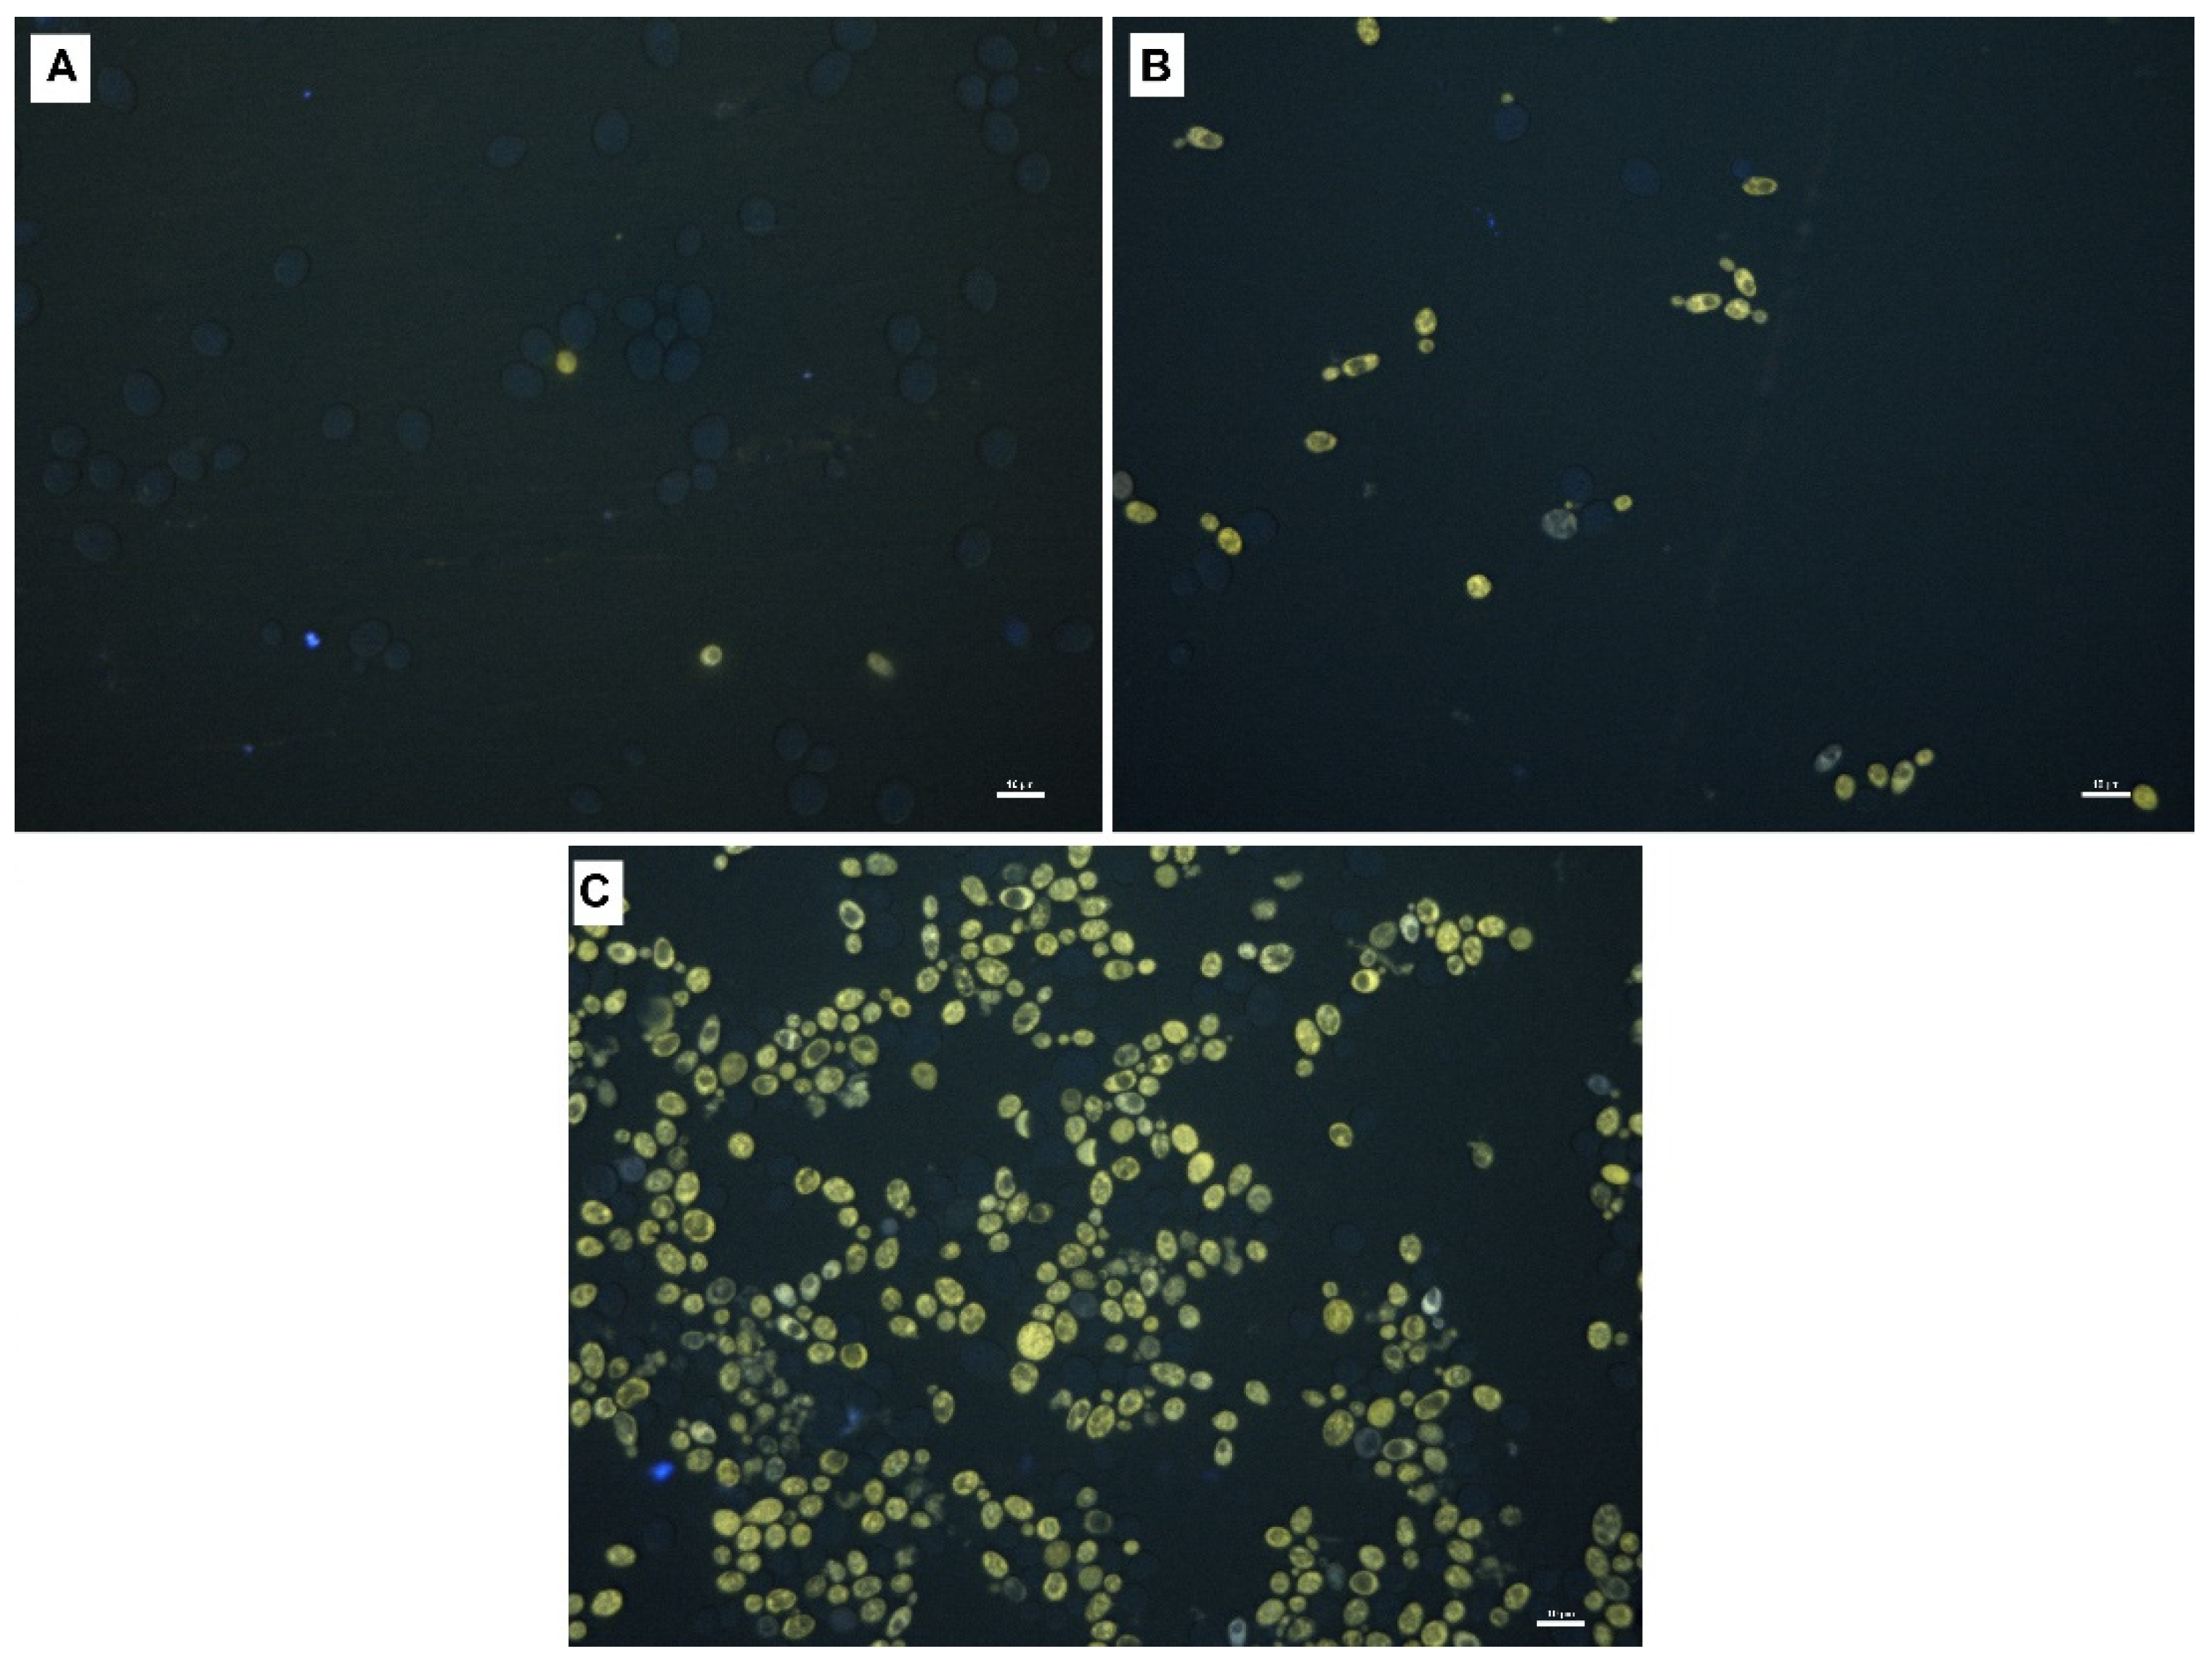
2.3. Fluorescence Imaging of Yeast Cells
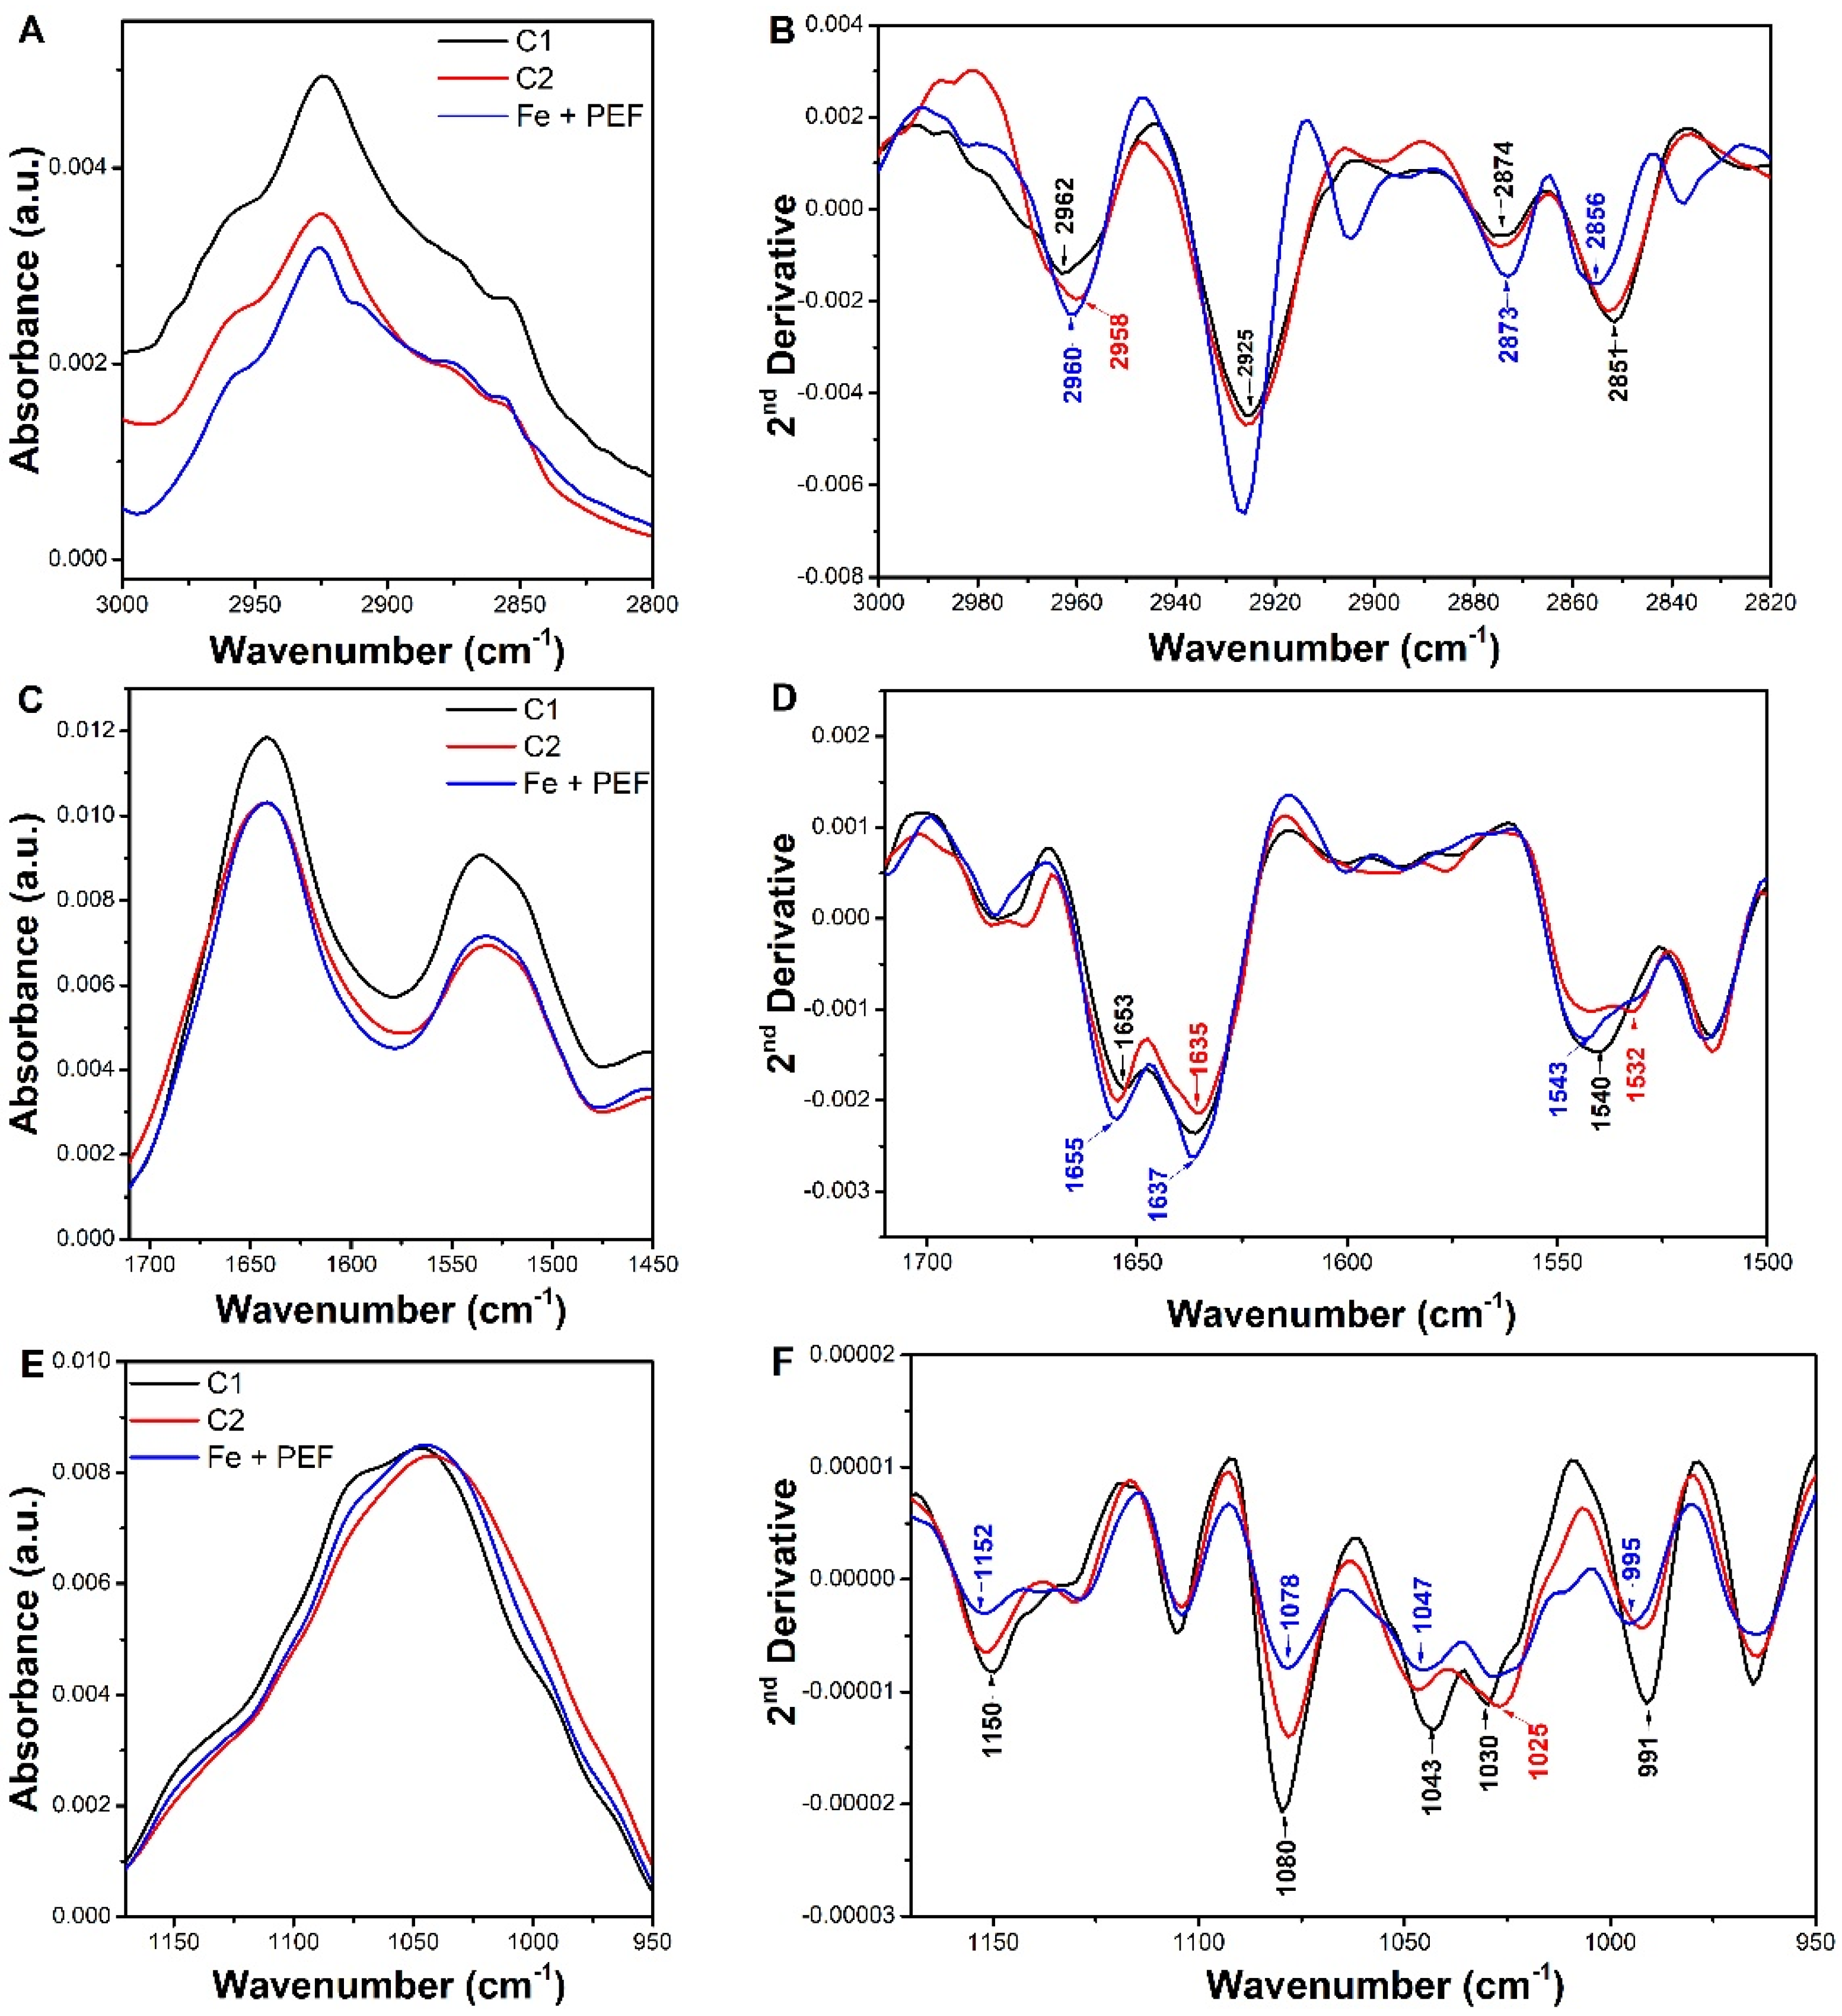
2.4. Attenuated Total Reflectance-Fourier Transform Infrared Spectroscopy
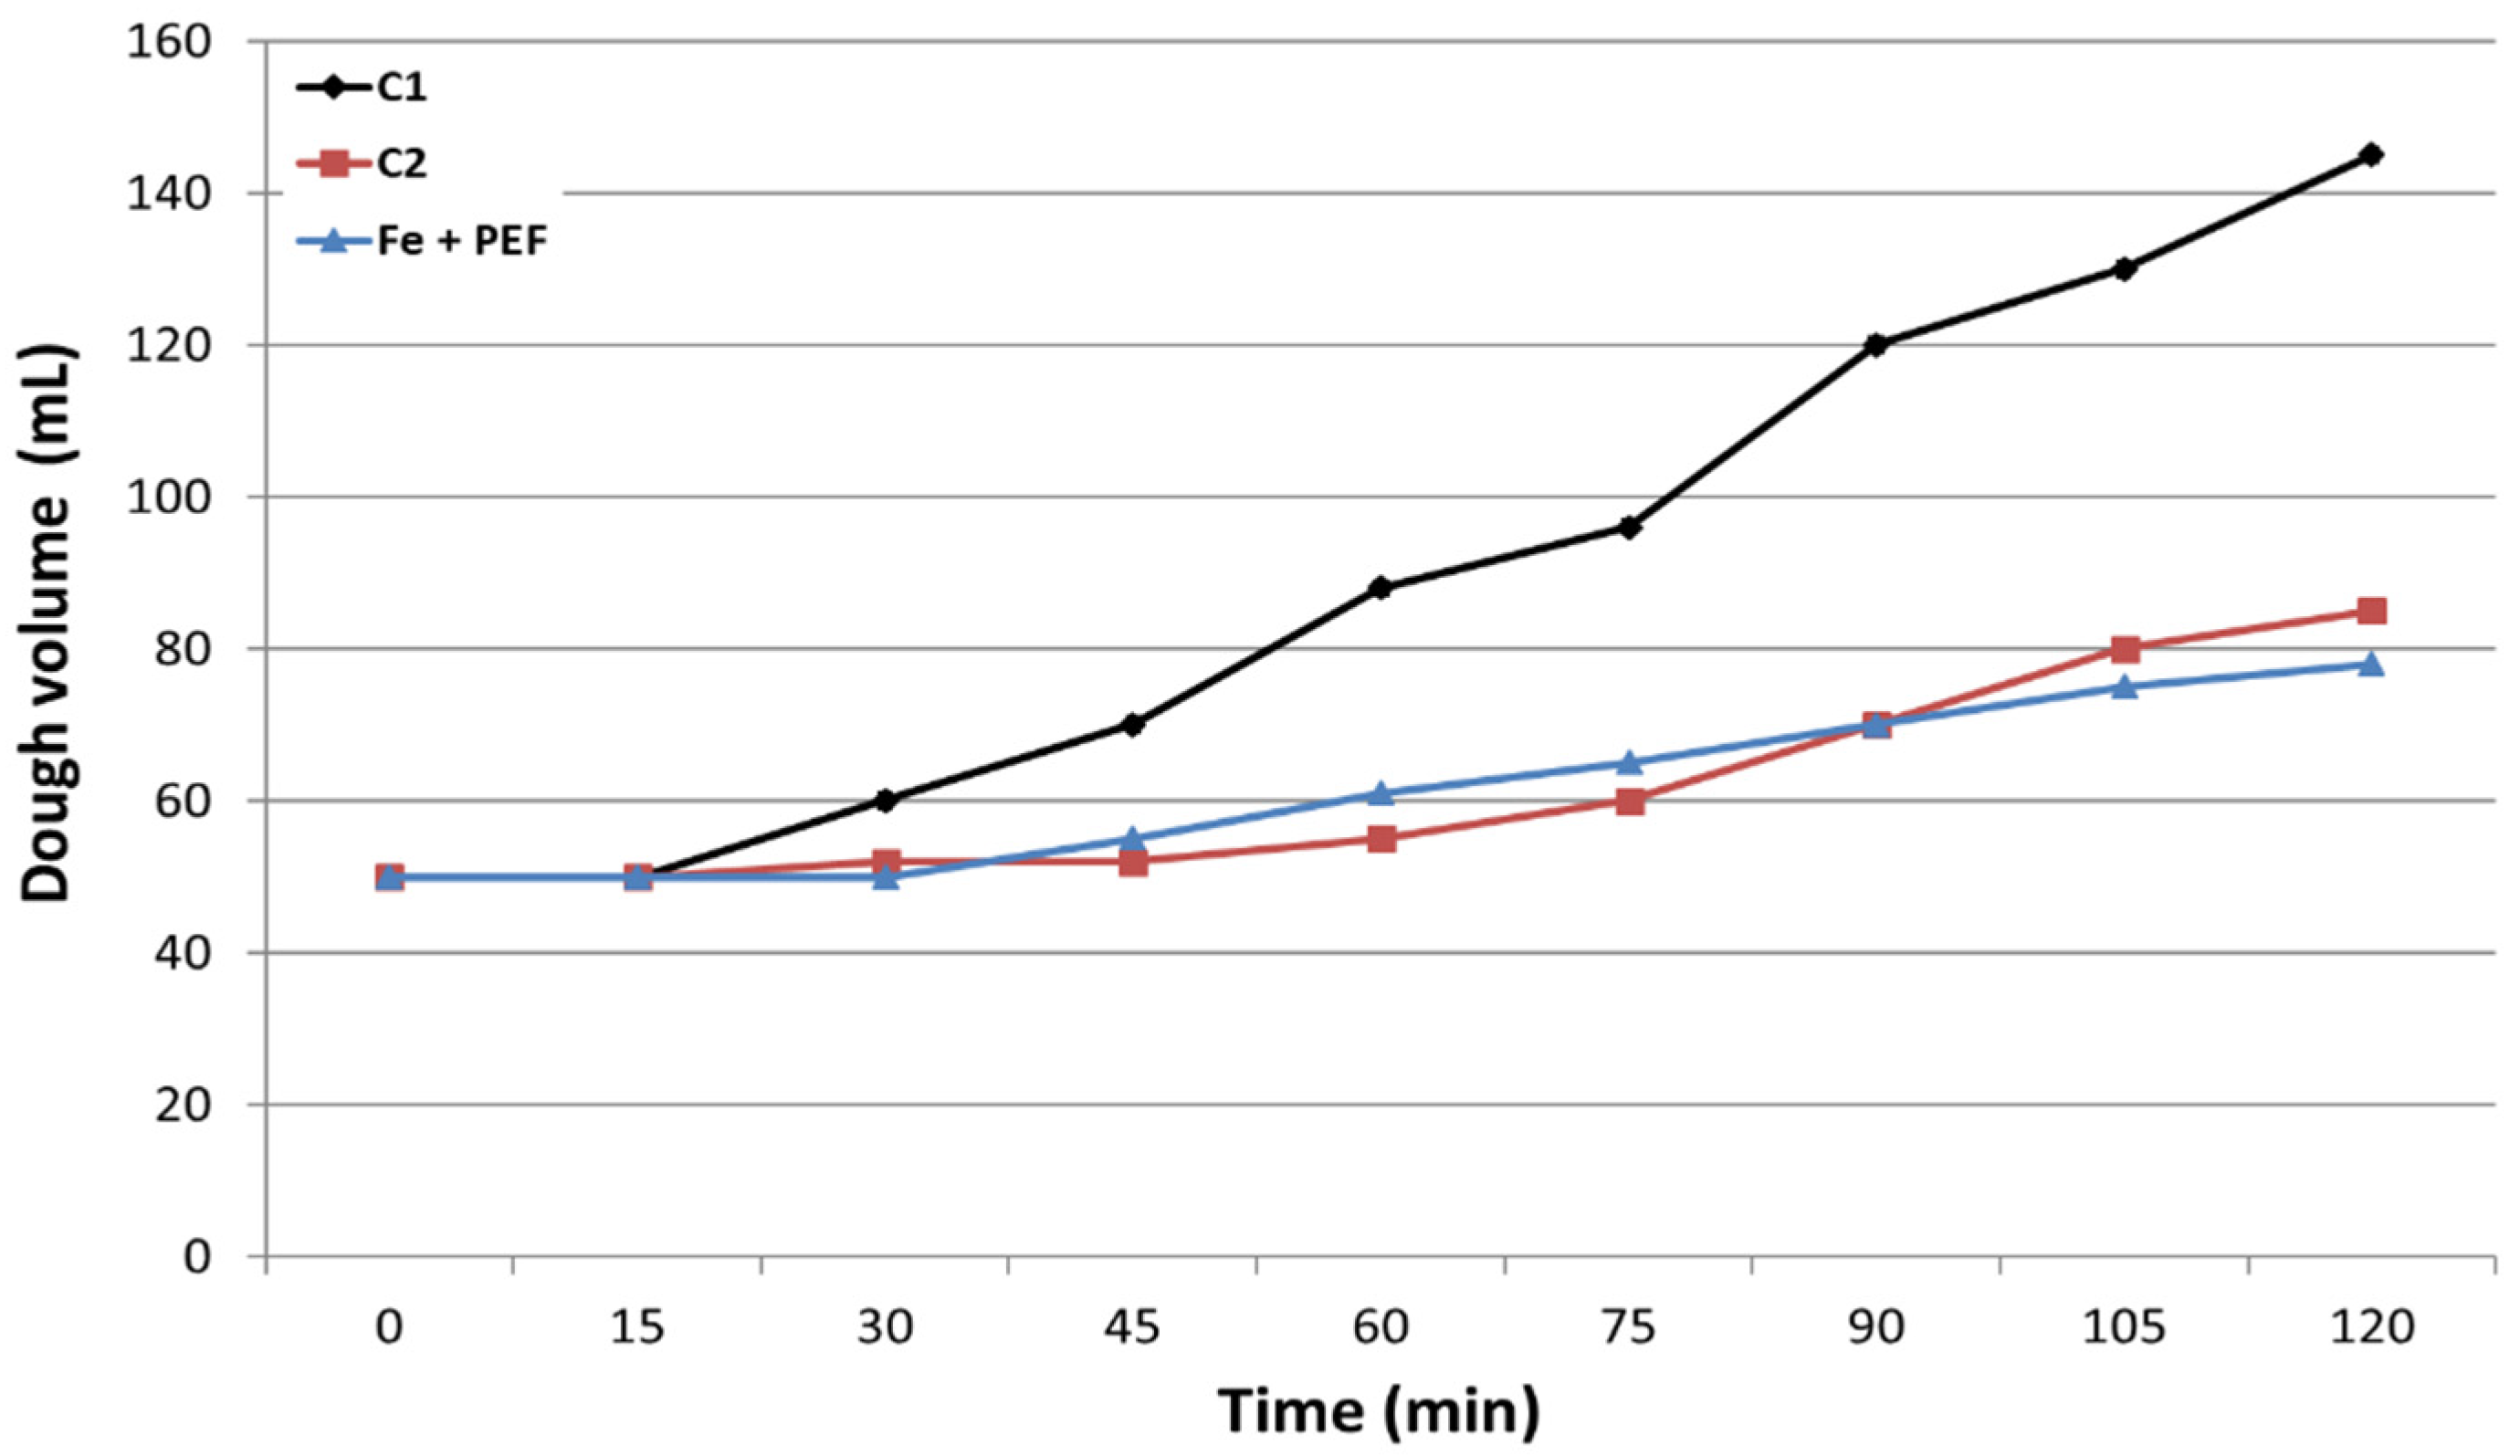
2.5. Fermentative Properties and Protein Content in Yeast Cells
3. Materials and Methods
3.1. Microorganism and Growth Media
3.2. Biomass Cultivation
3.3. Design of Experiments for Optimization Iron Accumulation
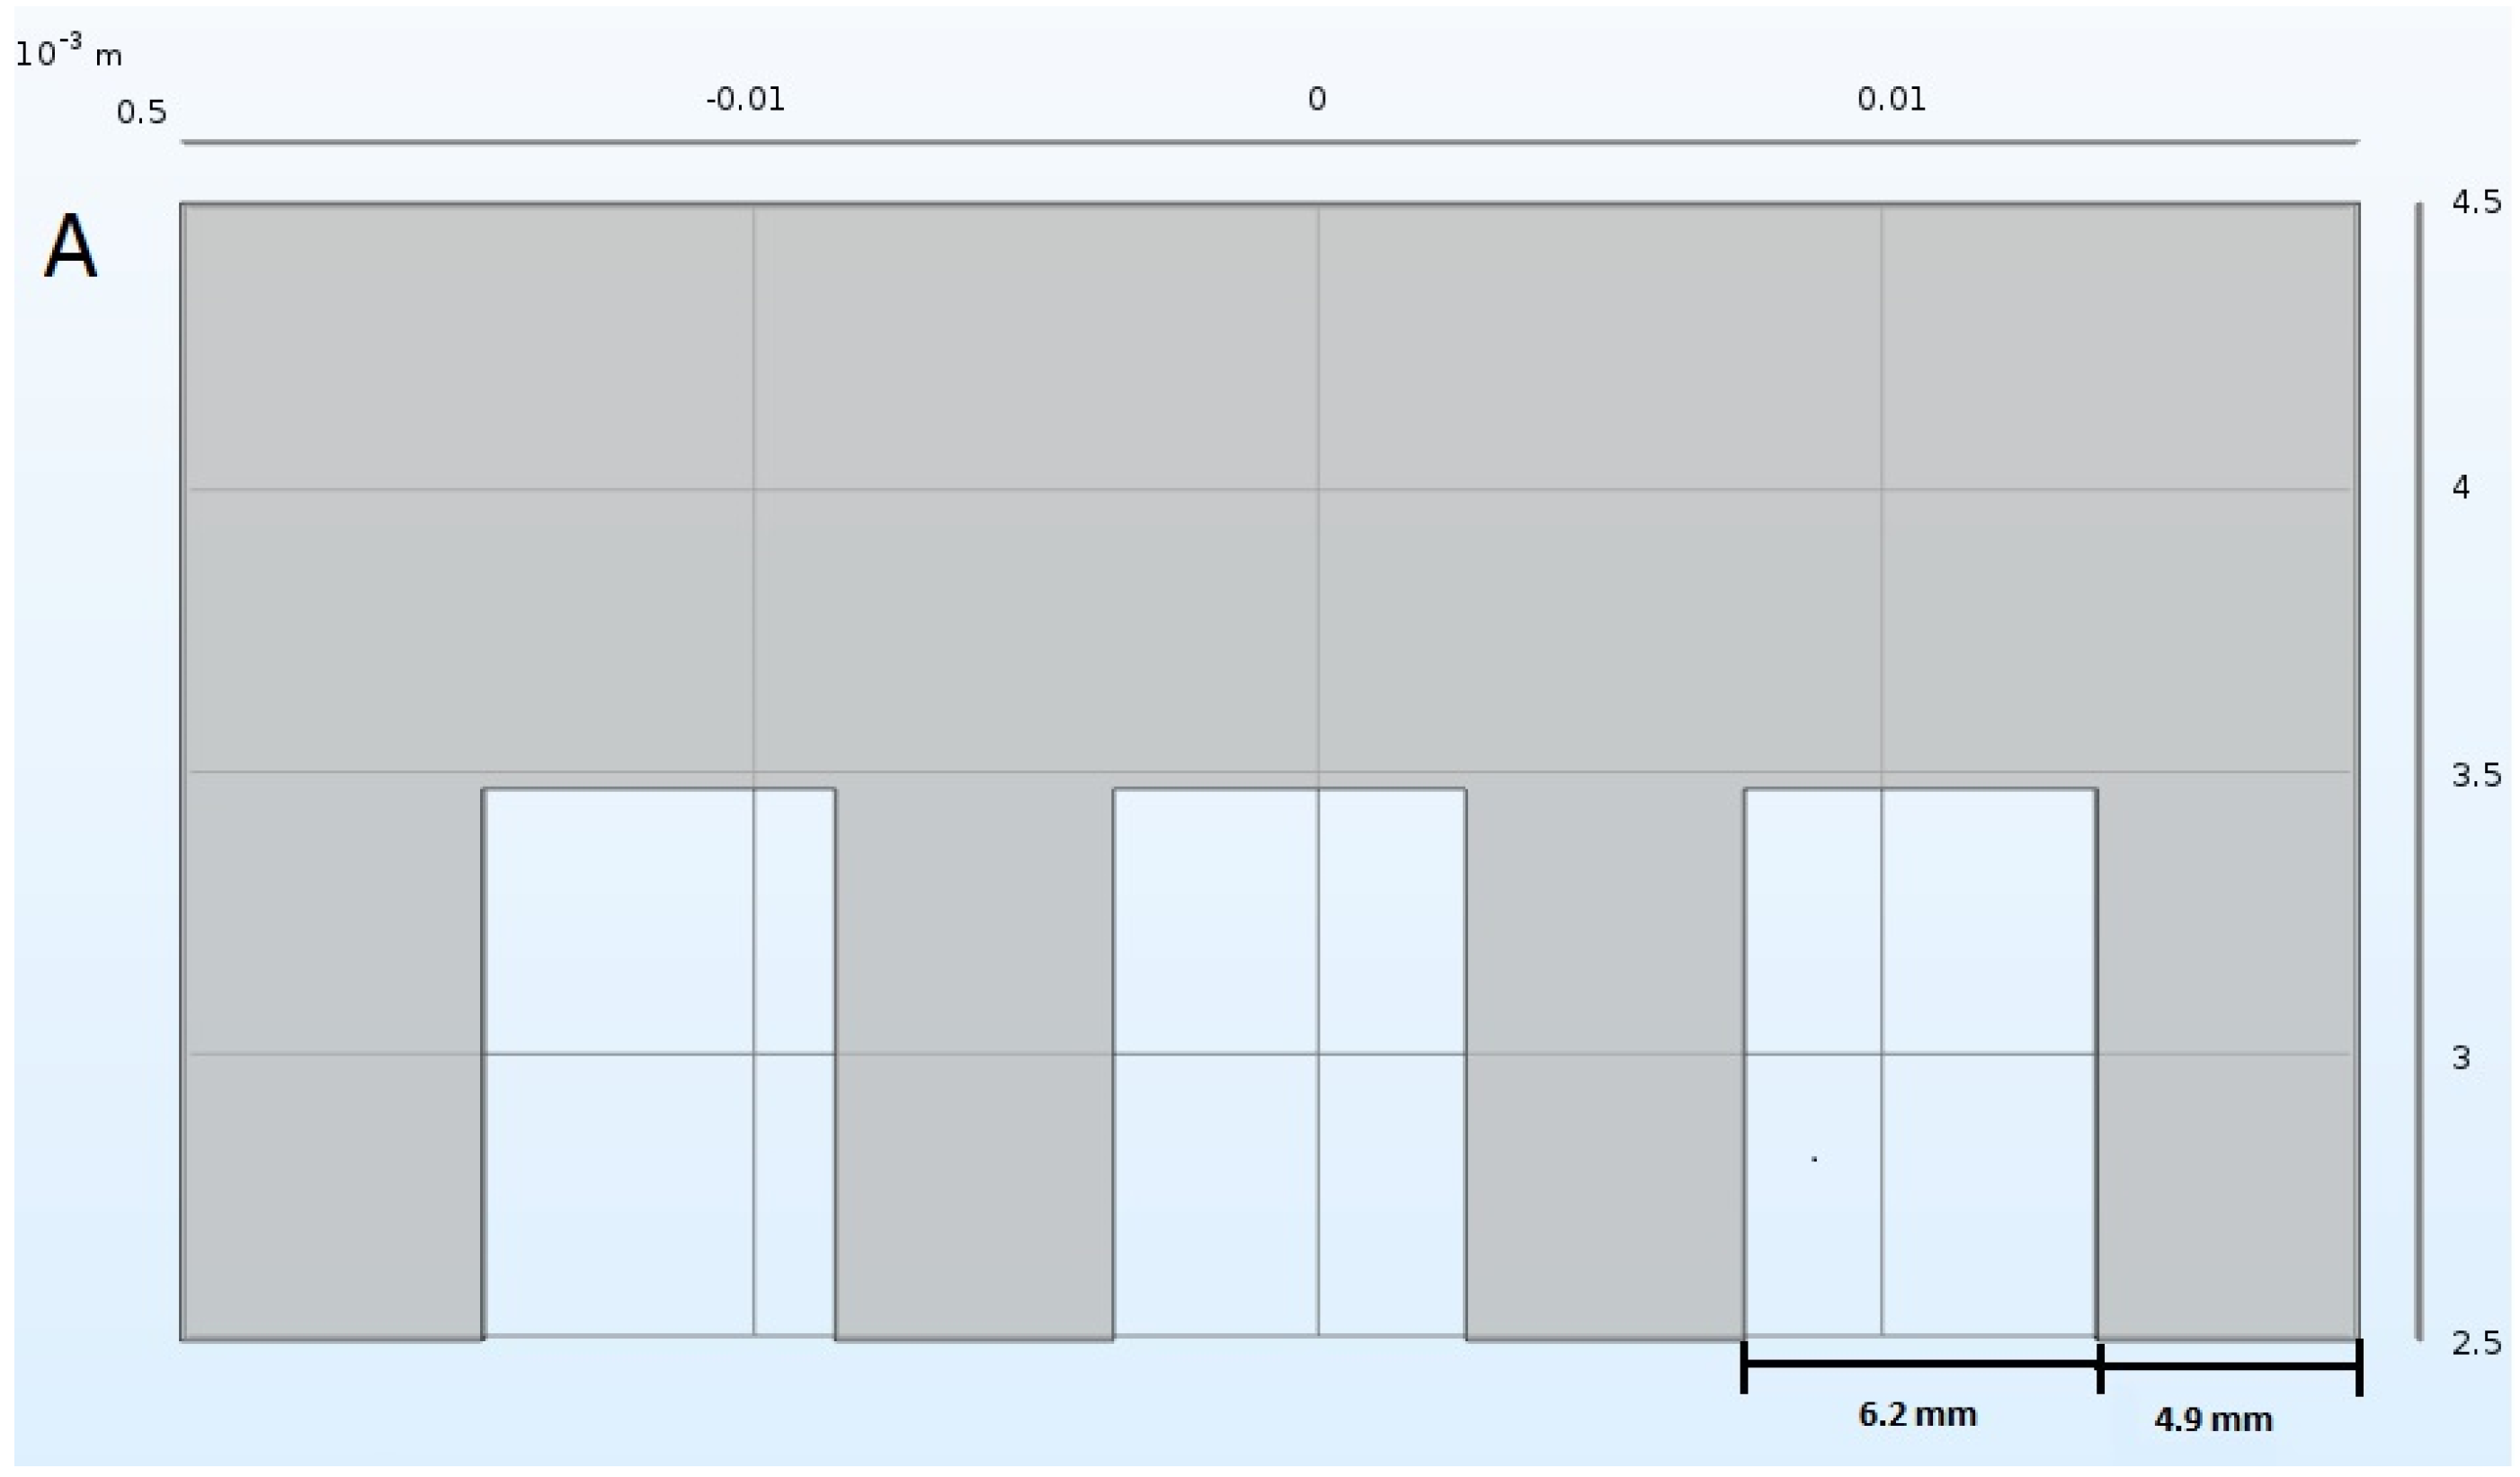
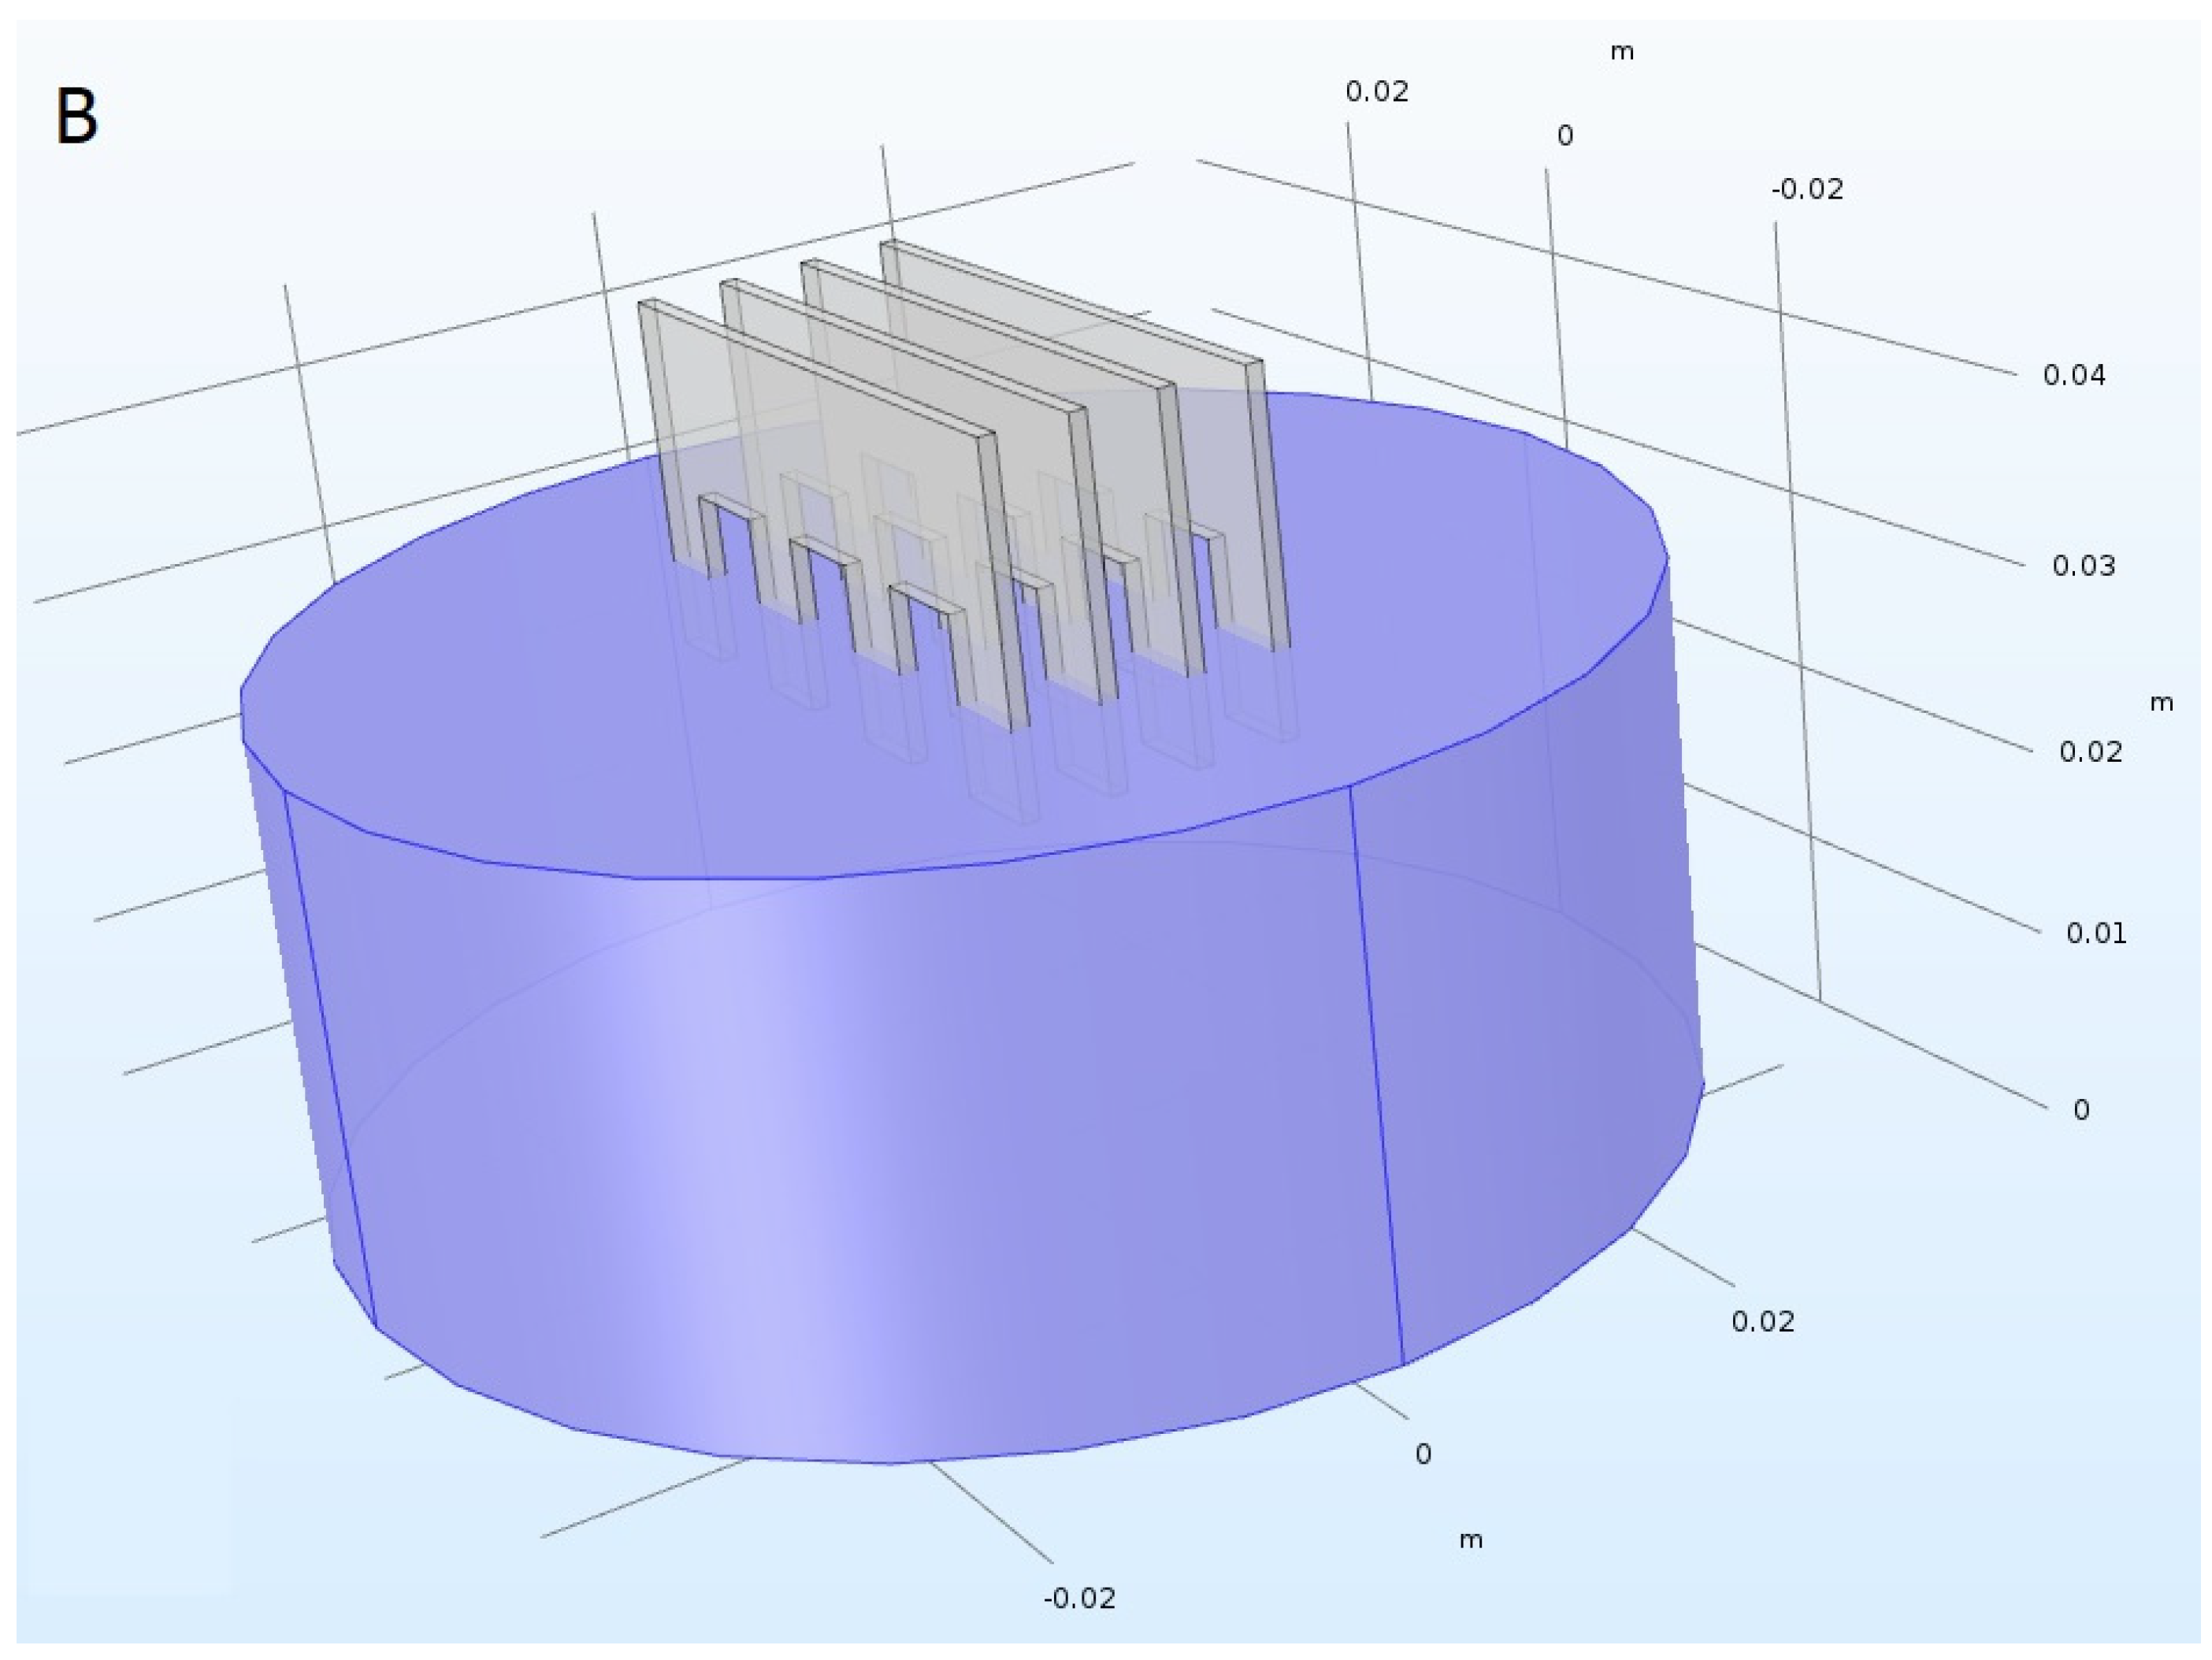
3.4. PEF Treatment
3.5. Selection of Iron Salt
3.6. Selecting Optimal Process Parameters
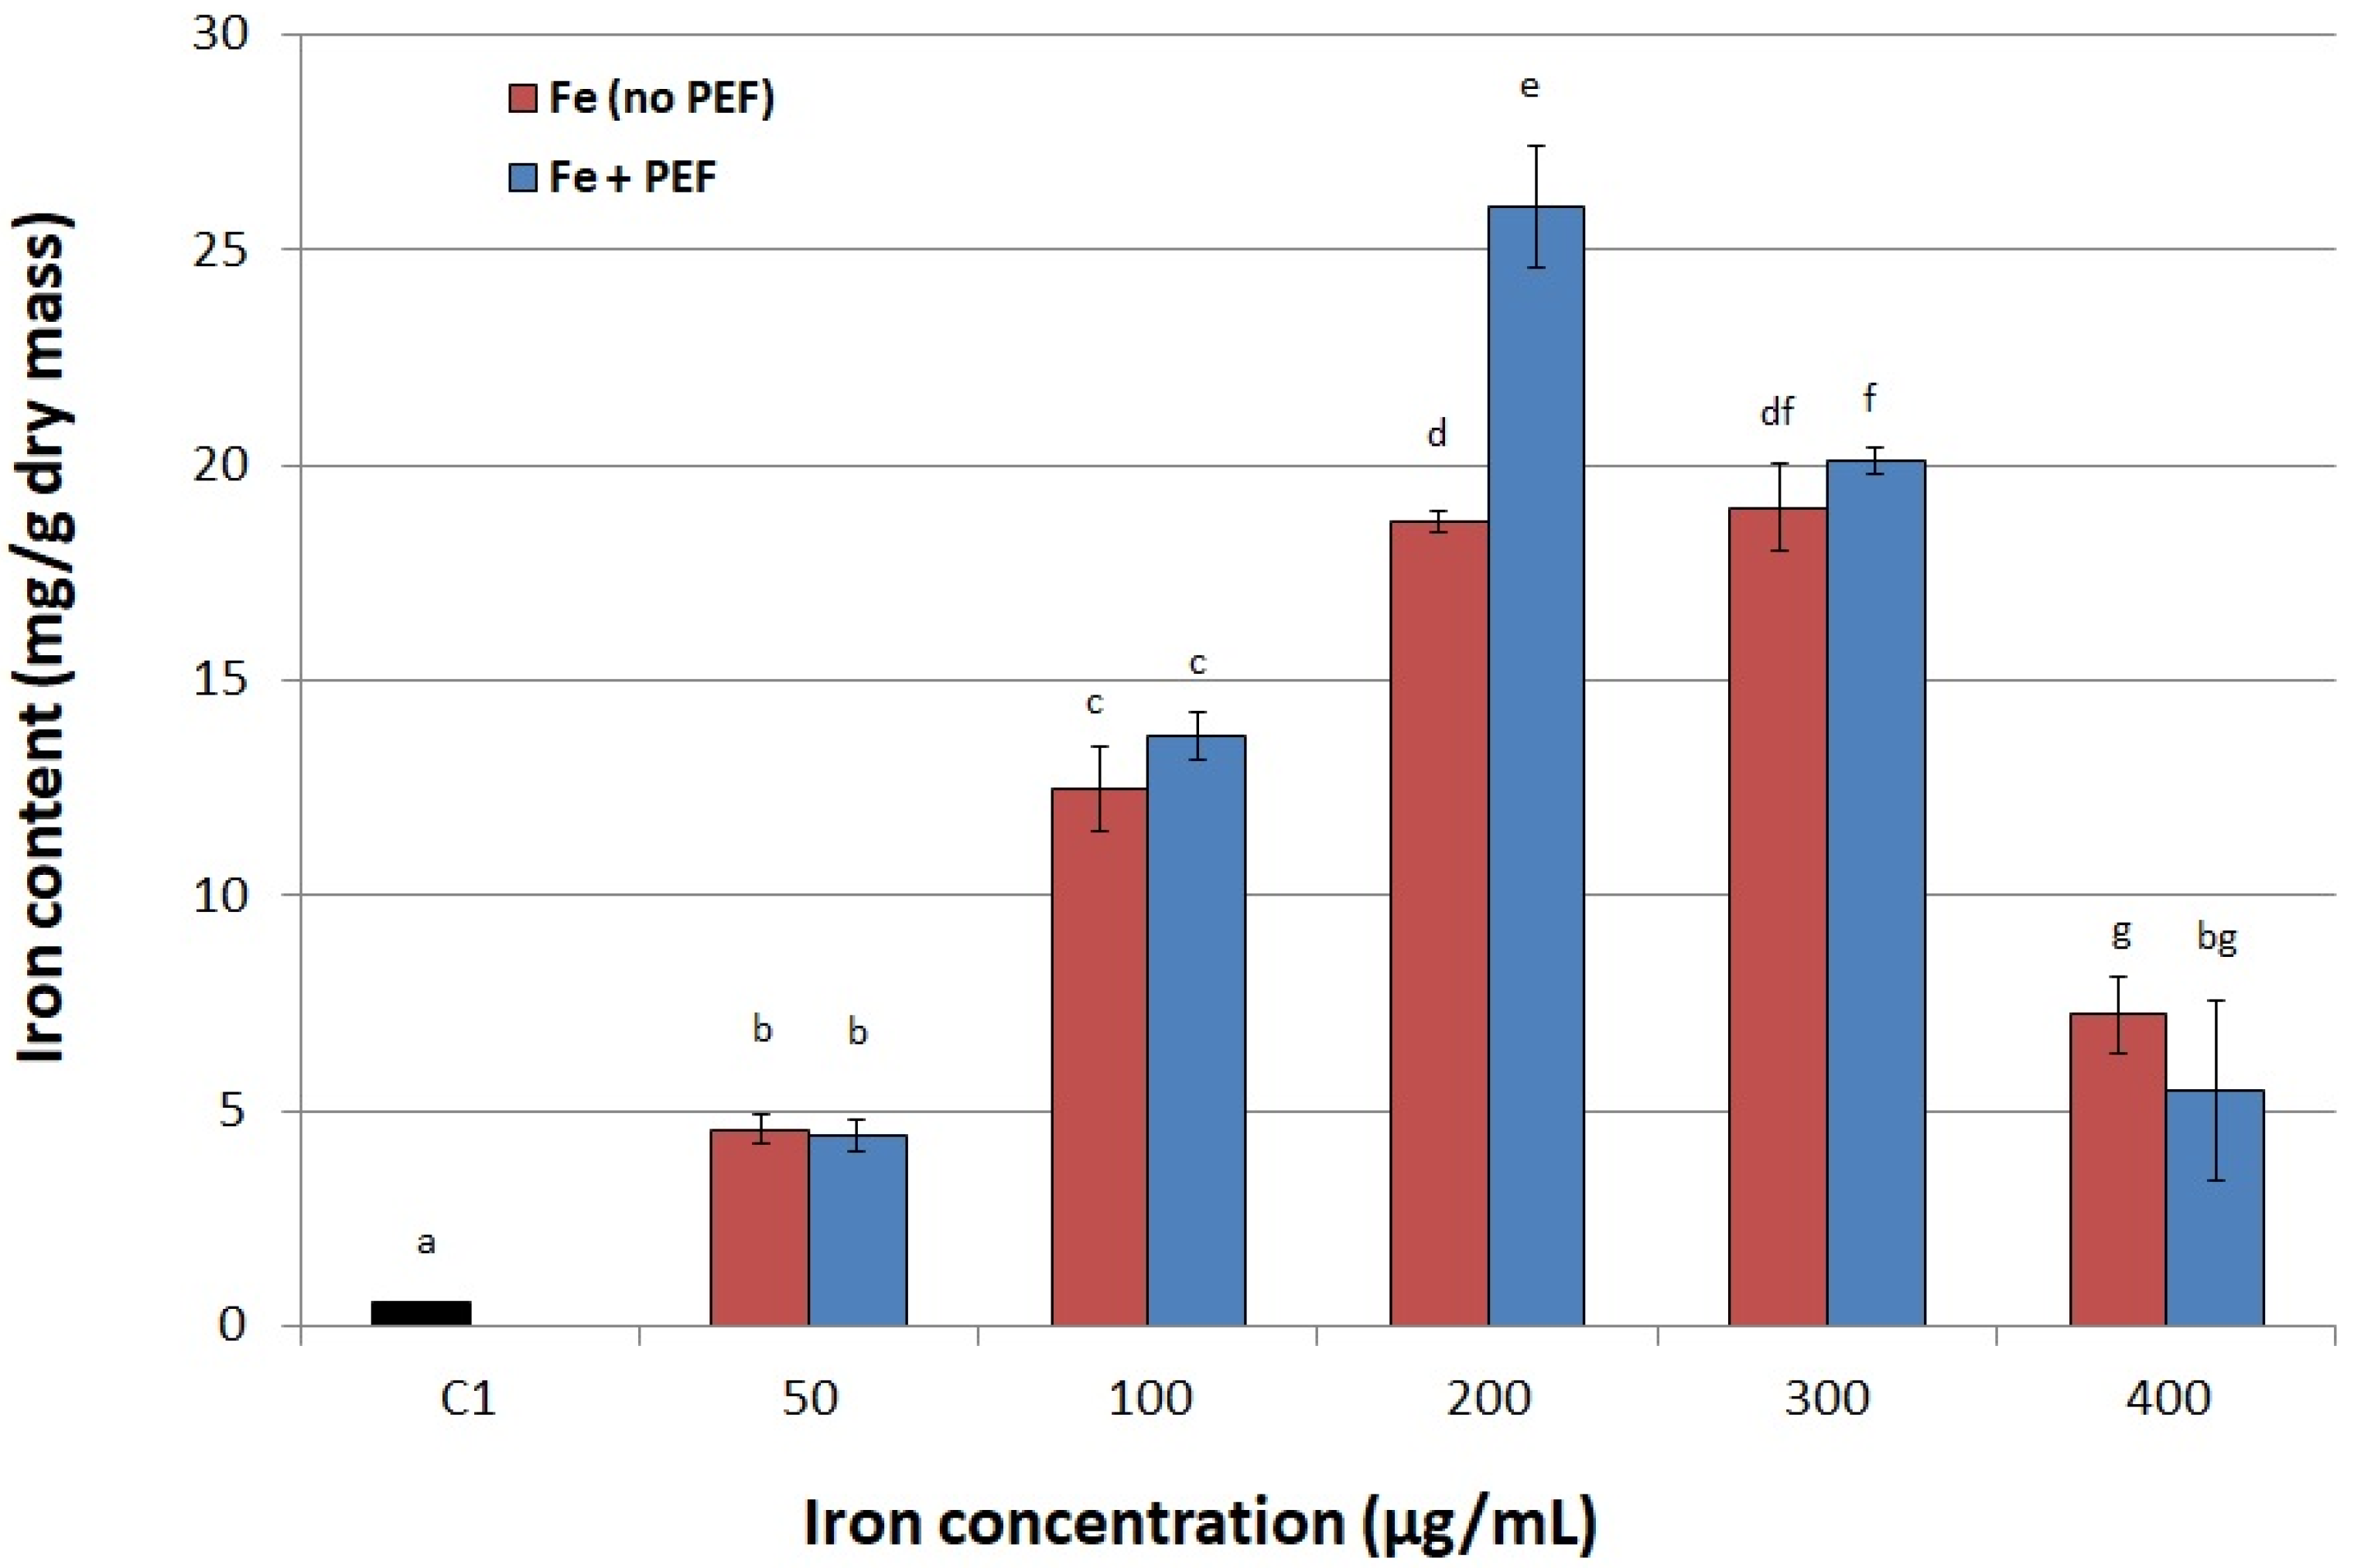
3.6.1. Iron Concentration in the Medium
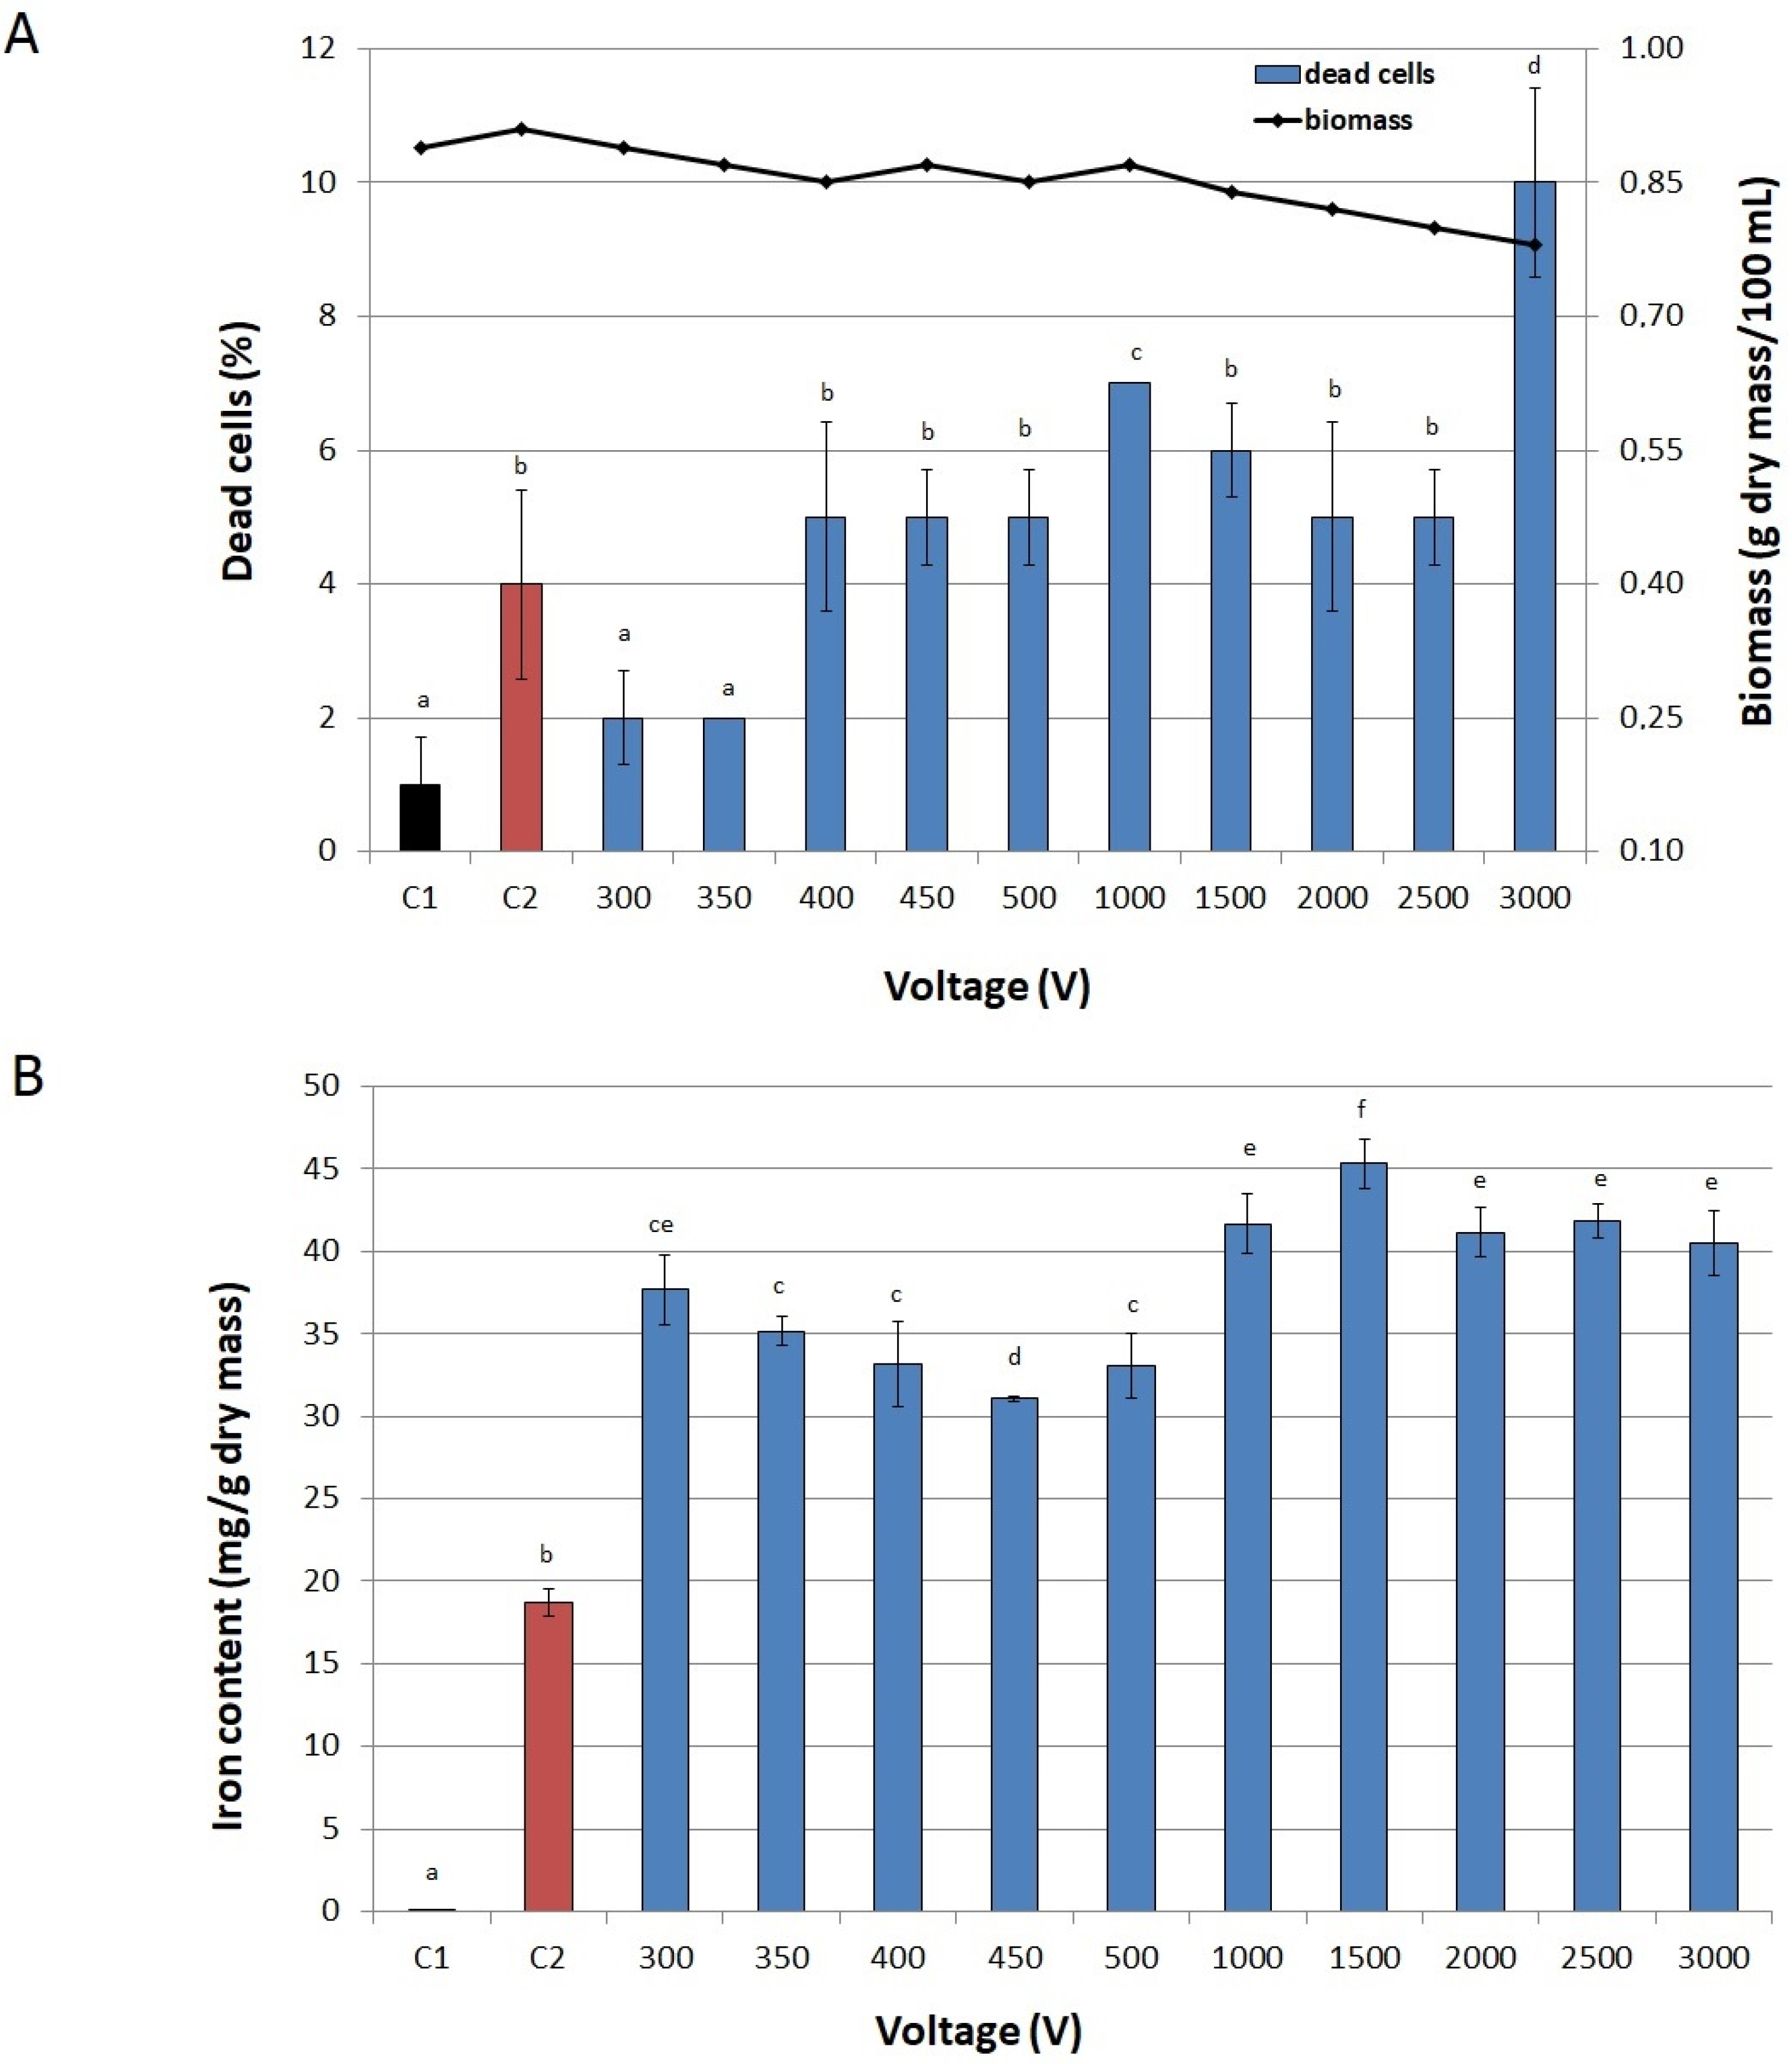
3.6.2. Voltage
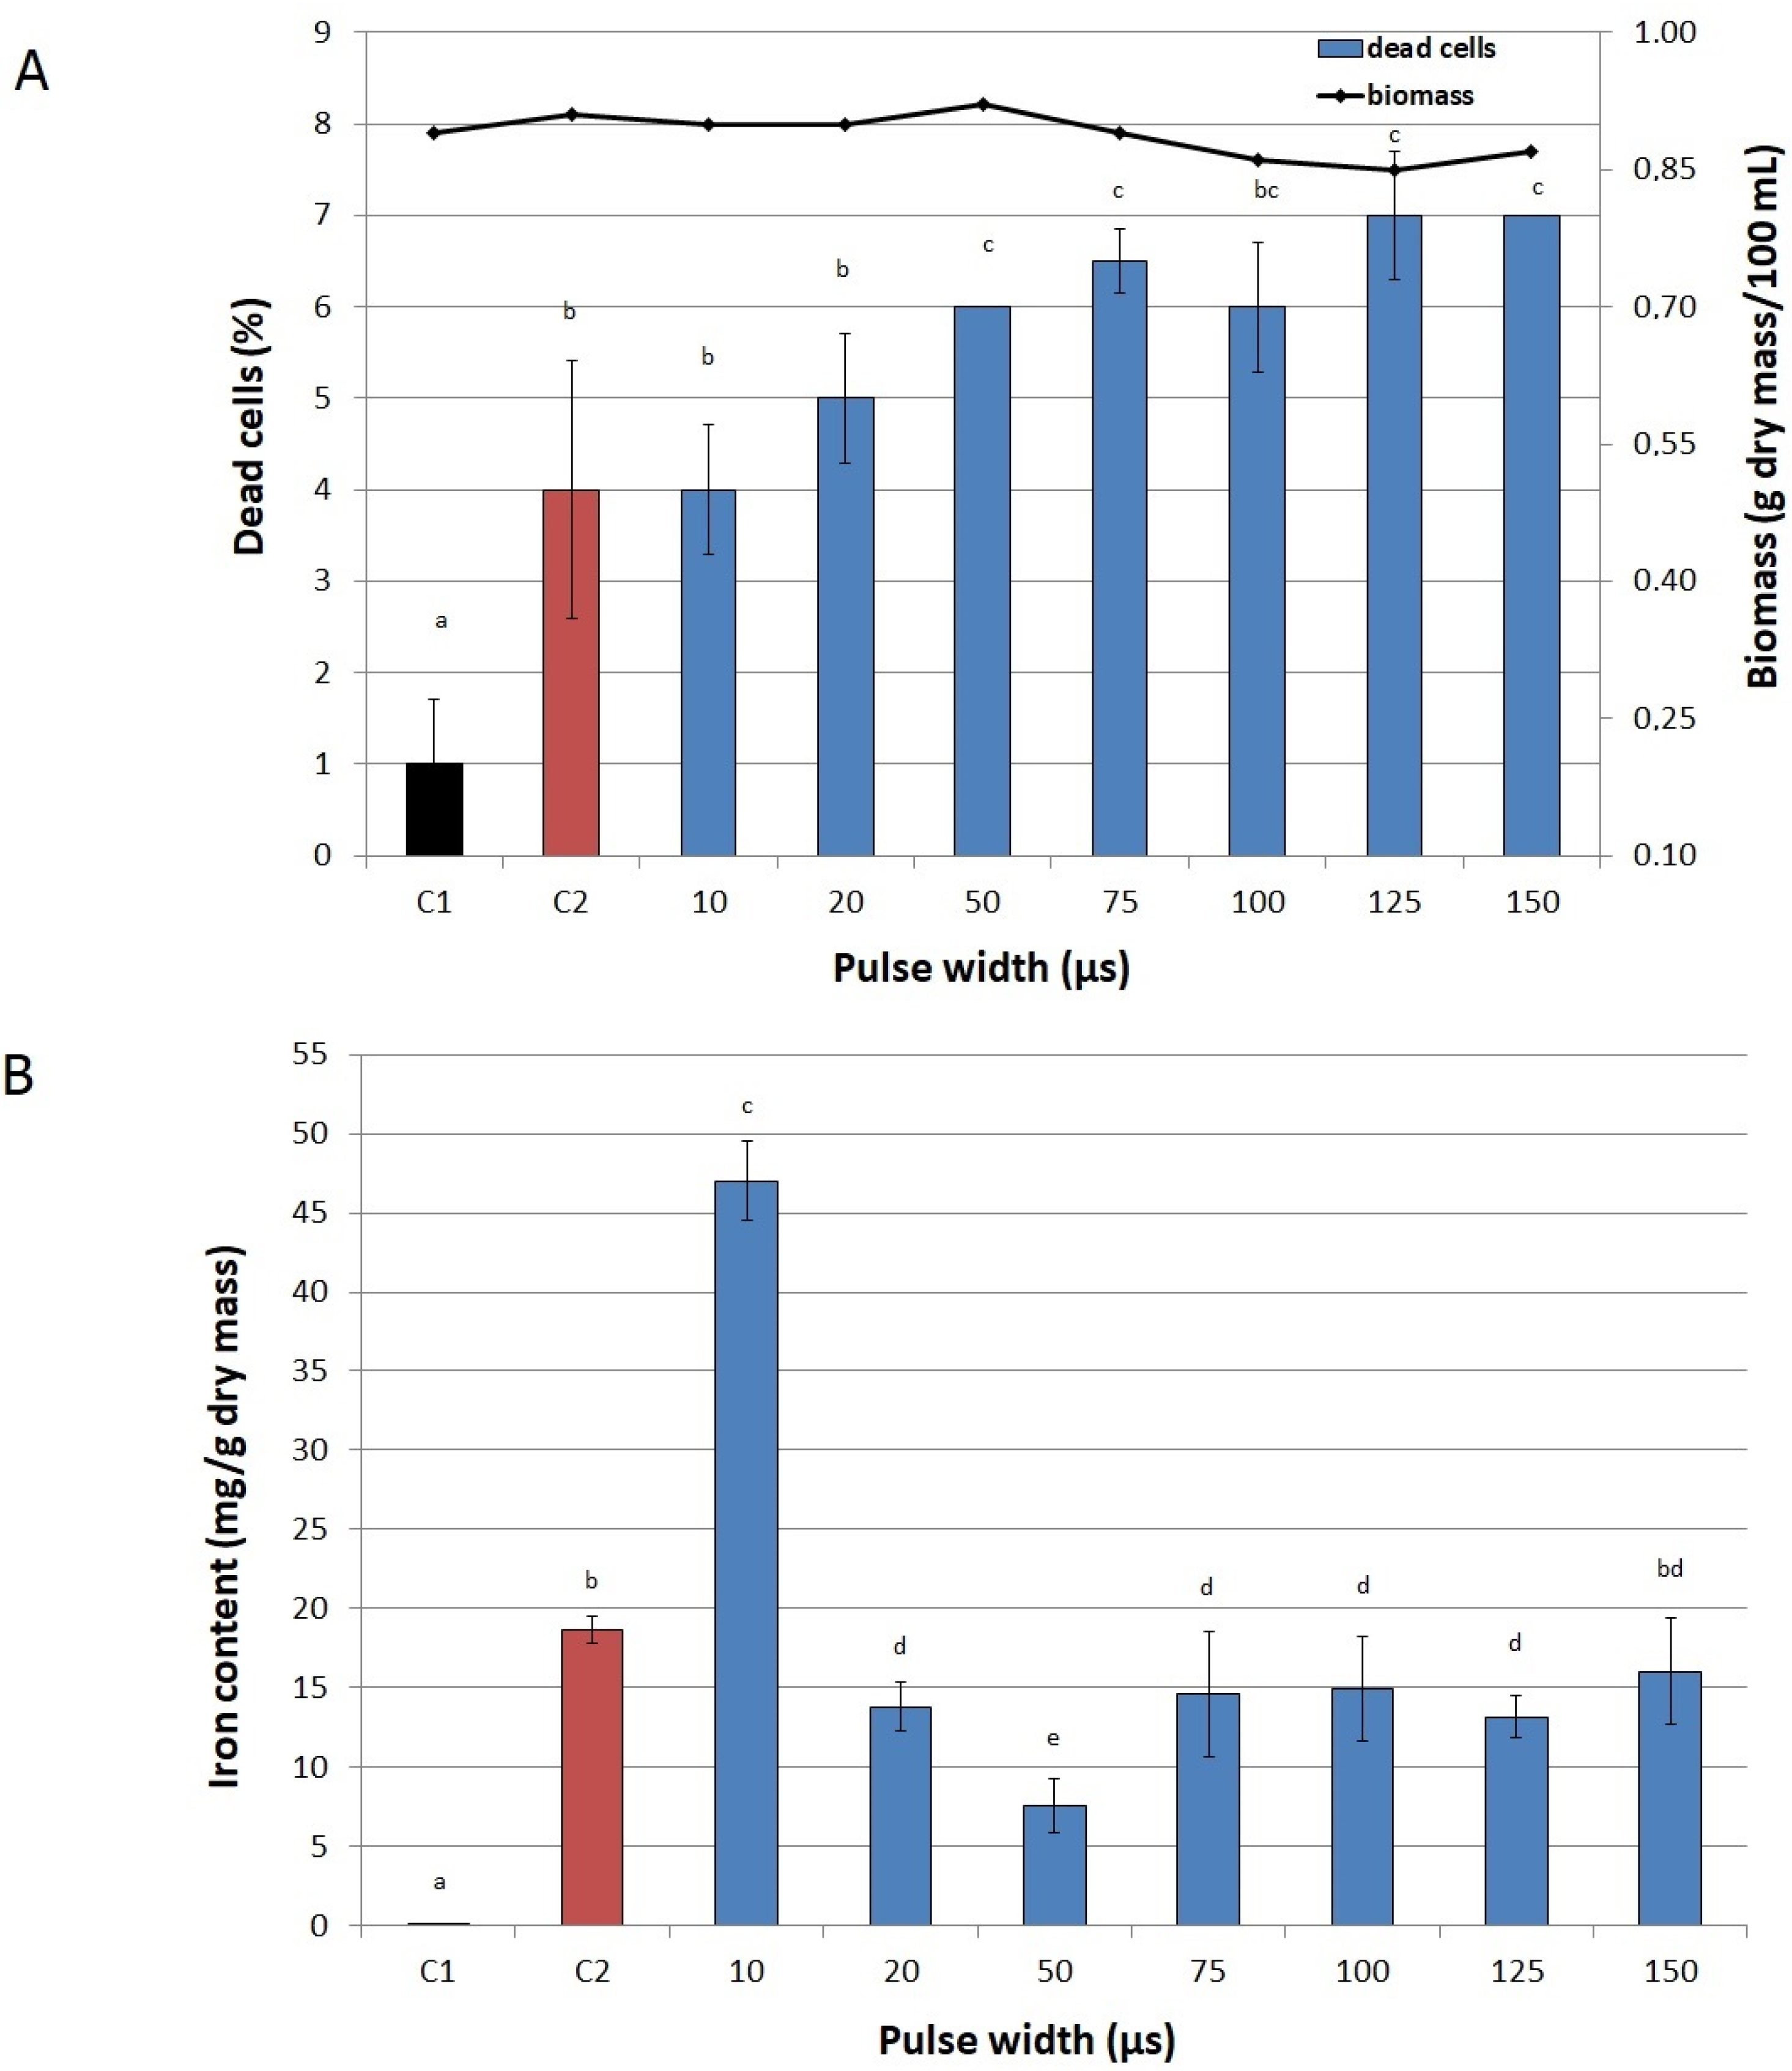
3.6.3. Pulse Width
3.6.4. Treatment Time
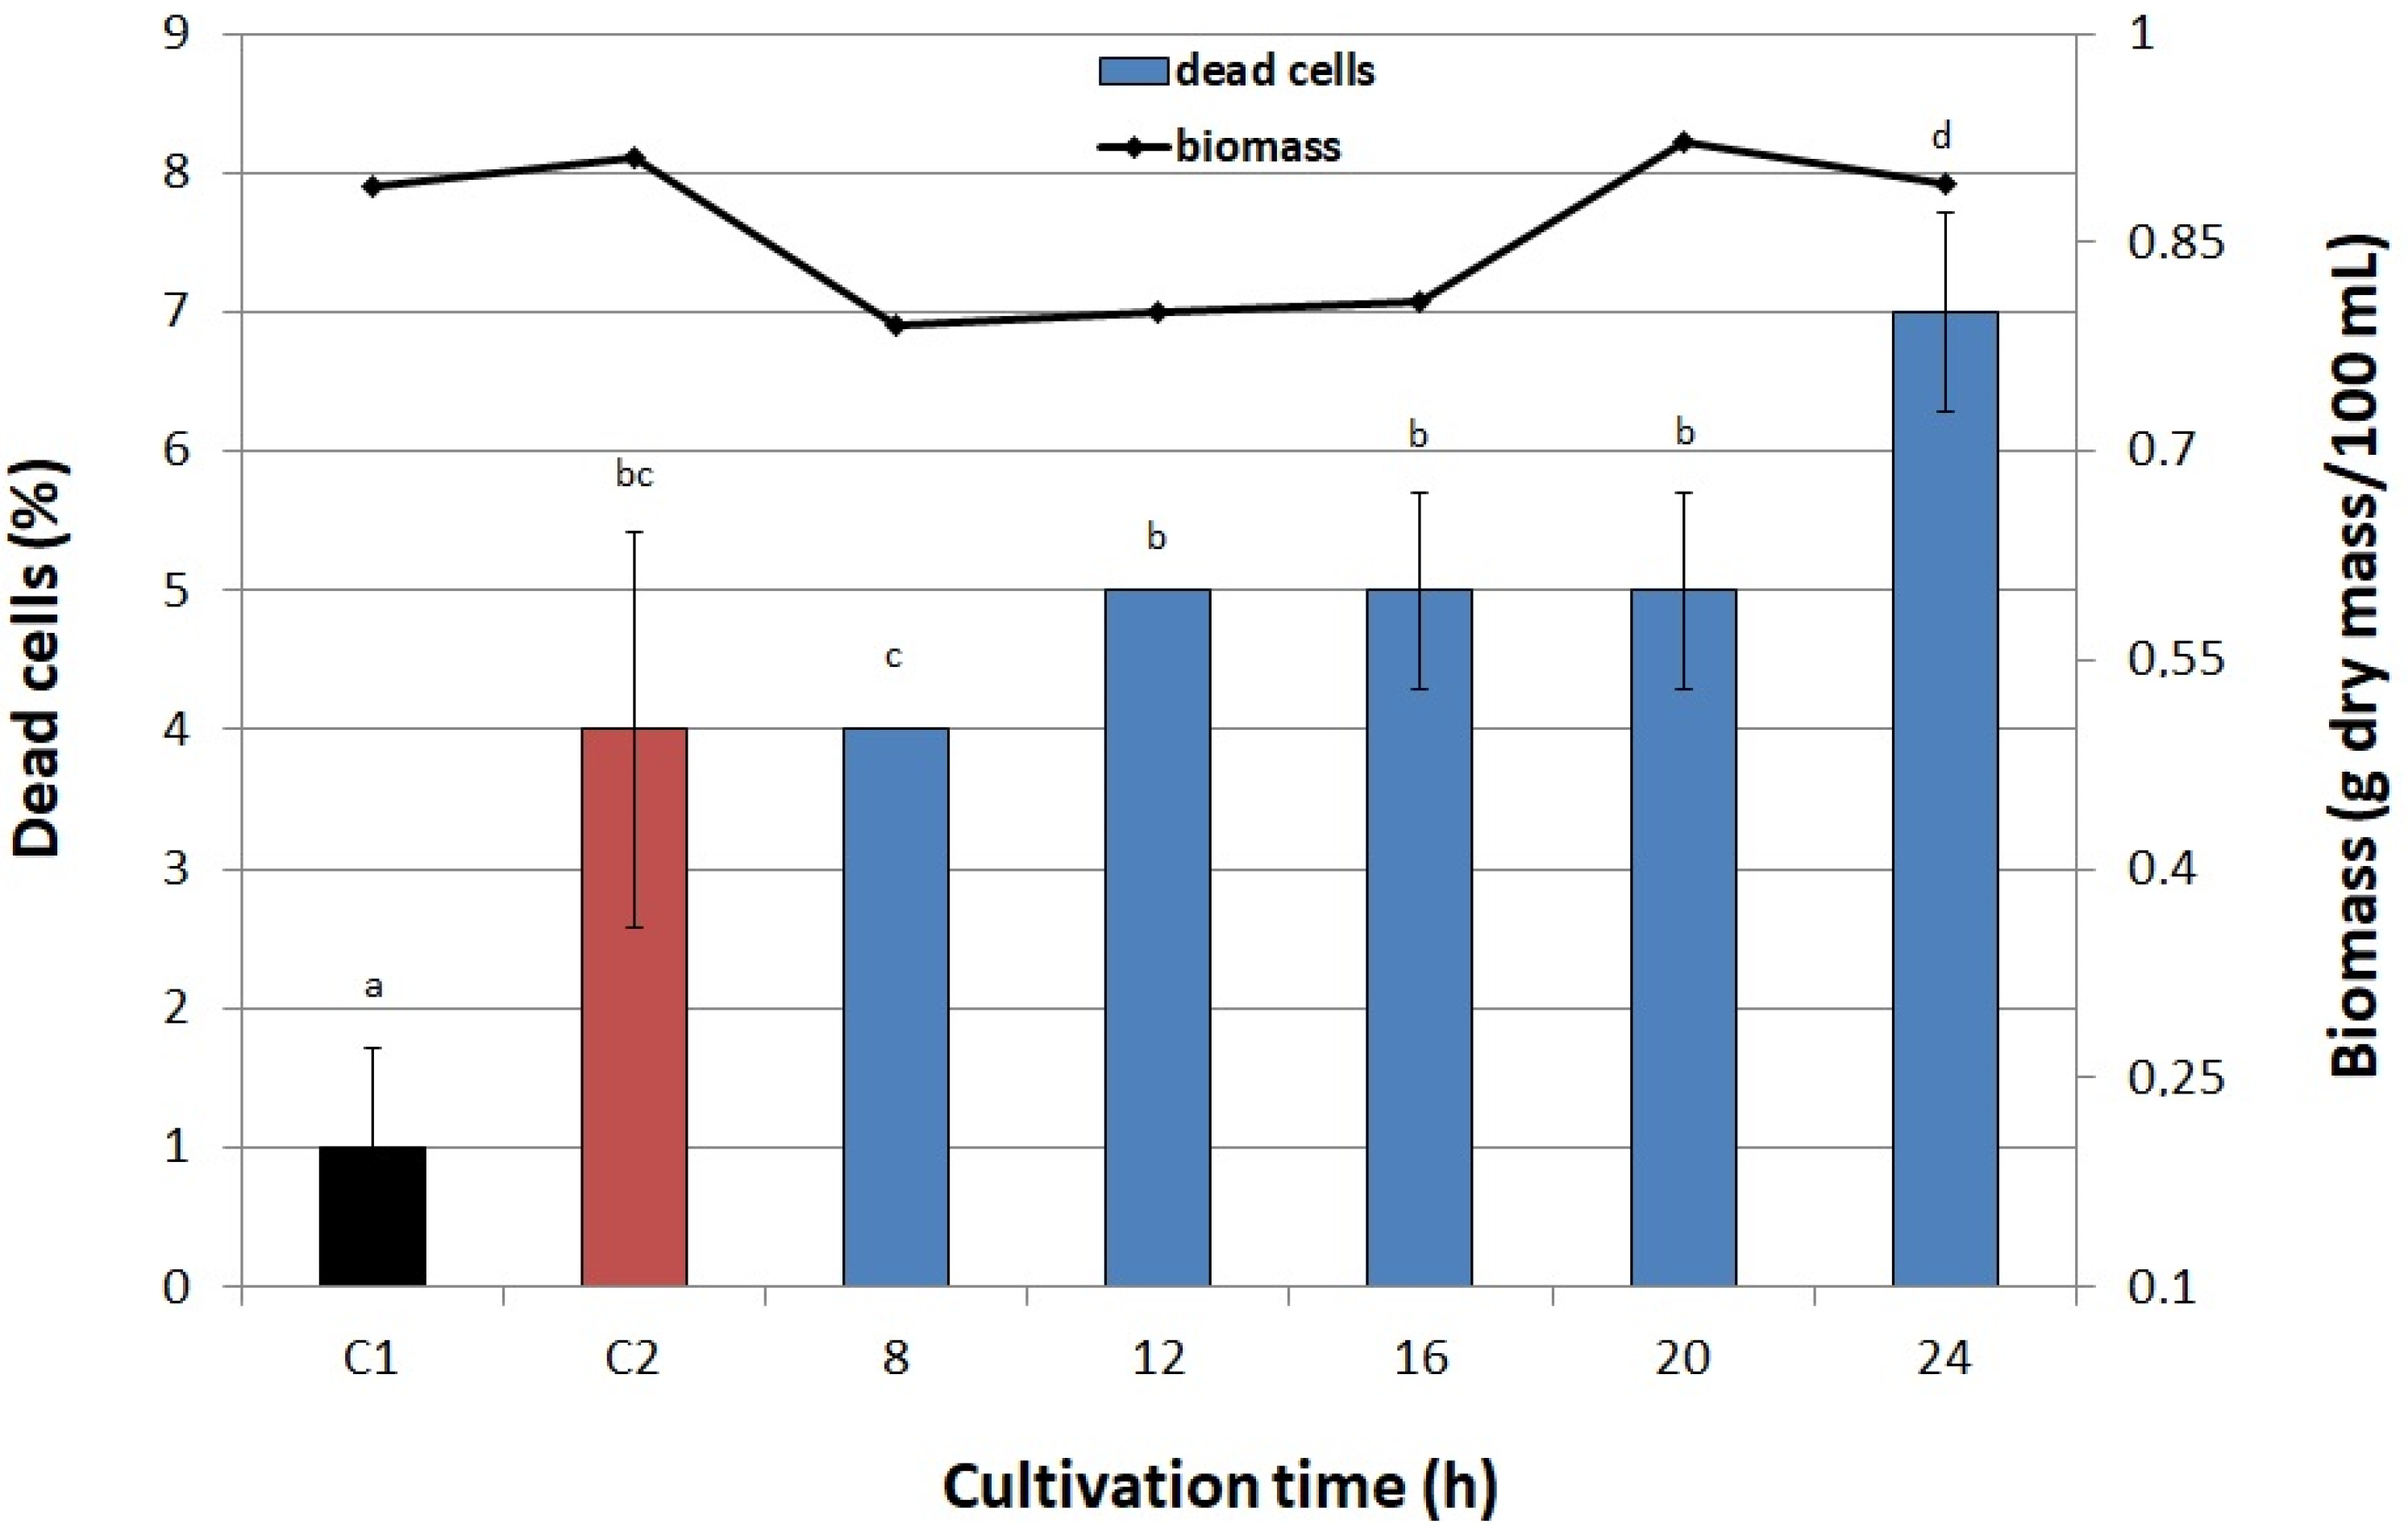
3.6.5. Cultivation Time
3.7. Determination of Iron Concentration
3.8. Determination of Yeast Biomass and Cell Viability
3.9. Determination of Fermentative Properties and Protein Content in Yeast Cells
3.10. Fluorescent Microscopy
3.11. Attenuated Total Reflectance-Fourier Transform Infrared Spectroscopy
3.12. Data Analysis
4. Conclusions
Supplementary Materials
Author Contributions
Funding
Institutional Review Board Statement
Informed Consent Statement
Data Availability Statement
Acknowledgments
Conflicts of Interest
References
- Lopez, A.; Cacoub, P.; Macdougall, I.C.; Peyrin-Biroulet, L. Iron deficiency anaemia. Lancet 2016, 387, 907–916. [Google Scholar] [CrossRef]
- Camaschella, C. Iron-deficiency anemia. N. Engl. J. Med. 2015, 372, 1832–1843. [Google Scholar] [CrossRef]
- Hentze, M.; Muckenthaler, M.; Galy, B.; Camaschella, C. Two to tango: Regulation of mammalian iron metabolism. Cell 2010, 142, 24–38. [Google Scholar] [CrossRef] [PubMed]
- Melenovsky, V.; Petrak, J.; Mracek, T.; Benes, J.; Borlaug, B.; Nuskova, H.; Kautzner, J. Myocardial iron content and mitochondrial function in human heart failure: A direct tissue analysis. Eur. J. Heart Fail. 2017, 19, 522–530. [Google Scholar] [CrossRef]
- Cappellini, M.; Musallam, K.; Taher, A. Iron deficiency anaemia revisited. J. Intern. Med. 2020, 287, 153–170. [Google Scholar] [CrossRef]
- Bager, P. Fatigue and acute/chronic anaemia. Dan. Med. J. 2014, 61, 4824. [Google Scholar]
- Cook, J. Diagnosis and management of iron-deficiency anaemia. Best Pract. Res. Clin. Haematol. 2005, 18, 319–332. [Google Scholar] [CrossRef]
- Zimmermann, M.; Hurrell, R. Nutritional iron deficiency. Lancet 2007, 370, 511–520. [Google Scholar] [CrossRef]
- Hurrell, R. How to ensure adequate iron absorption from iron-fortified food. Nutr. Rev. 2002, 60, 7–15. [Google Scholar] [CrossRef]
- Bishop, J.; Nelson, G.; Lamb, J. Microencapsulation in yeast cells. J. Microencapsul. 1998, 15, 761–773. [Google Scholar] [CrossRef] [PubMed]
- Pankiewicz, U.; Jamroz, J. Effect of pulsed electric fields upon accumulation of magnesium in Saccharomyces cerevisiae. Eur. Food Res. Technol. 2010, 231, 663–668. [Google Scholar] [CrossRef]
- Pankiewicz, U.; Sujka, M.; Włodarczyk-Stasiak, M.; Mazurek, A.; Jamroz, J. Effect of pulse electric fields (PEF) on accumulation of magnesium and zinc ions in Saccharomyces cerevisiae cells. Food Chem. 2014, 157, 125–131. [Google Scholar] [CrossRef] [PubMed]
- Pankiewicz, U.; Sujka, M.; Jamroz, J. Bioaccumulation of the selected metal ions in Saccharomyces cerevisiae cells under treatment of the culture with pulsed electric field (PEF). J. Membr. Biol. 2015, 248, 943–949. [Google Scholar] [CrossRef] [PubMed]
- Pankiewicz, U.; Sujka, M.; Kowalski, R.; Mazurek, A.; Włodarczyk-Stasiak, M.; Jamroz, J. Effect of pulsed electric fields (PEF) on accumulation of selenium and zinc ions in Saccharomyces cerevisiae cells. Food Chem. 2017, 221, 1361–1370. [Google Scholar] [CrossRef] [PubMed]
- Kyyaly, M.; Powell, C.; Ramadan, E. Preparation of iron-enriched baker’s yeast and its efficiency in recovery of rats from dietary iron deficiency. Nutrition 2015, 31, 1155–1164. [Google Scholar] [CrossRef]
- Nelson, G.; Duckham, S.; Crothers, M. Microencapsulation in yeast cells and applications in drug delivery. In Polymeric Drug Delivery I: Particulate Drug Carriers; Svenson, S., Ed.; ACS Publications: Washington, DC, USA, 2006; Volume 923, pp. 268–281. [Google Scholar]
- Walker, G. Metals in yeast fermentation processes. Adv. Appl. Microbiol. 2004, 54, 197–229. [Google Scholar] [PubMed]
- Shumate, S.; Strandberg, G. Accumulation of metals by microbial cells. In Comprehensive Biotechnology; Mooyoung, M., Ed.; Pergamon Press: Oxford, UK, 1985; Volume 4, pp. 235–246. [Google Scholar]
- Aronsson, K.; Lindgren, M.; Johansson, B.; Rönner, U. Inactivation of microorganisms using pulsed electric fields: The influence of process parameters on Escherichia coli, Listeria innocua, Leuconostoc mesenteroides and Saccharomyces cerevisiae. Innov. Food Sci. Emerg. Technol. 2001, 2, 41–54. [Google Scholar] [CrossRef]
- Nowosad, K.; Sujka, M.; Pankiewicz, U.; Kowalski, R. The application of PEF technology in food processing and human nutrition. J. Food Sci. Technol. 2020, 58, 397–411. [Google Scholar] [CrossRef]
- Frewer, L.; Bergmann, K.; Brennan, M.; Lion, R.; Meertens, R.; Rowe, G.; Siegrist, M.; Vereijken, C. Consumer response to novel agri-food technologies: Implications for predicting consumer acceptance of emerging food technologies. Trends Food Sci. Technol. 2011, 22, 442–456. [Google Scholar] [CrossRef]
- Pankiewicz, U.; Jamroz, J. The effect of pulse electric field on accumulation of selenium in cells of Saccharomyces cerevisiae. J. Microbiol. Biotechnol. 2007, 17, 1139–1146. [Google Scholar]
- Pankiewicz, U.; Jamroz, J. Effect of pulsed electric fields upon accumulation of zinc in Saccharomyces cerevisiae. J. Microbiol. Biotechnol. 2011, 21, 646–651. [Google Scholar] [CrossRef]
- Zachariadis, G.; Raidou, E.; Themelis, D.; Stratis, J. Determination of mineral content of active dry yeast used in pharmaceutical formulations. J. Pharm. Biomed. Anal. 2002, 28, 463–473. [Google Scholar] [CrossRef]
- Philpot, C.; Protchenko, O. Response to iron deprivation in Saccharomyces cerevisiae. Eukaryot. Cell 2008, 7, 20–27. [Google Scholar] [CrossRef] [PubMed]
- Nielsen, M.; Arneborg, N. The effect of citric acid and pH on growth and metabolism of anaerobic Saccharomyces cerevisiae and Zygosaccharomyces bailii cultures. Food Microbiol. 2007, 24, 101–105. [Google Scholar] [CrossRef] [PubMed]
- Chen, O.; Hemenway, S.; Kaplan, J. Genetic analysis of iron citratetoxicity in yeast: Implication for mammalian iron homeostasis. Proc. Natl. Acad. Sci. USA 2002, 99, 16922–16927. [Google Scholar] [CrossRef] [PubMed]
- Paš, M.; Piškur, B.; Šuštarič, M.; Raspor, P. Iron enriched yeast biomass–A promising mineral feed supplement. Bioresour. Technol. 2007, 98, 1622–1628. [Google Scholar] [CrossRef] [PubMed]
- Martínez-Pastor, M.; Perea-García, A.; Puig, S. Mechanisms of iron sensing and regulation in the yeast Saccharomyces cerevisiae. World J. Microbiol. Biotechnol. 2017, 33, 75. [Google Scholar] [CrossRef]
- Gaensly, F.; Picheth, G.; Brand, D.; Bonfim, T. The uptake of different iron salts by the yeast Saccharomyces cerevisiae. Braz. J. Microbiol. 2014, 45, 491–494. [Google Scholar] [CrossRef]
- Stirke, A.; Zimkus, A.; Ramanaviciene, A.; Balevicius, S.; Zurauskiene, N.; Saulis, G.; Ramanavicius, A. Electric field-induced effects on yeast cell wall permeabilization. Bioelectromagnetics 2014, 35, 136–144. [Google Scholar] [CrossRef]
- Raso, J.; Frey, W.; Ferrari, G.; Pataro, G.; Knorr, D.; Teissie, J.; Miklavčič, D. Recommendations guidelines on the key information to be reported in studies of application of PEF technology in food and biotechnological processes. Innov. Food Sci. Emerg. Technol. 2016, 37, 312–321. [Google Scholar] [CrossRef]
- Stirke, A.; Celiesiute-Germaniene, R.; Zimkus, A. The link between yeast cell wall porosity and plasma membrane permeability after PEF treatment. Sci. Rep. 2019, 9, 14731. [Google Scholar] [CrossRef] [PubMed]
- Hanna, H.; Denzi, A.; Liberti, M. Electropermeabilization of Inner and Outer Cell Membranes with Microsecond Pulsed Electric Fields: Quantitative Study with Calcium Ions. Sci. Rep. 2017, 7, 13079. [Google Scholar] [CrossRef]
- Stehlik-Thomas, V.; Grba, S.; Stanzer, D.; Vahčić, N.; Gulan Zetić, V. Uptake of iron by yeast cells and its impact on biomass production. Acta Aliment. 2003, 32, 279–287. [Google Scholar] [CrossRef]
- Wang, Z.; Zhang, J.; Su, T.; Guan, Z.; Ji, M. Screening of iron-and zinc-enriched yeast strain and optimization of cultivation conditions. Prep. Biochem. Biotechnol. 2011, 41, 278–286. [Google Scholar] [CrossRef]
- Sahoo, S.; Crisponi, G. Recent Advances on Iron (III) Selective Fluorescent Probes with Possible Applications in Bioimaging. Molecules 2019, 24, 3267. [Google Scholar] [CrossRef] [PubMed]
- Du, Y.; Chen, M.; Zhang, Y.; Luo, F.; He, C.; Li, M.; Chen, X. Determination of iron (III) based on the fluorescence quenching of rhodamine B derivative. Talanta 2013, 106, 261–265. [Google Scholar] [CrossRef] [PubMed]
- Pankiewicz, U.; Jamroz, J.; Sujka, M.; Kowalski, R. Visualization of calcium and zinc ions in Saccharomyces cerevisiae cells treated with PEFs (pulse electric fields) by laser confocal microscopy. Food Chem. 2015, 188, 16–23. [Google Scholar]
- Mihoubi, W.; Sahli, E.; Gargouri, A.; Amiel, C. FTIR spectroscopy of whole cells for the monitoring of yeast apoptosis mediated by p53 over-expression and its suppression by Nigella sativa extracts. PLoS ONE 2017, 12, e0180680. [Google Scholar] [CrossRef] [PubMed]
- Burattini, E.; Cavagna, M.; Dell’Anna, R.; Malvezzi Campeggi, F.; Monti, F.; Rossi, F.; Torriani, S. A FTIR microspectroscopy study of autolysis in cells of the wine yeast Saccharomyces cerevisiae. Vib. Spectrosc. 2008, 47, 139–147. [Google Scholar] [CrossRef]
- Cavagna, M.; Dell’Anna, R.; Monti, F.; Rossi, F.; Torriani, S. Use of ATR-FTIR microspectroscopy to monitor autolysis of Saccharomyces cerevisiae cells in a base wine. J. Agric. Food Chem. 2010, 58, 39–45. [Google Scholar] [CrossRef]
- Câmara Jr, A.; Nguyen, T.D.; Saurel, R.; Sandt, C.; Peltier, C.; Dujourdy, L.; Husson, F. Biophysical stress responses of the yeast Lachancea thermotolerans during dehydration using synchrotron-FTIR microspectroscopy. Front. Microbiol. 2020, 11, 899. [Google Scholar] [CrossRef]
- Nguyen, T.; Guyot, S.; Pénicaud, C.; Passot, S.; Sandt, C.; Fonseca, F.; Saurel, R.; Husson, F. Highlighting protective effect of encapsulation on yeast cell response to dehydration using synchrotron infrared microspectroscopy at the single-cell level. Front. Microbiol. 2020, 11, 1887. [Google Scholar] [CrossRef] [PubMed]
- Goormaghtigh, E.; Ruysschaert, J.; Raussens, V. Evaluation of the information content in infrared spectra for protein secondary structure determination. Biophys. J. 2006, 90, 2946–2957. [Google Scholar] [CrossRef]
- Susi, H.; Byler, D. Resolution-enhanced flourier transform infrared spectroscopy of enzymes. Meth. Enzymol. 1986, 130, 290–311. [Google Scholar]
- Los, D.A.; Murata, N. Membrane fluidity and its roles in the perception of environmental signals. Biochim. Biophys. Acta Biomembr. 2004, 1666, 142–157. [Google Scholar] [CrossRef]
- Ganeva, V.; Galutzov, B.; Teissie, J. Evidence that pulsed electric field treatment enhances the cell wall porosity of yeast cells ppl. Biochem. Biotechnol. 2014, 172, 1540–1552. [Google Scholar] [CrossRef]
- Nguyen, T.; Fleet, G.; Rogers, P. Composition of the cell walls of several yeast species. Appl. Microbiol. Biotechnol. 1998, 50, 206–212. [Google Scholar] [CrossRef] [PubMed]
- Zinicovscaia, I.; Grozdov, D.; Yushin, N.; Abdusamadzoda, D.; Gundorina, S.; Rodlovskaya, E.; Kristavchuk, O. Metal removal from chromium containing synthetic effluents by Saccharomyces cerevisiae. Desalination Water Treat. 2020, 178, 254–270. [Google Scholar] [CrossRef]
- Barnett, J.A.; Payne, R.W.; Yarrow, D. Yeasts: Characteristics and Identification; Cambridge University Press: Cambridge, UK, 1990. [Google Scholar]
- Zhang, Y.; Rump, S.; Gladyshev, V.N. Comparative genomics and evolution of molybdenum utilization. Coord. Chem. Rev. 2011, 255, 1206–1217. [Google Scholar] [CrossRef] [PubMed]
- Święciło, A. Effect of sodium nitrate (V) on Saccharomyces cerevisiae strains of different antioxidative status and energetic metabolism. Pol. J. Food Nutr. Sci. 2008, 8, 41–44. [Google Scholar]
- Martínez-Garay, C.; de Llanos, R.; Romero, A.; Martínez-Pastor, M.; Puig, S. Responses of Saccharomyces cerevisiae strains from different origins to elevated iron concentrations. Appl. Environ. Microbiol. 2016, 82, 1906–1916. [Google Scholar] [CrossRef] [PubMed]
- Cabiscol, E.; Piulats, E.; Echave, P.; Herrero, E.; Ros, J. Oxidative stress promotes specific protein damage in Saccharomyces cerevisiae. J. Biol. Chem. 2000, 275, 27393–27398. [Google Scholar] [CrossRef]
- Borzani, W. Measurement of the gassing power of bakers’ yeast: Correlation between the dough volume and the incubation time. Braz. Arch. Biol. Technol. 2004, 47, 213–217. [Google Scholar] [CrossRef]
- Sceni, P.; Palazolo, G.; del Carmen Vasallo, M.; Puppo, M.; Otero, M.A.; Wagner, J. Thermal and surface behavior of yeast protein fractions from Saccharomyces cerevisiae. LWT 2009, 42, 1098–1106. [Google Scholar] [CrossRef]


| Wavenumber (cm−1) | Assignment of the Type of Vibrations | ||
|---|---|---|---|
| C1 | C2 | Fe + PEF | |
| 2962 | 2958 | 2960 | νas(CH3) of lipids |
| 2925 | 2925 | 2926 | νas(CH2) of lipids |
| 2851 | 2856 * | 2856 * | νs(CH2) of lipids |
| 1653 | 1654 | 1655 | 80% ν(C=O), 20% ν(C–N) of amide I, τ(HOH) of water |
| 1635 | 1635 | 1637 | |
| 1540 | 1543 * | 1543 * | 60% τ(N–H), 30% ν(C–N), 10% ν(C–C) of amide II |
| 1152 | 1152 | 1150 | ν(C–O) of carbohydrates (mannans and β-1,3 glucans) |
| 1080 | 1078 | 1078 | νas(PO2−) of membrane lipids, carbohydrates |
| 1043 | 1047 * | 1047 * | νs(PO2−), mannans |
| 1030 | 1025 * | 1025 * | β-1,4 glucans |
| 991 | 993 * | 995 * | β-1,6 glucans |
| Sample | Protein Content (%) | Iron Content (mg/g Dry Mass) |
|---|---|---|
| C1 | 59.13 ± 0.18 a | 0.13 ± 0.01 a |
| C2 | 58.24 ± 0.35 b | 18.68 ± 0.86 b |
| Fe + PEF | 54.07 ± 0.11 c | 48.01 ± 0.88 c |
| Medium for Inoculum Growth | Concentration (g/L) |
|---|---|
| Sucrose (POCH, Gliwice, Poland) | 20 |
| NH4Cl (POCH, Gliwice, Poland) | 3.2 |
| KH2PO4 (POCH, Gliwice, Poland) | 2.5 |
| Na2SO4 (POCH, Gliwice, Poland) | 2.0 |
| MgCl2•6H2O (POCH, Gliwice, Poland) | 1.5 |
| Yeast extract (BTL, Łódź, Poland) | 5.0 |
| Agar (DIFCO, Detroit, MI, USA) | 15.0 |
| Unhopped wort (Lublin Breweries S.A., Lublin, Poland) | 40 mL |
| Experimental medium | |
| Peptone (Sigma–Aldrich CO, St. Louis, MO, USA) | 10.0 |
| Yeast extract (BTL, Łódź, Poland) | 5.0 |
| Glucose (POCH, Gliwice, Poland) | 10.0 |
Publisher’s Note: MDPI stays neutral with regard to jurisdictional claims in published maps and institutional affiliations. |
© 2021 by the authors. Licensee MDPI, Basel, Switzerland. This article is an open access article distributed under the terms and conditions of the Creative Commons Attribution (CC BY) license (https://creativecommons.org/licenses/by/4.0/).
Share and Cite
Nowosad, K.; Sujka, M.; Pankiewicz, U.; Miklavčič, D.; Arczewska, M. Pulsed Electric Field (PEF) Enhances Iron Uptake by the Yeast Saccharomyces cerevisiae. Biomolecules 2021, 11, 850. https://doi.org/10.3390/biom11060850
Nowosad K, Sujka M, Pankiewicz U, Miklavčič D, Arczewska M. Pulsed Electric Field (PEF) Enhances Iron Uptake by the Yeast Saccharomyces cerevisiae. Biomolecules. 2021; 11(6):850. https://doi.org/10.3390/biom11060850
Chicago/Turabian StyleNowosad, Karolina, Monika Sujka, Urszula Pankiewicz, Damijan Miklavčič, and Marta Arczewska. 2021. "Pulsed Electric Field (PEF) Enhances Iron Uptake by the Yeast Saccharomyces cerevisiae" Biomolecules 11, no. 6: 850. https://doi.org/10.3390/biom11060850
APA StyleNowosad, K., Sujka, M., Pankiewicz, U., Miklavčič, D., & Arczewska, M. (2021). Pulsed Electric Field (PEF) Enhances Iron Uptake by the Yeast Saccharomyces cerevisiae. Biomolecules, 11(6), 850. https://doi.org/10.3390/biom11060850