
DEER Analysis of GPCR Conformational Heterogeneity


Abstract
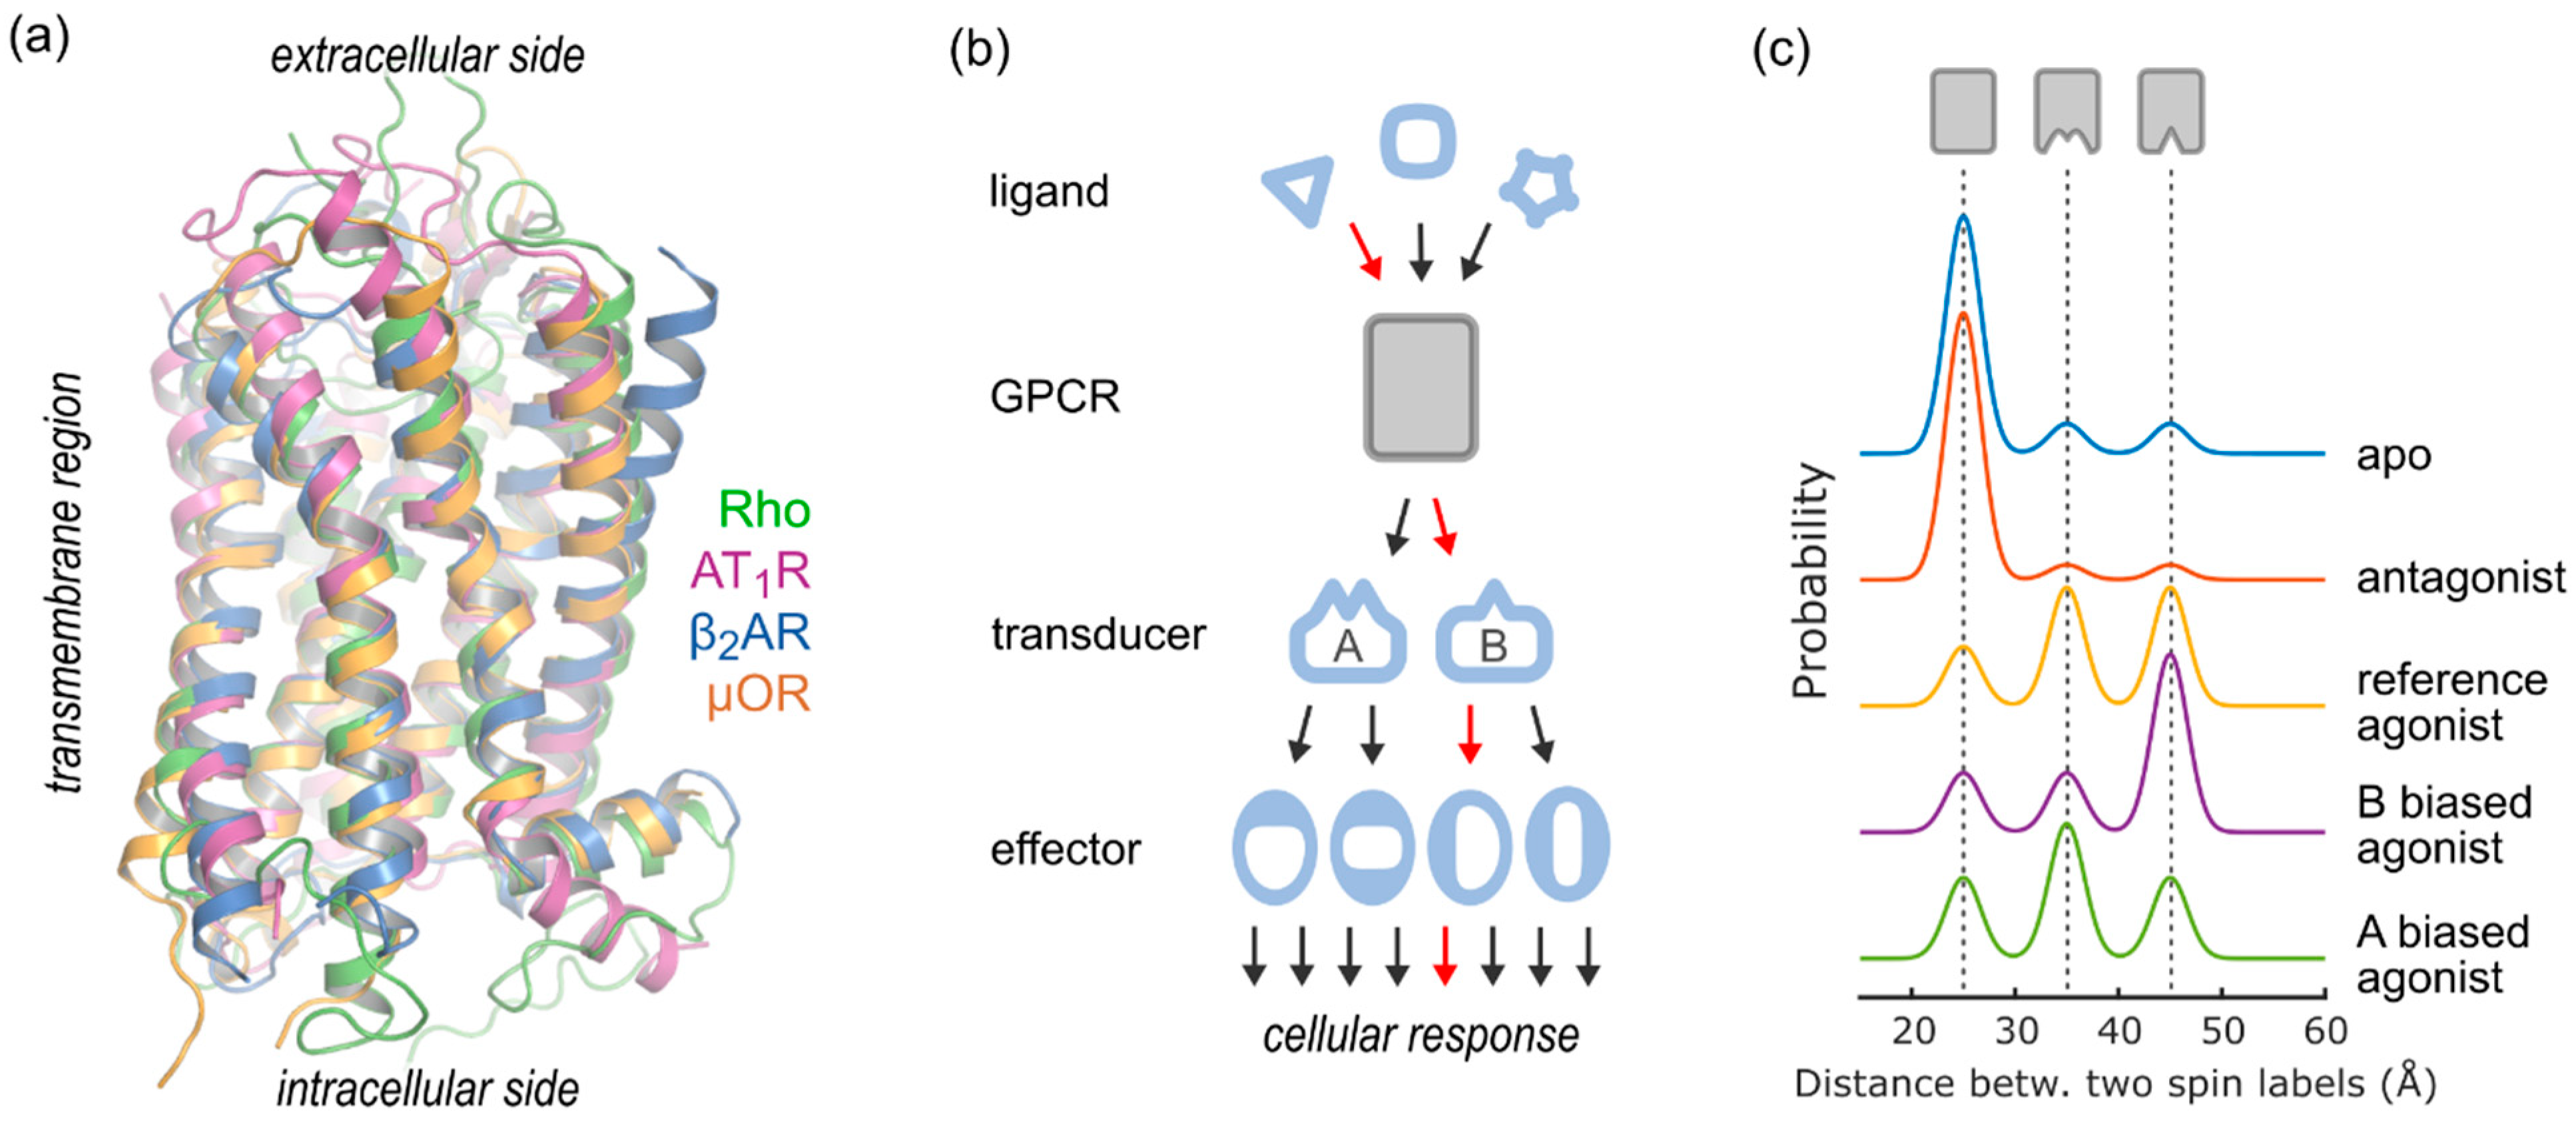
1. Introduction
2. DEER Analysis of GPCR Structure and Conformational Equilibria
2.1. Structural Changes during GPCR Activation
2.1.1. Transmembrane Helix 6
2.1.2. Transmembrane Helix 5
2.1.3. Transmembrane Helix 7
2.1.4. Helix 8
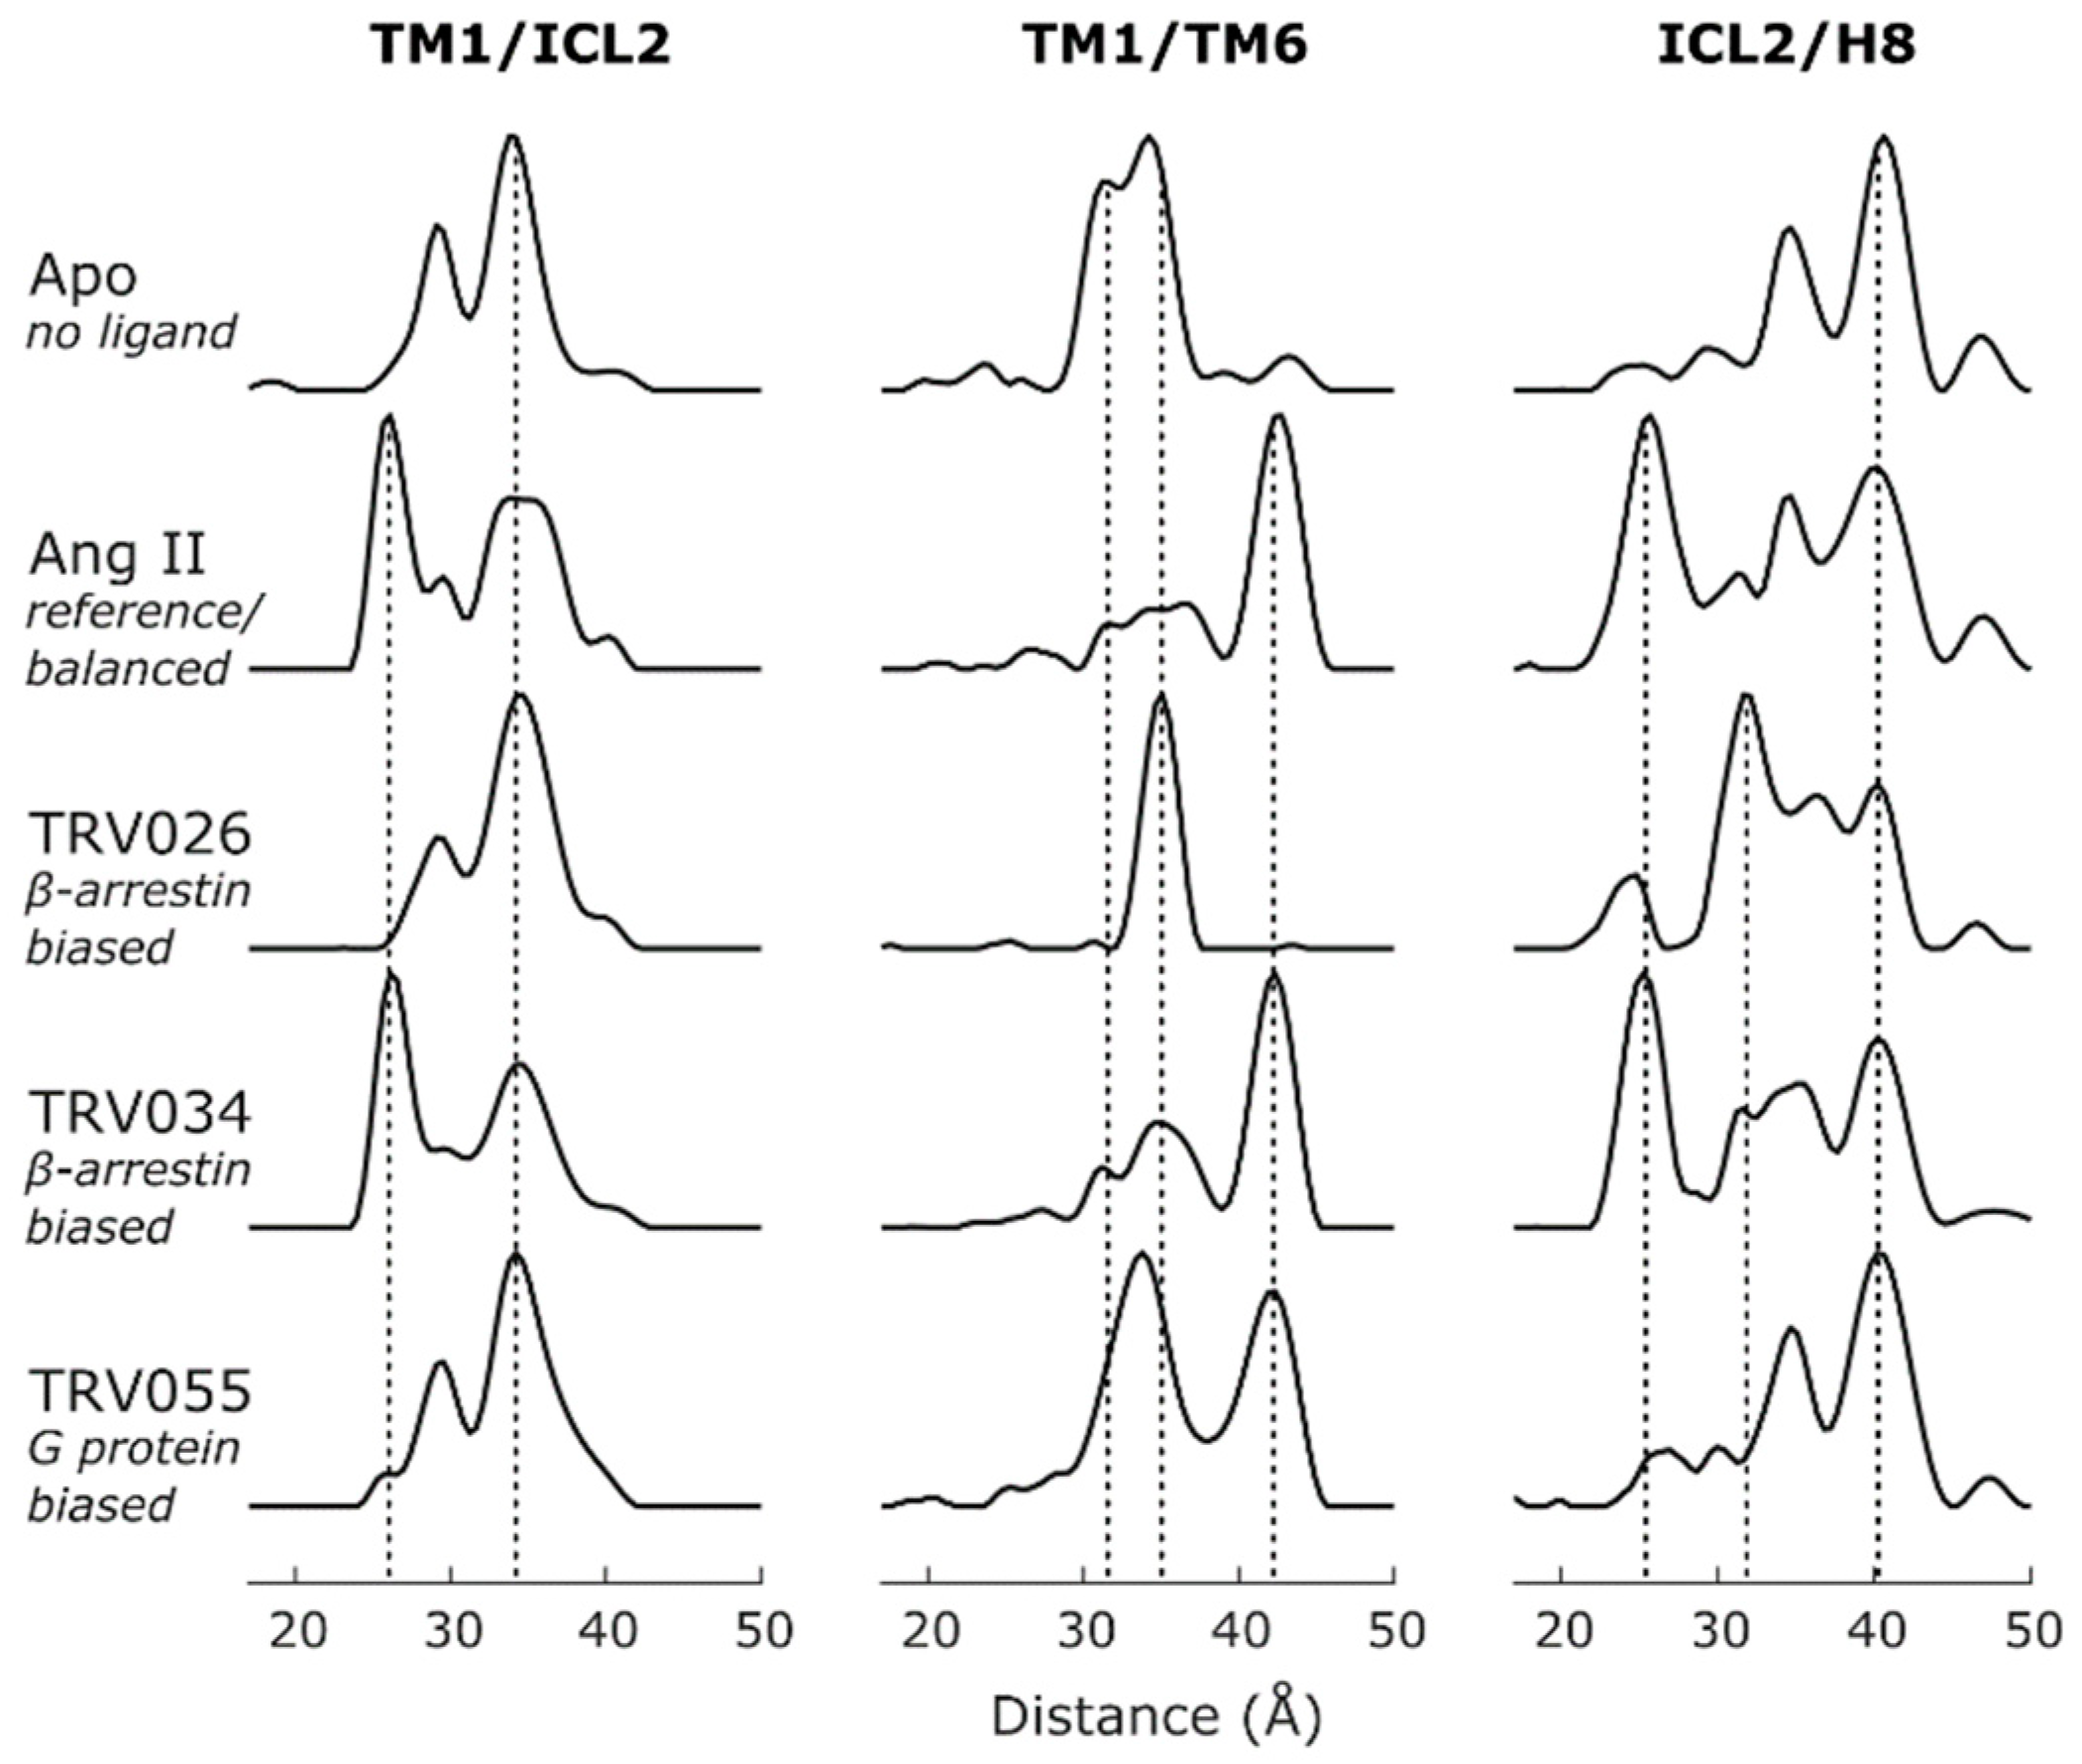
2.1.5. Intracellular Loop 3
2.1.6. Intracellular Loop 2
2.1.7. GPCR/Transducer Complex
2.1.8. GPCR Dimers
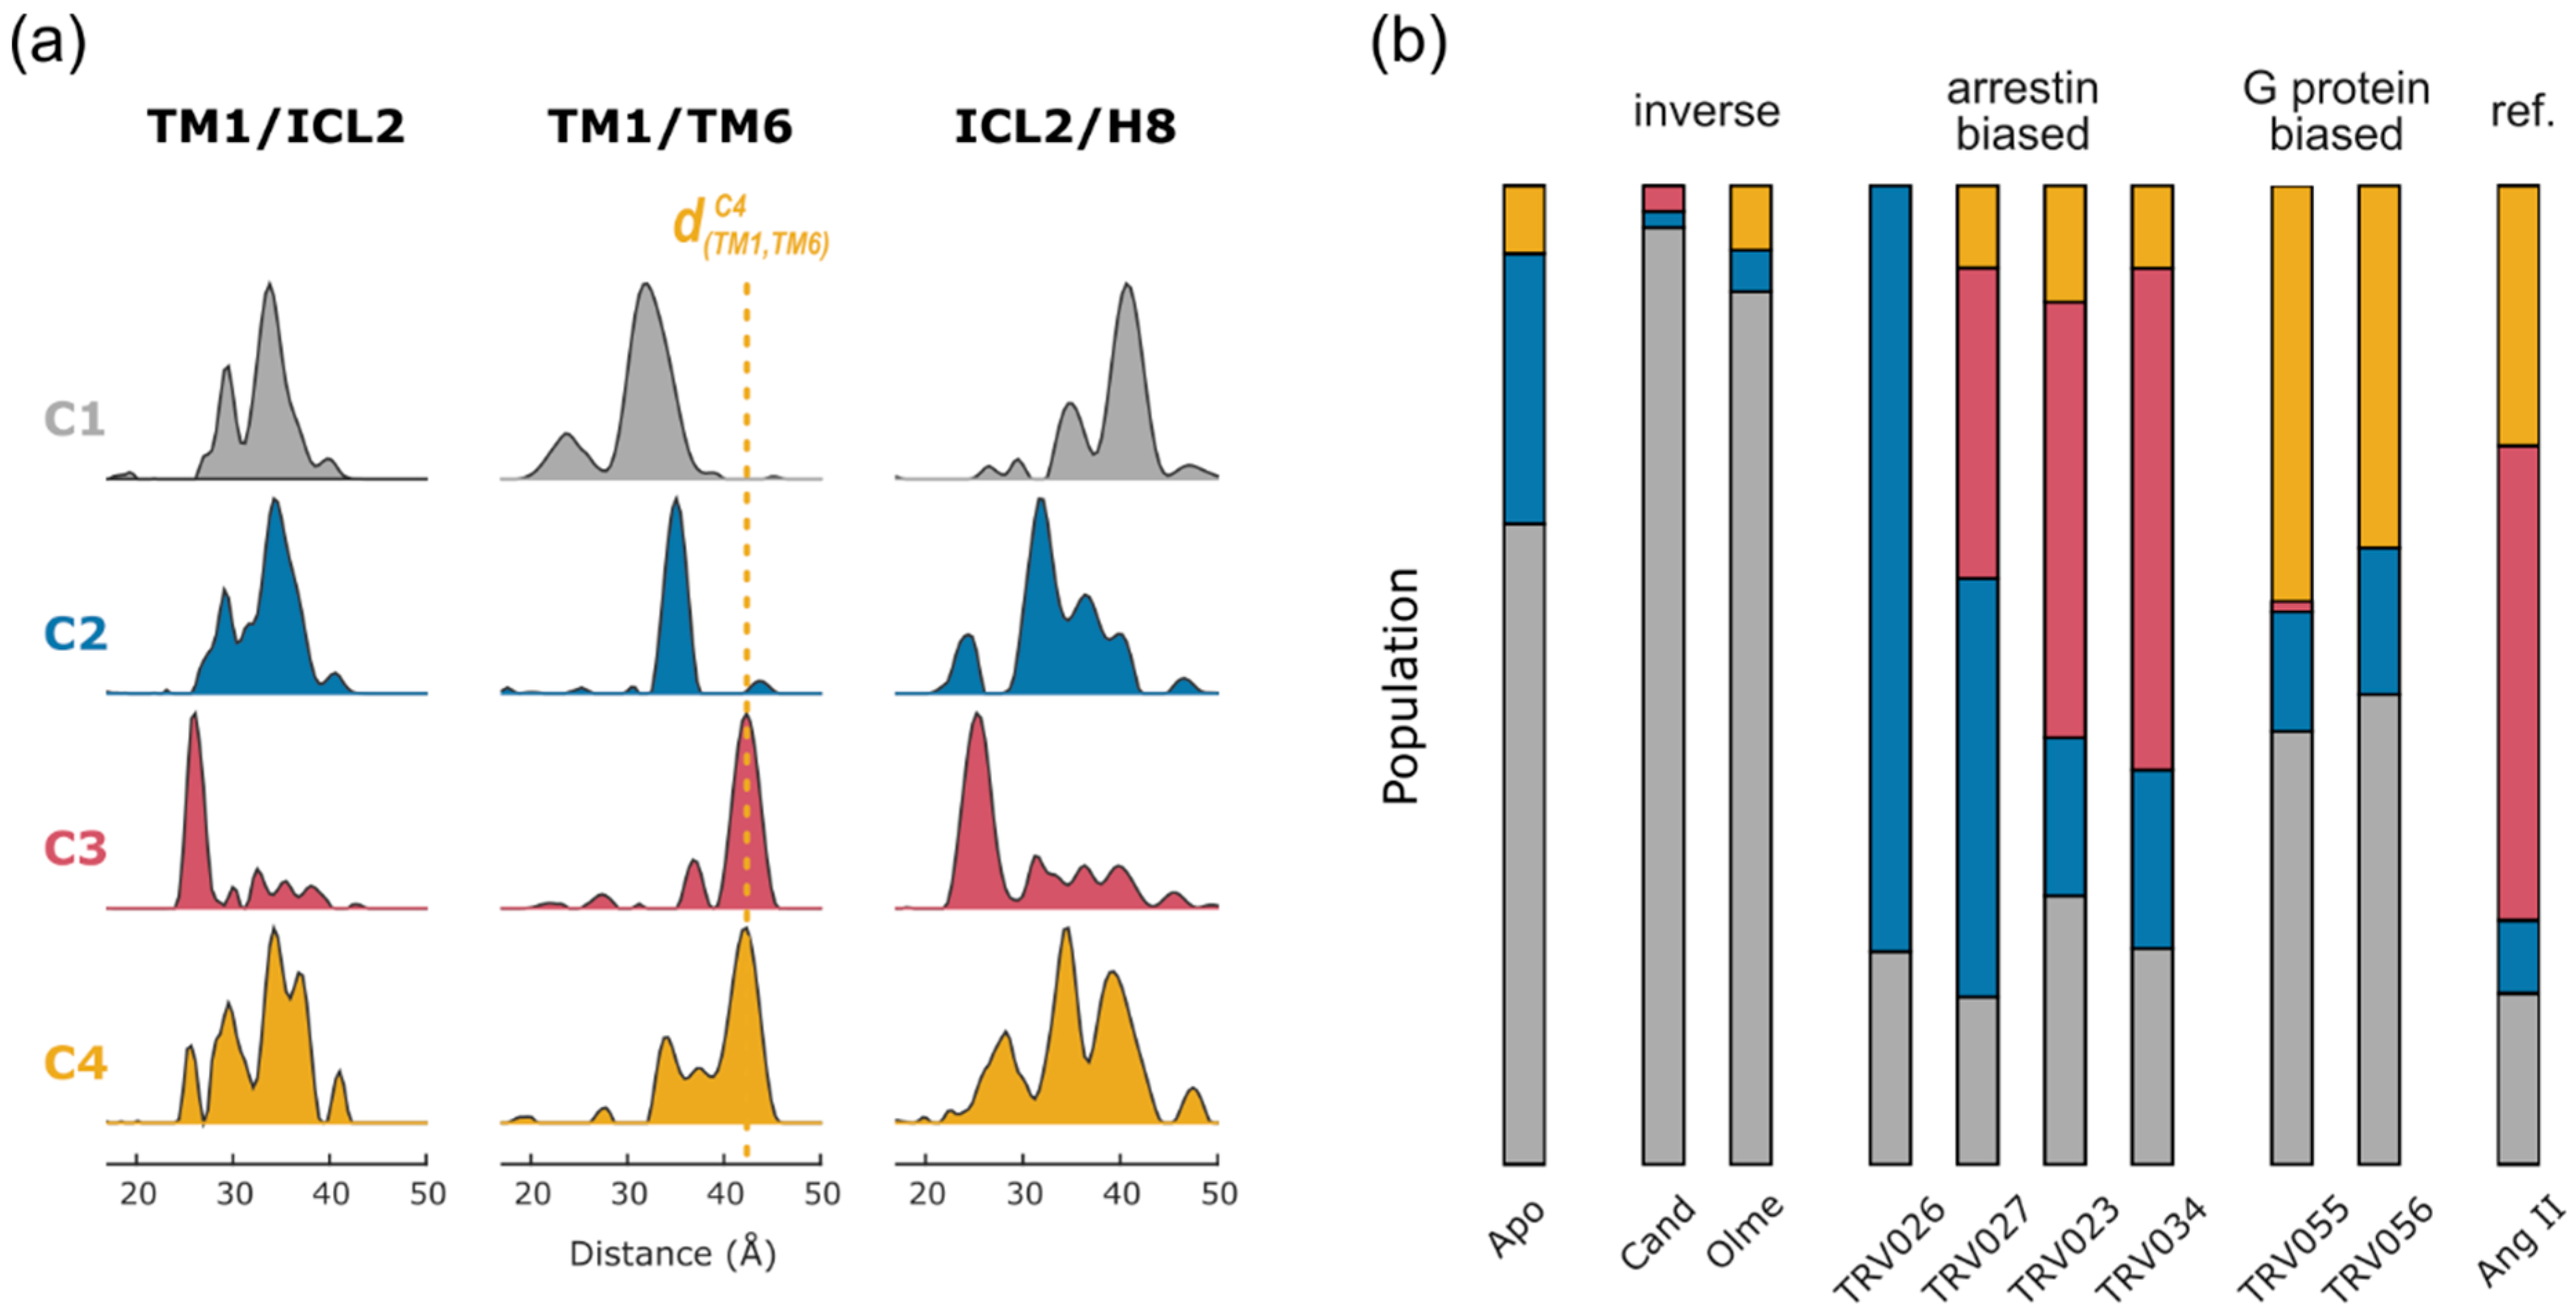
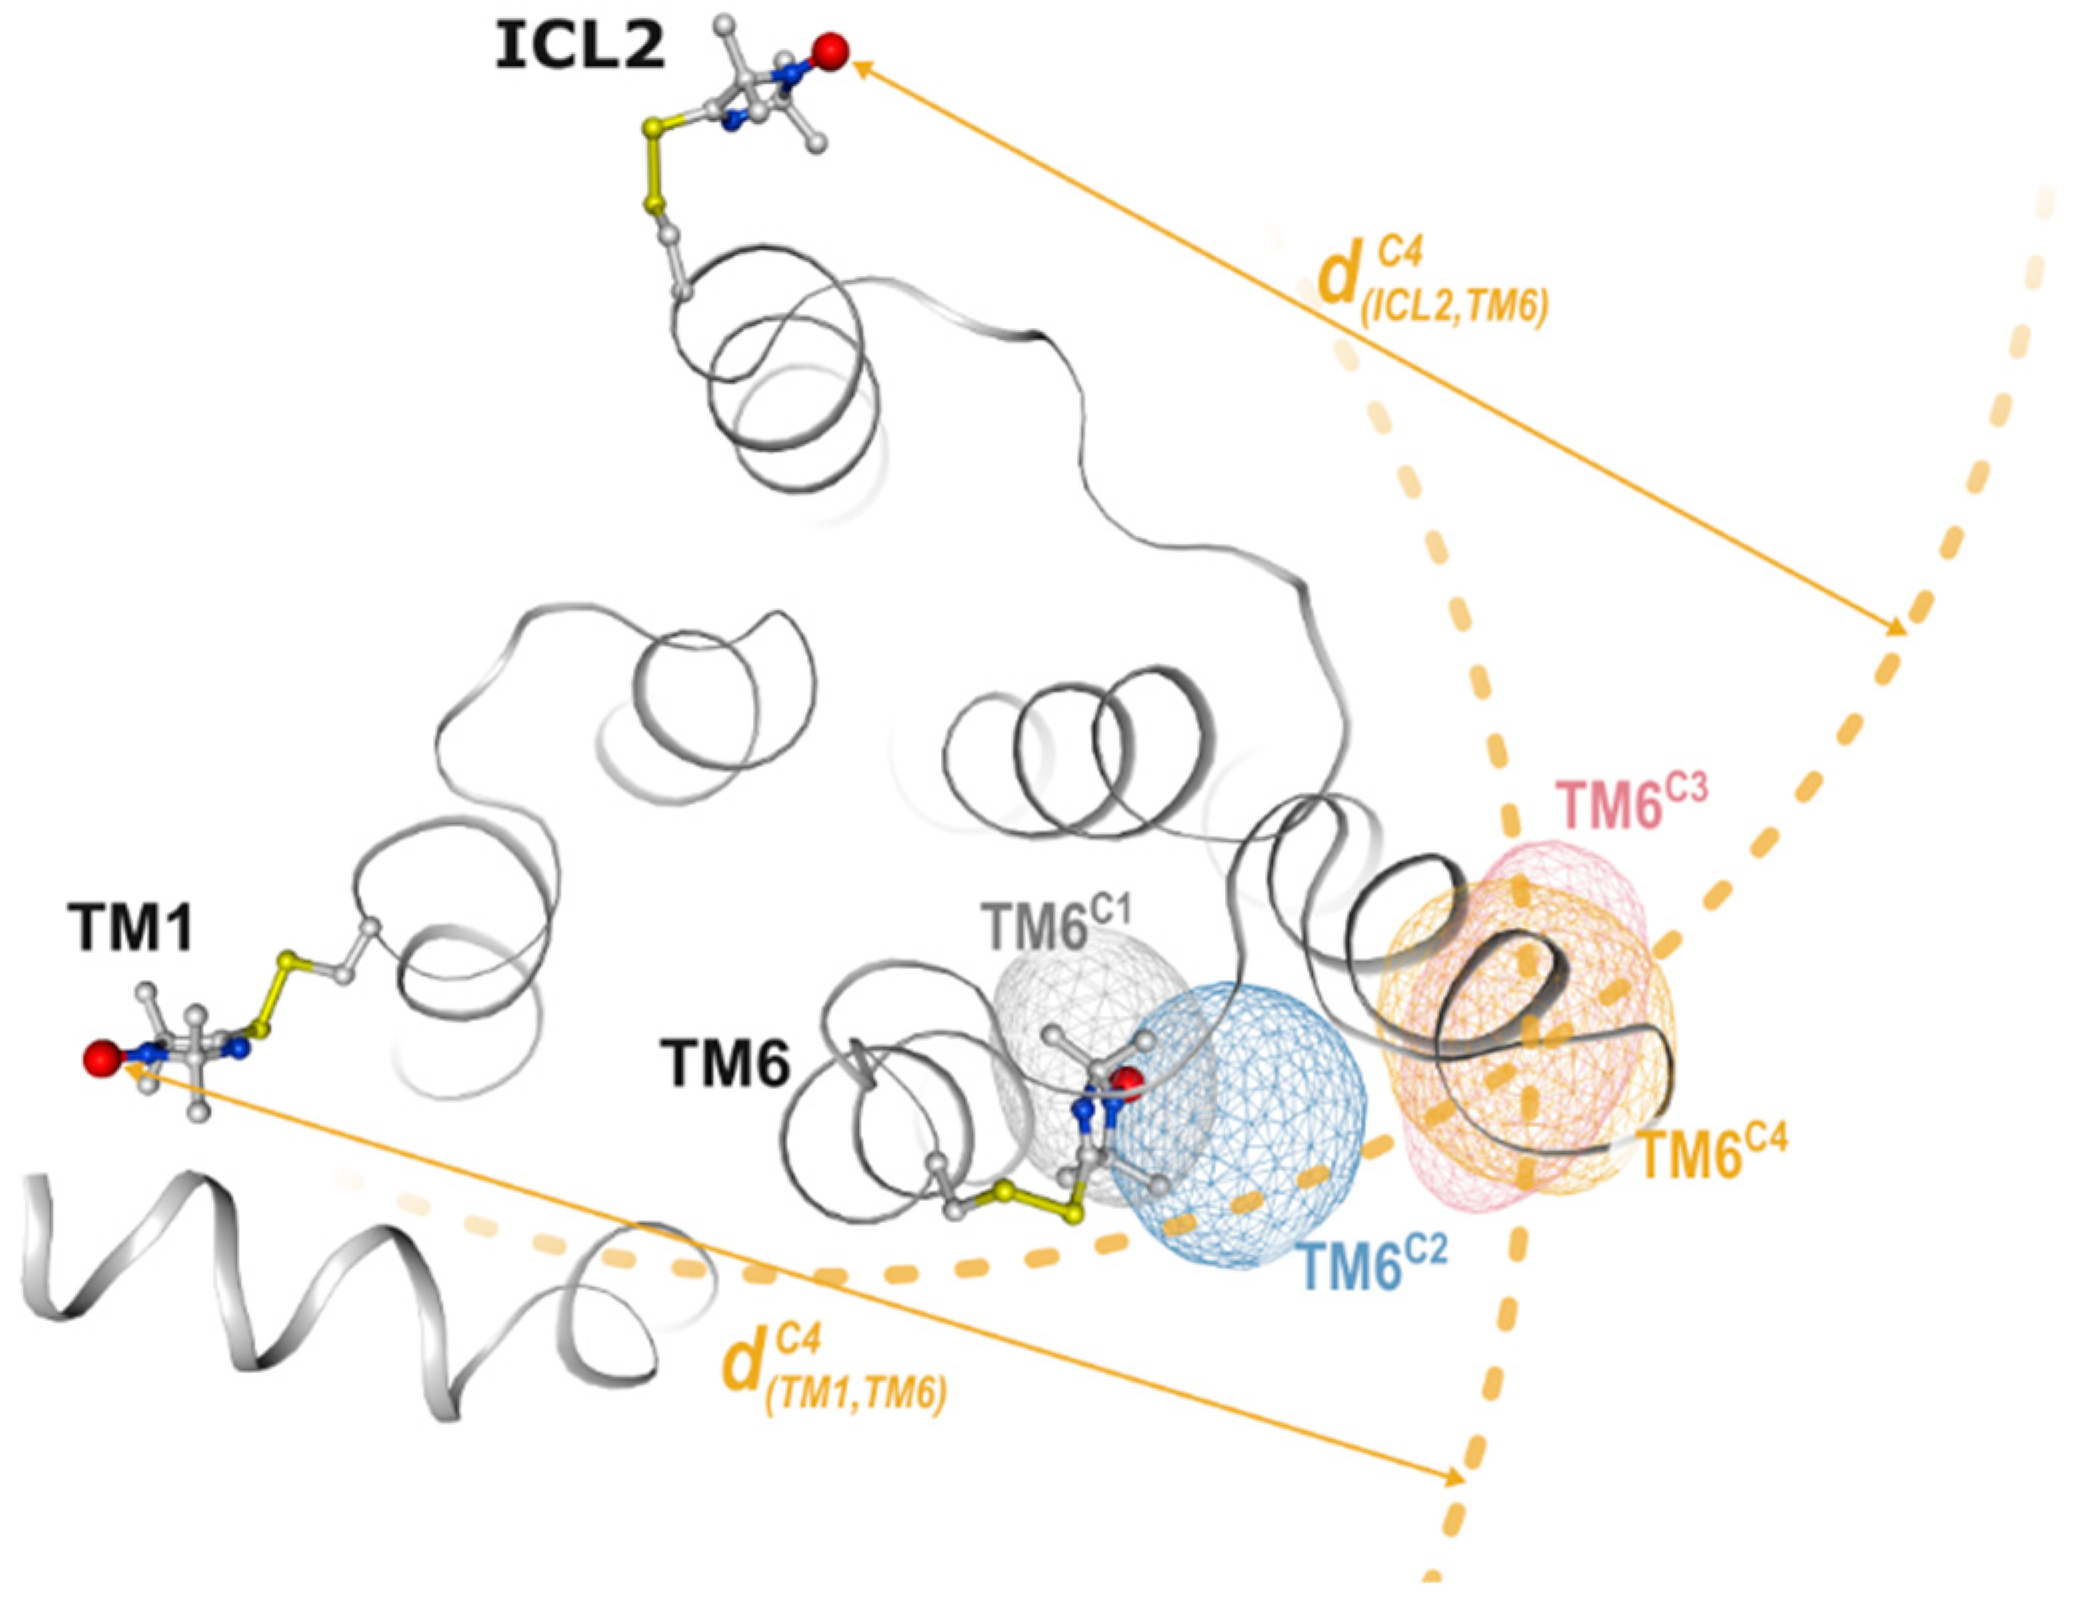
2.2. Non-Negative Matrix Factorization
2.3. DEER Distance Mapping
2.4. Conformational Efficacy
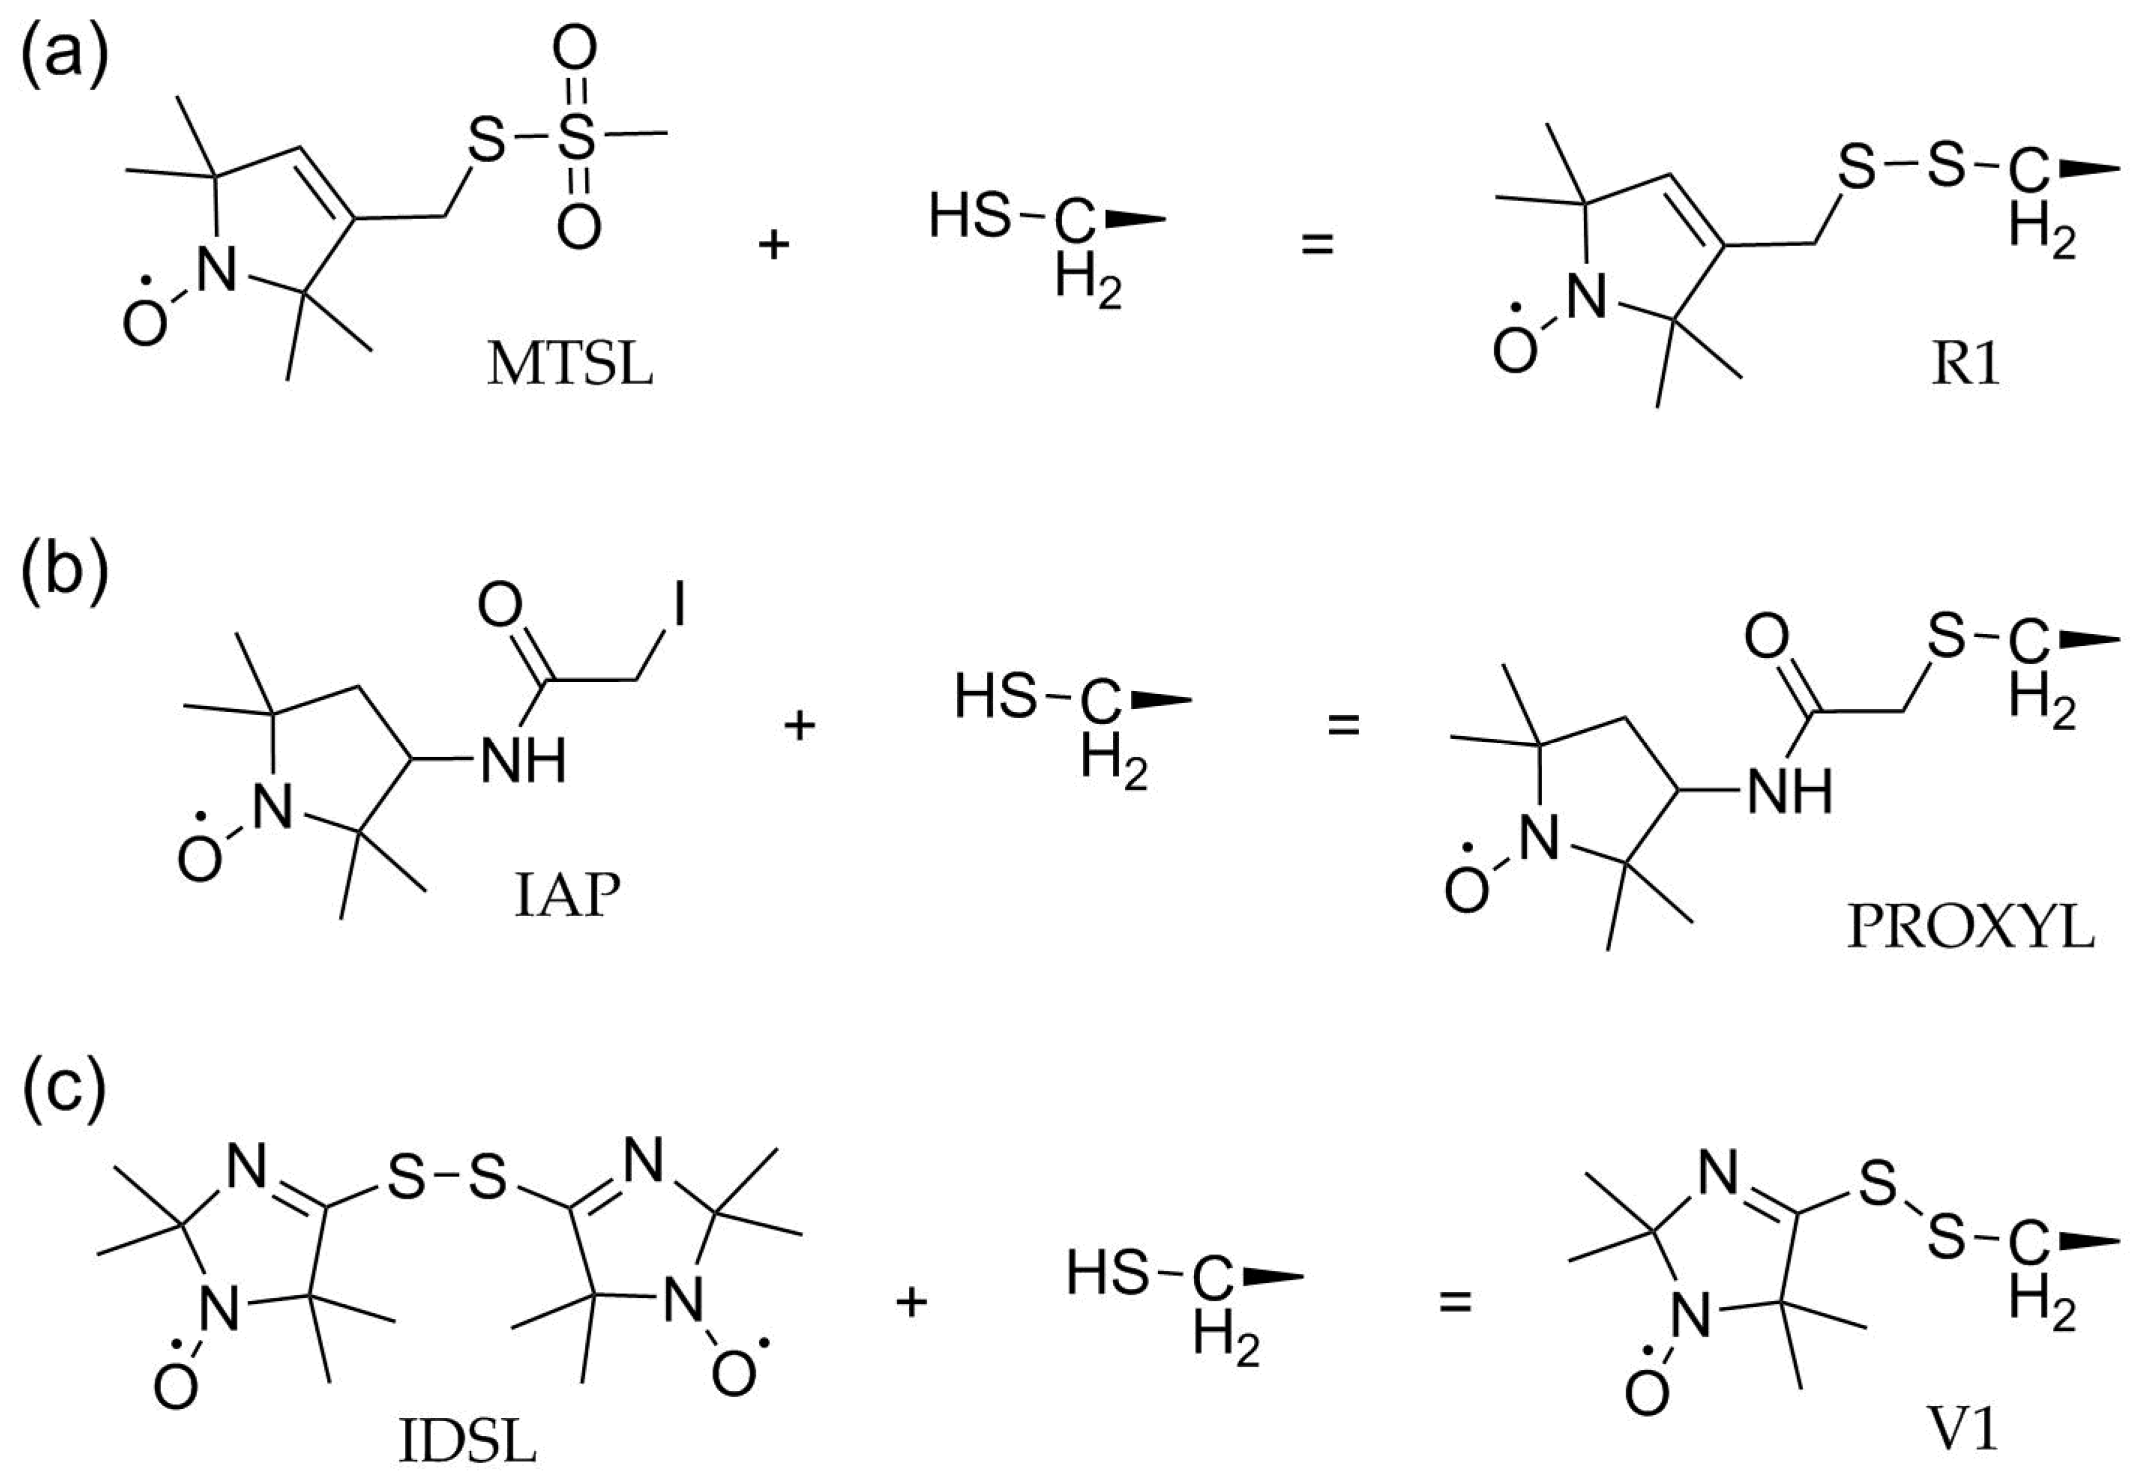
3. Site-Directed Spin Labeling (SDSL) and Reagents to Modify Cysteines
3.1. Methanethiosulfonate Spin Labels (MTSL)
3.2. Activated Alkyl Halides
3.3. Disulfides
4. Conclusions and Outlook
Funding
Conflicts of Interest
References
- Fredriksson, R.; Lagerström, M.C.; Lundin, L.-G.; Schiöth, H.B. The G-Protein-Coupled Receptors in the Human Genome Form Five Main Families. Phylogenetic Analysis, Paralogon Groups, and Fingerprints. Mol. Pharmacol. 2003, 63, 1256–1272. [Google Scholar] [CrossRef] [PubMed]
- Smith, J.S.; Lefkowitz, R.J.; Rajagopal, S. Biased Signalling: From Simple Switches to Allosteric Microprocessors. Nat. Rev. Drug Discov. 2018, 17, 243–260. [Google Scholar] [CrossRef] [PubMed]
- Lerch, M.T.; Matt, R.A.; Masureel, M.; Elgeti, M.; Kumar, K.K.; Hilger, D.; Foys, B.; Kobilka, B.K.; Hubbell, W.L. Viewing Rare Conformations of the Β2 Adrenergic Receptor with Pressure-Resolved DEER Spectroscopy. Proc. Natl. Acad. Sci. USA 2020, 202013904. [Google Scholar] [CrossRef]
- Wingler, L.M.; Lefkowitz, R.J. Conformational Basis of G Protein-Coupled Receptor Signaling Versatility. Trends Cell Biol. 2020, 30, 736–747. [Google Scholar] [CrossRef] [PubMed]
- De Lean, A.; Stadel, J.M.; Lefkowitz, R.J. A Ternary Complex Model Explains the Agonist-Specific Binding Properties of the Adenylate Cyclase-Coupled Beta-Adrenergic Receptor. J. Biol. Chem. 1980, 255, 7108–7117. [Google Scholar] [CrossRef]
- Strachan, R.T.; Sun, J.; Rominger, D.H.; Violin, J.D.; Ahn, S.; Rojas Bie Thomsen, A.; Zhu, X.; Kleist, A.; Costa, T.; Lefkowitz, R.J. Divergent Transducer-Specific Molecular Efficacies Generate Biased Agonism at a G Protein-Coupled Receptor (GPCR). J. Biol. Chem. 2014, 289, 14211–14224. [Google Scholar] [CrossRef]
- Furness, S.G.B.; Liang, Y.-L.; Nowell, C.J.; Halls, M.L.; Wookey, P.J.; Dal Maso, E.; Inoue, A.; Christopoulos, A.; Wootten, D.; Sexton, P.M. Ligand-Dependent Modulation of G Protein Conformation Alters Drug Efficacy. Cell 2016, 167, 739–749.e11. [Google Scholar] [CrossRef]
- Rosenbaum, D.M.; Cherezov, V.; Hanson, M.A.; Rasmussen, S.G.F.; Thian, F.S.; Kobilka, T.S.; Choi, H.-J.; Yao, X.-J.; Weis, W.I.; Stevens, R.C.; et al. GPCR Engineering Yields High-Resolution Structural Insights into Beta2-Adrenergic Receptor Function. Science 2007, 318, 1266–1273. [Google Scholar] [CrossRef]
- Zhao, Q.; Wu, B. Ice Breaking in GPCR Structural Biology. Acta Pharmacol. Sin. 2012, 33, 324–334. [Google Scholar] [CrossRef]
- Chun, E.; Thompson, A.A.; Liu, W.; Roth, C.B.; Griffith, M.T.; Katritch, V.; Kunken, J.; Xu, F.; Cherezov, V.; Hanson, M.A.; et al. Fusion Partner Toolchest for the Stabilization and Crystallization of G Protein-Coupled Receptors. Struct. Lond. Engl. 1993 2012, 20, 967–976. [Google Scholar] [CrossRef]
- Kaptein, R.; Wagner, G. NMR Studies of Membrane Proteins. J. Biomol. NMR 2015, 61, 181–184. [Google Scholar] [CrossRef] [PubMed][Green Version]
- Lange, O.F.; Lakomek, N.-A.; Farès, C.; Schröder, G.F.; Walter, K.F.A.; Becker, S.; Meiler, J.; Grubmüller, H.; Griesinger, C.; De Groot, B.L. Recognition Dynamics Up to Microseconds Revealed from an RDC-Derived Ubiquitin Ensemble in Solution. Science 2008, 320, 1471–1475. [Google Scholar] [CrossRef] [PubMed]
- Gregorio, G.G.; Masureel, M.; Hilger, D.; Terry, D.S.; Juette, M.; Zhao, H.; Zhou, Z.; Perez-Aguilar, J.M.; Hauge, M.; Mathiasen, S.; et al. Single-Molecule Analysis of Ligand Efficacy in Β2AR-G-Protein Activation. Nature 2017, 547, 68–73. [Google Scholar] [CrossRef] [PubMed]
- Möller, J.; Isbilir, A.; Sungkaworn, T.; Osberg, B.; Karathanasis, C.; Sunkara, V.; Grushevskyi, E.O.; Bock, A.; Annibale, P.; Heilemann, M.; et al. Single-Molecule Analysis Reveals Agonist-Specific Dimer Formation of µ-Opioid Receptors. Nat. Chem. Biol. 2020, 16, 946–954. [Google Scholar] [CrossRef]
- Budil, D.E.; Sanghyuk, L.; Saxena, S.; Freed, J.H. Nonlinear-Least-Squares Analysis of Slow-Motion EPR Spectra in One and Two Dimensions Using a Modified Levenberg-Marquardt Algorithm. J. Magn. Reson. Ser. A 1996, 120, 155–189. [Google Scholar] [CrossRef]
- Mchaourab, H.S.; Lietzow, M.A.; Hideg, K.; Hubbell, W.L. Motion of Spin-Labeled Side Chains in T4 Lysozyme. Correlation with Protein Structure and Dynamics. Biochemistry 1996, 35, 7692–7704. [Google Scholar] [CrossRef]
- Columbus, L.; Kálai, T.; Jekö, J.; Hideg, K.; Hubbell, W.L. Molecular Motion of Spin Labeled Side Chains in α-Helices: Analysis by Variation of Side Chain Structure. Biochemistry 2001, 40, 3828–3846. [Google Scholar] [CrossRef]
- Columbus, L.; Hubbell, W.L. A New Spin on Protein Dynamics. Trends Biochem. Sci. 2002, 27, 288–295. [Google Scholar] [CrossRef]
- Hyde, J.S.; Dalton, L. Very Slowly Tumbling Spin Labels: Adiabatic Rapid Passage. Chem. Phys. Lett. 1972, 16, 568–572. [Google Scholar] [CrossRef]
- Hemminga, M.A.; de Jager, P.A. Saturation Transfer Spectroscopy of Spin Labels. In Spin Labeling: Theory and Applications; Berliner, L.J., Reuben, J., Eds.; Biological Magnetic Resonance; Springer US: Boston, MA, USA, 1989; pp. 131–178. ISBN 978-1-4613-0743-3. [Google Scholar]
- Steinhoff, H.J.; Mollaaghababa, R.; Altenbach, C.; Hideg, K.; Krebs, M.; Khorana, H.G.; Hubbell, W.L. Time-Resolved Detection of Structural Changes during the Photocycle of Spin-Labeled Bacteriorhodopsin. Science 1994, 266, 105–107. [Google Scholar] [CrossRef]
- Hubbell, W.L.; López, C.J.; Altenbach, C.; Yang, Z. Technological Advances in Site-Directed Spin Labeling of Proteins. Curr. Opin. Struct. Biol. 2013, 23, 725–733. [Google Scholar] [CrossRef] [PubMed]
- Altenbach, C.; Marti, T.; Khorana, H.G.; Hubbell, W.L. Transmembrane Protein Structure: Spin Labeling of Bacteriorhodopsin Mutants. Science 1990, 248, 1088–1092. [Google Scholar] [CrossRef] [PubMed]
- Altenbach, C.; Oh, K.J.; Trabanino, R.J.; Hideg, K.; Hubbell, W.L. Estimation of Inter-Residue Distances in Spin Labeled Proteins at Physiological Temperatures: Experimental Strategies and Practical Limitations. Biochemistry 2001, 40, 15471–15482. [Google Scholar] [CrossRef] [PubMed]
- Altenbach, C.; López, C.J.; Hideg, K.; Hubbell, W.L. Exploring Structure, Dynamics, and Topology of Nitroxide Spin-Labeled Proteins Using Continuous-Wave Electron Paramagnetic Resonance Spectroscopy. Methods Enzymol. 2015, 564, 59–100. [Google Scholar] [CrossRef]
- Pannier, M.; Veit, S.; Godt, A.; Jeschke, G.; Spiess, H.W. Dead-Time Free Measurement of Dipole–Dipole Interactions between Electron Spins. J. Magn. Reson. 2000, 142, 331–340. [Google Scholar] [CrossRef]
- Jeschke, G. DEER Distance Measurements on Proteins. Annu. Rev. Phys. Chem. 2012, 63, 419–446. [Google Scholar] [CrossRef]
- Altenbach, C.; Kusnetzow, A.K.; Ernst, O.P.; Hofmann, K.P.; Hubbell, W.L. High-Resolution Distance Mapping in Rhodopsin Reveals the Pattern of Helix Movement Due to Activation. Proc. Natl. Acad. Sci. USA 2008, 105, 7439–7444. [Google Scholar] [CrossRef]
- Eps, N.V.; Caro, L.N.; Morizumi, T.; Kusnetzow, A.K.; Szczepek, M.; Hofmann, K.P.; Bayburt, T.H.; Sligar, S.G.; Ernst, O.P.; Hubbell, W.L. Conformational Equilibria of Light-Activated Rhodopsin in Nanodiscs. Proc. Natl. Acad. Sci. USA 2017, 114, E3268–E3275. [Google Scholar] [CrossRef]
- Eps, N.V.; Altenbach, C.; Caro, L.N.; Latorraca, N.R.; Hollingsworth, S.A.; Dror, R.O.; Ernst, O.P.; Hubbell, W.L. Gi- and Gs-Coupled GPCRs Show Different Modes of G-Protein Binding. Proc. Natl. Acad. Sci. USA 2018, 115, 2383–2388. [Google Scholar] [CrossRef]
- Kang, Y.; Zhou, X.E.; Gao, X.; He, Y.; Liu, W.; Ishchenko, A.; Barty, A.; White, T.A.; Yefanov, O.; Han, G.W.; et al. Crystal Structure of Rhodopsin Bound to Arrestin by Femtosecond X-Ray Laser. Nature 2015, 523, 561–567. [Google Scholar] [CrossRef]
- Zhao, D.Y.; Pöge, M.; Morizumi, T.; Gulati, S.; Eps, N.V.; Zhang, J.; Miszta, P.; Filipek, S.; Mahamid, J.; Plitzko, J.M.; et al. Cryo-EM Structure of the Native Rhodopsin Dimer in Nanodiscs. J. Biol. Chem. 2019, 294, 14215–14230. [Google Scholar] [CrossRef]
- Kang, Y.; Kuybeda, O.; de Waal, P.W.; Mukherjee, S.; Van Eps, N.; Dutka, P.; Zhou, X.E.; Bartesaghi, A.; Erramilli, S.; Morizumi, T.; et al. Cryo-EM Structure of Human Rhodopsin Bound to an Inhibitory G Protein. Nature 2018, 558, 553–558. [Google Scholar] [CrossRef] [PubMed]
- Yasuda, S.; Hara, H.; Tokunaga, F.; Arata, T. Spatial Arrangement of Rhodopsin in Retinal Rod Outer Segment Membranes Studied by Spin-Labeling and Pulsed Electron Double Resonance. Biochem. Biophys. Res. Commun. 2012, 425, 134–137. [Google Scholar] [CrossRef] [PubMed]
- Manglik, A.; Kim, T.H.; Masureel, M.; Altenbach, C.; Yang, Z.; Hilger, D.; Lerch, M.T.; Kobilka, T.S.; Thian, F.S.; Hubbell, W.L.; et al. Structural Insights into the Dynamic Process of Β2-Adrenergic Receptor Signaling. Cell 2015, 161, 1101–1111. [Google Scholar] [CrossRef] [PubMed]
- Dijkman, P.M.; Castell, O.K.; Goddard, A.D.; Munoz-Garcia, J.C.; de Graaf, C.; Wallace, M.I.; Watts, A. Dynamic Tuneable G Protein-Coupled Receptor Monomer-Dimer Populations. Nat. Commun. 2018, 9, 1710. [Google Scholar] [CrossRef] [PubMed]
- Lovett, J.E.; Lovett, B.W.; Harmer, J. DEER-Stitch: Combining Three- and Four-Pulse DEER Measurements for High Sensitivity, Deadtime Free Data. J. Magn. Reson. San Diego Calif 1997 2012, 223, 98–106. [Google Scholar] [CrossRef]
- Wingler, L.M.; Elgeti, M.; Hilger, D.; Latorraca, N.R.; Lerch, M.T.; Staus, D.P.; Dror, R.O.; Kobilka, B.K.; Hubbell, W.L.; Lefkowitz, R.J. Angiotensin Analogs with Divergent Bias Stabilize Distinct Receptor Conformations. Cell 2019, 176, 468–478.e11. [Google Scholar] [CrossRef]
- McMahon, C.; Staus, D.P.; Wingler, L.M.; Wang, J.; Skiba, M.A.; Elgeti, M.; Hubbell, W.L.; Rockman, H.A.; Kruse, A.C.; Lefkowitz, R.J. Synthetic Nanobodies as Angiotensin Receptor Blockers. Proc. Natl. Acad. Sci. USA 2020, 117, 20284–20291. [Google Scholar] [CrossRef]
- Laugwitz, J.M.; Haeri, H.H.; Kaiser, A.; Krug, U.; Hinderberger, D.; Beck-Sickinger, A.G.; Schmidt, P. Probing the Y2 Receptor on Transmembrane, Intra- and Extra-Cellular Sites for EPR Measurements. Molecules 2020, 25, 4143. [Google Scholar] [CrossRef]
- Hilger, D.; Kumar, K.K.; Hu, H.; Pedersen, M.F.; O’Brien, E.S.; Giehm, L.; Jennings, C.; Eskici, G.; Inoue, A.; Lerch, M.; et al. Structural Insights into Differences in G Protein Activation by Family A and Family B GPCRs. Science 2020, 369. [Google Scholar] [CrossRef]
- Farrens, D.L.; Altenbach, C.; Yang, K.; Hubbell, W.L.; Khorana, H.G. Requirement of Rigid-Body Motion of Transmembrane Helices for Light Activation of Rhodopsin. Science 1996, 274, 768–770. [Google Scholar] [CrossRef]
- Ruprecht, J.J.; Mielke, T.; Vogel, R.; Villa, C.; Schertler, G.F.X. Electron Crystallography Reveals the Structure of Metarhodopsin I. EMBO J. 2004, 23, 3609–3620. [Google Scholar] [CrossRef] [PubMed]
- Siebert, F. Application of FTIR Spectroscopy to the Investigation of Dark Structures and Photoreactions of Visual Pigments. Isr. J. Chem. 1995, 35, 309–323. [Google Scholar] [CrossRef]
- Smith, S.O. Structure and Activation of the Visual Pigment Rhodopsin. Annu. Rev. Biophys. 2010, 39, 309–328. [Google Scholar] [CrossRef] [PubMed]
- Mahalingam, M.; Martínez-Mayorga, K.; Brown, M.F.; Vogel, R. Two Protonation Switches Control Rhodopsin Activation in Membranes. Proc. Natl. Acad. Sci. USA 2008, 105, 17795–17800. [Google Scholar] [CrossRef] [PubMed]
- Matthews, R.G.; Hubbard, R.; Brown, P.K.; Wald, G. Tautomeric Forms of Metarhodopsin. J. Gen. Physiol. 1963, 47, 215–240. [Google Scholar] [CrossRef]
- Arnis, S.; Hofmann, K.P. Two Different Forms of Metarhodopsin II: Schiff Base Deprotonation Precedes Proton Uptake and Signaling State. Proc. Natl. Acad. Sci. USA 1993, 90, 7849–7853. [Google Scholar] [CrossRef] [PubMed]
- Hofmann, K.-P. Photoproducts of Rhodopsin in the Disc Membrane. Photobiochem. Photobiophys. 1986, 13, 309–327. [Google Scholar]
- Dror, R.O.; Arlow, D.H.; Maragakis, P.; Mildorf, T.J.; Pan, A.C.; Xu, H.; Borhani, D.W.; Shaw, D.E. Activation Mechanism of the Β2-Adrenergic Receptor. Proc. Natl. Acad. Sci. USA 2011, 108, 18684–18689. [Google Scholar] [CrossRef]
- Rose, A.S.; Elgeti, M.; Zachariae, U.; Grubmüller, H.; Hofmann, K.P.; Scheerer, P.; Hildebrand, P.W. Position of Transmembrane Helix 6 Determines Receptor G Protein Coupling Specificity. J. Am. Chem. Soc. 2014, 136, 11244–11247. [Google Scholar] [CrossRef]
- Kim, J.-M.; Hwa, J.; Garriga, P.; Reeves, P.J.; RajBhandary, U.L.; Khorana, H.G. Light-Driven Activation of Beta 2-Adrenergic Receptor Signaling by a Chimeric Rhodopsin Containing the Beta 2-Adrenergic Receptor Cytoplasmic Loops. Biochemistry 2005, 44, 2284–2292. [Google Scholar] [CrossRef]
- Godchaux, W.; Zimmerman, W.F. Membrane-Dependent Guanine Nucleotide Binding and GTPase Activities of Soluble Protein from Bovine Rod Cell Outer Segments. J. Biol. Chem. 1979, 254, 7874–7884. [Google Scholar] [CrossRef]
- Gurevich, V.V.; Benovic, J.L. [29] Arrestin: Mutagenesis, expression, purification, and functional characterization. In Methods in Enzymology; Vertebrate Phototransduction and the Visual Cycle, Part A; Academic Press: Cambridge, MA, USA, 2000; Volume 315, pp. 422–437. [Google Scholar]
- Clarke, W.P.; Bond, R.A. The Elusive Nature of Intrinsic Efficacy. Trends Pharmacol. Sci. 1998, 19, 270–276. [Google Scholar] [CrossRef]
- Livingston, K.E.; Mahoney, J.P.; Manglik, A.; Sunahara, R.K.; Traynor, J.R. Measuring Ligand Efficacy at the Mu-Opioid Receptor Using a Conformational Biosensor. eLife 2018, 7, e32499. [Google Scholar] [CrossRef] [PubMed]
- Knierim, B.; Hofmann, K.P.; Ernst, O.P.; Hubbell, W.L. Sequence of Late Molecular Events in the Activation of Rhodopsin. Proc. Natl. Acad. Sci. USA 2007, 104, 20290–20295. [Google Scholar] [CrossRef] [PubMed]
- Dawaliby, R.; Trubbia, C.; Delporte, C.; Masureel, M.; Van Antwerpen, P.; Kobilka, B.K.; Govaerts, C. Allosteric Regulation of G Protein-Coupled Receptor Activity by Phospholipids. Nat. Chem. Biol. 2016, 12, 35–39. [Google Scholar] [CrossRef]
- Strohman, M.J.; Maeda, S.; Hilger, D.; Masureel, M.; Du, Y.; Kobilka, B.K. Local Membrane Charge Regulates β 2 Adrenergic Receptor Coupling to G I3. Nat. Commun. 2019, 10. [Google Scholar] [CrossRef] [PubMed]
- Rasmussen, S.G.F.; DeVree, B.T.; Zou, Y.; Kruse, A.C.; Chung, K.Y.; Kobilka, T.S.; Thian, F.S.; Chae, P.S.; Pardon, E.; Calinski, D.; et al. Crystal Structure of the Β2 Adrenergic Receptor-Gs Protein Complex. Nature 2011, 477, 549–555. [Google Scholar] [CrossRef]
- Rasmussen, S.G.F.; Choi, H.-J.; Fung, J.J.; Pardon, E.; Casarosa, P.; Chae, P.S.; DeVree, B.T.; Rosenbaum, D.M.; Thian, F.S.; Kobilka, T.S.; et al. Structure of a Nanobody-Stabilized Active State of the β 2 Adrenoceptor. Nature 2011, 469, 175–180. [Google Scholar] [CrossRef]
- Frauenfelder, H.; Sligar, S.G.; Wolynes, P.G. The Energy Landscapes and Motions of Proteins. Science 1991, 254, 1598–1603. [Google Scholar] [CrossRef]
- Weis, W.I.; Kobilka, B.K. The Molecular Basis of G Protein–Coupled Receptor Activation. Annu. Rev. Biochem. 2018, 87, 897–919. [Google Scholar] [CrossRef] [PubMed]
- Elgeti, M.; Kazmin, R.; Heck, M.; Morizumi, T.; Ritter, E.; Scheerer, P.; Ernst, O.P.; Siebert, F.; Hofmann, K.P.; Bartl, F.J. Conserved Tyr223(5.58) Plays Different Roles in the Activation and G-Protein Interaction of Rhodopsin. J. Am. Chem. Soc. 2011, 133, 7159–7165. [Google Scholar] [CrossRef] [PubMed]
- Beck, M.; Siebert, F.; Sakmar, T.P. Evidence for the Specific Interaction of a Lipid Molecule with Rhodopsin Which Is Altered in the Transition to the Active State Metarhodopsin II. FEBS Lett. 1998, 436, 304–308. [Google Scholar] [CrossRef]
- Beck, M.; Sakmar, T.P.; Siebert, F. Spectroscopic Evidence for Interaction between Transmembrane Helices 3 and 5 in Rhodopsin. Biochemistry 1998, 37, 7630–7639. [Google Scholar] [CrossRef]
- Fritze, O.; Filipek, S.; Kuksa, V.; Palczewski, K.; Hofmann, K.P.; Ernst, O.P. Role of the Conserved NPxxY(x)5,6F Motif in the Rhodopsin Ground State and during Activation. Proc. Natl. Acad. Sci. USA 2003, 100, 2290–2295. [Google Scholar] [CrossRef]
- Liu, J.J.; Horst, R.; Katritch, V.; Stevens, R.C.; Wüthrich, K. Biased Signaling Pathways in Β2-Adrenergic Receptor Characterized by 19F-NMR. Science 2012, 335, 1106–1110. [Google Scholar] [CrossRef]
- Kim, T.H.; Chung, K.Y.; Manglik, A.; Hansen, A.L.; Dror, R.O.; Mildorf, T.J.; Shaw, D.E.; Kobilka, B.K.; Prosser, R.S. The Role of Ligands on the Equilibria between Functional States of a g Protein-Coupled Receptor. J. Am. Chem. Soc. 2013, 135, 9465–9474. [Google Scholar] [CrossRef]
- Suomivuori, C.-M.; Latorraca, N.R.; Wingler, L.M.; Eismann, S.; King, M.C.; Kleinhenz, A.L.W.; Skiba, M.A.; Staus, D.P.; Kruse, A.C.; Lefkowitz, R.J.; et al. Molecular Mechanism of Biased Signaling in a Prototypical G Protein–Coupled Receptor. Science 2020, 367, 881–887. [Google Scholar] [CrossRef]
- Prioleau, C.; Visiers, I.; Ebersole, B.J.; Weinstein, H.; Sealfon, S.C. Conserved Helix 7 Tyrosine Acts as a Multistate Conformational Switch in the 5HT2C Receptor. Identification of a Novel “Locked-on” Phenotype and Double Revertant Mutations. J. Biol. Chem. 2002, 277, 36577–36584. [Google Scholar] [CrossRef]
- Scheerer, P.; Park, J.H.; Hildebrand, P.W.; Kim, Y.J.; Krauss, N.; Choe, H.-W.W.; Hofmann, K.P.; Ernst, O.P. Crystal Structure of Opsin in Its G-Protein-Interacting Conformation. Nature 2008, 455, 497–502. [Google Scholar] [CrossRef]
- Szczepek, M.; Beyrière, F.; Hofmann, K.P.; Elgeti, M.; Kazmin, R.; Rose, A.; Bartl, F.J.; von Stetten, D.; Heck, M.; Sommer, M.E.; et al. Crystal Structure of a Common GPCR-Binding Interface for G Protein and Arrestin. Nat. Commun. 2014, 5, 4801. [Google Scholar] [CrossRef] [PubMed]
- Tsai, C.-J.; Marino, J.; Adaixo, R.; Pamula, F.; Muehle, J.; Maeda, S.; Flock, T.; Taylor, N.M.; Mohammed, I.; Matile, H.; et al. Cryo-EM Structure of the Rhodopsin-Gαi-Βγ Complex Reveals Binding of the Rhodopsin C-Terminal Tail to the Gβ Subunit. eLife 2019, 8, e46041. [Google Scholar] [CrossRef]
- Alexiev, U. Dynamics of Helix 8 in GPCR Function. In Encyclopedia of Biophysics; Roberts, G.C.K., Ed.; Springer: Berlin/Heidelberg, Germany, 2013; pp. 549–552. ISBN 978-3-642-16712-6. [Google Scholar]
- Sensoy, O.; Weinstein, H. A Mechanistic Role of Helix 8 in GPCRs: Computational Modeling of the Dopamine D2 Receptor Interaction with the GIPC1–PDZ-Domain. Biochim. Biophys. Acta BBA Biomembr. 2015, 1848, 976–983. [Google Scholar] [CrossRef] [PubMed]
- Eilers, M.; Goncalves, J.A.; Ahuja, S.; Kirkup, C.; Hirshfeld, A.; Simmerling, C.; Reeves, P.J.; Sheves, M.; Smith, S.O. Structural Transitions of Transmembrane Helix 6 in the Formation of Metarhodopsin I. J. Phys. Chem. B 2012, 116, 10477–10489. [Google Scholar] [CrossRef] [PubMed]
- Kusnetzow, A.K.; Altenbach, C.; Hubbell, W.L. Conformational States and Dynamics of Rhodopsin in Micelles and Bilayers. Biochemistry 2006, 45, 5538–5550. [Google Scholar] [CrossRef] [PubMed]
- Jaakola, V.-P.; Prilusky, J.; Sussman, J.L.; Goldman, A. G Protein-Coupled Receptors Show Unusual Patterns of Intrinsic Unfolding. Protein Eng. Des. Sel. PEDS 2005, 18, 103–110. [Google Scholar] [CrossRef] [PubMed][Green Version]
- Eddy, M.T.; Didenko, T.; Stevens, R.C.; Wüthrich, K. Β2-Adrenergic Receptor Conformational Response to Fusion Protein in the Third Intracellular Loop. Struct. Lond. Engl. 1993 2016, 24, 2190–2197. [Google Scholar] [CrossRef]
- Ozcan, O.; Uyar, A.; Doruker, P.; Akten, E.D. Effect of Intracellular Loop 3 on Intrinsic Dynamics of Human Β2-Adrenergic Receptor. BMC Struct. Biol. 2013, 13, 29. [Google Scholar] [CrossRef]
- Seo, M.J.; Heo, J.; Kim, K.; Chung, K.Y.; Yu, W. Coevolution Underlies GPCR-G Protein Selectivity and Functionality. Sci. Rep. 2021, 11, 7858. [Google Scholar] [CrossRef]
- Katritch, V.; Cherezov, V.; Stevens, R.C. Diversity and Modularity of G Protein-Coupled Receptor Structures. Trends Pharmacol. Sci. 2012, 33, 17–27. [Google Scholar] [CrossRef]
- Kaya, A.I.; Perry, N.A.; Gurevich, V.V.; Iverson, T.M. Phosphorylation Barcode-Dependent Signal Bias of the Dopamine D1 Receptor. Proc. Natl. Acad. Sci. USA 2020, 117, 14139–14149. [Google Scholar] [CrossRef]
- Yang, Z.; Yang, F.; Zhang, D.; Liu, Z.; Lin, A.; Liu, C.; Xiao, P.; Yu, X.; Sun, J.-P. Phosphorylation of G Protein-Coupled Receptors: From the Barcode Hypothesis to the Flute Model. Mol. Pharmacol. 2017, 92, 201–210. [Google Scholar] [CrossRef] [PubMed]
- Latorraca, N.R.; Masureel, M.; Hollingsworth, S.A.; Heydenreich, F.M.; Suomivuori, C.-M.; Brinton, C.; Townshend, R.J.L.; Bouvier, M.; Kobilka, B.K.; Dror, R.O. How GPCR Phosphorylation Patterns Orchestrate Arrestin-Mediated Signaling. Cell 2020. [Google Scholar] [CrossRef] [PubMed]
- Salas-Estrada, L.A.; Leioatts, N.; Romo, T.D.; Grossfield, A. Lipids Alter Rhodopsin Function via Ligand-like and Solvent-like Interactions. Biophys. J. 2018, 114, 355–367. [Google Scholar] [CrossRef]
- Du, Y.; Duc, N.M.; Rasmussen, S.G.F.; Hilger, D.; Kubiak, X.; Wang, L.; Bohon, J.; Kim, H.R.; Wegrecki, M.; Asuru, A.; et al. Assembly of a GPCR-G Protein Complex. Cell 2019, 177, 1232–1242.e11. [Google Scholar] [CrossRef] [PubMed]
- Mahoney, J.P.; Sunahara, R.K. Mechanistic Insights into GPCR-G Protein Interactions. Curr. Opin. Struct. Biol. 2016, 41, 247–254. [Google Scholar] [CrossRef]
- Franke, R.R.; Konig, B.; Sakmar, T.P.; Khorana, H.G.; Hofmann, K.P.; König, B. Rhodopsin Mutants That Bind but Fail to Activate Transducin. Science 1990, 250, 123–125. [Google Scholar] [CrossRef]
- Worth, C.L.; Kleinau, G.; Krause, G. Comparative Sequence and Structural Analyses of G-Protein-Coupled Receptor Crystal Structures and Implications for Molecular Models. PLoS ONE 2009, 4, e7011. [Google Scholar] [CrossRef]
- Hilger, D.; Masureel, M.; Kobilka, B.K. Structure and Dynamics of GPCR Signaling Complexes. Nat. Struct. Mol. Biol. 2018, 25, 4–12. [Google Scholar] [CrossRef]
- Elgeti, M.; Kazmin, R.; Rose, A.S.; Szczepek, M.; Hildebrand, P.W.; Bartl, F.J.; Scheerer, P.; Hofmann, K.P. The Arrestin-1 Finger Loop Interacts with Two Distinct Conformations of Active Rhodopsin. J. Biol. Chem. 2018, 293, 4403–4410. [Google Scholar] [CrossRef] [PubMed]
- Seyedabadi, M.; Gharghabi, M.; Gurevich, E.V.; Gurevich, V.V. Receptor-Arrestin Interactions: The GPCR Perspective. Biomolecules 2021, 11, 218. [Google Scholar] [CrossRef] [PubMed]
- Ferré, S.; Casadó, V.; Devi, L.A.; Filizola, M.; Jockers, R.; Lohse, M.J.; Milligan, G.; Pin, J.-P.; Guitart, X. G Protein–Coupled Receptor Oligomerization Revisited: Functional and Pharmacological Perspectives. Pharmacol. Rev. 2014, 66, 413–434. [Google Scholar] [CrossRef] [PubMed]
- Grushevskyi, E.O.; Kukaj, T.; Schmauder, R.; Bock, A.; Zabel, U.; Schwabe, T.; Benndorf, K.; Lohse, M.J. Stepwise Activation of a Class C GPCR Begins with Millisecond Dimer Rearrangement. Proc. Natl. Acad. Sci. USA 2019, 116, 10150–10155. [Google Scholar] [CrossRef]
- Hilger, D.; Jung, H.; Padan, E.; Wegener, C.; Vogel, K.-P.; Steinhoff, H.-J.; Jeschke, G. Assessing Oligomerization of Membrane Proteins by Four-Pulse DEER: PH-Dependent Dimerization of NhaA Na+/H+ Antiporter of E. coli. Biophys. J. 2005, 89, 1328–1338. [Google Scholar] [CrossRef] [PubMed]
- Filizola, M.; Weinstein, H. The Study of G-Protein Coupled Receptor Oligomerization with Computational Modeling and Bioinformatics. FEBS J. 2005, 272, 2926–2938. [Google Scholar] [CrossRef] [PubMed]
- Wheatley, M.; Charlton, J.; Jamshad, M.; Routledge, S.J.; Bailey, S.; La-Borde, P.J.; Azam, M.T.; Logan, R.T.; Bill, R.M.; Dafforn, T.R.; et al. GPCR–Styrene Maleic Acid Lipid Particles (GPCR–SMALPs): Their Nature and Potential. Biochem. Soc. Trans. 2016, 44, 619–623. [Google Scholar] [CrossRef] [PubMed]
- Ribeiro, J.M.L.; Filizola, M. Allostery in G Protein-Coupled Receptors Investigated by Molecular Dynamics Simulations. Curr. Opin. Struct. Biol. 2019, 55, 121–128. [Google Scholar] [CrossRef]
- Paatero, P.; Tapper, U. Positive Matrix Factorization: A Non-Negative Factor Model with Optimal Utilization of Error Estimates of Data Values. Environmetrics 1994, 5, 111–126. [Google Scholar] [CrossRef]
- Burnham, K.P.; Anderson, D.R.; Burnham, K.P. Model Selection and Multimodel Inference: A Practical Information-Theoretic Approach, 2nd ed.; Springer: New York, NY, USA, 2002; ISBN 978-0-387-95364-9. [Google Scholar]
- Jeschke, G. MMM: A Toolbox for Integrative Structure Modeling. Protein Sci. 2018, 27, 76–85. [Google Scholar] [CrossRef]
- Jo, S.; Cheng, X.; Islam, S.M.; Huang, L.; Rui, H.; Zhu, A.; Lee, H.S.; Qi, Y.; Han, W.; Vanommeslaeghe, K.; et al. Chapter Eight—CHARMM-GUI PDB Manipulator for Advanced Modeling and Simulations of Proteins Containing Nonstandard Residues. In Advances in Protein Chemistry and Structural Biology; Karabencheva-Christova, T., Ed.; Biomolecular Modelling and Simulations; Academic Press: Cambridge, MA, USA, 2014; Volume 96, pp. 235–265. [Google Scholar]
- Hatmal, M.M.; Li, Y.; Hegde, B.G.; Hegde, P.B.; Jao, C.C.; Langen, R.; Haworth, I.S. Computer Modeling of Nitroxide Spin Labels on Proteins. Biopolymers 2012, 97, 35–44. [Google Scholar] [CrossRef]
- Hagelueken, G.; Abdullin, D.; Schiemann, O. MtsslSuite: Probing Biomolecular Conformation by Spin-Labeling Studies. Methods Enzymol. 2015, 563, 595–622. [Google Scholar] [CrossRef]
- Yakimchuk, K. Receptor-Ligand Binding Assays. Mater. Methods 2011, 1, 199. [Google Scholar] [CrossRef]
- Hubbell, W.L.; Altenbach, C. Site-Directed Spin Labeling of Membrane Proteins. In Membrane Protein Structure: Experimental Approaches; White, S.H., Ed.; Methods in Physiology Series; Springer: New York, NY, USA, 1994; pp. 224–248. ISBN 978-1-4614-7515-6. [Google Scholar]
- Khramtsov, V.V.; Yelinova, V.I.; Weiner, L.M.; Berezina, T.A.; Martin, V.V.; Volodarsky, L.B. Quantitative Determination of SH Groups in Low- and High-Molecular-Weight Compounds by an Electron Spin Resonance Method. Anal. Biochem. 1989, 182, 58–63. [Google Scholar] [CrossRef]
- Van Eps, N.; Oldham, W.M.; Hamm, H.E.; Hubbell, W.L. Structural and Dynamical Changes in an Alpha-Subunit of a Heterotrimeric G Protein along the Activation Pathway. Proc. Natl. Acad. Sci. USA 2006, 103, 16194–16199. [Google Scholar] [CrossRef] [PubMed]
- Hubbell, W.L.; Altenbach, C.; Hubbell, C.M.; Khorana, H.G. Rhodopsin Structure, Dynamics, and Activation: A Perspective from Crystallography, Site-Directed Spin Labeling, Sulfhydryl Reactivity, and Disulfide Cross-Linking. Adv. Protein Chem. 2003, 63, 243–290. [Google Scholar] [CrossRef] [PubMed]
- Fawzi, N.L.; Fleissner, M.R.; Anthis, N.J.; Kálai, T.; Hideg, K.; Hubbell, W.L.; Clore, G.M. A Rigid Disulfide-Linked Nitroxide Side Chain Simplifies the Quantitative Analysis of PRE Data. J. Biomol. NMR 2011, 51, 105–114. [Google Scholar] [CrossRef] [PubMed]
- Fleissner, M.R.; Bridges, M.D.; Brooks, E.K.; Cascio, D.; Kálai, T.; Hideg, K.; Hubbell, W.L. Structure and Dynamics of a Conformationally Constrained Nitroxide Side Chain and Applications in EPR Spectroscopy. Proc. Natl. Acad. Sci. USA 2011, 108, 16241–16246. [Google Scholar] [CrossRef] [PubMed]
- Raucher, D.; Sar, C.P.; Hideg, K.; Fajer, P.G. Myosin Catalytic Domain Flexibility in MgADP. Biochemistry 1994, 33, 14317–14323. [Google Scholar] [CrossRef]
- Toledo Warshaviak, D.; Khramtsov, V.V.; Cascio, D.; Altenbach, C.; Hubbell, W.L. Structure and Dynamics of an Imidazoline Nitroxide Side Chain with Strongly Hindered Internal Motion in Proteins. J. Magn. Reson. San Diego Calif 1997 2013, 232, 53–61. [Google Scholar] [CrossRef]
- Balo, A.R.; Feyrer, H.; Ernst, O.P. Toward Precise Interpretation of DEER-Based Distance Distributions: Insights from Structural Characterization of V1 Spin-Labeled Side Chains. Biochemistry 2016, 55, 5256–5263. [Google Scholar] [CrossRef]
- Latorraca, N.R.; Venkatakrishnan, A.J.; Dror, R.O. GPCR Dynamics: Structures in Motion. Chem. Rev. 2017, 117, 139–155. [Google Scholar] [CrossRef] [PubMed]
- del Alamo, D.; Tessmer, M.H.; Stein, R.A.; Feix, J.B.; Mchaourab, H.S.; Meiler, J. Rapid Simulation of Unprocessed DEER Decay Data for Protein Fold Prediction. Biophys. J. 2020, 118, 366–375. [Google Scholar] [CrossRef] [PubMed]
- Kurzbach, D.; Platzer, G.; Schwarz, T.C.; Henen, M.A.; Konrat, R.; Hinderberger, D. Cooperative Unfolding of Compact Conformations of the Intrinsically Disordered Protein Osteopontin. Biochemistry 2013, 52, 5167–5175. [Google Scholar] [CrossRef] [PubMed]
- López, C.J.; Oga, S.; Hubbell, W.L. Mapping Molecular Flexibility of Proteins with Site-Directed Spin Labeling: A Case Study of Myoglobin. Biochemistry 2012, 51, 6568–6583. [Google Scholar] [CrossRef] [PubMed]
- Weickert, S.; Cattani, J.; Drescher, M. Intrinsically disordered proteins (IDPs) studied by EPR and in-cell EPR. In Electron Paramagnetic Resonance; Royal Society of Chemistry: London, UK, 2018; pp. 1–37. [Google Scholar]
- Maeda, R.; Hiroshima, M.; Yamashita, T.; Wada, A.; Nishimura, S.; Sako, Y.; Shichida, Y.; Imamoto, Y. Single-Molecule Observation of the Ligand-Induced Population Shift of Rhodopsin, A G-Protein-Coupled Receptor. Biophys. J. 2014, 106, 915–924. [Google Scholar] [CrossRef] [PubMed]
- Yang, Z.; Jiménez-Osés, G.; López, C.J.; Bridges, M.D.; Houk, K.N.; Hubbell, W.L. Long-Range Distance Measurements in Proteins at Physiological Temperatures Using Saturation Recovery EPR Spectroscopy. J. Am. Chem. Soc. 2014, 136, 15356–15365. [Google Scholar] [CrossRef]
- Meyer, V.; Swanson, M.A.; Clouston, L.J.; Boratyński, P.J.; Stein, R.A.; Mchaourab, H.S.; Rajca, A.; Eaton, S.S.; Eaton, G.R. Room-Temperature Distance Measurements of Immobilized Spin-Labeled Protein by DEER/PELDOR. Biophys. J. 2015, 108, 1213–1219. [Google Scholar] [CrossRef][Green Version]
- Yang, Z.; Bridges, M.D.; López, C.J.; Rogozhnikova, O.Y.; Trukhin, D.V.; Brooks, E.K.; Tormyshev, V.; Halpern, H.J.; Hubbell, W.L. A Triarylmethyl Spin Label for Long-Range Distance Measurement at Physiological Temperatures Using T1 Relaxation Enhancement. J. Magn. Reson. 2016, 269, 50–54. [Google Scholar] [CrossRef]
- Lavington, S.; Watts, A. Lipid Nanoparticle Technologies for the Study of G Protein-Coupled Receptors in Lipid Environments. Biophys. Rev. 2020, 12, 1287–1302. [Google Scholar] [CrossRef]
- Chung, K.Y.; Kim, T.H.; Manglik, A.; Alvares, R.; Kobilka, B.K.; Prosser, R.S. Role of Detergents in Conformational Exchange of a G Protein-Coupled Receptor. J. Biol. Chem. 2012, 287, 36305–36311. [Google Scholar] [CrossRef]
- Stein, R.A.; Beth, A.H.; Hustedt, E.J. A Straightforward Approach to the Analysis of Double Electron–Electron Resonance Data. In Methods in Enzymology; Elsevier: Amsterdam, The Netherlands, 2015; Volume 563, pp. 531–567. ISBN 978-0-12-802834-6. [Google Scholar]
- Fábregas Ibáñez, L.; Jeschke, G.; Stoll, S. DeerLab: A Comprehensive Software Package for Analyzing Dipolar Electron Paramagnetic Resonance Spectroscopy Data. Magn. Reson. 2020, 1, 209–224. [Google Scholar] [CrossRef]
- Karthikeyan, G.; Bonucci, A.; Casano, G.; Gerbaud, G.; Abel, S.; Thomé, V.; Kodjabachian, L.; Magalon, A.; Guigliarelli, B.; Belle, V.; et al. A Bioresistant Nitroxide Spin Label for In-Cell EPR Spectroscopy: In Vitro and In Oocytes Protein Structural Dynamics Studies. Angew. Chem. Int. Ed. 2018, 57, 1366–1370. [Google Scholar] [CrossRef] [PubMed]
- Lerch, M.T.; López, C.J.; Yang, Z.; Kreitman, M.J.; Horwitz, J.; Hubbell, W.L. Structure-Relaxation Mechanism for the Response of T4 Lysozyme Cavity Mutants to Hydrostatic Pressure. Proc. Natl. Acad. Sci. USA 2015, 112, E2437–E2446. [Google Scholar] [CrossRef] [PubMed]
- Lerch, M.T.; Yang, Z.; Altenbach, C.; Hubbell, W.L. High-Pressure EPR and Site-Directed Spin Labeling for Mapping Molecular Flexibility in Proteins. Methods Enzymol. 2015, 564, 29–57. [Google Scholar] [CrossRef] [PubMed]


| GPCR a | Transducer | Distances b | System c | Label d | Ref. | Note |
|---|---|---|---|---|---|---|
| Rho | TM1-H8 | DDM pH6 | MTSL | [28] | First study to directly detect conformational changes of GPCR activation | |
| Gi | TM2-TM5 TM2-TM6 TM2-TM7 | Nanodiscs DDM var pH | MTSL | [29] | Effect of lipidic environment on GPCR conformational equilibria | |
| Gi | intermolecular | DDM | MTSL | [30] | Architecture of rhodopsin–Gi complex | |
| arrestin-1 | intermolecular | Nanodiscs | MTSL | [31] | Crystal structure of the rhodopsin–arrestin-1 complex | |
| TM3-H8 | Nanodiscs membranes | MTSL | [32] | Rhodopsin dimer in nanodiscs | ||
| Gi | TM2- TM5/TM6/TM7 | DDM | MTSL | [33] | EM structure of rhodopsin–Gi complex | |
| TM3, H8 (native) | Native membranes | MTSL | [34] | Characterization of native rhodopsin oligomers | ||
| β2AR | Nb80 | TM4-TM6 | DDM/CHS | IAP | [35] | Characterization of ligand-induced equilibrium shifts and loose allosteric coupling |
| Nb80 | TM4-TM6 | DDM/CHS | IAP | [3] | Pressure resolved DEER identifies small amounts of active receptor responsible for basal activity | |
| NTS1 | TM1–7, H8 | liposomes | MTSL | [36] | Dimer mapping, DEER stitch [37] | |
| AT1R | Nb | TM1-ICL2 TM1-TM6/7/H8 ICL2-TM5/6/7/H8 TM5-H8 TM6-H8 | MNG/CHS | IDSL | [38] | Conformational signatures of GPCR-biased signaling |
| AT1R | EC-Nb | TM1-TM6 ICL2-TM5/H8 | MNG/CHS | IDSL | [39] | Using nanobodies as highly specific GPCR ligands |
| Y2R | TM3-TM7 | bicelles | MTSL/IDSL | [40] | Conformational changes in refolded GPCR | |
| GCGR | TM4-TM5 TM4-TM6 | MNG/CHS | IDSL | [41] | Differences in the activation mechanisms of class A and class B GPCRs |
Publisher’s Note: MDPI stays neutral with regard to jurisdictional claims in published maps and institutional affiliations. |
© 2021 by the authors. Licensee MDPI, Basel, Switzerland. This article is an open access article distributed under the terms and conditions of the Creative Commons Attribution (CC BY) license (https://creativecommons.org/licenses/by/4.0/).
Share and Cite
Elgeti, M.; Hubbell, W.L. DEER Analysis of GPCR Conformational Heterogeneity. Biomolecules 2021, 11, 778. https://doi.org/10.3390/biom11060778
Elgeti M, Hubbell WL. DEER Analysis of GPCR Conformational Heterogeneity. Biomolecules. 2021; 11(6):778. https://doi.org/10.3390/biom11060778
Chicago/Turabian StyleElgeti, Matthias, and Wayne L. Hubbell. 2021. "DEER Analysis of GPCR Conformational Heterogeneity" Biomolecules 11, no. 6: 778. https://doi.org/10.3390/biom11060778
APA StyleElgeti, M., & Hubbell, W. L. (2021). DEER Analysis of GPCR Conformational Heterogeneity. Biomolecules, 11(6), 778. https://doi.org/10.3390/biom11060778