Article

Flexibility of Oxidized and Reduced States of the Chloroplast Regulatory Protein CP12 in Isolation and in Cell Extracts

1
Aix Marseille Univ, CNRS, BIP, UMR7281, F-13402 Marseille, France
2
NMR Platform, Institut de Microbiologie de la Méditerranée, Aix Marseille Univ, F-13009 Marseille, France
3
CNRS, ERL9002, Integrative Structural Biology, Univ. Lille, F-59658 Lille, France
4
U1167, INSERM, CHU Lille, Institut Pasteur de Lille, F-59019 Lille, France
5
Plate-forme Protéomique, Marseille Protéomique (MaP), IMM FR 3479, 31 Chemin Joseph Aiguier, F-13009 Marseille, France
*
Authors to whom correspondence should be addressed.
Biomolecules 2021, 11(5), 701; https://doi.org/10.3390/biom11050701
Submission received: 31 March 2021 / Revised: 3 May 2021 / Accepted: 4 May 2021 / Published: 8 May 2021

Abstract

:
In the chloroplast, Calvin–Benson–Bassham enzymes are active in the reducing environment created in the light by electrons from the photosystems. In the dark, these enzymes are inhibited, mainly caused by oxidation of key regulatory cysteine residues. CP12 is a small protein that plays a role in this regulation with four cysteine residues that undergo a redox transition. Using amide-proton exchange with solvent, measured by nuclear magnetic resonance (NMR) and mass-spectrometry, we confirmed that reduced CP12 is intrinsically disordered. Using real-time NMR, we showed that the oxidation of the two disulfide bridges is simultaneous. In oxidized CP12, the C23–C31 pair is in a region that undergoes a conformational exchange in the NMR-intermediate timescale. The C66–C75 pair is in the C-terminus that folds into a stable helical turn. We confirmed that these structural states exist in a physiologically relevant environment: a cell extract from Chlamydomonas reinhardtii. Consistent with these structural equilibria, the reduction is slower for the C66–C75 pair than for the C23–C31 pair. The redox mid-potentials for the two cysteine pairs differ and are similar to those found for glyceraldehyde 3-phosphate dehydrogenase and phosphoribulokinase, consistent with the regulatory role of CP12.

1. Introduction

Redox regulation based on disulfide-dithiol exchanges constitutes a rapid and reversible post translational modification (PTM) that affects protein conformation. PTM in intrinsically disordered regions (IDRs) can confer flexibility, or in contrast order, thereby allowing rapid regulation of cellular processes. The proteins with disorder triggered by different stimuli, including redox, pH, and temperature, are called conditionally disordered proteins (CDPs) [1]. PTMs of CDPs can contribute to the diversification and functionality of proteomes, by regulating different properties of proteins, which is termed the “proteoform concept” [2]. Among these CDPs, some are particularly sensitive to redox changes, and these have been termed redox-dependent CDPs [3]. In these CDPs, key cysteine residues can form disulfide bridges under oxidizing conditions. These reversible thiol/disulfide bridge transitions imply that cysteine residues not only promote folding but are also key regulatory residues. Many examples of proteins containing IDRs, or of intrinsically disordered proteins (IDPs) that contain a redox-sensitive cysteine residue pair, have been described in the literature. To cite but a few examples, Hsp33, a redox-regulated chaperone, undergoes an order-to-disorder transition upon oxidation [4,5], and Cox17, a copper chaperone, and its partner Mia40, an intermembrane space mitochondrial protein, undergo a disorder-to-order transition upon oxidation [6,7].
The redox potential of chloroplasts becomes more reduced upon a dark to light transition and reciprocally more oxidized upon light to dark transitions. Many enzymes are regulated by different PTMs such as S-glutathionylation or S-nitrosylation, but mainly through redox modulators via thiol-disulfide interconversions involving the ubiquitous thioredoxins (Trx) [8,9,10]. Light has a dual role and activates enzymes involved in carbohydrate synthesis while inhibiting enzymes involved in their degradation, avoiding futile cycling. For instance, two enzymes that play a major role in the carbohydrate breakdown are inhibited in the light: glucose-6-phosphate dehydrogenase involved in the oxidative pentose phosphate pathway [11,12] and phosphofructokinase (PFK) involved in glycolysis [13,14]. For example, in Arabidopsis thaliana, the isoform PFK5 was shown to be reduced by Trx f and oxidized and activated by a recently identified NADPH-dependent Trx-like 2/2-Cys peroxiredoxin pathway, which is branched to the ferredoxin NADP reductase [14,15]. In contrast, the Calvin–Benson–Bassham (CBB) cycle that is responsible for CO2 assimilation and carbohydrate synthesis is inactive under dark and only operates in the light. Activation as well as inhibition of CBB enzymes have been shown to be very quick, within 30 s [16,17,18,19]. The mechanism of activation has been intensively studied and is mainly under the control of Trxs through the ferredoxin-Trx system [20]. The inhibition mechanism also involves the ferredoxin-Trx system as well as the newly described Trx-like 2/2-Cys peroxiredoxin pathway [15,20].
Redox regulation of enzymes of the CBB cycle can be either direct via their regulatory cysteine residues (e.g., phosphoribulokinase (PRK), sedoheptulose-1,7-bisphosphatase, fructose-1,6-bisphosphatase, [21]) or indirect via redox mediators such as the chloroplast protein CP12. This protein of about 8.5 kDa is able to switch this pathway on in the light or off in the dark [22,23]. CP12 has four cysteine residues that form two disulfide bridges in the dark. The formation of these intramolecular disulfide bridges is associated with a large increase in affinity of CP12 for two enzymes of the CBB cycle, and results in the formation of a ternary supramolecular complex. The N-terminal disulfide bridge C23–C31 is proximal with the region that is essential for PRK-association W35xxVEExxxxxxH47 [24], and the C-terminal disulfide bridge C66–C75 is within the region that interacts with glyceraldehyde-3-phosphate dehydrogenase (GAPDH) [25,26]. When embedded in this ternary complex, the two enzymes and the CBB cycle are inactive. In contrast, upon dark to light transition, the two disulfide bridges of CP12 become reduced and the ternary complex dissociates, releasing active enzymes allowing the CBB cycle to operate. CP12 is present in most photosynthetic organisms [27,28] and has features of a disordered protein. In the green alga, Chlamydomonas reinhardtii, as well as in other organisms, this protein is fully disordered when reduced (CP12red) and bears some secondary structural elements when oxidized, although it is still flexible (Figure 1) [29,30,31]. The C-terminal region that surrounds the C66–C75 disulfide bridge folds into a stable α-helical turn. It is preceded by a disordered linker and a highly dynamical N-terminal region that contains the C23–C31 cysteine pair. CP12 belongs to the CDP family and its conditional disorder allows for nuanced control of CBB enzymes and their fine regulation through binding processes. Besides the dark down regulation of CBB enzymes, this protein is a jack-of-all trades and can perform different functions in a photosynthetic cell [22,32].
Some in vitro structural data on CP12 have been obtained in the last few years (Figure 1) [25,26,29,31], but, as for many IDPs and CDPs, the flexibility of the protein in its physiological milieu remains to be confirmed [33,34]. Indeed, in cells, the molecular crowding and the presence of interacting partners can add a major contribution to the conformational sampling of an IDP, as it has been shown on well-studied IDPs such as tau and alpha-synuclein [35,36]. This is also the case for CDP, and the redox-dependent disorder-to-order transition of Mia40 and Cox17 has been shown in isolation and within HeLa cell cytoplasm [37,38]. Nevertheless, the effect of the complex physiological environment has never been studied on the model CDP, CP12.
The objective of this study was to monitor the structural and redox properties of both cysteine residues pairs of CP12 depending on the physical-chemical conditions. In order to understand better the redox-dependent conformational sampling of CP12 in vitro, the amide proton exchange rates were measured by Mass-Spectrometry (MS) and Nuclear Magnetic Resonance (NMR), as well as the temperature and pH variation of the NMR observables. The conformational states of both cysteine residues pair regions in CP12ox and CP12red were also observed under more physiological conditions, in C. reinhardtii cell extracts. We thus confirmed the distinct dynamical nature of both cysteine residues pair regions with all the possible interacting partners, PTM mediators, or solubilizing molecules present in the cell extracts. Since, as mentioned above, it is the CP12 redox transition that governs the GAPDH and PRK regulation, we monitored the kinetics of the redox transition of CP12 in isolation and within C. reinhardtii cell extracts and determined the oxidation-reduction midpoint potentials of its two pairs of cysteine residues.

2. Materials and Methods

2.1. Amide-Water Proton Exchange Kinetic Measurements by NMR

The kinetics of amide-water proton exchange was measured on CP12red (in the presence of 20 mM DTTred) and CP12ox in 50 mM sodium phosphate (NaPi) pH 6.5, 50 mM NaCl, 1 mM EDTA, 5% D2O, with traces of sodium trimethylsilylpropanesulfonate (DSS) by NMR on a 600 MHz Advance III spectrometer (Bruker, Ettlingen, Germany) equipped with a cryoprobe. We used the CLEANEX-PM [39] pulse sequence, with the following spin-lock delays (τm in ms): 1.6, 3.2, 6.5, 9.7, 20, 39, and 81 and as a pseudo-3D experiment. The data were recorded at pH 7.0 and pH 6.0 and at 283 K. The signal intensities for each residue (Iτm) was normalized against that in a fast-heteronuclear single quantum coherence (FHSQC) [39] spectrum (I0) acquired using the same parameters, that is, a 15N acquisition time of 42 ms, a 1H acquisition time of 243 ms, and 64 scans. The spectra were transformed in nmrPipe [40], and the cross-peak intensities measured using NMRFAM-SPARKY [41]. The increase of resonance intensities as a function of the spin-lock delay (τm) was fitted to the following equation using a Levenberg–Marquardt nonlinear regression function in Octave [42]:
  I τ m I 0 = k R 1 A , a p p   +   k     R 1 B ,   a p p × { exp ( R 1 B ,   a p p × τ m ) exp [ ( R 1 A ,   a p p + k ) · τ m ] }
where R1B,app is the apparent water relaxation rate and was set to 0.6 s1, and k (the amide-water exchange rate) and R1A,app (the amide relaxation rate) were optimized. The fits are shown in Figure S1. The exchange rate (kex) was set to k/0.85 to take into account the water saturation effect in the CLEANEX-PM experiment [39,43]. The uncertainties on kex values were obtained by repeating the optimization upon randomly varying the experimental integrals within 10% error (which is an overestimation of the experimental error). The intrinsic rates of exchange (kint) were predicted using SPHERE [44].

2.2. Gibbs Free Energy Derived from Protection Factors

The protection factor for CP12ox (P) is calculated with:
P = k e x ,   o x i d i z e d   s t a t e k e x ,   r e d u c e d   s t a t e
The change in Gibbs free energy (ΔG) for the backbone structure of oxidized CP12 is calculated from P with the following equation:
Δ G = R T ln ( P )
with R being the gas constant (1.987 × 10⁻³ kcal K−1 mol−1) and T being the temperature (283 K).

2.3. Amide–Water Proton Exchange Kinetic Measurements by MS

MS was also used to monitor the rate of exchange of proton amide with deuterated solvent. CP12ox and CP12red in 15 mM Tris pH 6.6, 50 mM NaCl were diluted 10× in either 10 mM potassium phosphate in 100% H2O, pH 7.0 for control “undeuterated” experiments, or 10 mM potassium phosphate in 99.96% D2O, pD 7.0 for the “deuterated” experiments. pH values of D2O solutions were adjusted to the corresponding pD values using the equation (pD = pHread + 0.40). The final concentration of CP12ox and CP12red was 17 μM and 20 μM, respectively. The samples were left from 10 s to 15 min for the exchange to occur on ice. At different times, the exchange reaction was quenched by diluting twice in pre-chilled 100 mM potassium phosphate, pH 2.66 containing 2 mM Tris(2-carboxyethyl)phosphine (TCEP), and immediately injected on a nanoACQUITY UPLC™ system with HDX technology (Waters Corporation, Milford, MA, USA). The proteins were digested online at 20 °C in an immobilized pepsin column (2.1 × 30 mm, Applied Biosystems, CA, USA) for 5 min in 0.1% formic acid/H2O at a flow rate of 100 µL min−1. Peptides were subsequently trapped and desalted online using an ACQUITY UPLC® BEH C18 VanGuard™ Pre-column (1.7 µm, Waters Corporation, Milford, MA, USA) at 0 °C, then eluted into an ACQUITY UPLC® BEH C18 column (1.7 µm, 1 mm × 100 mm, Waters Corporation, Milford, MA, USA) held at 0 °C, and separated with a linear acetonitrile gradient containing 0.1% formic acid. Mass spectra were acquired on a SYNAPT-G1 mass spectrometer (Waters, Manchester, UK) with an electrospray ionization source and lock-mass corrected by a Glu-fibrinogen peptide solution, in MSe mode, over the m/z range of 50–2000. “Undeuterated” peptides were identified using Protein Lynx Global Server software 3.1 (Waters, Manchester, UK). Deuterium uptake data for each peptic peptide from the “deuterated” experiments were automatically calculated using DynamX 2.0 software (Waters, Manchester, UK) and the results were manually checked.

2.4. Temperature Dependence of the NMR Chemical Shift and Signal Intensity

1H-15N FHSQC of CP12ox (400 μM) in 50 mM NaPi pH 6.5, 50 mM NaCl, and with 20 mM DTTox, 5% D2O were recorded at varying temperature (277 K, 284 K, 291 K, 298 K, 305 K, 313 K, 319 K), with a proton acquisition time of 243.3 ms and a 15N acquisition time of 42 ms on a 600 MHz and a 900 MHz Advance III spectrometer (Bruker, Germany) equipped with cryo-probes. When mentioned, one equivalent of copper (CuSO4) was added to the sample to catalyze oxidation, followed by the addition of 1 mM EDTA and dialysis. The samples were recorded in 20 mM Tris, and at varying pH values, the pH being increased by the addition of NaOH. The spectra were processed with nmrPipe [40] with Sine Bell window function. The spectra were referenced using the frequency of water (carrier frequency) at these temperatures [40], and controlled via the chemical shift of DSS, with uncertainty below 0.05 ppm. The chemical shift of all CP12 amide protons, as well as the signal intensity, were determined in NMRFAM-SPARKY [41] and exported in Octave [42]. The chemical shift dependence with temperature was fitted with the following equation:
δ H   1   ( T ) = s l o p e × T + c
where c is a constant, T is the temperature in K.

2.5. Thermodynamic of the Redox Transition

The redox mid-potentials for the transition for each pair of cysteine residues were probed by NMR as proposed in [45]. Aliquots of CP12 (50 µM) in 50 mM NaPi pH 6.5, 50 mM NaCl, 20 mM DTT pH 7 were prepared with varying ratios of DTTox to DTTred in a glovebox under an anaerobic atmosphere. The samples were left overnight at ambient temperature to reach equilibrium. The ratios of DTTox to DTTred were quantified by NMR using the proton signal intensity at 2.85 and 3.05 ppm (DTTox) and at 2.6 ppm (DTTred). 1H-15N FHSQC of each sample was recorded. The electropotential for each sample was calculated from the ratio of the concentrations of DTTox over DTTred using the Nernst equation [45]:
E h ,   p H   7 = E D T T ,   p H   7 0 + R T n F × ln ( [ D T T o x ] [ D T T r e d ] 2 )
where EDTT, pH7 is the redox mid-potential of DTT (−332 mV [45,46]), R is the gas constant (1.987 × 10⁻³ kcal K−1 mol−1) and T is the temperature (283 K), n is the number of electrons (2), and F is the Faraday constant (95,484.6 J V−1 mol−1).
1H-15N FHSQC was recorded at 283 K for all samples, the data were transformed in nmrPipe [40], and the signal intensity were obtained in NMRFAM-SPARKY [41] at the frequency of reduced C23 (δ15N: 117.632 ppm, δ1H: 8.282 ppm), reduced C31 (δ15N: 119.451 ppm, δ1H: 8.205 ppm), reduced C66 (δ15N: 121.895 ppm, δ1H: 8.284 ppm), reduced C75 (δ15N: 120.418 ppm, δ1H: 8.471 ppm), oxidized C66 (δ15N: 115.784 ppm, δ1H: 8.696 ppm), and oxidized C75 (δ15N: 116.351 ppm, δ1H: 7.948 ppm). The signal intensity of the reduced resonance as a function of the electropotential was fitted in Octave using the following sigmoidal function [46]:
I I 0 = 1 1 + e x p [ d × ( E h ,   p H 7   E C y s t e i n e 0 ) ]
where d is the steepness of the curve, which depends on the number of electrons (here 2) and the temperature (here ambient temperature). We have imposed d = 0.2 to fit our experimental data.
The signal intensity of the oxidized resonance as a function of the electropotential was fitted using the following sigmoidal function [46]:
I I 0 = 1 1 1 + e x p [ d × ( E h ,   p H 7   E C y s t e i n e 0 ) ]
The same experiment was repeated at pH 8 in 30 mM Tris, 50 mM NaCl. The redox potential of DTT is expected to change as a function of pH using the following equation [45]:
E D T T ,   p H   8 0 = E D T T ,   p H   7 0 59.1   m V
and was modified consequently in Equations (5)–(7).

2.6. Monitoring the Kinetic of Oxidation

Twenty (20) mM DTTred was added to 1 mM CP12 (50 mM NaPi pH 6.5, 50 mM NaCl, pH 7, 5% D2O) and the sample was left overnight to ensure complete reduction of the disulfide bridges. The absence of the disulfide bridge was monitored by the acquisition of a 1H-15N FHSQC. The reducing agent was then removed by a PD10 column, followed by dialysis (using 10 kDa cut-off vivaspin concentrators) with a buffer to which air was bubbled for one hour to oxidize the buffer. A series of 20 min long 1H-15N FHSQC was then recorded at 293 K. All spectra were transformed in nmrPipe [40], and the signal intensity at a frequency of reduced C23, C31, C66, C75, and oxidized C66 and C75 were obtained using the autoFit.tcl script in nmrPipe [40]. The oxidized C23 and C31 resonances are broadened beyond detection [31]. The intensities were then transferred into Octave [42], and the decrease in intensity of the reduced resonances as a function of time were fitted with the following equation using the Levenberg–Marquardt nonlinear regression function:
I I 0 = e k red ox t + c
where c is a constant and k is the rate constant of the oxidation of the cysteine residues pair.
The increases in intensity of the oxidized resonance as a function of time were fitted with the following equation:
I I 0 = c e k red ox t
where c is a constant and k is the rate constant of the oxidation of the cysteine residues pair.

2.7. Monitoring of the Kinetic of Reduction

Twenty (20) mM DTTred was added to 400 μM CP12ox (50 mM NaPi pH 6.5, 50 mM NaCl, 1 mM EDTA, 5% D2O). A series of 20 min long 1H-15N FHSQC was then recorded at 293 K. The spectra were analyzed, and the data were fitted as above. The decrease of oxidized resonance intensity as a function of time was fitted with the following equation:
I I 0 = e k ox red t + c
where c is a constant and k is the rate constant of reduction of disulfide bridges.
The increases in intensity of the reduced resonance as a function of time were fitted with the following equation:
I I 0 = c e k ox red t
where c is a constant and k is the rate constant of reduction of disulfide bridges.

2.8. Cell Extract Preparation

C. reinhardtii CC124 cells were cultured at ambient temperature (22 °C), with a 14 h light/10 h dark cycle, 110 rpm shaking for five days until they reached an absorbance at 680 nm of 1.24 (18.106 cells mL−1). Fifty (50) mL of culture were centrifuged at 2000× g for 15 min at 4 °C and resuspended in 1 mL of buffer 30 mM Tris pH 7.0, 20 mM DTTred, protease inhibitor Complete EDTA free (Roche) following the recommended concentration. The sample was again centrifuged at 2000× g for 15 min at 4 °C and resuspended in 300 μL of the same buffer and D2O was added to the sample. The sample was sonicated twice for one min on ice. Fifteen (15) μL of CP12red was added to reach a final concentration of 50 μM. The total protein concentration in the sample was measured using the Bradford assay [47]. 1H-15N FHSQC of the sample was recorded at 283 K, with proton acquisition time of 243 ms, and nitrogen acquisition time of 42 ms, on a 600 MHz Advance III NMR spectrometer equipped with a cryo-probe (Bruker, Germany). The data were transformed in nmrPipe [40] and signal intensity for each resonance was acquired in NMRFAM-SPARKY [41].
For the oxidized sample, the same procedure was applied with the following modification: C. reinhardtii cells were left for 24 h in the dark before collection. Twenty (20) mM DTTox was added to the sample instead of DTTred, as well as 0.1 mM 3-(3,4-dichlorophenyl)-1,1-dimethylurea (DCMU) (Durion). Fifteen (15) μL of CP12ox was added to reach a final concentration of 50 μM.

2.9. Diffusion Coefficient Determination

In the presence of cell extract, the translational diffusion coefficients of CP12 were recorded using DOSY-NMR selectively on the 15N labelled protein using the heteronuclear stimulated echo experiment (XSTE) from Ferrage et al. [48]. Ten experiments were recorded in a pseudo-2D fashion using bipolar square gradients of 1.4 ms (δ) of strength varying from 2 to 98% of the maximum gradient strength (G, G100% = 0.5146 T m−1) with a fixed diffusion delay of 200 ms (Δ).
In the absence of cellular extract, the same experiment was used to probe for the translational diffusion delay of isolated CP12, and the result was compared with that obtained using standard bipolar stimulated echo experiment (STE) diffusion experiment using the same parameter. The translational diffusion coefficients were identical within 4% uncertainty.
The data were processed in nmrPipe [40] and fitted to the Stejskal–Tanner equation in Octave [42]:
I I 0 = e x p [ D × ( Δ δ 3 ) × ( δ · G · γ H ) ]
where δ, Δ, and G are the gradient duration, diffusion delay, and gradient strengths defined above. γH is the proton gyromagnetic ratio (2.67 × 10⁸ rad s−1 T−1). The hydrodynamic radius associated with the diffusion coefficient was determined using the Stokes–Einstein equation:
r h = k B · T 6 π · D · η ( T )
where kB is the Boltzmann constant, T is the temperature in Kelvin, and η is the viscosity.

2.10. Determination of ΔG of Binding

The ΔG for binding of CP12ox to its partner was determined from the following equation:
Δ G = R T × l n ( [ C P 12 ] [ p a r t n e r ] [ c o m p l e x ] ) = R T × ln ( K D )
where R is the gas constant (1.987 × 10⁻³ kcal K−1 mol−1) and T is the temperature (283 K). The dissociation constant for the CP12-PRK complex is 1.3 μM, for the CP12-GAPDH complex is 0.4 nM, and for the PRK-(CP12-GAPDH) complex is 60 nM [23].

3. Results

3.1. Structural Transition of the Region Encompassing the C66–C75 Disulfide Bridge upon Oxidation of the Isolated Protein

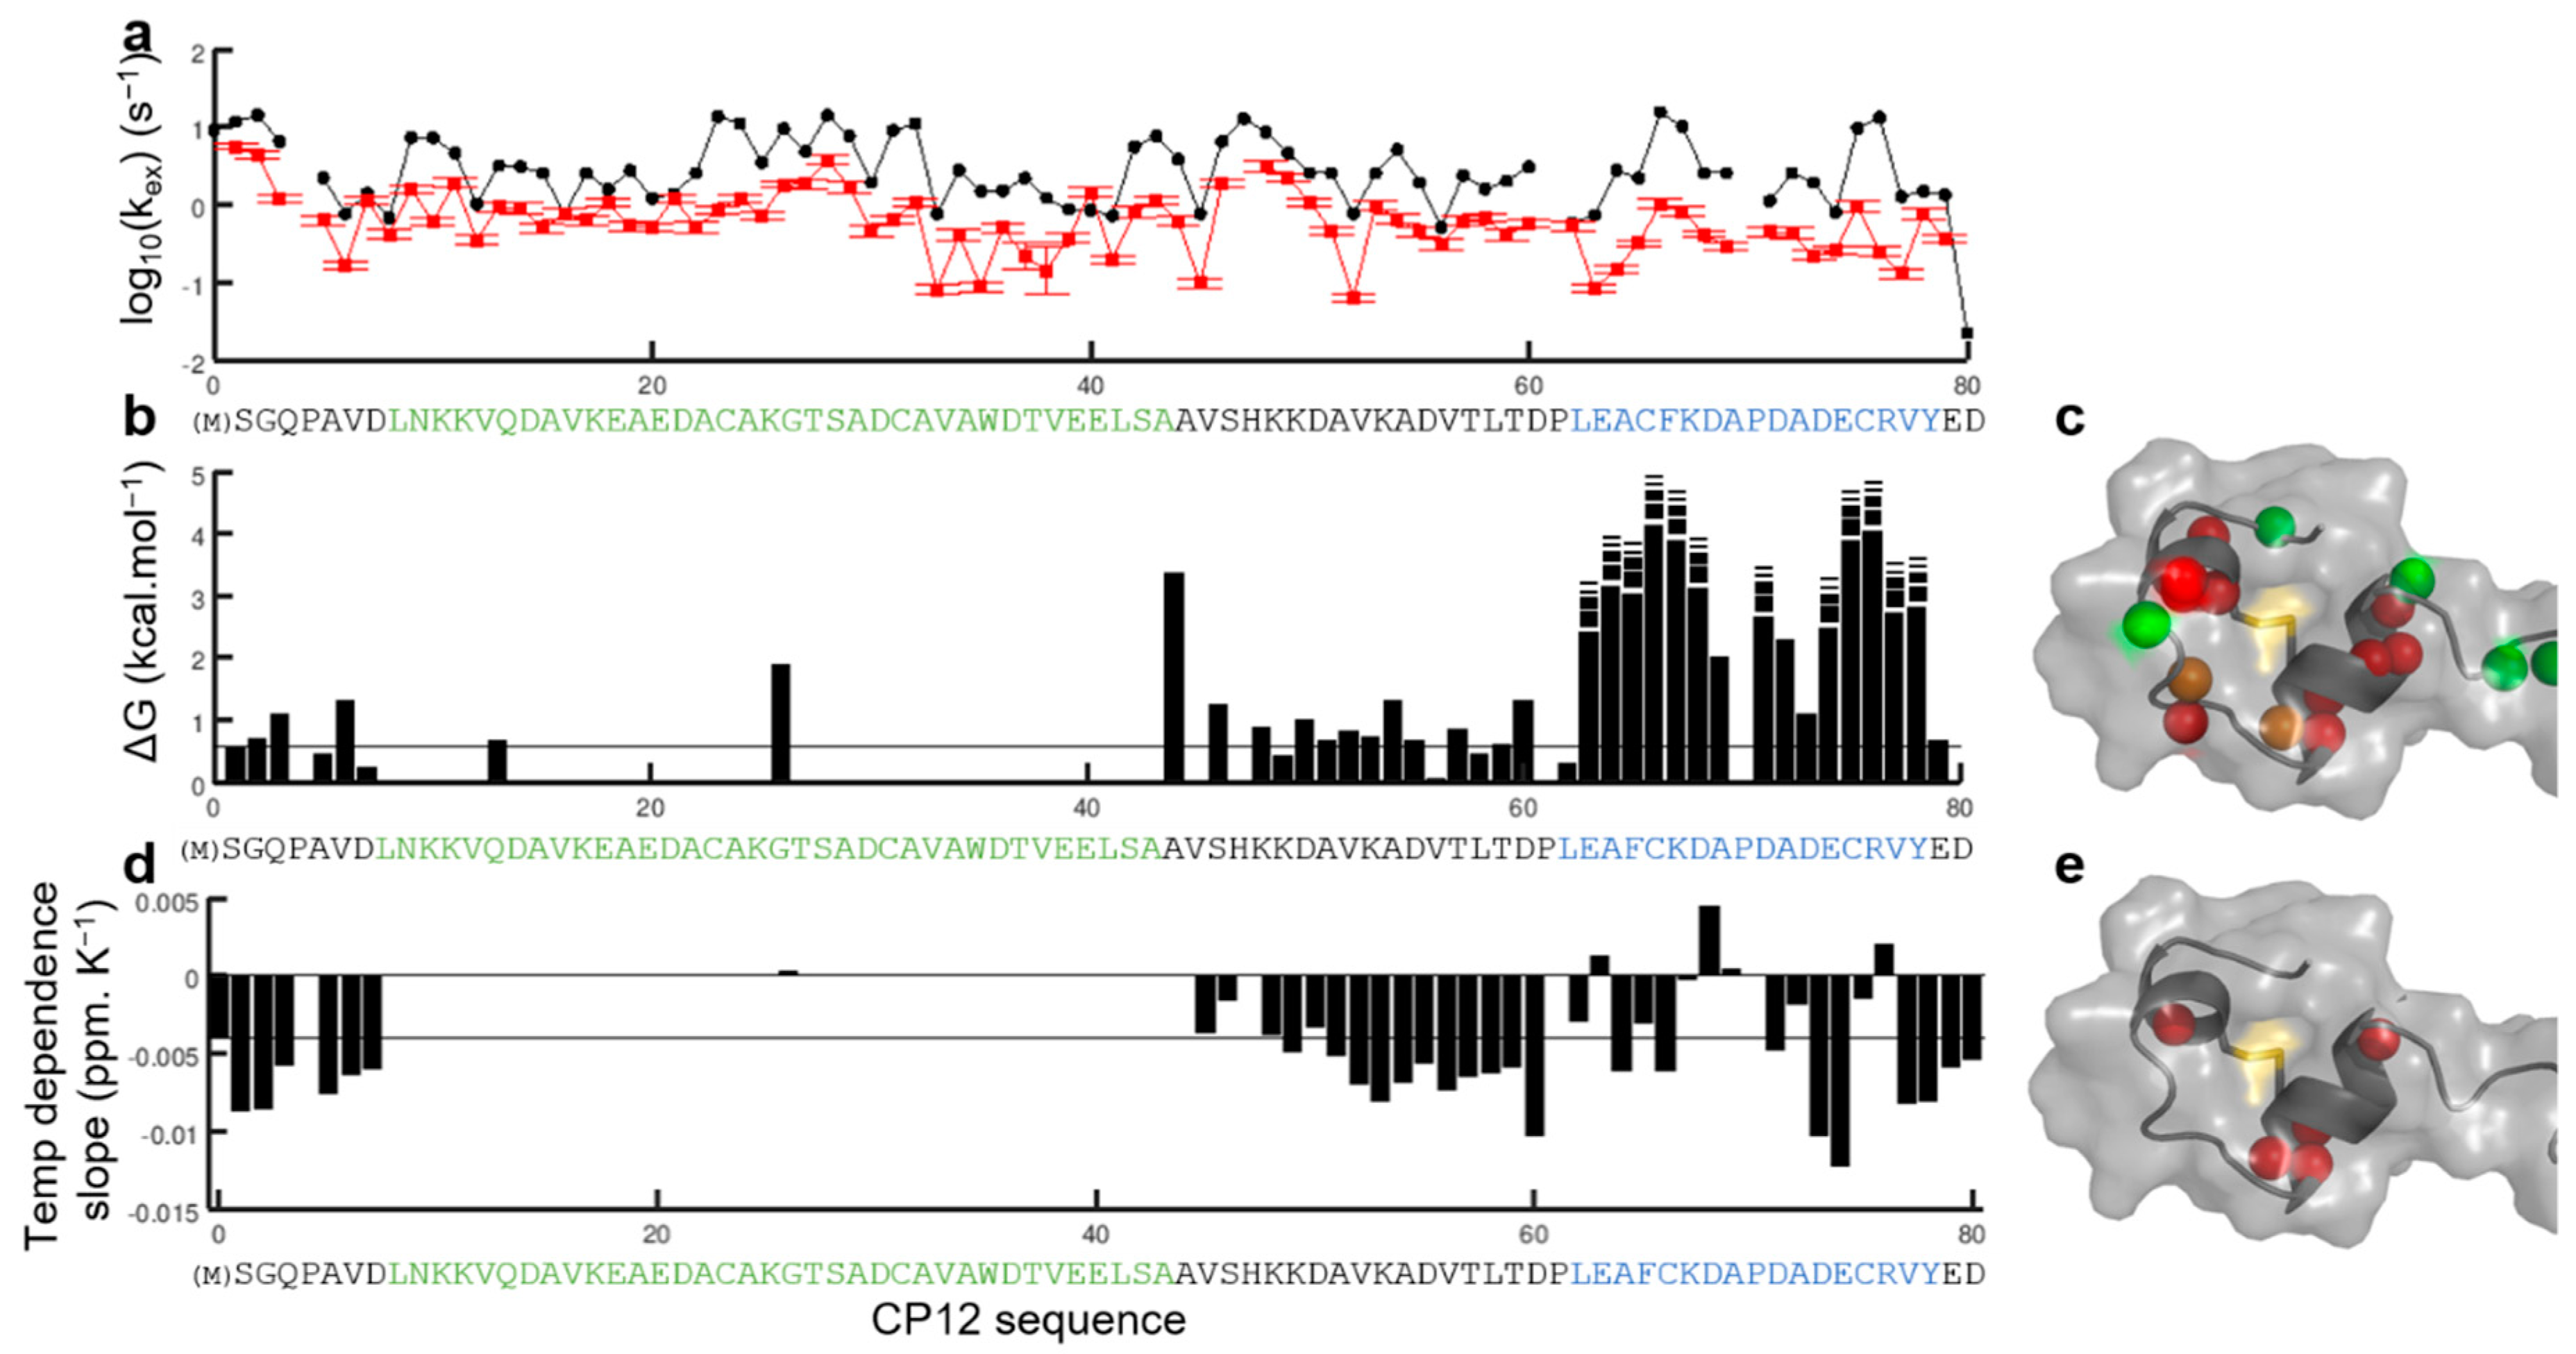
We first investigated the dynamics of CP12red by measuring the amide proton exchange rate with H2O by NMR on CP12red to probe for the protected and exposed backbone amide protons. The measured kex rates were related to very fast amide–water exchange (on the order of 6.10−2 to 3 s−1) and were only slightly lower than the predicted ones using SPHERE (Figure 2a, Figures S1 and S2), in a quasi-uniform manner. These data confirm that in its reduced state, CP12 is highly disordered [30] with amide proton exposed to the solvent, and the rate-limiting step of the exchange is the intrinsic proton exchange rate [49].
Upon oxidation, a smaller subset of protons was protected compared to the reduced state; they are all in the region that surrounds the C66–C75 disulfide bridge. These are protons from residues E63 to D68 and E74 to Y78 for which the exchange rates were beyond our detection limit, and A69 and A72 for which exchange rates were significantly lower than in the fully disordered CP12red. Assuming that the rate-limiting step for this exchange is the proton exchange (Figure S1), these exchange rates can be related to protection factors (Figure 2b). These protection factors are in good agreement with our previously described C-terminal structure [31], with the most protected amide being within the two small helical structures connected by the disulfide bridge (Figure 2c).
Interestingly, the variation of proton chemical shift according to the temperature for the same set of CP12ox residues (E63, F65, K67, D68, A69, A72, C75, and R76) had a slope more positive than −4.6 × 10⁻³ ppm K−1 (Figure 2d, Figure S4), which is also indicative of a hydrogen bond [50]. Together, these data confirm that the C-terminal region surrounding the C66–C75 disulfide bridge folds in a helical turn stabilized by H-bonds upon oxidation [31].

3.2. Structural Transition of the Region Encompassing the C23–C31 Disulfide Bridge upon Oxidation of the Isolated Protein

In the oxidized state, most residues of the N-terminal region presented a kinetic of HN→H2O exchange similar to the disordered reduced state (Figure 2b, Figures S1 and S2), contrary to the residues of the stable C-terminal region. MS measurement of the proton-deuterium exchange on CP12ox also confirmed that these N-terminal amide protons exchange very quickly with the deuterated solvent (Figure S3). The variation of chemical shift according to the temperature for these resonances all had more negative gradients than −4.6 × 10⁻³ ppm K−1 (Figure 2d), indicative of more labile protons [50], confirming the amide proton exchange measurements. These data indicated that the N-terminal region surrounding the C23–C31 disulfide bridge is highly unstable.
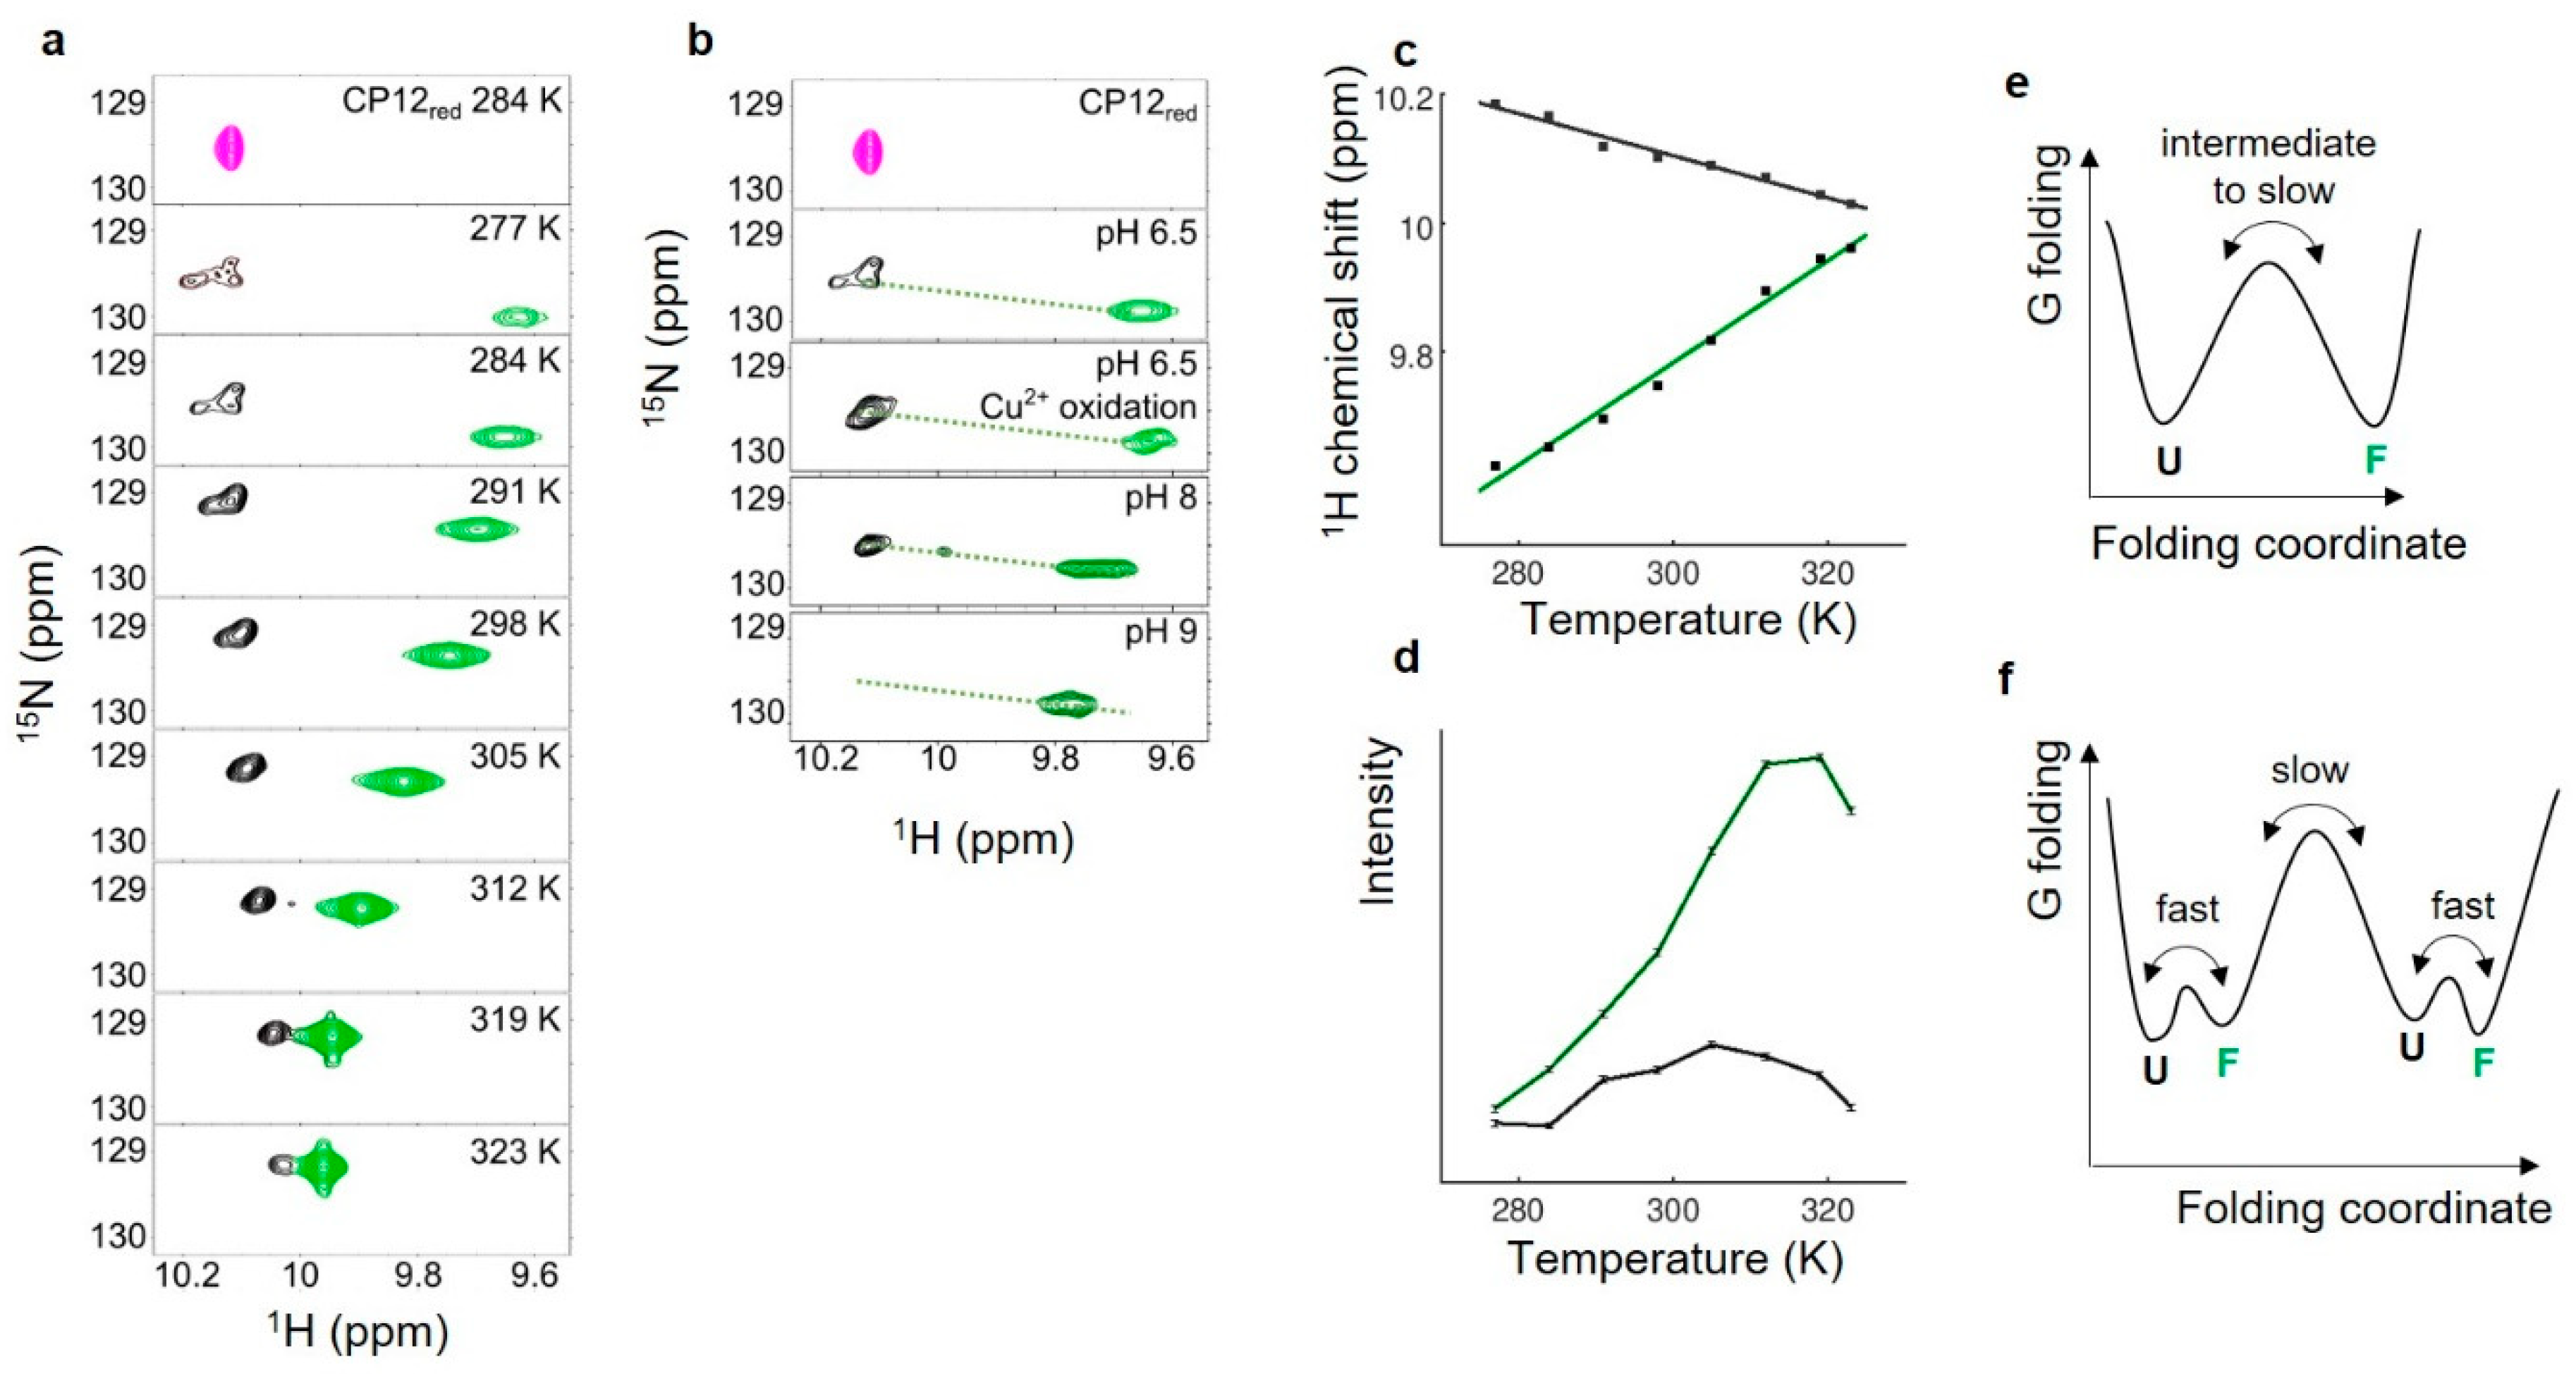
The temperature dependence of the proton chemical shift is expected to be linear for a proton in a stable conformational state [51]. For a high number of amide protons in CP12ox, the temperature dependence of the NMR frequency of amide protons of residues deviated from linearity, in particular those neighboring the dynamic N-terminal region; for example, the resonances assigned to residues A5, V45, as well as a high field-shifted glycine resonance that is putatively assigned to the single glycine of the N-terminal region G26 (Figure S4). This was also the case for several unassigned resonances that we have ascribed to the region L8-A43 [31]. Of note, a few residues of the C-terminal turn also had a non-linear temperature dependence of their amide proton chemical shift (L62, E63, A69, A72, R76, Figure S4).
The curvature in the temperature dependence of the chemical shift indicates a chemical exchange between two forms or more for which the relative population varies with temperature [51]. In line with these observations, two resonances were observed for the side chain indole amide of the single tryptophan residue at position 35 (Figure 3). One of these two resonances overlaid with that of CP12red Trp-Hε (Figure 3a). The 1H chemical shift of this resonance had a linear dependence with a negative slope of −3.3 × 10⁻³ ppm K−1 (Figure 3c), which is close to the threshold for a disordered amide [50]. To ensure that this resonance, assigned to unfolded Trp-Hε, did not arise from a fraction of reduced proteins, Cu2+ was added to the sample to fully oxidize the protein and then removed before NMR acquisition. The spectrum remained identical (Figure 3b), indicating that the unfolded Trp-Hε resonance belongs to CP12ox. The chemical shift temperature dependence of the second resonance had a positive slope (+8 × 10⁻³ ppm K−1), indicative of folded conformation. Interestingly, the difference in frequency between these two resonances assigned to the same proton decreased at high temperature, and this relates to an increase in intensity (and decrease in linewidth) for the folded Trp-Hε resonance (Figure 3c, Figure S5). The difference in frequency also decreased at higher pH (Figure 3b), and the resulting resonances at pH 8 and 9 fell in a linear chemical shift pattern defined by the two above-mentioned unfolded and folded Trp-Hε resonances [52,53]. This behavior is strongly indicative of a chemical exchange between a disordered and a folded conformation. The broad linewidth of these two resonances, and their almost co-linear displacement, relates to an intermediate with a slow timescale for their interconversion, which can be complex (Figure 3f), and this interconversion becomes faster at higher temperature and higher pH [54].

3.3. Structural Properties of CP12red in the Presence of C. reinhardtii Cell Extract

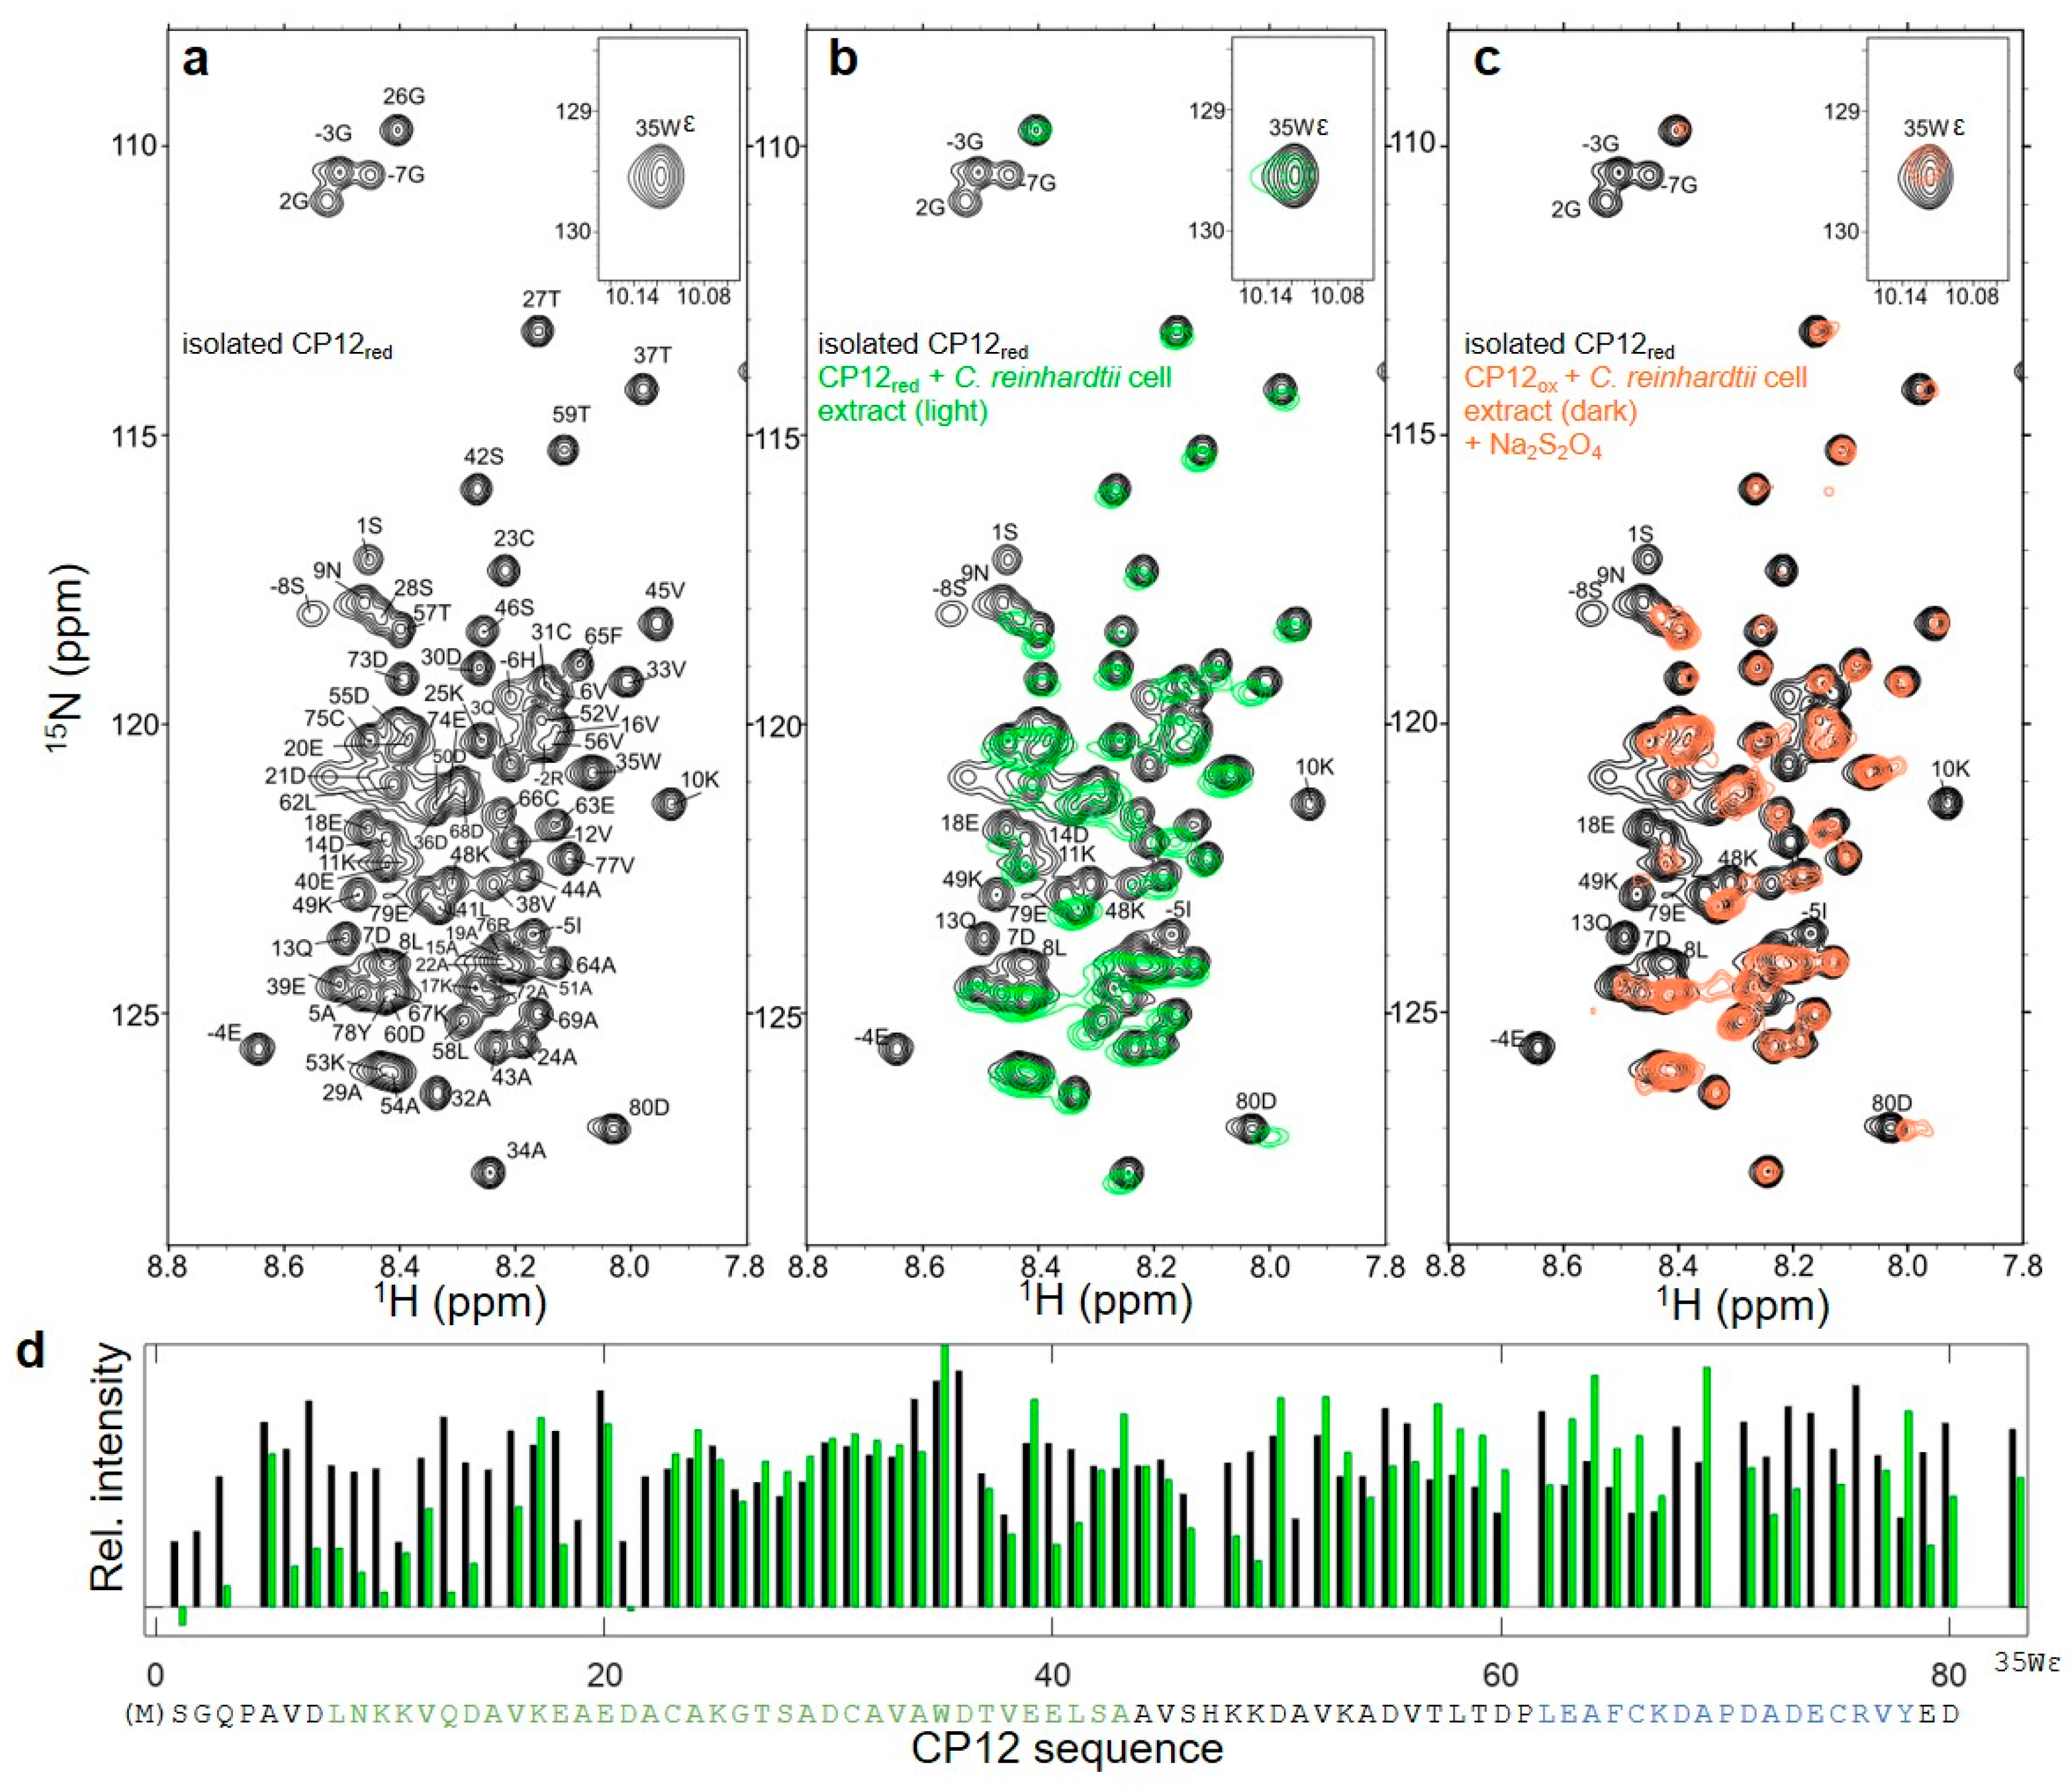
CP12 is located in a highly crowded organelle, the chloroplast, and we aimed at grasping the effect of the macromolecules present in its physiological environment on the structural states of CP12 in its reduced (light) and oxidized (dark) states. To mimic the chloroplast environment, we thus added crude cell extract at high concentration (15 to 19 mg mL−1 of protein) to purified 15N-CP12 such that the observed CP12 protein represents 2 to 3% of the total mass of protein. On the reduced and disordered protein, there was no significant chemical shift displacement, indicating that the protein remains in a disordered state (Figure 4b), with the exception of the last two resonances, E79 and D80. The resonances of the N-terminal residues up to K17 including the His-tag were broadened beyond detection compared to the isolated protein (Figure 4d). Other resonances were broadened in the presence of cell extract compared to the isolated protein: E40 and L41, K48 and K49, as well as few resonances of the C-terminal region (D70 to D72, C75, and the last two residues E79, D80). On the contrary, the region C31–A34 did not present any chemical shift variation, or specific line-broadening in the presence of cell extract. The translational diffusion coefficient at 4 °C of reduced 15N-CP12 in the presence of cell extract was less than 2 × 10⁻¹¹ m2 s−1, which is significantly lower compared to that of the isolated reduced protein (9.3 ± 0.15 × 10⁻¹¹ m2 s−1, Figure S6).

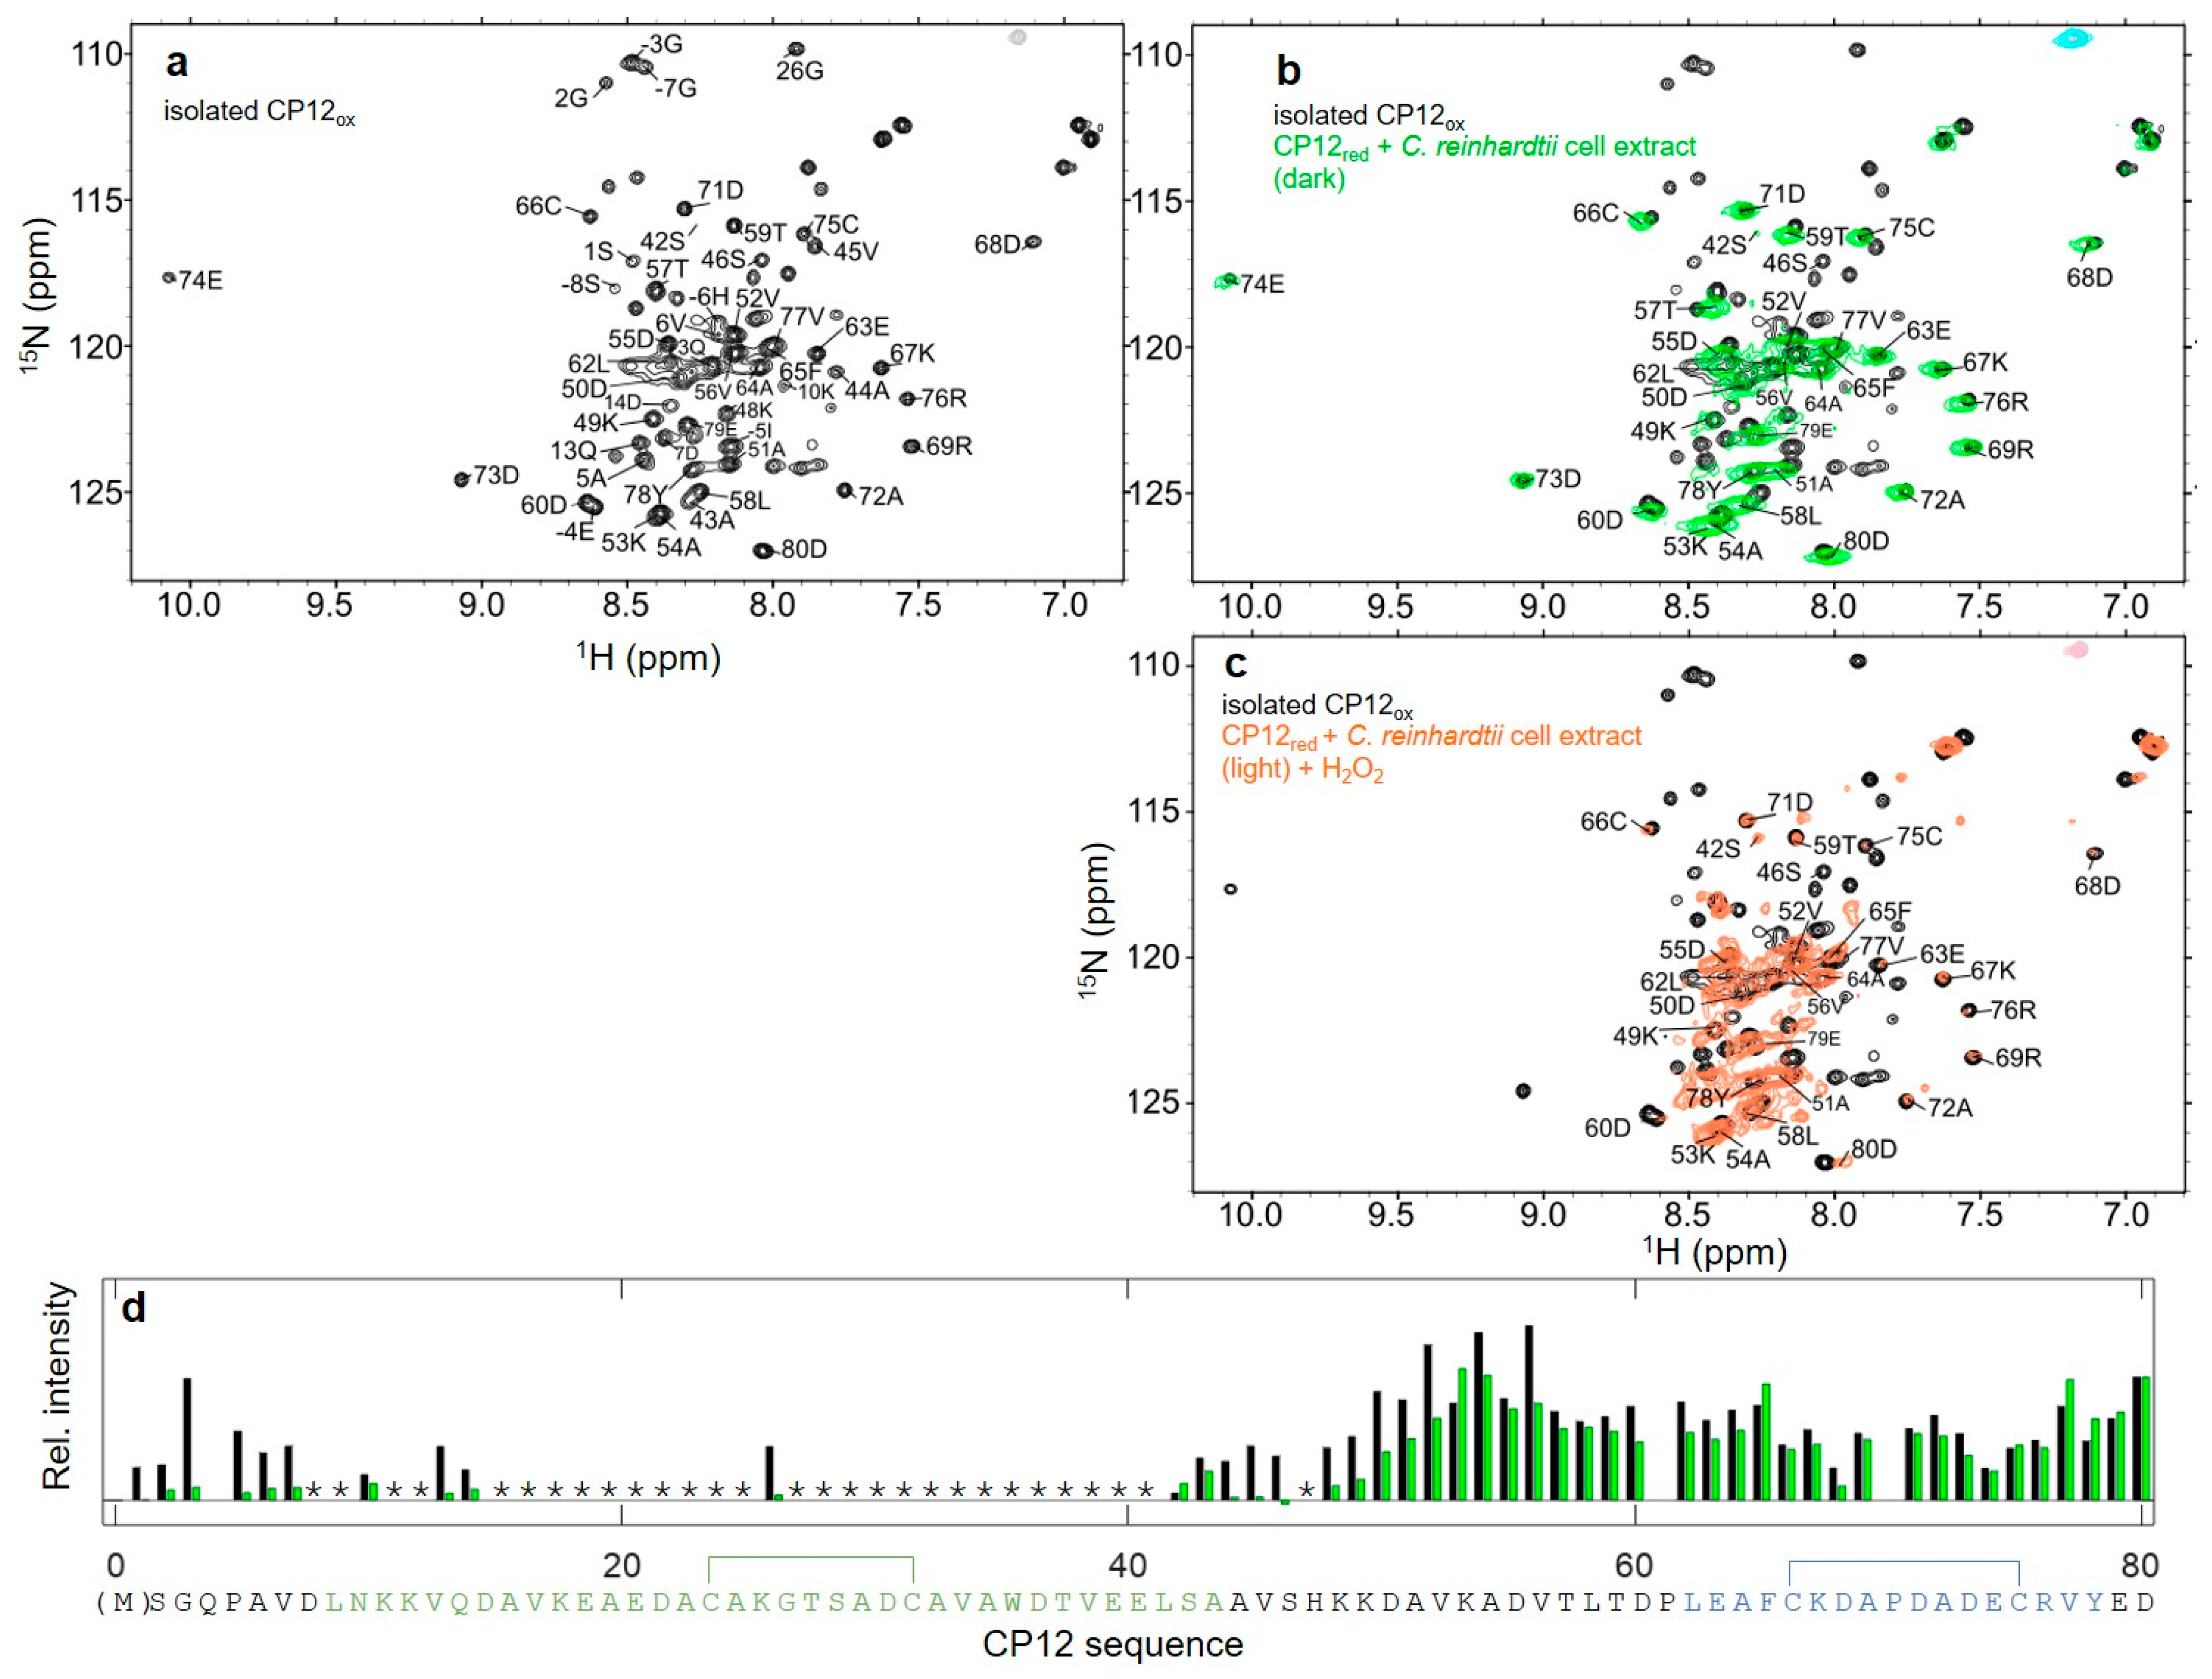
3.4. Structural Properties of the C66–C75 Disulfide Bridge in CP12ox in the Presence of C. reinhardtii Cell Extract

The 1H-15N HSQC spectrum of oxidized and partially folded CP12 in the presence of cell extract also remarkably resembles that of the isolated protein (Figure 5b). As for CP12red, the His-tag and the N-terminal residues’ (up to D14) resonances were also broadened beyond detection in the presence of cell extract (Figure 5d). On the contrary, the C-terminal region (from K53 onwards) presented relatively narrow linewidths and identical chemical shifts as compared to the isolated protein. The resonances for the residues A15 to S42 were broadened beyond detection both in the isolated protein and in the presence of cell extract. On the isolated protein, resonance linewidths were large up to residue S42, but in the presence of cell extract, resonance linewidths were large for all residues until D50. The translational diffusion coefficient at 4 °C of oxidized 15N-CP12 in the presence of cell extract was 4 ± 0.5 × 10⁻¹¹ m2 s−1, which is significantly lower compared to that of the isolated oxidized protein (9.8 ± 0.2 × 10⁻¹¹ m2 s−1, Figure S6).

3.5. Thermodynamical Properties of the Redox Transition of Both Disulfide Bridges in Isolated CP12

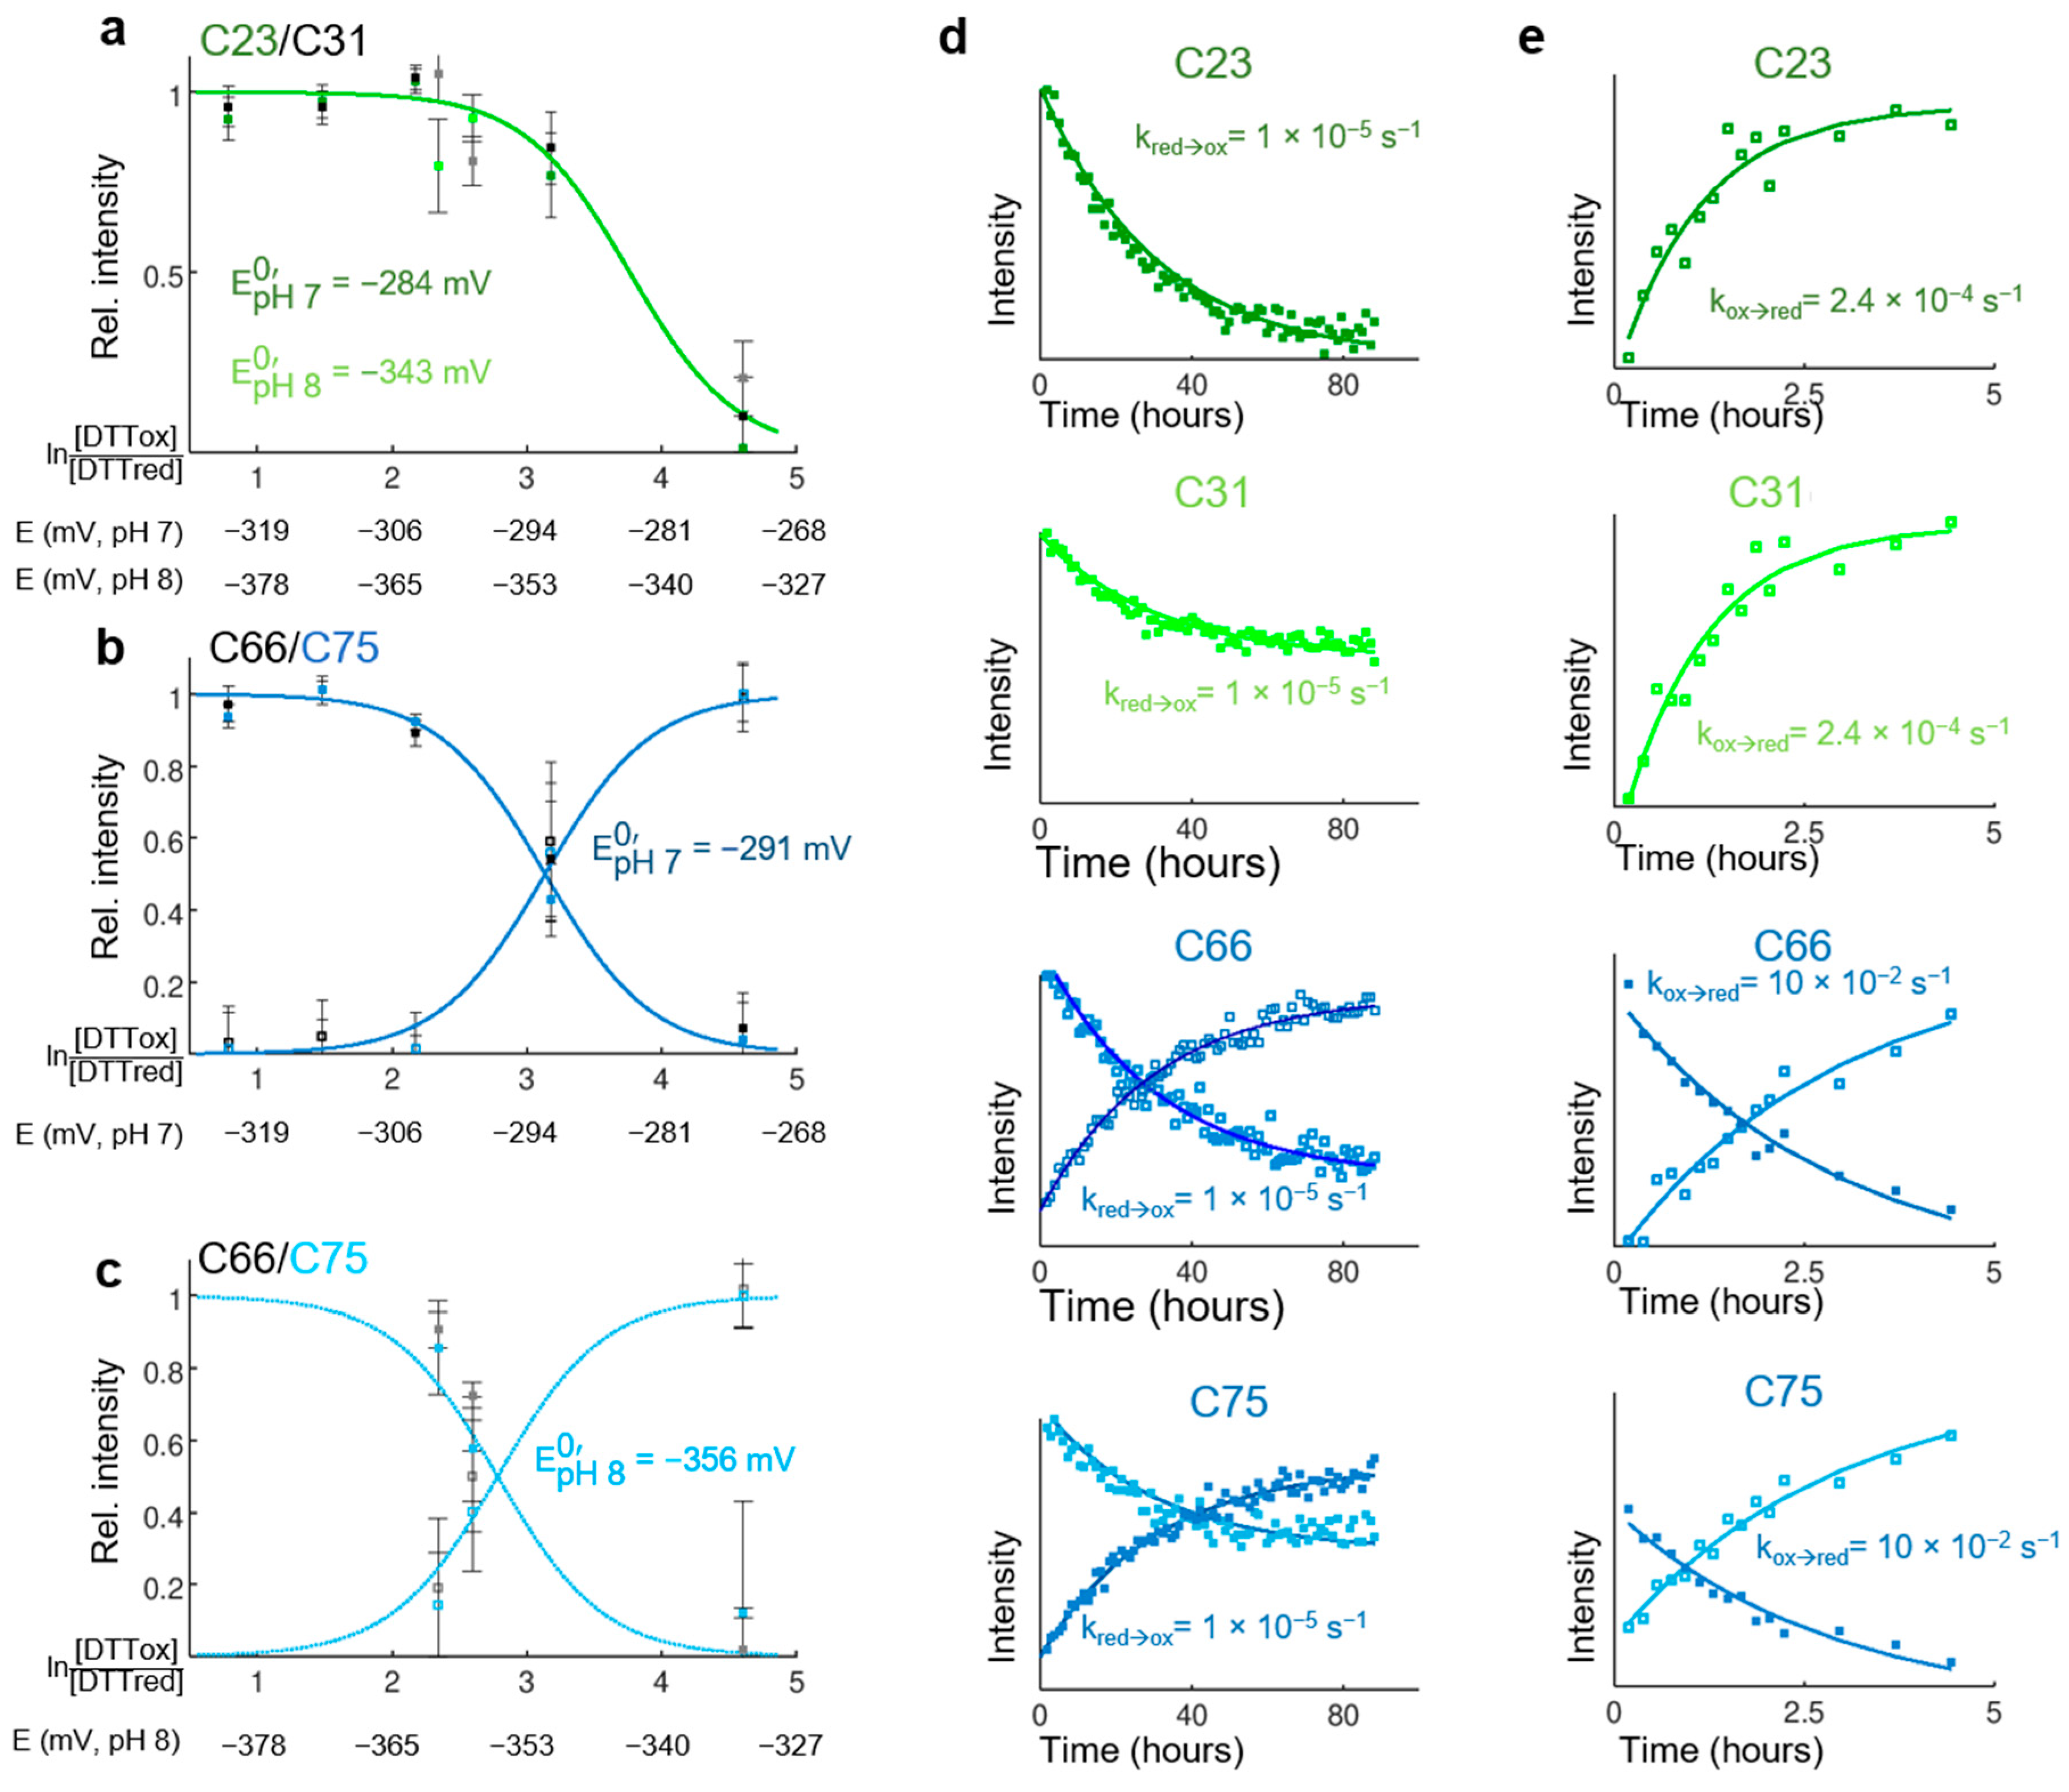
CP12 is a CDP, and its function is related to the significant structural transition upon reduction or oxidation of the two cysteine residues pair. From the above results, we showed that the two disulfide bridges are located into two structurally distinguishable regions separated by a flexible linker. We monitored the thermodynamical properties of these two disulfide bridges using a titration with the redox mediator DTTox/DTTred [45,55] on isolated CP12. Surprisingly, the use of the well-known redox mediator GSSG/GSH was not possible because the redox transition was not reversible with this mediator [45]. The standard redox mid-potentials at pH 7.0 were −284 mV for the C23–C31 cysteine pair (Figure 6a) and −291 mV for the C66–C75 pair (Figure 6b). The variation of the standard redox mid-potential of the N-terminal pair followed the expected pH-dependence for a disulfide bridge (−59.1 mV per pH unit [45], Figure 6a). On the contrary, the redox mid-potential measured at pH 8 for the C-terminal disulfide bridge was more negative than expected (Figure 6c), indicating a possible pH-induced stability for the C-terminal folded oxidized state.

3.6. Rate of Oxidation and Reduction of Both Disulfide Bridges in Isolated CP12

Using NMR spectroscopy, we followed the kinetic of oxidation or reduction of each disulfide bridge of isolated CP12 upon changing the redox potential of the solution by exchange into a buffer that has been bubbled with air or upon addition of 20 mM DTTred. The rates of oxidation for both disulfide bridges were identical, indicating their synchronization (Figure 6d, Figure S7). In contrast, the reduction of the N-terminal bridge was much faster than that of the C-terminal bridge, indicating asynchrony in their reduction (Figure 6e, Figure S8). These rates measured on the isolated protein are not representative of those in the cell, where redox transitions are catalyzed by the complex Trx network but reflect the structural stability of both regions encompassing the two respective disulfide bridges.

3.7. Reversible Redox Transition of CP12 in the Presence of C. reinhardtii Cell Extract

Upon addition of crude cell extract from cells exposed to 24 h of dark, the 15N-CP12ox protein was highly unstable, and its 1H-15N spectrum was quickly converted and overlaid that of CP12red within 20–40 min, even when 20 mM DTTox was added. This indicates that the electron transfer of the photosynthesis was active in these crude cell extracts and can activate the Trx network, resulting in the reduction of DTT and CP12 when cells were transferred from dark to the spectrometer. We therefore added 0.1 mM DCMU, a PSII inhibitor, that inhibits photosystems II and electron transfer reactions, and this prevented CP12 reduction.
We monitored the kinetic of the redox transition triggered by strong reducing or oxidizing agents (in the presence of DCMU not to interfere with the Trx network). When dark extracts were exposed to strong reducing conditions (20 mM Na2S2O2), the 1H-15N spectrum of the protein was quickly converted and overlaid that of CP12red (Figure 4c). Reciprocally, when light extracts were exposed to oxidizing conditions (20 mM H2O2), the 1H-15N spectrum of the protein was quickly converted within 20 min and overlaid that of CP12ox (Figure 5c). Together, these results show that both oxidized-to-reduced and reduced-to-oxidized transitions of CP12 are very fast in C. reinhardtii cell extracts, in contrast to isolated CP12, very likely resulting from the presence of Trxs in the extracts.

4. Discussion

CP12 is present in the chloroplast of photosynthetic organisms from cyanobacteria, green and red algae, higher plants, as well as heterokonts [27,28,32]. Various functions have been assigned to this protein, in particular, the dark down-regulation of two CBB enzymes: GAPDH and PRK, as well as their fast re-activation upon dark-to-light transition [22]. Genetic and proteomic studies on higher plants and heterokonts suggest that CP12 has other functions, for example, related to stress regulation [32,56,57,58,59]. The enigmatic and multiple functions of CP12 is not an unusual property for a protein belonging to the CDP family [1]. In this study, the structural transitions of CP12 at the molecular level occurring upon change in redox potential, which is the basis for its proposed regulatory functions, are reported.

4.1. Isolated CP12red Is Intrinsically Disordered

In the light, photosystems I and II produce a strong reducing potential that affects the chloroplastic proteins via the Fdx-dependent Trx [60], and this network is probably the best-studied within the chloroplast [61]. Under reducing conditions, we recorded the amide proton exchange rate with solvent by NMR and MS for the purified CP12 and these data confirmed that the unfolded reduced state of CP12 is highly flexible (Figure 2a), confirming our earlier observations with SAXS and NMR spin-relaxation experiments [30,31]. The absence of pre-formed motif is also confirmed in this study by the homogeneous NMR resonance intensity for all CP12red residues (Figure 4d). Indeed, the existence of a small proportion of pre-formed motifs would give rise to selective broadening of the NMR resonances [30,62]. Together, these data confirm that CP12red is intrinsically disordered (Figure 7a).

4.2. The Two Disulfide Bridges Are in Regions with Distinct Structural Properties in Isolated CP12ox

In the dark, oxidizing conditions prevail in the chloroplast [61], principally because the source of electrons (water splitting) does not occur and so does not fuel the Fdx-dependent Trx system. Oxidation of chloroplast proteins is then catalyzed by both the Fdx-dependent and the NADPH-dependent Trx systems. In the case of CP12, the four cysteine residues form two disulfide bridges. Our results showed that the C-terminal disulfide bridge (C66–C75) is located in a region in which amide protons are highly protected against solvent exchange (Figure 2b). This confirms that this region, encompassing residues L62–Y78, is highly stable, as we have previously shown by NMR spin-relaxation measurements [31] (Figure 7b). The N-terminal disulfide bridge (C23–C31) is in a region that remains highly dynamic, as shown here by the absence of protection against amide proton exchange by NMR and MS (Figure 2b, Figure S3). As shown previously for C. reinhardtii and A. thaliana CP12 proteins, the residues of this long N-terminal region, encompassing residues L8–A44, gives rise to broad NMR resonances [29,31]. We used the resonances from the unique tryptophan side chain to probe for the origin of this line broadening. Two resonances are observed (Figure 3). One resonance that is the most downfield overlays with that of the same proton in CP12red. Its variation with temperature follows what is expected for a residue in a disordered region [50,51]. Additionally, this resonance is not observed at pH 9, and this is also indicative of fast amide proton exchange with water, and therefore an absence of structure [67]. The second resonance is always observed, even at high pH, and varies with temperature with a positive slope, which is indicative of hydrogen bonds (Figure 3) [50,51]. Together, these data confirm our previous SAXS analysis that suggested that the N-terminal region can be either disordered or folded [31]. When oxidizing conditions prevail in the chloroplast, the pH in the stroma decreases to pH 7 [68]. Such a drop in pH induced a displacement of the resonances arising from Trp-Hε within a linear chemical shift pattern defined by the above-mentioned two resonances with a larger difference in intensity (Figure 3b). This displacement is accompanied by a decrease in linewidth and an increase in signal intensity. This indicates that the speed of interconversion between the two states is modified at high pH and becomes slower in NMR intermediate exchange timescale (μs-ms) [52,53,69], as we have previously suggested based on NMR spin relaxation experiments [31].
Altogether, these data suggest that in its oxidized state, CP12 is in an atypical conformational ensemble, in which the C-terminal region (L62–Y78) is highly stable, whereas the N-terminal region (L8–A44) co-exists in folded and unfolded states in a complex exchange in the ms timescale (Figure 7b). In other word, the C-terminal region of CP12 undergoes a complete disorder-to-order transition upon increasing the redox potential, as described for several redox-dependent CDPs [3]. In contrast, the N-terminal region is not fully ordered in the oxidized state. For this region, the folded state is only partially stabilized under oxidizing conditions. Our previous SAXS analysis suggested a relative proportion for the disordered and ordered conformation of 40%:60%, and our current temperature- and pH-dependent analysis suggest that this equilibrium is strongly dependent on the physico-chemical conditions (Figure 7b). These two regions (folded C-terminal helical turn and highly dynamic N-terminal region) are separated by a flexible linker of ten residues (D50–D60) that also delimits two regions of interaction with different partners.

4.3. The Distinct Regions of CP12ox Differ in Structural Dynamics and in Affinity for Their Interacting Partners

CP12ox associates and inhibits PRK and GAPDH in a ternary complex [23]. The structure of this complex has been solved recently for proteins from A. thaliana [26] and from the cyanobacterium Thermosynechococcus elongatus [25]. In these structures, the C-terminal region of CP12ox folds into a helical turn that is identical to the stable structure that we have computed from NMR data [31]. The very high affinity for the C-terminal region of CP12 for GAPDH (sub nM) relates to a low ΔG of −12.7 kcal mol−1, a value that is below the mean value for complexes between two ordered proteins from ~200 studies [70] (Figure 7c). In contrast, the N-terminal region has a much lower affinity for PRK (−1.3 μM) [23], which relates to a higher ΔG of −8 kcal mol−1. This value of ΔG is identical to the mean value for complexes between an ordered and a disordered protein [70]. The CP12ox binding region with PRK is located in the unstable and highly dynamic N-terminal region [24]. In line with the above-described structural dynamic for this region in the isolated protein, in the crystal structure of the PRK-CP12-GAPDH from A. thaliana [26] and in the cryo-electron microscopy structure from T. elongatus [25], the least resolved regions are the interaction surfaces between CP12 and PRK. Altogether, the interface between Nter-CP12ox and PRK seems to be highly dynamic contrary to the Cter-CP12ox interface with GAPDH, and these result from the relative structural stability of these two regions.
The two structurally and functionally distinguishable regions of CP12, a stable C-terminal helical turn and an unstable N-terminal region, fused via a flexible linker, offer a complex and tightly controlled mechanism to regulate the two binding partners. Interestingly, photosynthetic organisms possess CP12 homologs where only the C-terminal region (C66xxxP70xxxC75) is fused to other enzymes such as GAPDH-B isoforms [71] or adenylate kinase, ADK3 [72,73]. This latter protein also binds to GAPDH with a high affinity. In addition, other organisms possess CP12 homologs that only contain the conserved N-terminal motif A34WxxVEEL41 that is embedded in the dynamical PRK-binding region defined above [27,32], but the function of these proteins remains to be elucidated.

4.4. Thermodynamically Independent and Reversible Redox Transition of Both Disulfide Bridges in CP12

As mentioned above, the principal known function for CP12 is the redox regulation of CBB enzymes in the chloroplast. Here, we report on redox titrations by NMR that demonstrated that the four conserved cysteine residues of CP12 from C. reinhardtii could form two intermolecular disulfide bridges with different redox mid-potentials (Figure 7d). The redox mid-potential for the C23–C31 cysteine residues pair ( E p H   8   C . r   N ter 0 = −343 mV) is more negative than those measured for the N-terminal disulfide bridge of A. thaliana CP12 isoforms ( E p H   7.9   A . t   N ter 0 = −326 mV in the two isoforms CP12-1 and CP12-2 and E p H   7.9   A . t   N ter 0 = −332 mV in the isoform CP12-3 [65]), analyzed from redox titrations using 5,5′-dithiobis(2-nitrobenzoic acid) to detect thiol groups. The redox mid-potential for the C. reinhardtii C-terminal disulfide ( E p H   8   C . r   C ter 0 = −356 mV) is intermediate with that found for the isoforms CP12-1 and CP12-2 of A. thaliana ( E p H   7.9   A . t   C ter 0 = −350 mV) and that found for the isoform CP12-3 ( E p H   7.9   A . t   C ter 0 = −373 mV) [65]. These more negative values in the algal CP12 redox mid-points contradict the previous observation that the redox potentials of Trxs in the alga are less negative than the higher plant counterpart [74]. Whether or not the different techniques are responsible for these differences needs to be investigated. Above all, and similar to what has been observed for A. thaliana, our results indicate that the N-terminal disulfide in C. reinhardtii requires fewer reducing conditions to dissociate than the C-terminal disulfide, i.e., in thermodynamic terms, the N-terminal disulfide is easier to reduce than the C terminal disulfide.
During light to dark transition, partially oxidizing conditions would cause the formation of the C-terminal disulfide of CP12 ( E p H   8 0 = −358 mV) and then favor the formation of the binary complex A4-GAPDH-CP12 (Figure 7c,d). At these electropotential values, the A4-GAPDH tetramer from A. thaliana ( E p H   7.9   A 4 GAPDH 0 = −335 mV) would be reduced, but the A2B2-GAPDH tetramer that contains a CP12 homolog extension would be oxidized ( E p H   7.9   A 2 B 2 GAPDH 0 = −359 mV) [64]. The redox mid-potential of CP12 C-terminal bridge is consistent with the hypothesis proposed in [17] that CP12 is a redox mediator for GAPDH regulation. On transition to darkness, oxidation of Trxs would lead to the formation of the N-terminal disulfide bridge in CP12 ( E p H   8   N ter 0 = −343 mV), allowing the PRK-CP12-GAPDH to form, and afterwards, the regulatory disulfide in PRK would form ( E p H   7.9   PRK 0 = −333 mV) [63]. These results provide key insights into the biological assembly and regulation of this ternary complex.

4.5. Asynchrony of the Reduction of the Two Disulfide Bridges, Synchrony of Their Formation

From a kinetic point of view, the rates of oxidation of the cysteine residues at the N- and C-terminal extremities were similar, which validates the above discussion on equilibrium. In contrast, the rates of reduction were different (Figure 7e). The synchrony of oxidation can be explained by the fully disordered nature of the reduced form. Similarly, the asynchrony of reduction can be explained by the dual nature of CP12ox with a very dynamic N-terminal end, being prone to fast reduction, and a stable C-terminal helical turn less prone to reduction. On the isolated CP12, these processes, oxidation and reduction, were slow. In contrast, in cell extracts, that is, in CP12 physiological environment with active cellular redox-mediators, the redox transitions were much faster [17]. It would be interesting to compare the rate of thiol reduction in the cell (kinetics of CP12 thiol to disulfide transition) with the rate of reduction of the electropotential in the chloroplast upon dark to light transition [15], as this could provide a further fine regulation of CBB enzyme activity.

4.6. Effect of Cell Extract on Nter-CP12 and Cter-CP12

Within the chloroplast, redox modulation is clearly open to modification by a number of other parameters such as stromal pH, Mg2+, and metabolite concentrations, and above all, crowding. The chloroplast contains numerous phases including starch granules, thylakoid membranes [75], pyrenoid (the liquid non-membranous compartment containing the ribulose-1,5-bisphosphate carboxylase oxygenase) [76,77], as well as natural deep eutectic molecules with an extremely high local concentration [78,79,80]. The physico-chemical conditions prevailing in the chloroplast stroma therefore have to be taken into account when trying to unravel the processes of protein folding. CP12 is present in the chloroplast of A. thaliana both in the light and the dark [81]. We attempted to characterize the effect of the chloroplast environment on both CP12red and CP12ox by adding C. reinhardtii cell extract to purified 15N-CP12. The cytoplasm of C. reinhardtii is very limited in volume compared to other eukaryotic cells [82], so chloroplast molecules contribute to a major fraction of the cell extract. In addition, the interaction network of CP12 is expected to be present in cell extract as it has been previously shown that sonication does not break the networks of interactions between partners [83].
We observed the structural state of CP12 in a large excess of C. reinhardtii cell extract (2 to 3% of protein are 15N-CP12 in a total protein concentration of 15 to 19 mg mL−1). We observed that CP12red in cell extract remains disordered, with a few residues being affected. Some residues present specific line-broadening of their NMR resonances (for example the N-terminal residues, E40–L41, K48–K49), and this could be ascribed to specific binding of molecules with CP12red. In the literature, no binding partners for CP12red have been identified, possibly because, if they exist, their affinity to CP12 is weak, as is often the case for disordered proteins [70]. These affinities might increase within the cell, giving rise to the observed line-broadening. Indeed, molecular crowding is known to increase the equilibrium constants of association events [84,85]. For example, the association equilibrium constant for the dimerization of a 40 kDa monomer is 8 to 40-fold higher if the protein is in E. coli cytoplasm, where the concentration of proteins is extremely high (200 to 320 mg mL−1), compared to the same phenomenon in an aqueous solution [86].
In the presence of oxidized cell extract, only the stable C-terminal helical turn is observed in the NMR spectrum (Figure 5). This could be because the region concerned with line-broadening ascribed to the millisecond-timescale equilibrium on the isolated protein (L9–A43) is expanded in the presence of cell extract (N-terminal to D50). CP12ox thus behaves like many proteins that were shown to be more thermodynamically stable in the presence of crowding agents because of excluded-volume effects and higher chances of intra-molecular interactions [87]. Another origin for line broadening could be the association within a macro-molecular complex as discussed above for CP12red.
The translational diffusions of both CP12ox and CP12red are also dampened by the presence of C. reinhardtii cell extract (Figure S6) and are reduced two-fold for CP12ox and by more than five-fold for CP12red. The macromolecular concentration in our experiment was 15 to 19 mg mL−1 of protein, and an increase in viscosity is thus expected. Ordered proteins are expected to be more affected by the increase in viscosity than disordered proteins [88,89], but this is not the case for the partially folded CP12ox that is less affected than the disordered CP12red. A succession of association-dissociation events with several chloroplast partners can also explain this very slow diffusion. The presence of broadened resonances in both spectra, as discussed above, indicates the presence of such association-dissociation events. Surprisingly, diffusion of CP12red is more affected than CP12ox, and this may suggest a higher number of weak (specific or not) interaction events for the disordered reduced state.

5. Conclusions

We have shown here that CP12 can regulate association/dissociation with two of its known partners via a range of equilibria: a folding equilibrium that is modulated according to redox potential, pH and temperature, as well as two binding equilibria. Because these regulatory processes respond to subtle changes in the physico-chemical conditions of the CP12 environment, it is important to report on these in more physiological relevant conditions, as we have initiated here using cell extracts. Performing in cell NMR would be ideal, as this has been done for bacteria, yeast, oocyte, and mammalian cells [90], but it has remained a real challenge for photosynthetic cells [91]. The main question remains: where is CP12 in the chloroplast? Protein spatial organization in C. reinhardtii chloroplasts have been described by Mackinder et al. [75,92] but these studies have not localized the enigmatic CP12 protein. Moreover, to complete our preliminary attempt to reconstitute the chloroplast environment, further investigations are required to understand the structural mechanisms that promote highly regulated unfolding-folding transitions under specific physiological conditions, including not only redox but also pH, temperature, and metabolites to finely tune the photosynthetic metabolism.

Supplementary Materials

The following are available online at https://www.mdpi.com/article/10.3390/biom11050701/s1, Figure S1: Amide proton exchange NMR data, Figure S2: Solvent-amide proton exchange rates, Figure S3: Amide proton exchange with deuterium probed by MS, Figure S4: Temperature dependence of the proton chemical shift for CP12ox resonances, Figure S5: Temperature dependence of the signal intensity for CP12ox resonances, Figure S6: Hydrodynamics of CP12ox and CP12red measured by DOSY-NMR, Figure S7: Real-time monitoring of the oxidation for all CP12 residues, Figure S8: Real-time monitoring of the reduction for all CP12 residues.

Author Contributions

Conceptualization, H.L. and B.G.; investigation, H.L., H.S., O.B., F.-X.C. and R.L.; methodology, O.B., F.-X.C. and R.L.; resources, H.S., O.B., F.-X.C. and R.L.; supervision, H.L. and B.G.; validation, H.L., V.R.-B. and B.G.; writing—original draft, H.L. and B.G.; writing—review and editing, H.L., R.L., V.R.-B. and B.G. All authors have read and agreed to the published version of the manuscript.

Funding

This research was funded by A*MIDEX, grant number AAP-IM2B-NE-2020-02-Launay. Financial support from the TGIR-RMN-THC Fr3050 CNRS is gratefully acknowledged. This work is supported by the CNRS. HS scholarship was founded by the Chinese Scholarship Council (201704910795).

Institutional Review Board Statement

Not applicable.

Informed Consent Statement

Not applicable.

Data Availability Statement

Not applicable.

Acknowledgments

We would like to thank Remy Puppo and Mathilda Daguze for experimental help. Financial support from the TGIR-RMN-THC Fr3050 CNRS is gratefully acknowledged. We would like to thank Christopher Waudby, Lewis Kay, and Enrico Rennella for sharing their NMR pulse sequences. We would like to thank Frederic Carriere for inspiring and fruitful discussions and Stephen Maberly, for checking the English.

Conflicts of Interest

The authors declare no conflict of interest.

References

  1. Jakob, U.; Kriwacki, R.; Uversky, V.N. Conditionally and Transiently Disordered Proteins: Awakening Cryptic Disorder to Regulate Protein Function. Chem. Rev. 2014, 114, 6779–6805. [Google Scholar] [CrossRef] [PubMed] [Green Version]
  2. Smith, L.M.; The Consortium for Top Down Proteomics; Kelleher, N.L. Proteoform: A single term describing protein complexity. Nat. Methods 2013, 10, 186–187. [Google Scholar] [CrossRef] [PubMed] [Green Version]
  3. Reichmann, D.; Jakob, U. The roles of conditional disorder in redox proteins. Curr. Opin. Struct. Biol. 2013, 23, 436–442. [Google Scholar] [CrossRef] [PubMed] [Green Version]
  4. Ilbert, M.; Horst, J.; Ahrens, S.; Winter, J.; Graf, P.C.F.; Lilie, H.; Jakob, U. The redox-switch domain of Hsp33 functions as dual stress sensor. Nat. Struct. Mol. Biol. 2007, 14, 556–563. [Google Scholar] [CrossRef] [PubMed] [Green Version]
  5. Winter, J.; Ilbert, M.; Graf, P.; Özcelik, D.; Jakob, U. Bleach Activates a Redox-Regulated Chaperone by Oxidative Protein Unfolding. Cell 2008, 135, 691–701. [Google Scholar] [CrossRef] [Green Version]
  6. Banci, L.; Bertini, I.; Ciofi-Baffoni, S.; Tokatlidis, K. The coiled coil-helix-coiled coil-helix proteins may be redox proteins. FEBS Lett. 2009, 583, 1699–1702. [Google Scholar] [CrossRef] [Green Version]
  7. Fraga, H.; Pujols, J.; Gil-Garcia, M.; Roque, A.; Bernardo-Seisdedos, G.; Santambrogio, C.; Bech-Serra, J.-J.; Canals, F.; Bernadó, P.; Grandori, R.; et al. Disulfide driven folding for a conditionally disordered protein. Sci. Rep. 2017, 7, 16994. [Google Scholar] [CrossRef] [PubMed] [Green Version]
  8. Holmgren, A. Thioredoxin. Annu. Rev. Biochem. 1985, 54, 237–271. [Google Scholar] [CrossRef]
  9. Michelet, L.; Zaffagnini, M.; Morisse, S.; Sparla, F.; Pérez-Pérez, M.E.; Francia, F.; Danon, A.; Marchand, C.H.; Fermani, S.; Trost, P.; et al. Redox regulation of the Calvin–Benson cycle: Something old, something new. Front. Plant Sci. 2013, 4, 470. [Google Scholar] [CrossRef] [Green Version]
  10. Zaffagnini, M.; Fermani, S.; Marchand, C.H.; Costa, A.; Sparla, F.; Rouhier, N.; Geigenberger, P.; Lemaire, S.D.; Trost, P. Redox Homeostasis in Photosynthetic Organisms: Novel and Established Thiol-Based Molecular Mechanisms. Antioxid. Redox Signal. 2019, 31, 155–210. [Google Scholar] [CrossRef]
  11. Scheibe, R.; Anderson, L.E. Dark modulation of NADP-dependent malate dehydrogenase and glucose-6-phosphate dehydrogenase in the chloroplast. Biochim. Biophys. Acta (BBA) Bioenergy 1981, 636, 58–64. [Google Scholar] [CrossRef]
  12. Scheibe, R.; Geissler, A.; Fickenscher, K. Chloroplast glucose-6-phosphate dehydrogenase: Km shift upon light modulation and reduction. Arch. Biochem. Biophys. 1989, 274, 290–297. [Google Scholar] [CrossRef]
  13. Kachru, R.B.; Anderson, L.E. Inactivation of Pea Leaf Phosphofructokinase by Light and Dithiothreitol. Plant Physiol. 1975, 55, 199–202. [Google Scholar] [CrossRef] [Green Version]
  14. Yoshida, K.; Hisabori, T. Biochemical Basis for Redox Regulation of Chloroplast-Localized Phosphofructokinase from Arabidopsis thaliana. Plant Cell Physiol. 2021. [Google Scholar] [CrossRef] [PubMed]
  15. Cejudo, F.J.; Ojeda, V.; Delgado-Requerey, V.; González, M.; Pérez-Ruiz, J.M. Chloroplast Redox Regulatory Mechanisms in Plant Adaptation to Light and Darkness. Front. Plant Sci. 2019, 10, 380. [Google Scholar] [CrossRef] [Green Version]
  16. Avilan, L.; Lebreton, S.; Gontero, B. Thioredoxin Activation of Phosphoribulokinase in a Bi-enzyme Complex from Chlamydomonas reinhardtii Chloroplasts. J. Biol. Chem. 2000, 275, 9447–9451. [Google Scholar] [CrossRef] [PubMed] [Green Version]
  17. Knuesting, J.; Scheibe, R. Small Molecules Govern Thiol Redox Switches. Trends Plant Sci. 2018, 23, 769–782. [Google Scholar] [CrossRef] [PubMed]
  18. Leegood, R.; Walker, D. Regulation of fructose-1,6-bisphosphatase activity in intact chloroplasts. Studies of the mechanism of inactivation. Biochim. Biophys. Acta (BBA) Bioenergy 1980, 593, 362–370. [Google Scholar] [CrossRef]
  19. Vaseghi, M.-J.; Chibani, K.; Telman, W.; Liebthal, M.F.; Gerken, M.; Schnitzer, H.; Mueller, S.M.; Dietz, K.-J. The chloroplast 2-cysteine peroxiredoxin functions as thioredoxin oxidase in redox regulation of chloroplast metabolism. eLife 2018, 7. [Google Scholar] [CrossRef] [PubMed]
  20. Buchanan, B.B. The Ferredoxin/Thioredoxin System: A Key Element in the Regulatory Function of Light in Photosynthesis. Bioscience 1984, 34, 378–383. [Google Scholar] [CrossRef]
  21. Gontero, B.; Avilan, L.; Lebreton, S. Control of carbon fixation in chloroplasts. In Control of Primary Metabolism in Plants; Plaxton, W.C., McManus, M.T., Eds.; Blackwell Publishing Ltd.: Oxford, UK, 2006; pp. 187–218. [Google Scholar]
  22. Gontero, B.; Maberly, S.C. An intrinsically disordered protein, CP12: Jack of all trades and master of the Calvin cycle. Biochem. Soc. Trans. 2012, 40, 995–999. [Google Scholar] [CrossRef] [Green Version]
  23. Graciet, E.; Gans, P.; Wedel, N.; Lebreton, S.; Camadro, J.-M.; Gontero, B. The Small Protein CP12: A Protein Linker for Supramolecular Complex Assembly. Biochemistry 2003, 42, 8163–8170. [Google Scholar] [CrossRef] [PubMed] [Green Version]
  24. Avilan, L.; Puppo, C.; Erales, J.; Woudstra, M.; Lebrun, R.; Gontero, B. CP12 residues involved in the formation and regulation of the glyceraldehyde-3-phosphate dehydrogenase–CP12–phosphoribulokinase complex in Chlamydomonas reinhardtii. Mol. BioSyst. 2012, 8, 2994–3002. [Google Scholar] [CrossRef]
  25. Mcfarlane, C.; Shah, N.; Kabasakal, B.V.; Cotton, C.A.R.; Bubeck, D.; Murray, J.W. Structural Basis of Light-Induced Redox Regulation in the Calvin Cycle. Proc. Natl. Acad. Sci. USA 2019, 116, 20984–20990. [Google Scholar] [CrossRef] [PubMed] [Green Version]
  26. Yu, A.; Xie, Y.; Pan, X.; Zhang, H.; Cao, P.; Su, X.; Chang, W.; Li, M. Photosynthetic Phosphoribulokinase Structures: Enzymatic Mechanisms and the Redox Regulation of the Calvin-Benson-Bassham Cycle. Plant Cell 2020, 32, 1556–1573. [Google Scholar] [CrossRef] [PubMed] [Green Version]
  27. Groben, R.; Kaloudas, D.; Raines, C.A.; Offmann, B.; Maberly, S.C.; Gontero, B. Comparative sequence analysis of CP12, a small protein involved in the formation of a Calvin cycle complex in photosynthetic organisms. Photosynth. Res. 2010, 103, 183–194. [Google Scholar] [CrossRef] [PubMed]
  28. Stanley, D.N.; Raines, C.A.; Kerfeld, C.A. Comparative Analysis of 126 Cyanobacterial Genomes Reveals Evidence of Functional Diversity Among Homologs of the Redox-Regulated CP12 Protein. Plant Physiol. 2013, 161, 824–835. [Google Scholar] [CrossRef] [Green Version]
  29. Fermani, S.; Trivelli, X.; Sparla, F.; Thumiger, A.; Calvaresi, M.; Marri, L.; Falini, G.; Zerbetto, F.; Trost, P. Conformational Selection and Folding-upon-binding of Intrinsically Disordered Protein CP12 Regulate Photosynthetic Enzymes Assembly. J. Biol. Chem. 2012, 287, 21372–21383. [Google Scholar] [CrossRef] [Green Version]
  30. Launay, H.; Barré, P.; Puppo, C.; Manneville, S.; Gontero, B.; Receveur-Bréchot, V. Absence of residual structure in the intrinsically disordered regulatory protein CP12 in its reduced state. Biochem. Biophys. Res. Commun. 2016, 477, 20–26. [Google Scholar] [CrossRef] [PubMed]
  31. Launay, H.; Barré, P.; Puppo, C.; Zhang, Y.; Manneville, S.; Gontero, B.; Receveur-Bréchot, V. Cryptic Disorder Out of Disorder: Encounter between Conditionally Disordered CP12 and Glyceraldehyde-3-Phosphate Dehydrogenase. J. Mol. Biol. 2018, 430, 1218–1234. [Google Scholar] [CrossRef]
  32. Shao, H.; Huang, W.; Avilan, L.; Receveur-Bréchot, V.; Puppo, C.; Puppo, R.; Lebrun, R.; Gontero, B.; Launay, H. A new type of flexible CP12 protein in the marine diatom Thalassiosira pseudonana. Cell Commun. Signal. 2021, 19, 1–13. [Google Scholar] [CrossRef] [PubMed]
  33. Adamski, W.; Salvi, N.; Maurin, D.; Magnat, J.; Milles, S.; Jensen, M.R.; Abyzov, A.; Moreau, C.J.; Blackledge, M. A Unified Description of Intrinsically Disordered Protein Dynamics under Physiological Conditions Using NMR Spectroscopy. J. Am. Chem. Soc. 2019, 141, 17817–17829. [Google Scholar] [CrossRef] [PubMed]
  34. Pauwels, K.; Lebrun, P.; Tompa, P. To be disordered or not to be disordered: Is that still a question for proteins in the cell? Cell. Mol. Life Sci. 2017, 74, 3185–3204. [Google Scholar] [CrossRef]
  35. Bodart, J.-F.; Wieruszeski, J.-M.; Amniai, L.; Leroy, A.; Landrieu, I.; Rousseau-Lescuyer, A.; Vilain, J.-P.; Lippens, G. NMR observation of Tau in Xenopus oocytes. J. Magn. Reson. 2008, 192, 252–257. [Google Scholar] [CrossRef] [PubMed]
  36. Theillet, F.-X.; Binolfi, A.; Bekei, B.; Martorana, A.; Rose, H.M.; Stuiver, M.; Verzini, S.; Lorenz, D.; Van Rossum, M.; Goldfarb, D.; et al. Structural disorder of monomeric α-synuclein persists in mammalian cells. Nat. Cell Biol. 2016, 530, 45–50. [Google Scholar] [CrossRef] [Green Version]
  37. Banci, L.; Barbieri, L.; Luchinat, E.; Secci, E. Visualization of Redox-Controlled Protein Fold in Living Cells. Chem. Biol. 2013, 20, 747–752. [Google Scholar] [CrossRef] [Green Version]
  38. Mercatelli, E.; Barbieri, L.; Luchinat, E.; Banci, L. Direct structural evidence of protein redox regulation obtained by in-cell NMR. Biochim. Biophys. Acta (BBA) Bioenergy 2016, 1863, 198–204. [Google Scholar] [CrossRef]
  39. Hwang, T.-L.; Van Zijl, P.C.; Mori, S. Accurate Quantitation of Water-amide Proton Exchange Rates Using the Phase-Modulated CLEAN Chemical EXchange (CLEANEX-PM) Approach with a Fast-HSQC (FHSQC) Detection Scheme. J. Biomol. NMR 1998, 11, 221–226. [Google Scholar] [CrossRef]
  40. Delaglio, F.; Grzesiek, S.; Vuister, G.W.; Zhu, G.; Pfeifer, J.; Bax, A. NMRPipe: A multidimensional spectral processing system based on UNIX pipes. J. Biomol. NMR 1995, 6, 277–293. [Google Scholar] [CrossRef] [PubMed]
  41. Lee, W.; Tonelli, M.; Markley, J.L. NMRFAM-SPARKY: Enhanced software for biomolecular NMR spectroscopy. Bioinformatics 2015, 31, 1325–1327. [Google Scholar] [CrossRef] [Green Version]
  42. Eaton, J.; Bateman, D.; Haubert, S.; Wehbring, R. GNU Octave Version 4.2.1. Available online: https://www.gnu.org/software/octave/index (accessed on 20 June 2020).
  43. Xu, S.; Ni, S.; Kennedy, M.A. NMR Analysis of Amide Hydrogen Exchange Rates in a Pentapeptide-Repeat Protein from A. thaliana. Biophys. J. 2017, 112, 2075–2088. [Google Scholar] [CrossRef] [PubMed] [Green Version]
  44. Zhang, Y.-Z. SPHERE. Available online: https://protocol.fccc.edu/research/labs/roder/sphere (accessed on 20 June 2020).
  45. Piotukh, K.; Kosslick, D.; Zimmermann, J.; Krause, E.; Freund, C. Reversible disulfide bond formation of intracellular proteins probed by NMR spectroscopy. Free. Radic. Biol. Med. 2007, 43, 1263–1270. [Google Scholar] [CrossRef]
  46. Mochizuki, A.; Saso, A.; Zhao, Q.; Kubo, S.; Nishida, N.; Shimada, I. Balanced Regulation of Redox Status of Intracellular Thioredoxin Revealed by in-Cell NMR. J. Am. Chem. Soc. 2018, 140, 3784–3790. [Google Scholar] [CrossRef] [PubMed]
  47. Kruger, N.J. The Bradford Method for Protein Quantitation. Basic Protein Pept. Protoc. 1994, 32, 9–16. [Google Scholar] [CrossRef]
  48. Ferrage, F.; Zoonens, M.; Warschawski, D.E.; Popot, J.-L.; Bodenhausen, G. Slow Diffusion of Macromolecular Assemblies by a New Pulsed Field Gradient NMR Method†. J. Am. Chem. Soc. 2003, 125, 2541–2545. [Google Scholar] [CrossRef] [PubMed]
  49. Ferraro, D.M.; Lazo, N.D.; Robertson, A.D. EX1 Hydrogen Exchange and Protein Folding. Biochemistry 2004, 43, 587–594. [Google Scholar] [CrossRef] [PubMed]
  50. Cierpicki, T.; Otlewski, J. Amide proton temperature coefficients as hydrogen bond indicators in proteins. J. Biomol. NMR 2001, 21, 249–261. [Google Scholar] [CrossRef]
  51. Trainor, K.; Palumbo, J.A.; MacKenzie, D.W.S.; Meiering, E.M. Temperature dependence of NMR chemical shifts: Tracking and statistical analysis. Protein Sci. 2020, 29, 306–314. [Google Scholar] [CrossRef]
  52. Dujardin, M.; Madan, V.; Gandhi, N.S.; Cantrelle, F.-X.; Launay, H.; Huvent, I.; Bartenschlager, R.; Lippens, G.; Hanoulle, X. Cyclophilin A allows the allosteric regulation of a structural motif in the disordered domain 2 of NS5A and thereby fine-tunes HCV RNA replication. J. Biol. Chem. 2019, 294, 13171–13185. [Google Scholar] [CrossRef]
  53. Selvaratnam, R.; Chowdhury, S.; Van Schouwen, B.; Melacini, G. Mapping allostery through the covariance analysis of NMR chemical shifts. Proc. Natl. Acad. Sci. USA 2011, 108, 6133–6138. [Google Scholar] [CrossRef] [Green Version]
  54. Cavanagh, J.; Fairbrother, W.; Palmer, A.G.; Rance, M.; Skelton, N. Principles and Practice: Protein NMR Spectroscopy, 2nd ed.; Elsevier Academic Press: Burlington, MA, USA, 2006; ISBN 978-0-12-164491-8. [Google Scholar]
  55. Marri, L.; Trost, P.; Pupillo, P.; Sparla, F. Reconstitution and Properties of the Recombinant Glyceraldehyde-3-Phosphate Dehydrogenase/CP12/Phosphoribulokinase Supramolecular Complex of Arabidopsis. Plant Physiol. 2005, 139, 1433–1443. [Google Scholar] [CrossRef] [PubMed] [Green Version]
  56. Clement, R.; Lignon, S.; Mansuelle, P.; Jensen, E.; Pophillat, M.; Lebrun, R.; Denis, Y.; Puppo, C.; Maberly, S.C.; Gontero, B. Responses of the marine diatom Thalassiosira pseudonana to changes in CO2 concentration: A proteomic approach. Sci. Rep. 2017, 7, 42333. [Google Scholar] [CrossRef] [Green Version]
  57. López-Calcagno, P.E.; Abuzaid, A.O.; Lawson, T.; Raines, C.A. Arabidopsis CP12 mutants have reduced levels of phosphoribulokinase and impaired function of the Calvin–Benson cycle. J. Exp. Bot. 2017, 68, 2285–2298. [Google Scholar] [CrossRef] [PubMed] [Green Version]
  58. Howard, T.P.; Fryer, M.J.; Singh, P.; Metodiev, M.; Lytovchenko, A.; Obata, T.; Fernie, A.R.; Kruger, N.J.; Quick, W.P.; Lloyd, J.C.; et al. Antisense Suppression of the Small Chloroplast Protein CP12 in Tobacco Alters Carbon Partitioning and Severely Restricts Growth. Plant Physiol. 2011, 157, 620–631. [Google Scholar] [CrossRef] [Green Version]
  59. Li, K.; Qiu, H.; Zhou, M.; Lin, Y.; Guo, Z.; Lu, S. Chloroplast Protein 12 Expression Alters Growth and Chilling Tolerance in Tropical Forage Stylosanthes guianensis (Aublet) Sw. Front. Plant Sci. 2018, 9, 1319. [Google Scholar] [CrossRef]
  60. Dietz, K.-J. Redox signal integration: From stimulus to networks and genes. Physiol. Plant. 2008, 133, 459–468. [Google Scholar] [CrossRef]
  61. Buchanan, B.B.; Balmer, Y. REDOX REGULATION: A Broadening Horizon. Annu. Rev. Plant Biol. 2005, 56, 187–220. [Google Scholar] [CrossRef] [PubMed]
  62. Jensen, M.R.; Ruigrok, R.W.; Blackledge, M. Describing intrinsically disordered proteins at atomic resolution by NMR. Curr. Opin. Struct. Biol. 2013, 23, 426–435. [Google Scholar] [CrossRef]
  63. Gurrieri, L.; Del Giudice, A.; Demitri, N.; Falini, G.; Pavel, N.V.; Zaffagnini, M.; Polentarutti, M.; Crozet, P.; Marchand, C.H.; Henri, J.; et al. Arabidopsis and Chlamydomonas phosphoribulokinase crystal structures complete the redox structural proteome of the Calvin–Benson cycle. Proc. Natl. Acad. Sci. USA 2019, 116, 8048–8053. [Google Scholar] [CrossRef] [PubMed] [Green Version]
  64. Marri, L.; Zaffagnini, M.; Collin, V.; Issakidis-Bourguet, E.; Lemaire, S.D.; Pupillo, P.; Sparla, F.; Miginiac-Maslow, M.; Trost, P. Prompt and Easy Activation by Specific Thioredoxins of Calvin Cycle Enzymes of Arabidopsis thaliana Associated in the GAPDH/CP12/PRK Supramolecular Complex. Mol. Plant 2009, 2, 259–269. [Google Scholar] [CrossRef] [PubMed] [Green Version]
  65. Marri, L.; Pesaresi, A.; Valerio, C.; Lamba, D.; Pupillo, P.; Trost, P.; Sparla, F. In vitro characterization of Arabidopsis CP12 isoforms reveals common biochemical and molecular properties. J. Plant Physiol. 2010, 167, 939–950. [Google Scholar] [CrossRef]
  66. Yoshida, K.; Hara, A.; Sugiura, K.; Fukaya, Y.; Hisabori, T. Thioredoxin-like2/2-Cys peroxiredoxin redox cascade supports oxidative thiol modulation in chloroplasts. Proc. Natl. Acad. Sci. USA 2018, 115, E8296–E8304. [Google Scholar] [CrossRef] [Green Version]
  67. Faustino, A.F.; Barbosa, G.M.; Silva, M.; Castanho, M.A.R.B.; Da Poian, A.T.; Cabrita, E.J.; Santos, N.C.; Almeida, F.C.L.; Martins, I.C. Fast NMR method to probe solvent accessibility and disordered regions in proteins. Sci. Rep. 2019, 9, 1–13. [Google Scholar] [CrossRef] [PubMed] [Green Version]
  68. Launay, H.; Receveur-Bréchot, V.; Carrière, F.; Gontero, B. Orchestration of algal metabolism by protein disorder. Arch. Biochem. Biophys. 2019, 672, 108070. [Google Scholar] [CrossRef]
  69. Bhowmick, A.; Brookes, D.H.; Yost, S.R.; Dyson, H.J.; Forman-Kay, J.D.; Gunter, D.; Head-Gordon, M.; Hura, G.L.; Pande, V.S.; Wemmer, D.E.; et al. Finding Our Way in the Dark Proteome. J. Am. Chem. Soc. 2016, 138, 9730–9742. [Google Scholar] [CrossRef] [Green Version]
  70. Teilum, K.; Olsen, J.G.; Kragelund, B.B. Globular and disordered—the non-identical twins in protein-protein interactions. Front. Mol. Biosci. 2015, 2, 2. [Google Scholar] [CrossRef] [PubMed] [Green Version]
  71. Baalmann, E.; Scheibe, R.; Martin, W.F. Functional studies of chloroplast glyceraldehyde-3-phosphate dehydrogenase subunits A and B expressed in Escherichia coli: Formation of highly active A4 and B4 homotetramers and evidence that aggregation of the B4 complex is mediated by the B subunit carboxy terminus. Plant Mol. Biol. 1996, 32, 505–513. [Google Scholar] [CrossRef] [PubMed]
  72. Ethieulin-Pardo, G.; Eavilan, L.; Ekojadinovic, M.; Egontero, B. Fairy “tails”: Flexibility and function of intrinsically disordered extensions in the photosynthetic world. Front. Mol. Biosci. 2015, 2, 23. [Google Scholar] [CrossRef] [Green Version]
  73. Zhang, Y.; Launay, H.; Liu, F.; Lebrun, R.; Gontero, B. Interaction between adenylate kinase 3 and glyceraldehyde-3-phosphate dehydrogenase from Chlamydomonas reinhardtii. FEBS J. 2018, 285, 2495–2503. [Google Scholar] [CrossRef] [Green Version]
  74. Lemaire, S.D.; Quesada, A.; Merchan, F.; Corral, J.M.; Igeno, M.I.; Keryer, E.; Issakidis-Bourguet, E.; Hirasawa, M.; Knaff, D.B.; Miginiac-Maslow, M. NADP-Malate Dehydrogenase from Unicellular Green Alga Chlamydomonas reinhardtii. A First Step toward Redox Regulation? Plant Physiol. 2005, 137, 514–521. [Google Scholar] [CrossRef] [PubMed] [Green Version]
  75. Mackinder, L.C.; Chen, C.; Leib, R.D.; Patena, W.; Blum, S.R.; Rodman, M.; Ramundo, S.; Adams, C.M.; Jonikas, M.C. A Spatial Interactome Reveals the Protein Organization of the Algal CO2-Concentrating Mechanism. Cell 2017, 171, 133–147.e14. [Google Scholar] [CrossRef] [Green Version]
  76. Wunder, T.; Cheng, S.L.H.; Lai, S.-K.; Li, H.-Y.; Mueller-Cajar, O. The phase separation underlying the pyrenoid-based microalgal Rubisco supercharger. Nat. Commun. 2018, 9, 1–10. [Google Scholar] [CrossRef] [PubMed]
  77. Rosenzweig, E.S.F.; Xu, B.; Cuellar, L.K.; Martinez-Sanchez, A.; Schaffer, M.; Strauss, M.; Cartwright, H.N.; Ronceray, P.; Plitzko, J.M.; Förster, F.; et al. The Eukaryotic CO2-Concentrating Organelle Is Liquid-like and Exhibits Dynamic Reorganization. Cell 2017, 171, 148–162.e19. [Google Scholar] [CrossRef] [PubMed] [Green Version]
  78. Choi, Y.H.; van Spronsen, J.; Dai, Y.; Verberne, M.; Hollmann, F.; Arends, I.W.; Witkamp, G.-J.; Verpoorte, R. Are Natural Deep Eutectic Solvents the Missing Link in Understanding Cellular Metabolism and Physiology? Plant Physiol. 2011, 156, 1701–1705. [Google Scholar] [CrossRef] [PubMed] [Green Version]
  79. Dai, Y.; Varypataki, E.M.; Golovina, E.A.; Jiskoot, W.; Witkamp, G.-J.; Choi, Y.H.; Verpoorte, R. Natural deep eutectic solvents in plants and plant cells: In vitro evidence for their possible functions. In Advances in Botanical Research; Elsevier BV: Amsterdam, The Netherlands, 2021; Volume 97, pp. 159–184. [Google Scholar]
  80. Brillouet, J.-M.; Verdeil, J.-L.; Odoux, E.; Lartaud, M.; Grisoni, M.; Conéjéro, G. Phenol homeostasis is ensured in vanilla fruit by storage under solid form in a new chloroplast-derived organelle, the phenyloplast. J. Exp. Bot. 2014, 65, 2427–2435. [Google Scholar] [CrossRef] [PubMed] [Green Version]
  81. Marri, L.; Sparla, F.; Pupillo, P.; Trost, P. Co-ordinated gene expression of photosynthetic glyceraldehyde-3-phosphate dehydrogenase, phosphoribulokinase, and CP12 in Arabidopsis thaliana. J. Exp. Bot. 2004, 56, 73–80. [Google Scholar] [CrossRef] [Green Version]
  82. Rochaix, J.-D. Chlamydomonas reinhardtii as the Photosynthetic Yeast. Annu. Rev. Genet. 1995, 29, 209–230. [Google Scholar] [CrossRef]
  83. Kastritis, P.L.; O’Reilly, F.J.; Bock, T.; Li, Y.; Rogon, M.Z.; Buczak, K.; Romanov, N.; Betts, M.J.; Bui, K.H.; Hagen, W.J.; et al. Capturing protein communities by structural proteomics in a thermophilic eukaryote. Mol. Syst. Biol. 2017, 13, 936. [Google Scholar] [CrossRef] [PubMed]
  84. Ellis, R. Macromolecular crowding: An important but neglected aspect of the intracellular environment. Curr. Opin. Struct. Biol. 2001, 11, 114–119. [Google Scholar] [CrossRef]
  85. Ellis, R. Macromolecular crowding: Obvious but underappreciated. Trends Biochem. Sci. 2001, 26, 597–604. [Google Scholar] [CrossRef]
  86. Zimmerman, S.B.; Trach, S.O. Estimation of macromolecule concentrations and excluded volume effects for the cytoplasm of Escherichia coli. J. Mol. Biol. 1991, 222, 599–620. [Google Scholar] [CrossRef] [Green Version]
  87. Christiansen, A.; Wang, Q.; Cheung, M.S.; Wittung-Stafshede, P. Effects of macromolecular crowding agents on protein folding in vitro and in silico. Biophys. Rev. 2013, 5, 137–145. [Google Scholar] [CrossRef] [PubMed] [Green Version]
  88. Li, C.; Charlton, L.M.; Lakkavaram, A.; Seagle, C.; Wang, G.; Young, G.B.; Macdonald, J.M.; Pielak, G.J. Differential Dynamical Effects of Macromolecular Crowding on an Intrinsically Disordered Protein and a Globular Protein: Implications for In-Cell NMR Spectroscopy. J. Am. Chem. Soc. 2008, 130, 6310–6311. [Google Scholar] [CrossRef] [Green Version]
  89. Wang, Y.; Benton, L.A.; Singh, V.; Pielak, G.J. Disordered Protein Diffusion under Crowded Conditions. J. Phys. Chem. Lett. 2012, 3, 2703–2706. [Google Scholar] [CrossRef] [PubMed] [Green Version]
  90. Luchinat, E.; Banci, L. In-cell NMR: A topical review. IUCrJ 2017, 4, 108–118. [Google Scholar] [CrossRef] [PubMed] [Green Version]
  91. Cedeño, C.; Pauwels, K.; Tompa, P. Protein Delivery into Plant Cells: Toward In vivo Structural Biology. Front. Plant Sci. 2017, 8, 8. [Google Scholar] [CrossRef] [PubMed] [Green Version]
  92. Küken, A.; Sommer, F.; Yaneva-Roder, L.; Mackinder, L.C.M.; Höhne, M.; Geimer, S.; Jonikas, M.C.; Schroda, M.; Stitt, M.; Nikoloski, Z.; et al. Effects of microcompartmentation on flux distribution and metabolic pools in Chlamydomonas reinhardtii chloroplasts. eLife 2018, 7. [Google Scholar] [CrossRef]
Figure 1. Model of the redox-transition of CP12. The structural models are derived from Launay et al. [30,31]. The complex Trx network is derived from Cejudo et al. [15]. The sulphur atoms of the two pairs of cysteine residues are in yellow. Trx and Fdx stand for thioredoxins and ferredoxin, respectively.
Biomolecules 11 00701 g001
Figure 2. Labile amide protons in CP12red and CP12ox. (a) Solvent-amine intrinsic proton exchange rates calculated using SPHERE [44] (black) and solvent–amide proton exchange rates measured using CLEANEX-PM experiment [39,43] on CP12red (red). The similarity between both values indicated that CP12red is intrinsically disordered. The signal intensity as a function of the spin-lock delay in the CLEANEX-PM experiments is shown in Figure S1. (b) Gibbs free energy of CP12ox backbone amides derived from the measured solvent–amine proton exchange using CLEANEX-PM on CP12ox versus CP12red (refer to Material and Methods for details), assuming that the exchange falls into the EX2 regime that is highly probable at this low pH (7). The measured rates of exchange for CP12ox amide at pH 7 and pH 6 are shown Figure S2. In (b,d), the stars indicate residues for which the resonances are broadened beyond detection in CP12ox [31], and the disulfide bridges are indicated above the sequence. (d) Value of the slope of the temperature dependence of the proton chemical shift for CP12ox residues. The line at −4.6 ppm K−1 indicates the threshold below which the data indicate the absence of a hydrogen bond [50]. The temperature dependence curves of the chemical shift of the amine proton for all CP12ox residues are shown Figure S4. (c) Structure of the stable C-terminal helical turn with the amide protons protected from the exchange with water highlighted in red, and those exposed to exchange in green. (e) On the same structure, the amide protons for which the temperature dependence of the chemical shift has a positive slope are highlighted in red. The CP12 sequence is indicated below the graphs, with the following color coding: the residues that fold in the stable helical turn in the C-terminal region of CP12ox are in blue, and the residues that undergo chemical exchange in CP12ox are in green [31].
Biomolecules 11 00701 g002
Figure 3. Temperature dependence of CP12ox Trp-ε resonances indicating a chemical exchange. (a) Series of 1H-15N spectra of CP12ox recorded at varying temperatures (277 K, 284 K, 291 K, 298 K, 305 K, 313 K, 319 K) and at pH 6.5 and plotted with the same contour levels. To ease the reading, the contour levels of each resonance have different colors. In (a,b), above the series, the spectrum of CP12red at 284 K is shown (magenta). (b) 1H-15N spectra of CP12 recorded at 284 K at varying pH (pH 6.5 as in A, pH 8, and pH 9). An additional spectrum is shown at pH 6.5 where the protein has been pre-treated with Cu2+ to ensure full oxidation. The paramagnetic ion was removed by dialysis before NMR acquisition. (c) Temperature dependence of the proton chemical shift for each of these CP12ox Trp-ε resonances using the same color coding (Figure S4). (d) Temperature dependence of the resonance intensity for each of these CP12ox Trp-ε resonances using the same color coding (refer to Figure S5). (e,f) Gibbs free energy of folding for the Trp-ε residue, with two possible interconversion models. The timescales of interconversion are indicated above the arrow.
Biomolecules 11 00701 g003
Figure 4. CP12red in isolation and in the presence of C. reinhardtii cell extract. (a) 1H-15N HSQC spectrum of isolated CP12red. The region of the tryptophan side chain is shown in the insert. (b) Overlay of the 1H-15N HSQC spectra of isolated CP12red (black) and that of CP12 in the presence of C. reinhardtii cell extract (green, molecular crowding corresponding to 15 mg mL−1 of protein). The data are recorded in the presence of 20 mM DTTred. (c) 1H-15N HSQC of CP12 in the presence of C. reinhardtii cell extract collected in the dark (molecular crowding corresponding to 19 mg mL−1 of protein), 0.1 mM DCMU, and 20 mM dithionite as a strong reducing agent. (d) Signal intensities for all residues in the 1H-15N HSQC spectrum of isolated CP12red (black), and in the 1H-15N HSQC spectrum of CP12 red in the presence of C. reinhardtii cell extract (green). Signal intensities were normalized against the mean of all intensities. The CP12 sequence is indicated below the graph with the same color coding as in Figure 2.
Biomolecules 11 00701 g004
Figure 5. CP12ox in isolation and in the presence of C. reinhardtii cell extract. (a) 1H-15N HSQC spectrum of isolated CP12ox. (b) Overlay of the 1H-15N HSQC spectra of isolated CP12ox (black) and that of CP12 in the presence of C. reinhardtii cell extract (green, molecular crowding corresponding to 19 mg mL−1 of protein). The data is recorded in the presence of 20 mM DTTox, and 0.1 mM DCMU. The assignments of the resonances that are observed in the presence of cell extract are indicated. (c) 1H-15N HSQC of CP12 in the presence of C. reinhardtii cell extract collected in the light (molecular crowding corresponding to 15 mg mL−1 of protein) and 20 mM H2O2 as a strong oxidizing agent. (d) Signal intensities for all residues in the 1H-15N HSQC spectrum of isolated CP12ox (black), and in the 1H-15N HSQC spectrum of CP12ox in presence of C. reinhardtii cell extract (green). The signal intensities are normalized against the mean of all intensities. The stars indicate residues for which the resonances are broadened beyond detection in isolated CP12ox [31], and the disulfide bridges are indicated above the sequence. The CP12 sequence is indicated below the graph with same color coding as in Figure 2.
Biomolecules 11 00701 g005
Figure 6. Redox transition of isolated CP12. (a) Thermodynamics of the redox transition for the N-terminal disulfide bridge. Signal intensities at NMR frequencies of reduced cysteine residues C23 (dark and light green) and C31 (grey and black), plotted as a function of the logarithm of the measured [DTTox]/[DTTred] ratio (refer to Material and Methods). The corresponding electropotentials at pH 7 or pH 8 are indicated below. The redox titration was performed at pH 7 (dark green and black) and pH 8 (light green and grey). (b) Thermodynamic of the redox transition for the N-terminal disulfide bridge measured at pH 7. Signal intensities at NMR frequencies of reduced (filled squares) and oxidized (open squares) cysteine residues C66 (dark blue) and C75 (black), plotted as a function of the logarithm of the measured [DTTox]/[DTTred] ratio (refer to Material and Methods). The corresponding electropotential at pH 7 is indicated below. (c) Same as B at pH 8. The color coding is light blue for C66 and grey for C75. The redox mid-potential of the C66–C75 disulfide bridges at pH 8 is more different than that at pH 7 than the expected −59.1 mV difference per pH unit. (d) Kinetic of the oxidation. Signal intensity as a function of time after buffer exchange in air-oxidized at NMR frequency of reduced C23 (top), reduced C31 (below), reduced and oxidized C66 (below, open, and filled square, respectively), and reduced and oxidized C75 (bottom, open, and filled square, respectively). The fits using the equations I I 0 = e k red ox t + c and I I 0 = c e k red ox t are shown, where c is a constant, k is the rate constant of the oxidation of cysteine residues. The kinetic of the oxidation for all CP12 residues is shown in Figure S7. (e) Kinetic of the reduction. The color coding is the same as above. The fits using the equations I I 0 = e k ox red   t + c and I I 0 = c e k ox red   t are shown, where c is a constant, k is the rate constant of the transition from oxidized to reduced cysteine residues. The reduction rate for all CP12 residues is shown in Figure S8.
Biomolecules 11 00701 g006
Figure 7. Overview of the thermodynamic equilibria of CP12. (a) Gibbs free energy of folding for CP12red. (b) Simplified Gibbs free energy of folding for CP12ox, refer to Figure 3e,f. (c) Gibbs free energy of binding for CP12ox. (d) The midpoint redox potentials for the CP12 C-terminal disulfide bridge (blue circle) and N-terminal disulfide bridge (green circle) measured in this study are compared to the midpoint potential for A. thaliana CP12 isoforms (blue and green squares), as well as for A2B2-GAPDH, A4-GAPDH, and PRK activity as determined in [63,64,65] (blue open triangle, blue open circle, and green open circle, respectively). For comparison, the redox potential of the ferredoxin-Trx reductase C-subunit (FTR-C) is shown in black, that of the NADPH-Trx reductase C (NTRC) in open blue circles, various Trx isoforms in red, as well as that of the Trx like 2 (TrxL2), as in Yoshida et al. [66]. (e) Kinetics of the oxidation (right to left) and reduction (left to right) highlighting the synchrony of the first, and the existence of a reduction intermediate for the second.
Biomolecules 11 00701 g007
Publisher’s Note: MDPI stays neutral with regard to jurisdictional claims in published maps and institutional affiliations.