Article

Cohesin Mutations Induce Chromatin Conformation Perturbation of the H19/IGF2 Imprinted Region and Gene Expression Dysregulation in Cornelia de Lange Syndrome Cell Lines

1
Medical Genetics, Department of Health Sciences, Università degli Studi di Milano, 20142 Milano, Italy
2
Unit of Medical Genetics, ASST Santi Paolo e Carlo, 20142 Milano, Italy
3
Department of Pathophysiology and Transplantation, Medical Genetics, Università degli Studi di Milano, 20122 Milan, Italy
4
Research Laboratories Coordination Unit, Fondazione IRCCS Ca’ Granda Ospedale Maggiore Policlinico, 20122 Milano, Italy
5
Laboratory of Medical Genetics, Fondazione IRCCS Ca’ Granda Ospedale Maggiore Policlinico, 20122 Milan, Italy
6
Centro di Medicina Genomica, Department of Medicine and Surgery, Università degli Studi dell’Insubria, 21100 Varese, Italy
7
Department of Experimental Oncology, IEO European Institute of Oncology IRCCS, 20139 Milan, Italy
8
Department of Oncology and Hemato-Oncology, University of Milan, 20122 Milan, Italy
*
Author to whom correspondence should be addressed.
Biomolecules 2021, 11(11), 1622; https://doi.org/10.3390/biom11111622
Submission received: 30 September 2021 / Revised: 26 October 2021 / Accepted: 28 October 2021 / Published: 2 November 2021
(This article belongs to the Collection DNA Methylation Dynamics in Health and Disease)

Abstract

:
Traditionally, Cornelia de Lange Syndrome (CdLS) is considered a cohesinopathy caused by constitutive mutations in cohesin complex genes. Cohesin is a major regulator of chromatin architecture, including the formation of chromatin loops at the imprinted IGF2/H19 domain. We used 3C analysis on lymphoblastoid cells from CdLS patients carrying mutations in NIPBL and SMC1A genes to explore 3D chromatin structure of the IGF2/H19 locus and evaluate the influence of cohesin alterations in chromatin architecture. We also assessed quantitative expression of imprinted loci and WNT pathway genes, together with DMR methylation status of the imprinted genes. A general impairment of chromatin architecture and the emergence of new interactions were found. Moreover, imprinting alterations also involved the expression and methylation levels of imprinted genes, suggesting an association among cohesin genetic defects, chromatin architecture impairment, and imprinting network alteration. The WNT pathway resulted dysregulated: canonical WNT, cell cycle, and WNT signal negative regulation were the most significantly affected subpathways. Among the deregulated pathway nodes, the key node of the frizzled receptors was repressed. Our study provides new evidence that mutations in genes of the cohesin complex have effects on the chromatin architecture and epigenetic stability of genes commonly regulated by high order chromatin structure.

1. Introduction

Cohesin is a chromatin-associated multi-subunit protein complex that is highly conserved during evolution and involved in several aspects of chromosome biology [1], such as cell division, DNA damage repair, gene transcription and chromosome architecture [2,3].
Cohesin is a ring-shaped complex composed of the SMC family proteins, SMC1 (also known as SMC1A) and SMC3, which function by forming heterodimers with two non-SMC components: RAD21 and SCC3. This core subunit orchestrates long-range DNA interactions to mediate sister chromatid cohesion during the cell cycle, essential for accurate chromosome segregation [4]. Other components of the cohesin complex are NIPBL and HDAC8: NIPBL mediates the loading of cohesin on chromatin during S-phase, G1 and G2 [5]. Conversely, the removal of SMC3 from chromatin during prophase and anaphase is mediated by HDAC8, which functions as an SMC3 deacetylase to permit the correct dissolution of pro-cohesive elements and the recycling of “refreshed” cohesin for a new cell cycle [6].
Cohesin is clinically relevant because heterozygous mutations in genes encoding for complex subunits lead to developmental disorders called cohesinopathies, whereas loss of function of the cohesin complex is incompatible with life [7]. Cornelia de Lange Syndrome (CdLS; OMIM #122470, 300590, 610759, 300882, and 614701) is a neurodevelopmental disorder caused by dominant variants in genes encoding structural and regulatory cohesin proteins. CdLS has an estimated occurrence of one in every 10,000–30,000 and is characterized by a peculiar face with arched eyebrows, synophrys, ptosis, upturned nose, thin upper lip and micrognathia, hirsutism, intellectual disability, growth delay and multisystem malformations [2,8,9].
The major causative genes of the Cornelia de Lange Syndrome are NIPBL, SMC1A, SMC3, RAD21 and HDAC8. Mutations in the NIPBL gene are responsible for more than 65% of CdLS cases [10,11] and frameshift or nonsense mutations, resulting in NIPBL haploinsufficiency, often confer more severe phenotypes compared with missense mutations [12]. Variants in SMC1 and SMC3 were found in a minor subset of CdLS cases (~5% and <1%, respectively) showing a milder phenotype, with mental retardation accompanied by other less severe abnormalities [13,14,15]. In addition, mutations in the X-linked gene HDAC8 are found in a small number of CdLS patients and cause a phenotypically distinct subgroup [14]. In addition to the overmentioned cohesin core complex alterations, mutations in other genes, such as AFF4, ANKRD11, CREBBP, and EP300, have been identified in patients with a phenotype resembling CdLS [9].
Overall, since the cohesin complex is involved in regulating gene expression during embryogenesis, cohesinopathies are characterized by a variety of developmental defects, including growth and mental delay, limb deformities, and craniofacial anomalies [16]. In particular, intellectual disability is related to impairment in neuronal development and transcriptional regulation (including initiation, general transcription, elongation, pausing, backtracking, processing, termination, and associated epigenetic modifications) [17].
Cohesin favors long-range DNA interactions and binds to many sites throughout the genome, sometimes in combination with the CCCTC-binding factor (CTCF) insulator protein, which mediates chromatin loop formation [18]. Cohesin and CTCF cooperate in the regulation of gene expression and chromosome structure [3,19,20,21]. Several studies reported that long-range interactions involving regulatory sequences are reduced by cohesin knockdown or cleavage highlighting the involvement of three-dimensional (3D) chromatin organization by cohesin in the regulation of many genes [3,22,23,24].
In particular, at the imprinted IGF2/H19 domain CTCF plays an important role in organizing allele-specific higher-order chromatin conformation and functions as an enhancer, antagonizing the activity of a transcriptional insulator. The 3D chromatin structure of this domain was extensively studied [21,25]. The CTCF mediated insulator is located upstream of the H19 gene and is known as the imprinting control region 1 (IC1). (Epi)genetic defects at the IGF2/H19 locus are associated with Beckwith–Wiedemann (BWS OMIM #130650) and Silver–Russell (SRS OMIM #180860) syndromes, two imprinted disorders characterized by opposite growth defects [26].
The genomic imprinting process is a parent-of-origin specific mark of the genome, leading to monoallelic expression of a subset of genes. Parental specific monoallelic gene expression of H19 and IGF2 imprinted genes (located at 11p15.5 imprinted domain) is controlled by the methylation of IC1 [27], also called the H19 differentially methylated region (DMR) or domain (DMD). IC1 acquires methylation on the paternal allele during the male gametogenesis. Depletion of either cohesin or CTCF results in reduced transcription of H19 and increased expression of IGF2, implying a role for these proteins in the expression regulation of these loci [21,28]. The putative looped structure at the IGF2/H19 domain, which brings the promoter and enhancer together in a parental allele-specific manner, is dependent on the differential methylation of IC1, and both cohesin and CTCF bind to several regions within the locus [29,30]. Recently, we provided a detailed characterization of the chromatin architecture of the 11p15.5 imprinted domain [31]; our data extended the available information regarding the structure of the IGF2/H19 domain and defined the interactome of the CDKN1C/KCNQ1OT1 domain (the second imprinted locus mapped at 11p15.5) and the long-range contacts involving the two domains. We confirmed that this domain folds in complex chromatin conformations, which facilitate the control of imprinted genes mediated by distant enhancers, and found deep alterations in the chromatin structure of the entire imprinted domain in lymphoblastoid cell lines (LCLs) from BWS and SRS patients.
Nativio and collaborators [29] reported that cohesin depletion by RNAi results in a modest reduction in looping interactions at the imprinted IGF2/H19 domain, confirming that cohesin is a stabilizing factor in chromatin looping. Although such defects may be very subtle, they hold the potential to cause changes in gene regulation. In light of this evidence, we hypothesized that genetic variations of cohesin genes may also affect the chromatin structure of loci that involve cohesin. With this aim, using chromatin conformation capture (3C) we explored whether chromatin structure and methylation of the IGF2/H19 domain may be impaired in LCLs from CdLS patients carrying different genetic alterations. We also quantified the expression profiles and methylation pattern of a panel of imprinted genes that are often regulated by a high order chromatin structure [32,33]. Expression analysis also included genes belonging to the WNT pathway, reported to be altered in CdLS [34,35,36,37].

2. Materials and Methods

2.1. Lymphoblastoid Cell Lines

LCLs (Table 1) were generated from nine pediatric CdLS patients carrying mutations in SMC1A (CdLS1–5) [38,39] and NIPBL (CdLS6–9) [40,41] and four nonaffected aged matched controls (CTRL 1–4). The study was approved by the Ethics Committee of Università degli Studi di Milano (Comitato Etico number 99/20, 17 November 2020). Appropriate written informed consent was obtained from patients’ parents.

2.2. Chromatin Conformation Capture Assay (3C)

3C was performed as previously described [31], where the 3C primer details, sequences and the extensive description of the regions analyzed were provided.
Given the importance of CTCF binding at specific sites for the development of intra- and interchromosomal contacts [42,43,44], we analyzed four clusters of CTCF-binding sites in the domain: one upstream of IGF2 (CTCF Up), one downstream of H19 (CTCF Down), one in the centrally conserved domain (CCD) region, and one in IC1 (Figure 1a and Rovina et al., 2020 [31]), in addition to genes and enhancers mapped in the 11p15.5 region (Figure 1a).

2.3. DNA Methylation Analysis

Total DNA was extracted from LCLs using the QIAamp® DNA Mini kit (Qiagen, Hilden, Germany) according to the manufacturer’s instructions. Two independent quantitative methylation experiments of IGF2, H19, GNAS, GNAS-AS1, MEST and PEG10 DMRs were performed by pyrosequencing using the Pyro Mark ID instrument (Qiagen, Hilden, Germany). Raw data were analyzed using the Q-CpG software v1.09 (Biotage Sweden AB). Details on the genomic positions, set-up and protocol were previously described [45,46].

2.4. nCounter Analysis

Total RNAs were obtained using the Qiazol reagent (Qiagen, Hilden, Germany), followed by RNA purification by the RNeasy mini kit (Qiagen, Hilden, Germany), according to the manufacturer’s protocol. RNAs were eluted in 50 μL of RNase-free water. Concentration and purity were evaluated using the Nanodrop (Thermo Fisher Scientific, Wilmington, DE, USA).
Expression analysis was performed by Ncounter using the Nanostring Vantage 3DTM RNA WNT Pathways Panel (Nanostring, Seattle, WA, USA) using a panel including 180 genes associated with the WNT pathways and 12 reference genes for normalization (CC2D1B, COG7, EDC3, GPATCH3, HDAC3, MTMR14, NUBP1, PRPF38A, SAP130, SF3A3, TLK2, ZC3H14), customized with 17 imprinted and imprinted-related genes (Table S1).
The expression profiles were evaluated starting from 150 ng of total RNA for each sample, which integrity was assessed with the TapeStation 2200 (Agilent, Santa Clara, CA, USA); RNA integrity number (RIN) values > 7.0 were considered suitable for the experiments. We used Nanostring technology as it represents a medium-throughput platform to evaluate mRNA abundance profiles providing reproducible and fully automated analyses of the samples. The robustness of this technology was already validated in several papers [47,48]. The reliability of Nanostring technology is based on the ability to quantify the expression of multiple genes without amplification steps. Conversely, technical artifacts could be introduced in qPCR [49].

2.5. Statistical Analysis

3C assays: two independent 3C assays were performed for each sample. The frequencies of associations are expressed as mean ± standard deviation. The control value is derived from four independent 3C assays, two using CTRL1 and two CTRL2. The mean of each CdLS cell line is calculated from the results of two independent 3C assays. Differences in association frequencies between controls and patient’s LCLs were evaluated using the two-way ANOVA test followed by the Bonferroni post-test in the GraphPad Prism program. Statistical significance is indicated as **** p ≤ 0.0001; *** p ≤ 0.001; ** p ≤ 0.01; * p ≤ 0.05.
NCounter analysis: Nanostring data were analyzed by the nSolver Advanced Analysis Software 4.0 (NanoString, Seattle, WA, USA) considering a background threshold of 20 counts and excluding from the analysis all genes with counts above the threshold. Quality assessment was performed for each sample, and two quality control parameters common to all nCounter assays were considered: the Imaging QC that measures the percentage of the requested fields of view successfully scanned in each cartridge lane and the Binding Density QC that measures the reporter probe density on the cartridge surface in each sample lane. The Benjamini–Hochberg method was applied to reduce the false discovery rate (FDR), minimizing Type I errors (false positives). Unadjusted p-value ≤ 0.05 were considered significant.

3. Results

A schematic overview of the experimental design is summarized in Table 1.

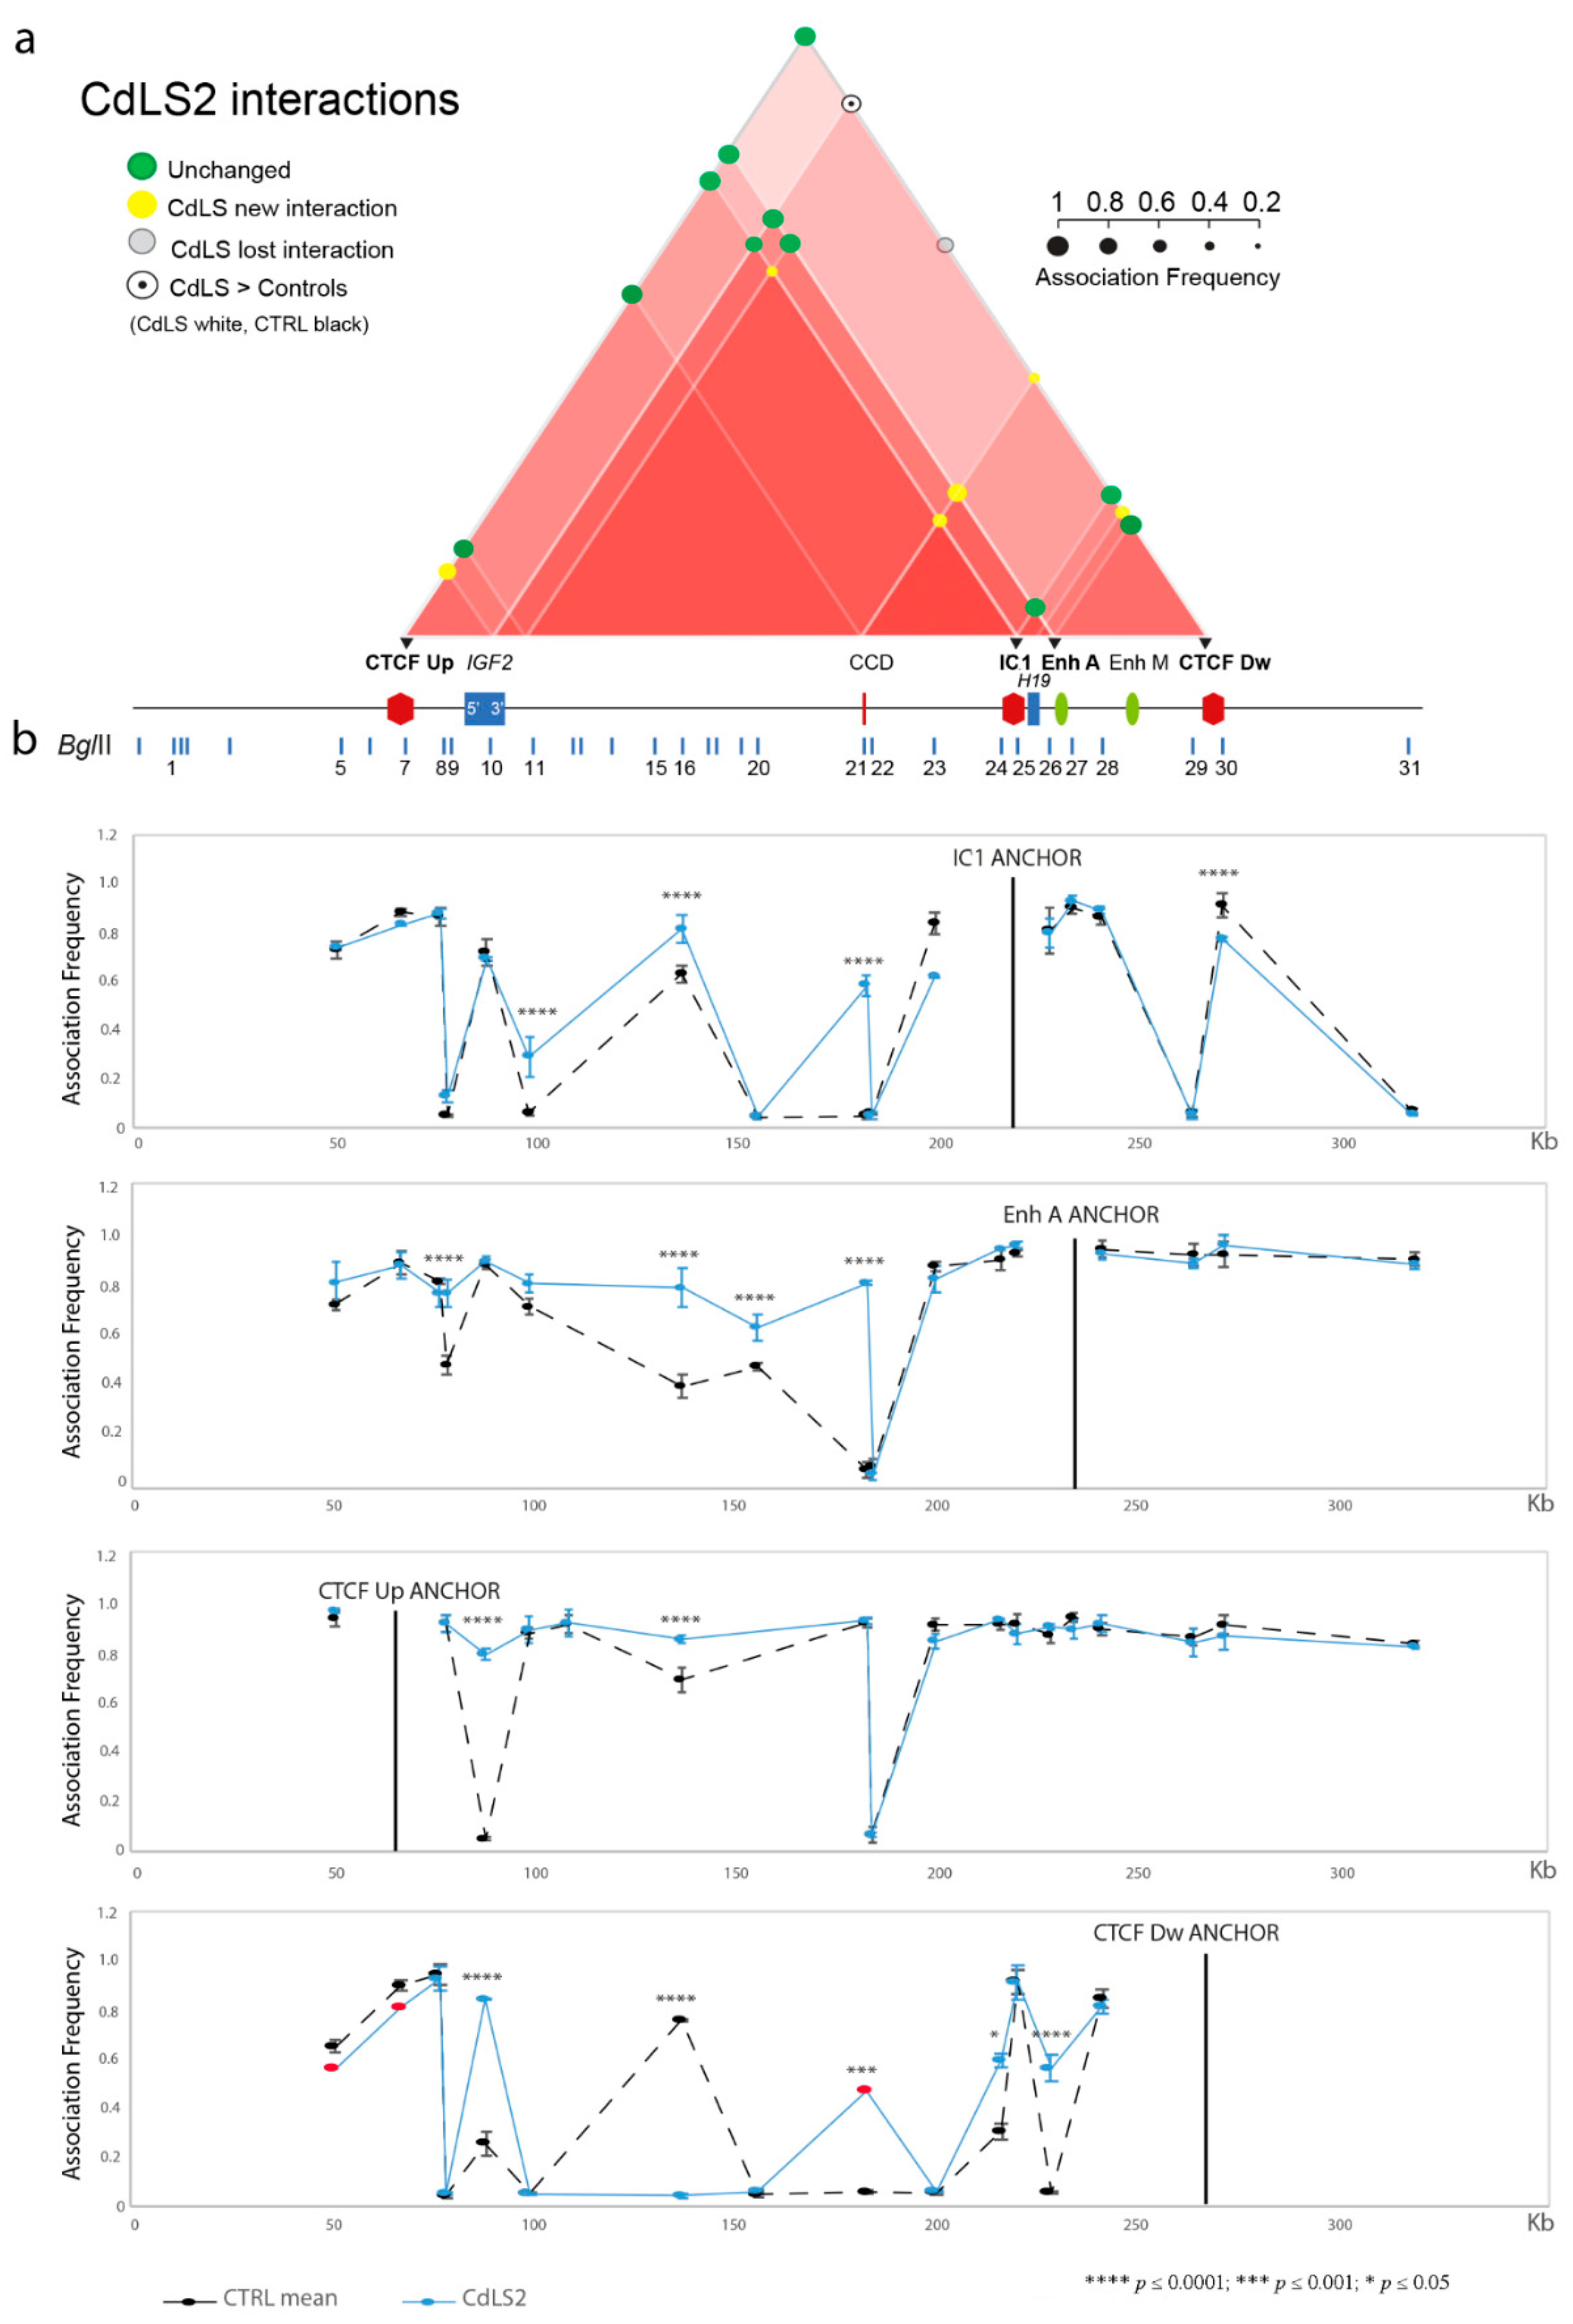
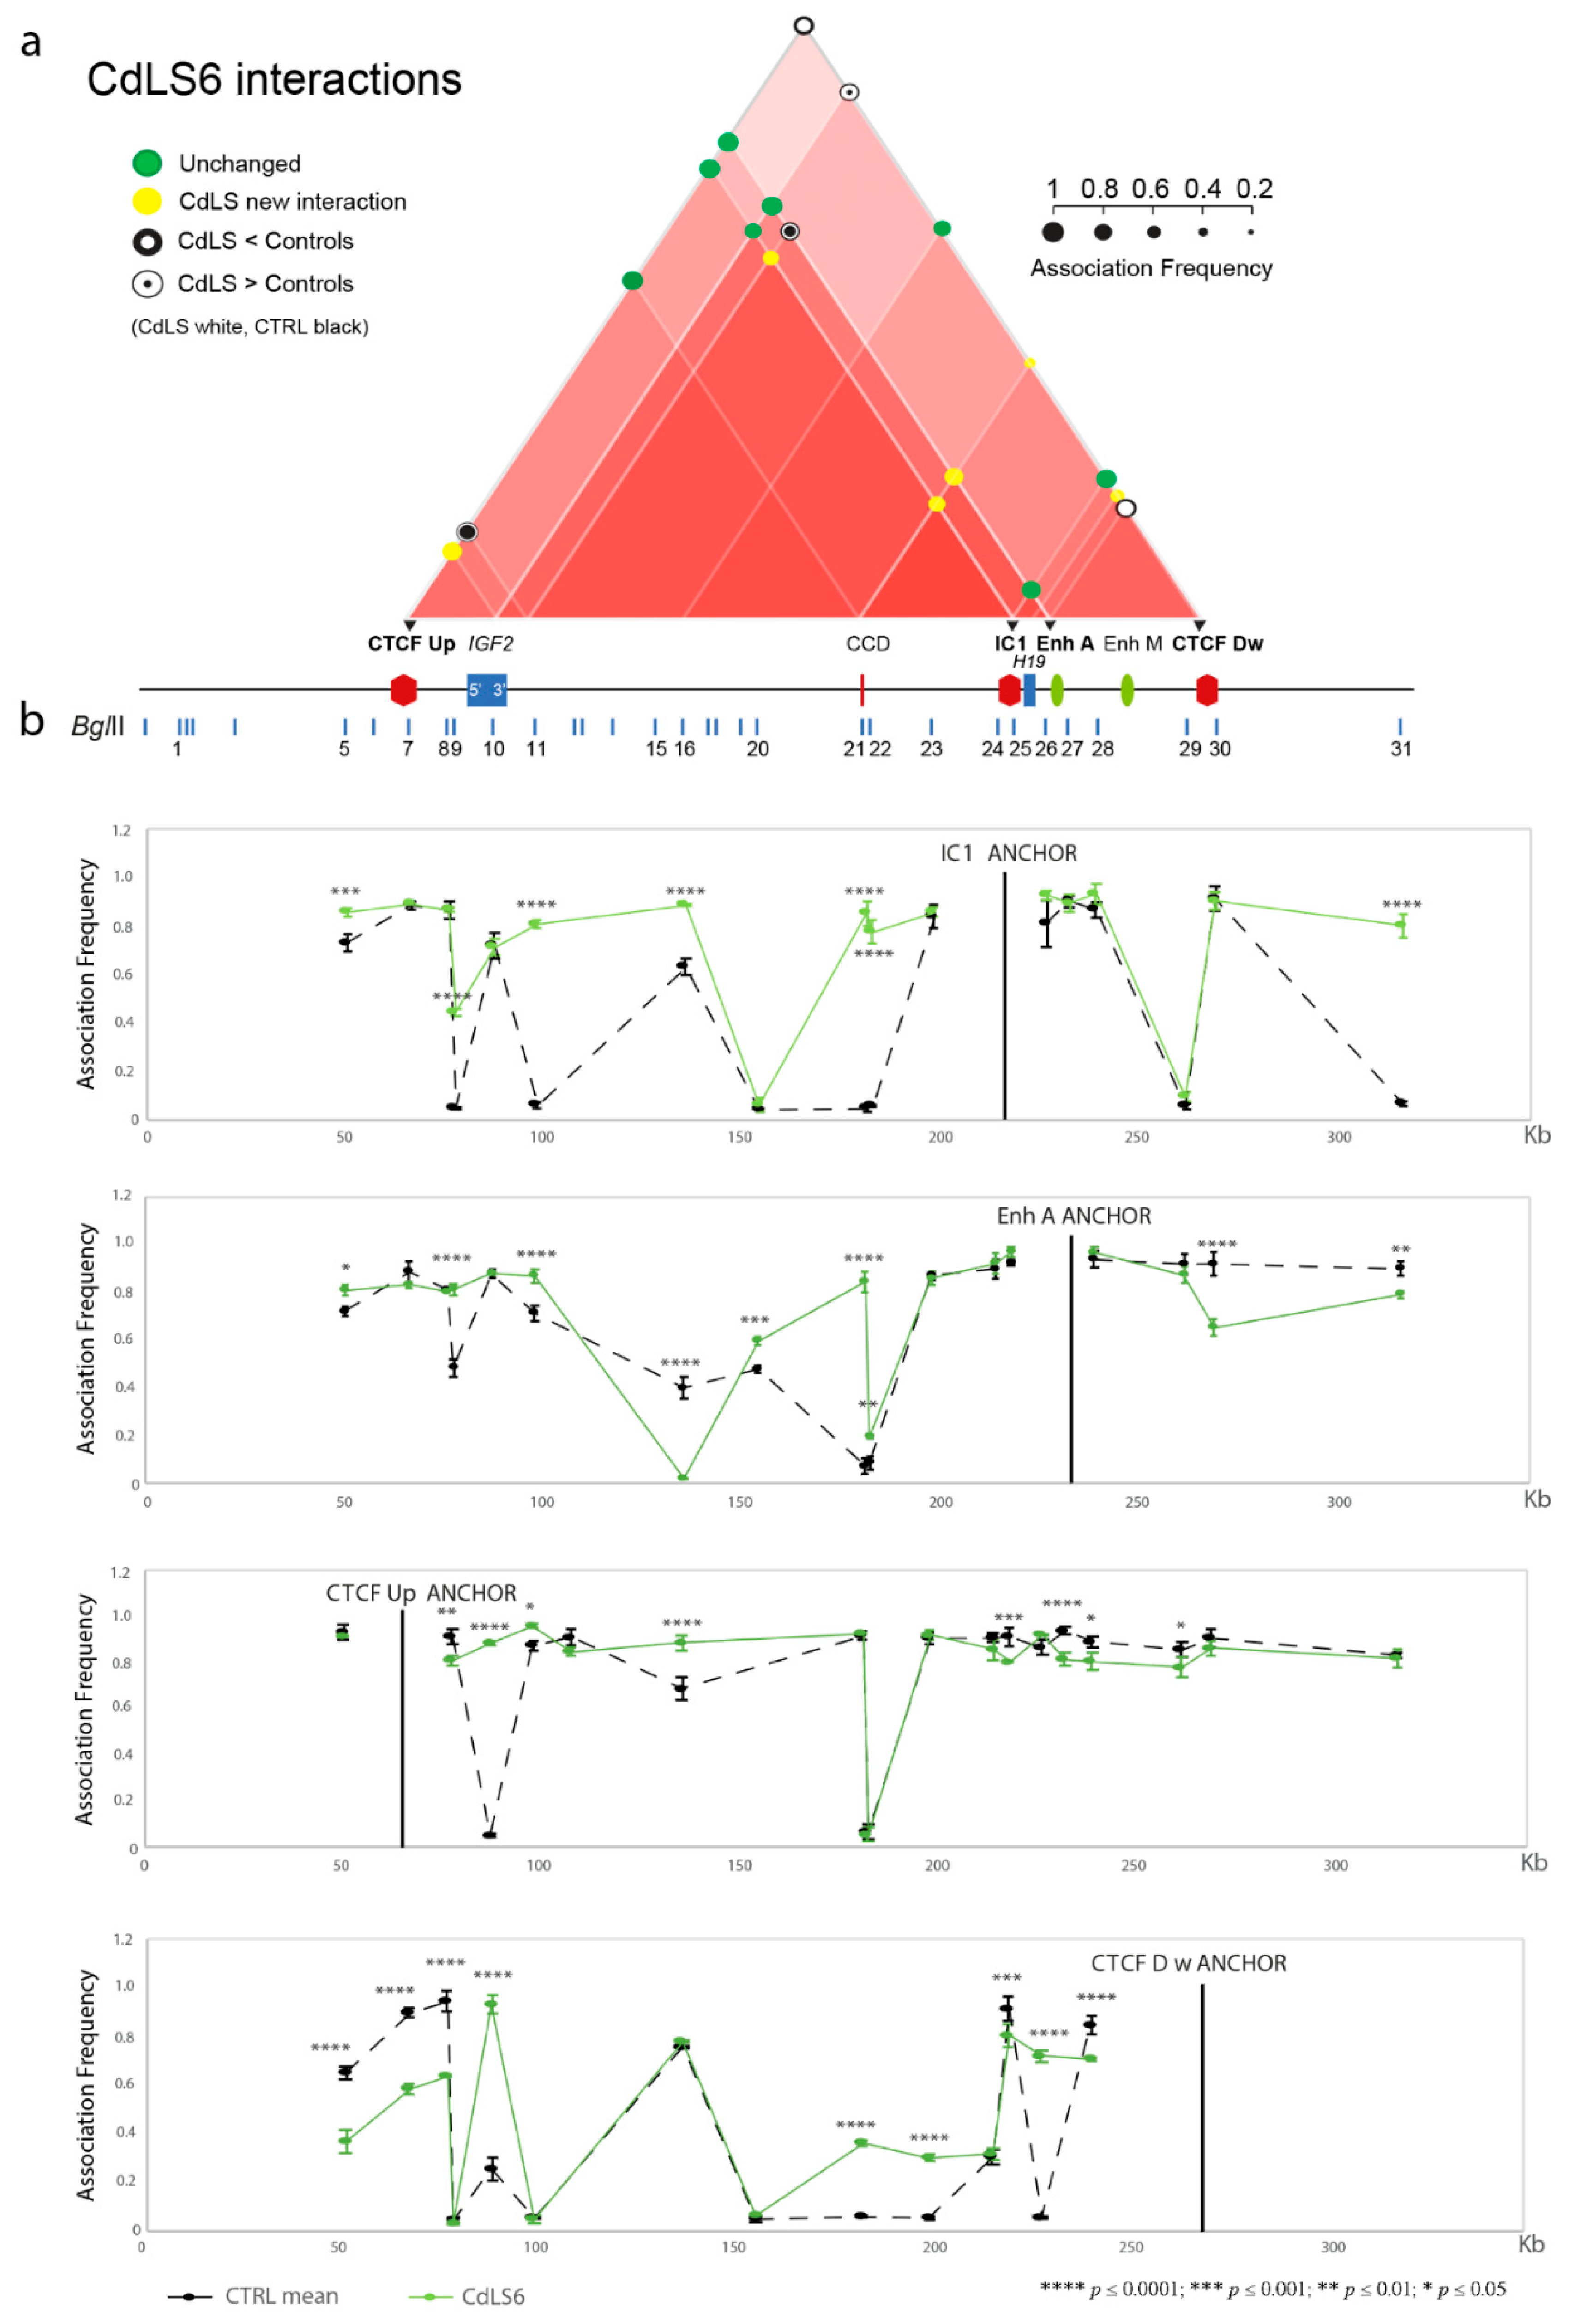
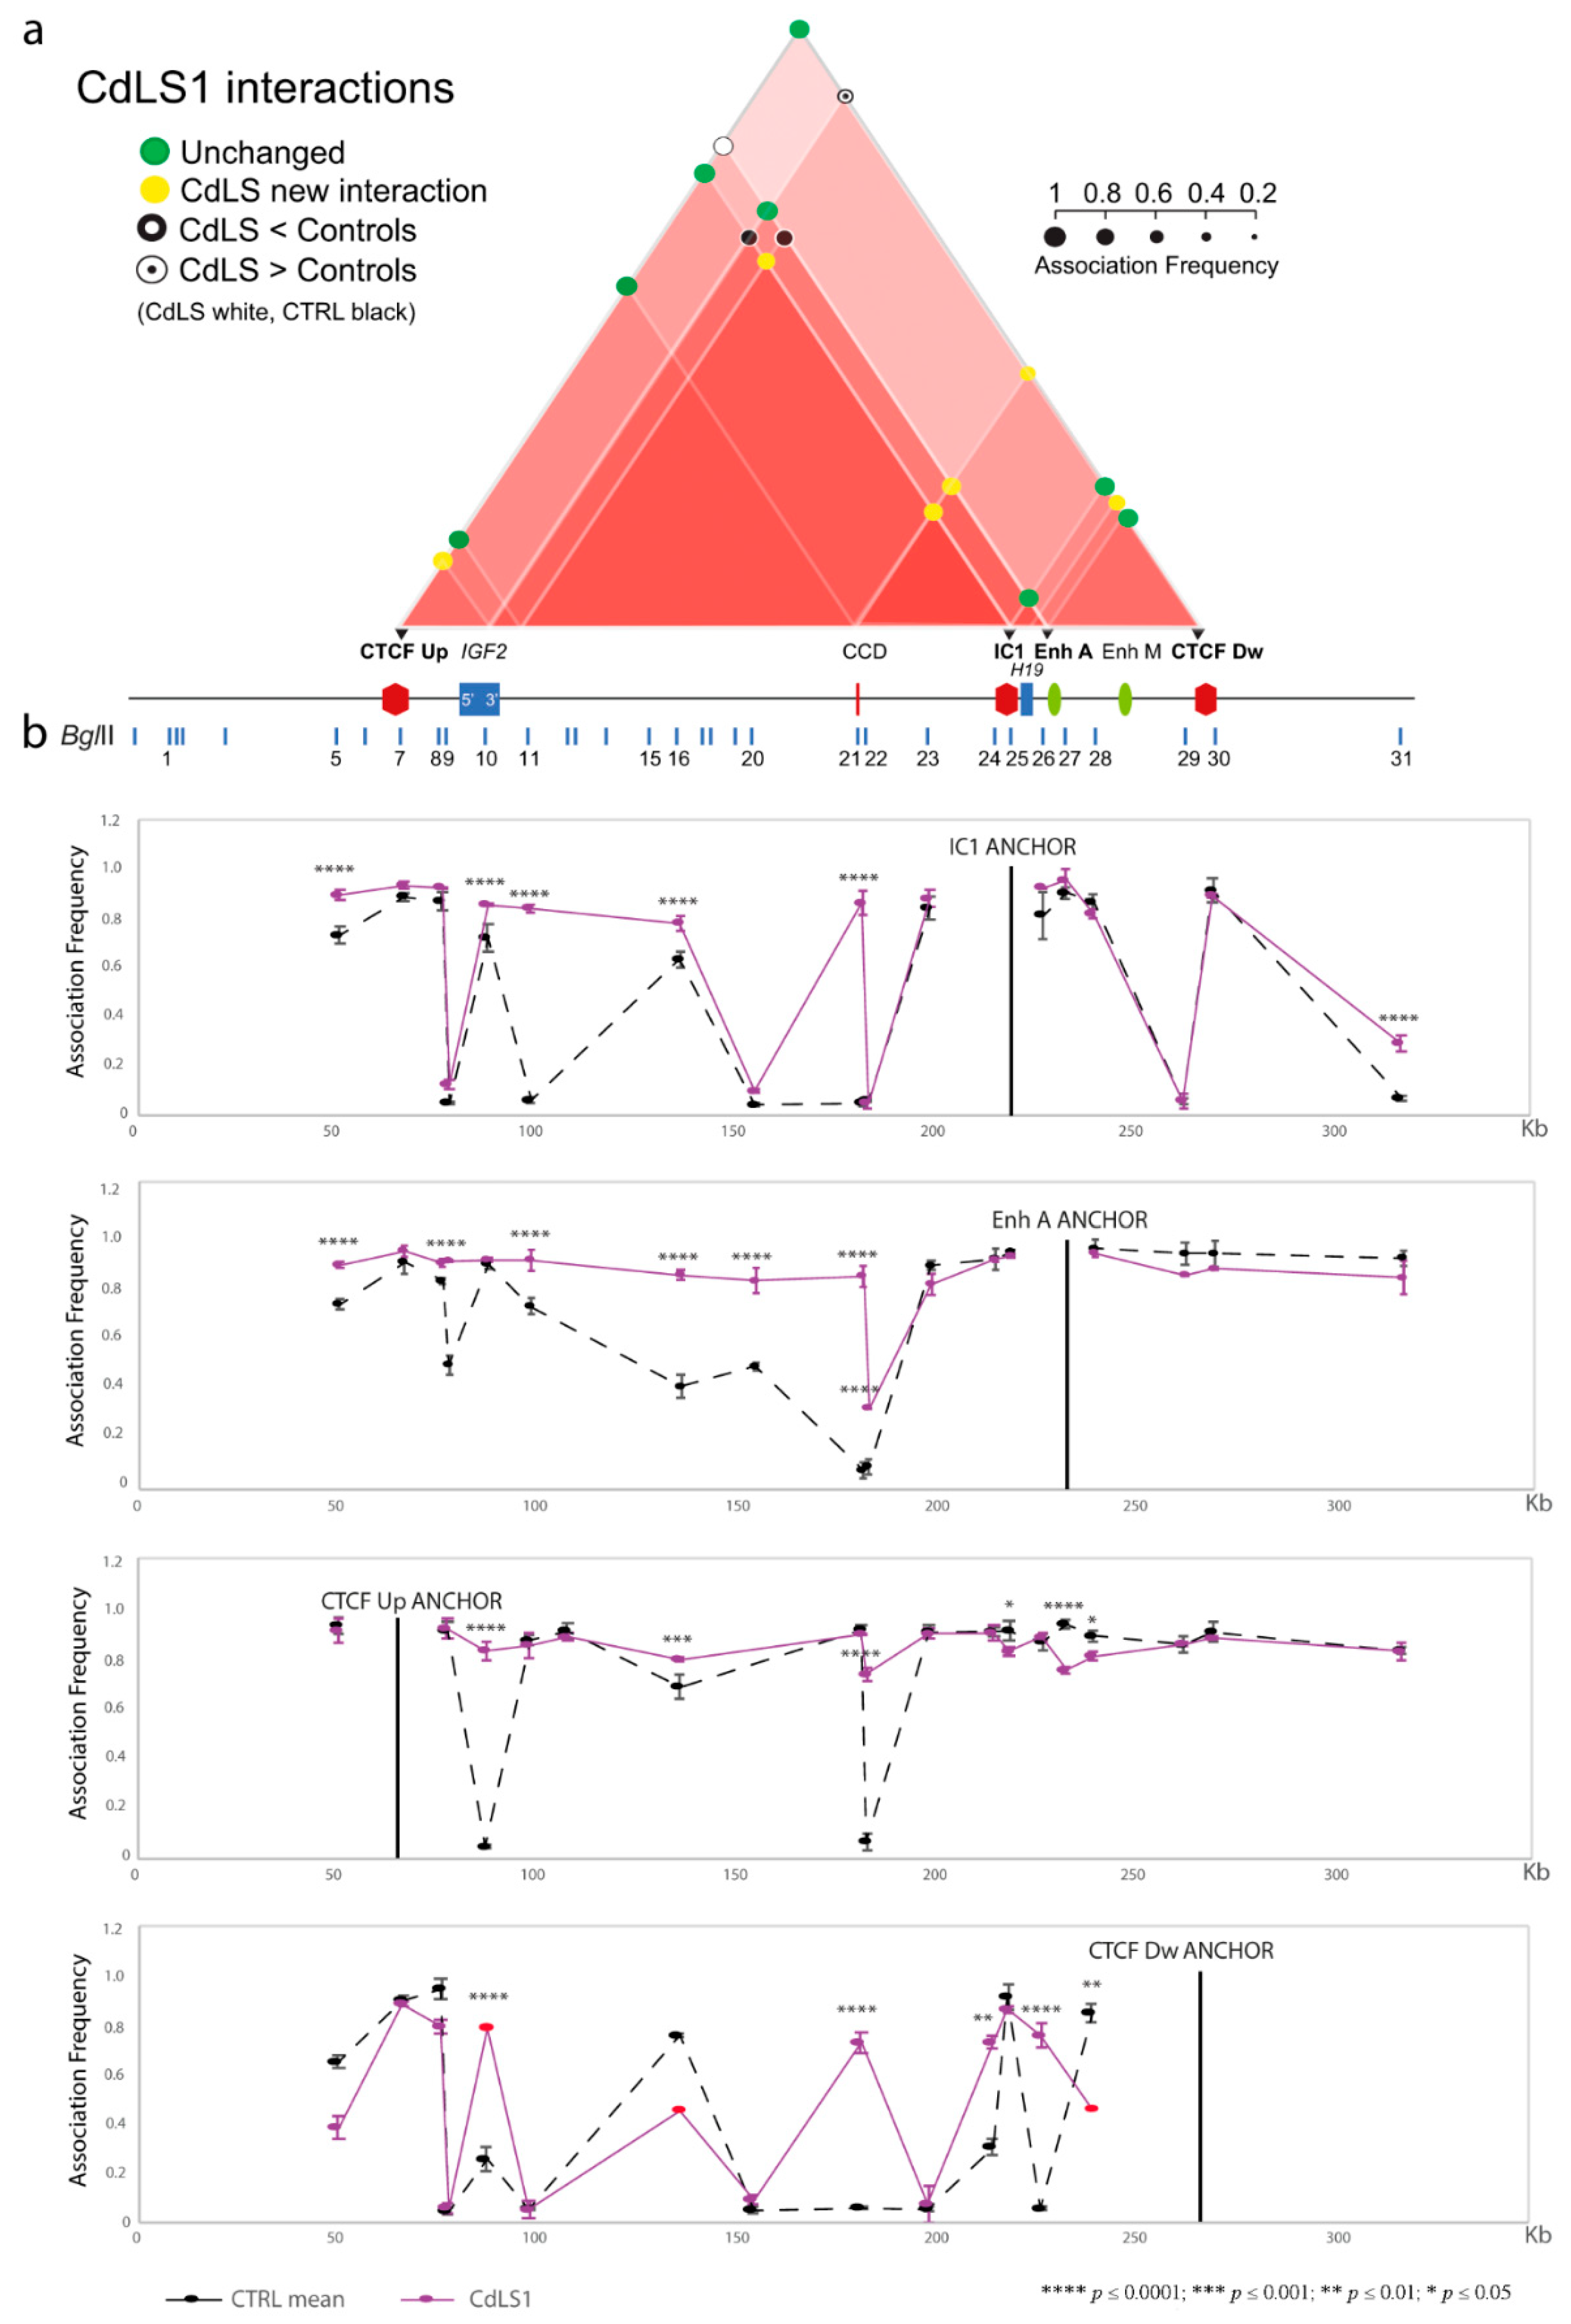
3.1. Chromatin Interactions at the IGF2/H19 Domain in Cells from CdLS Patients

Nativio and coworkers [29] showed a reduction in the looping interactions at the IGF2/H19 imprinted domain after cohesin depletion by RNAi, suggesting a causative relationship between cohesin anomalies and deregulation of imprinted genes. We investigated whether genetic alterations (point mutations and balanced reciprocal translocations) in SMC1A and NIPBL affect the chromatin structure of the IGF2/H19 locus. The detailed landscape of the IGF2/H19 region analyzed by 3C and the 3C coverage is depicted in Figure 1a.
To study the physical contacts in the region, we used four anchors: CTCF Up, IC1, Enh A and CTCFDw (Figure 1). Using this approach, we recently characterized the 3D chromatin structure of the region in BWS and SRS patients and in normal cells [31]. The interactome of the control LCLs included in this study is schematically shown in Figure 1b.
We performed 3C analysis in four CdLS LCLs with genetic defects in SMC1A (CdLS1 and 2) and NIPBL (CdLS6 and 9) genes (Table 1) to identify modifications of the chromatin interactome in the IC1 domain. Two independent experiments were carried out for each cell line. The specific contacts among CTCF-binding sites, regulatory elements and genes mapped in the domain responsible for the repositioning of the regional enhancers near IGF2 or H19 in normal conditions, are summarized in the interactome scheme shown in Figure 2a, Figure 3a and Figure 4a, and the details for each anchor are provided in Figure 2b, Figure 3b, Figure 4b and Figure S1.
We found an aberrant chromatin structure of the IGF2/H19 region in CdLS cells compared to controls (Figure 2, Figure 3, Figure 4 and Figure S1). In particular, interactions of the IGF2 promoter and the CTCF Up were partially conserved, while those involving the enhancer A and the CTCF Dw were perturbed, especially in the CdLS1 and CdLS6 LCLs (Figure 2 and Figure 3). In addition, new interactions between the CCD and the H19 region (IC1, Enh A and CTCF Dw), and between 3′ IGF2 and the IC1/CTCF Up, were observed in all the CdLS LCLs (Figure 2, Figure 3, Figure 4 and Figure S1).
In summary, 3C results show a general impairment of the chromatin architecture in CdLS cells regardless of the specific cohesin gene involved. The emergence of many new interactions could be a further expression of the malfunction of the cohesin complex.

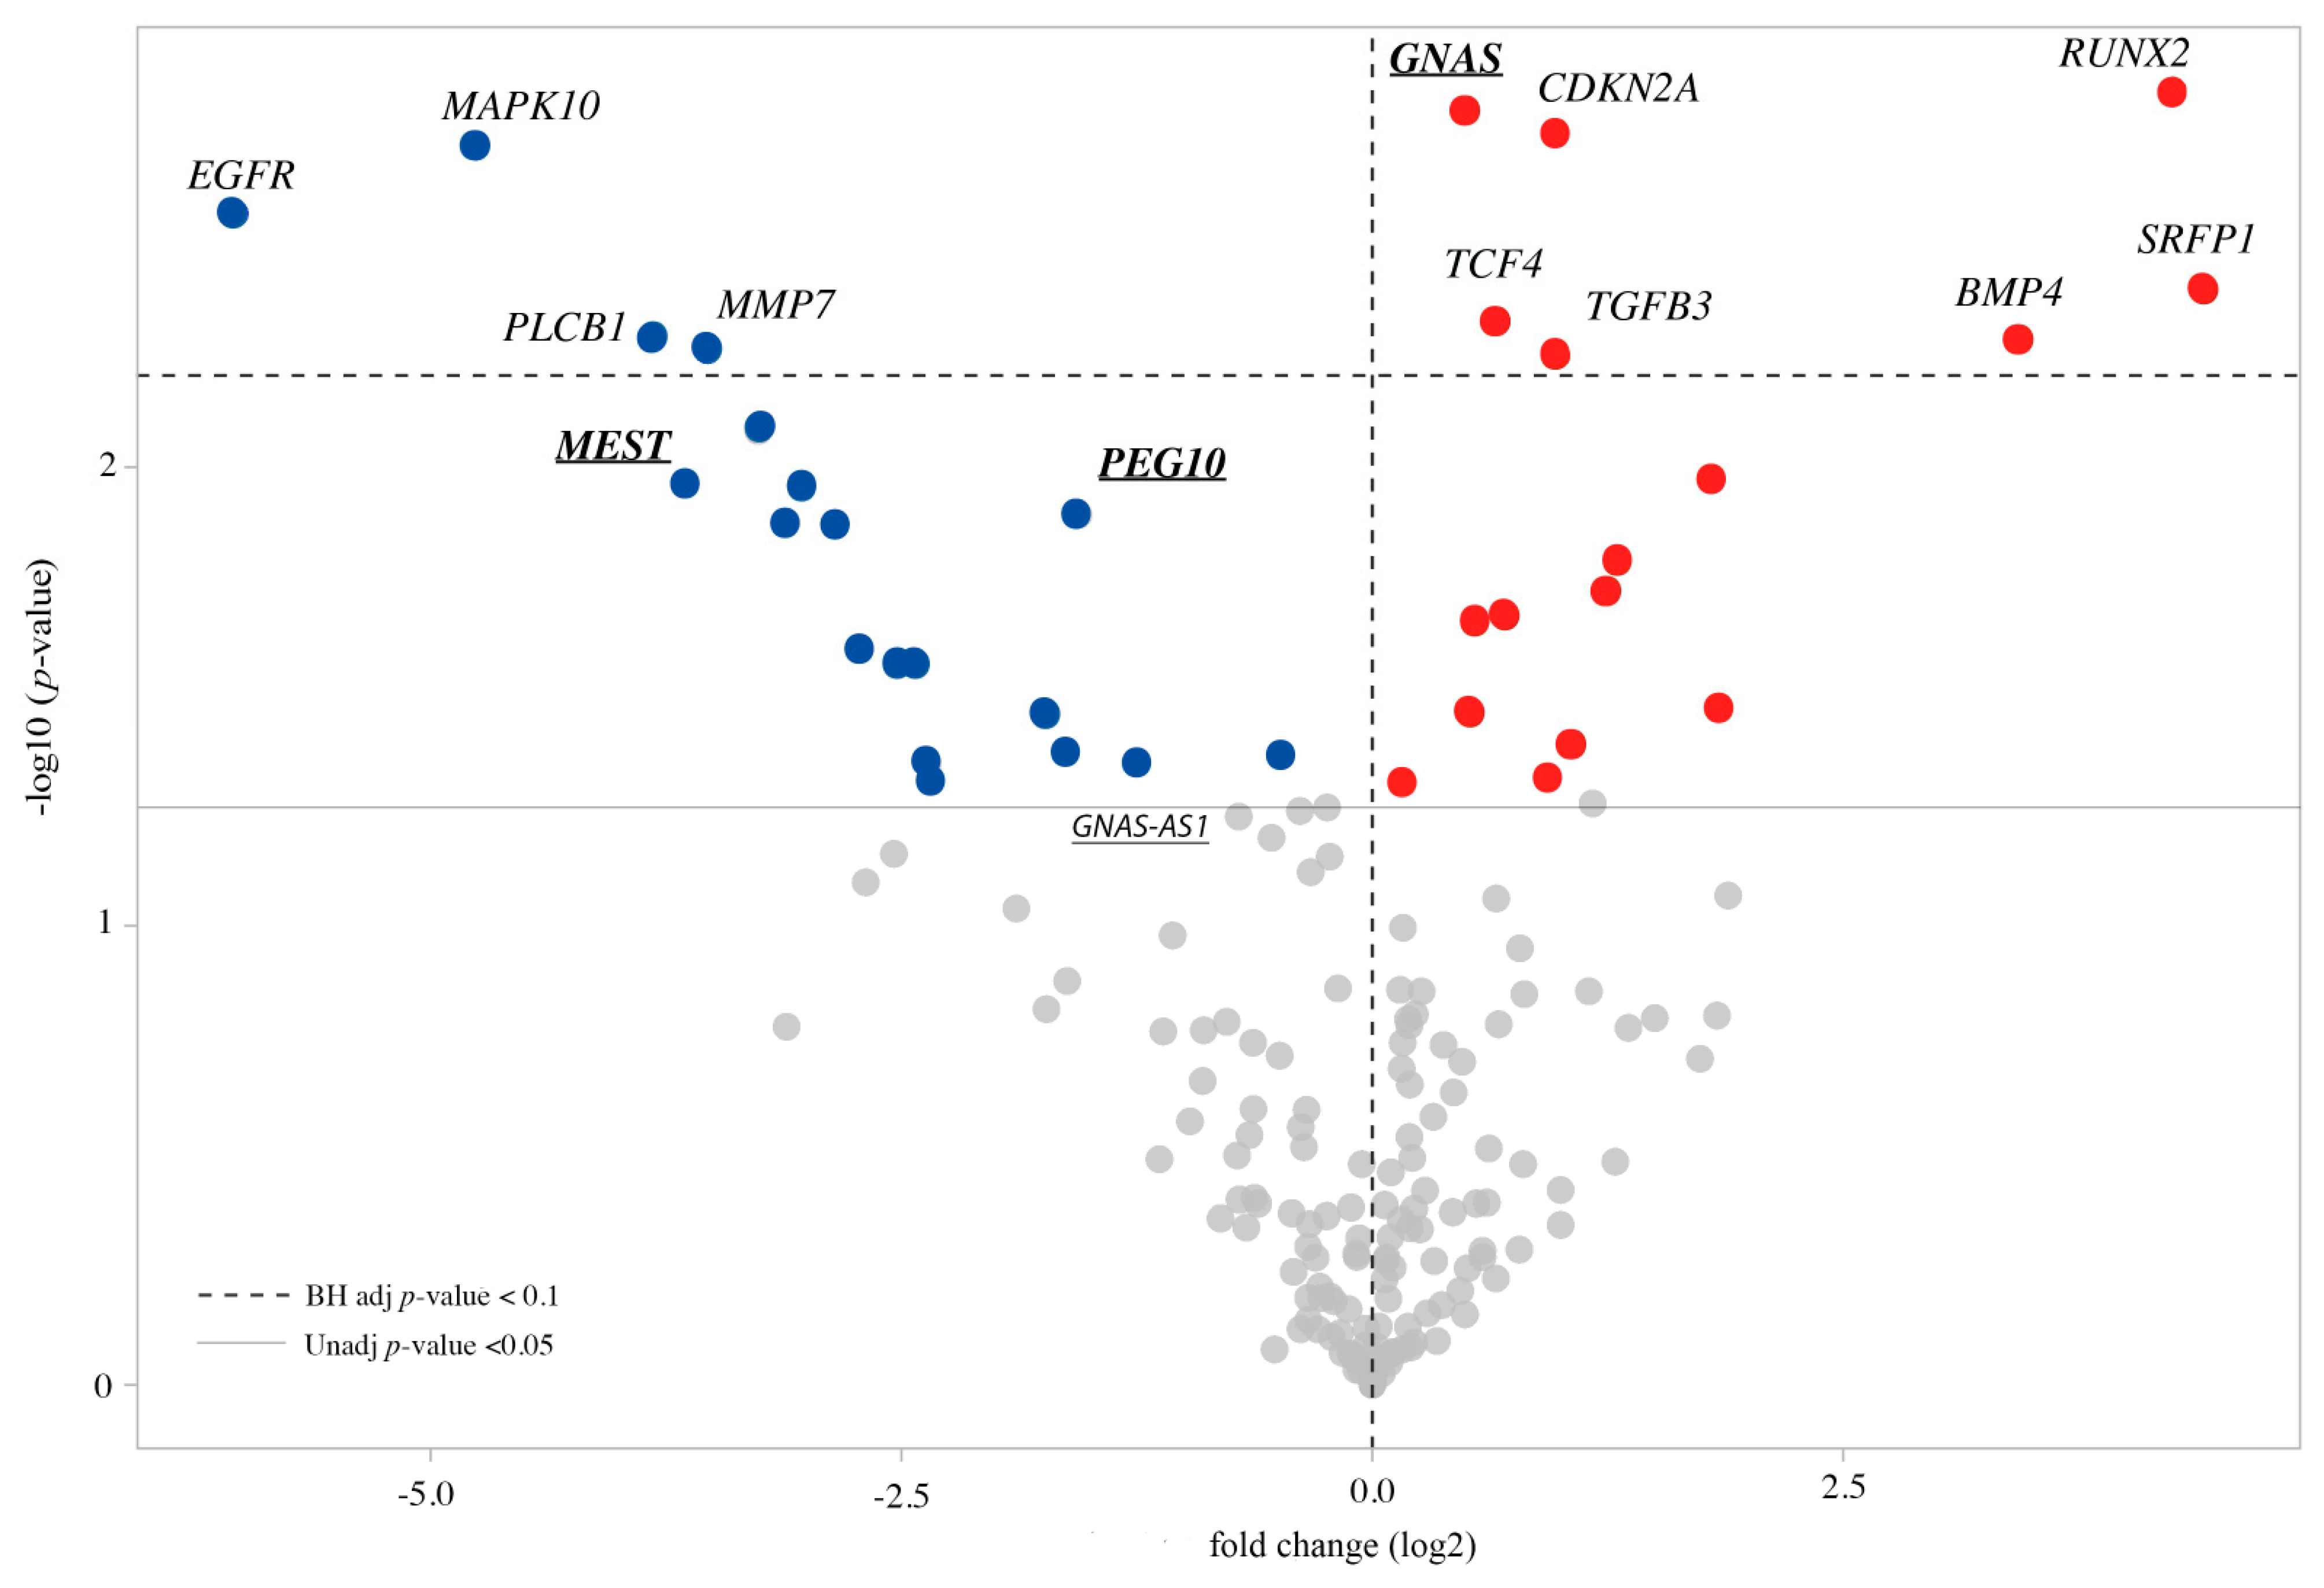
3.2. Expression Profile of the CdLS Cell Lines

Using a Nanostring approach, we analyzed the expression levels of a set of imprinted genes, related-imprinted genes (Table 2) and loci of the WNT pathway (Table 3) in nine CdLS LCLs with different mutations in SMC1A (CdLS 1–5) or NIPBL (CdLS 6–9) genes, and in four control LCLs (CTRL 1–4) (Table 1).

3.3. Imprinted and Imprinted-Related Genes Panel
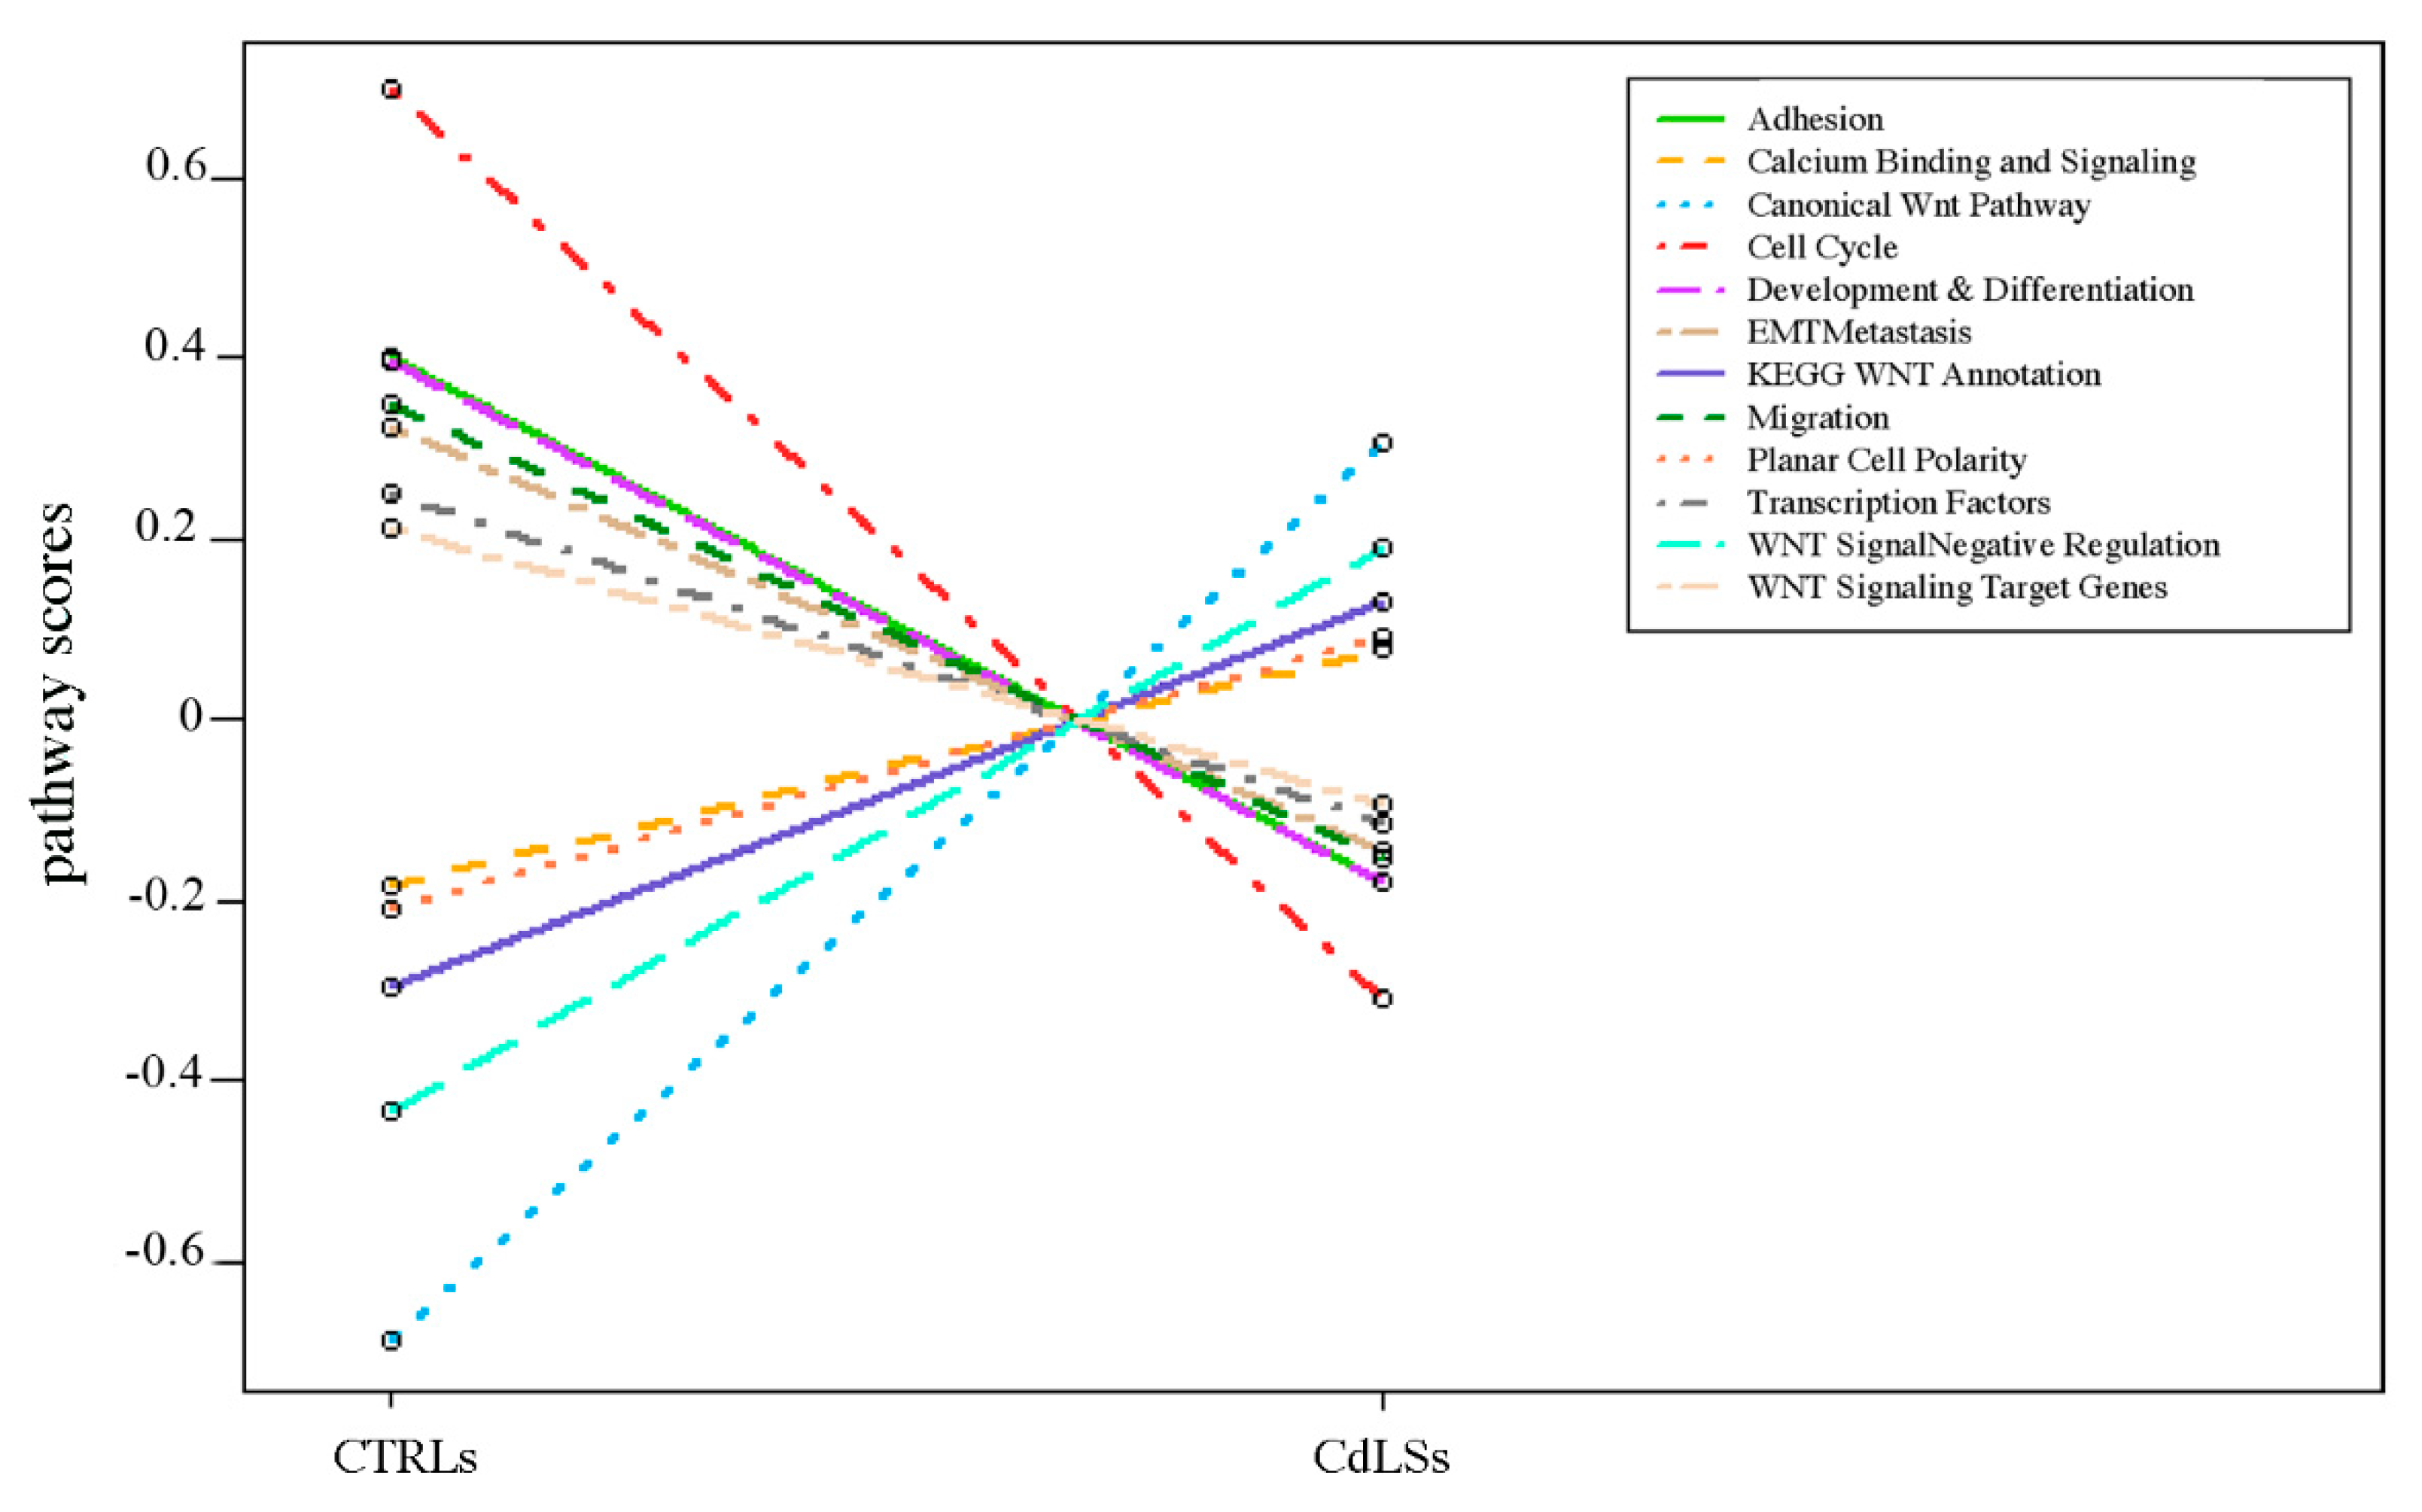
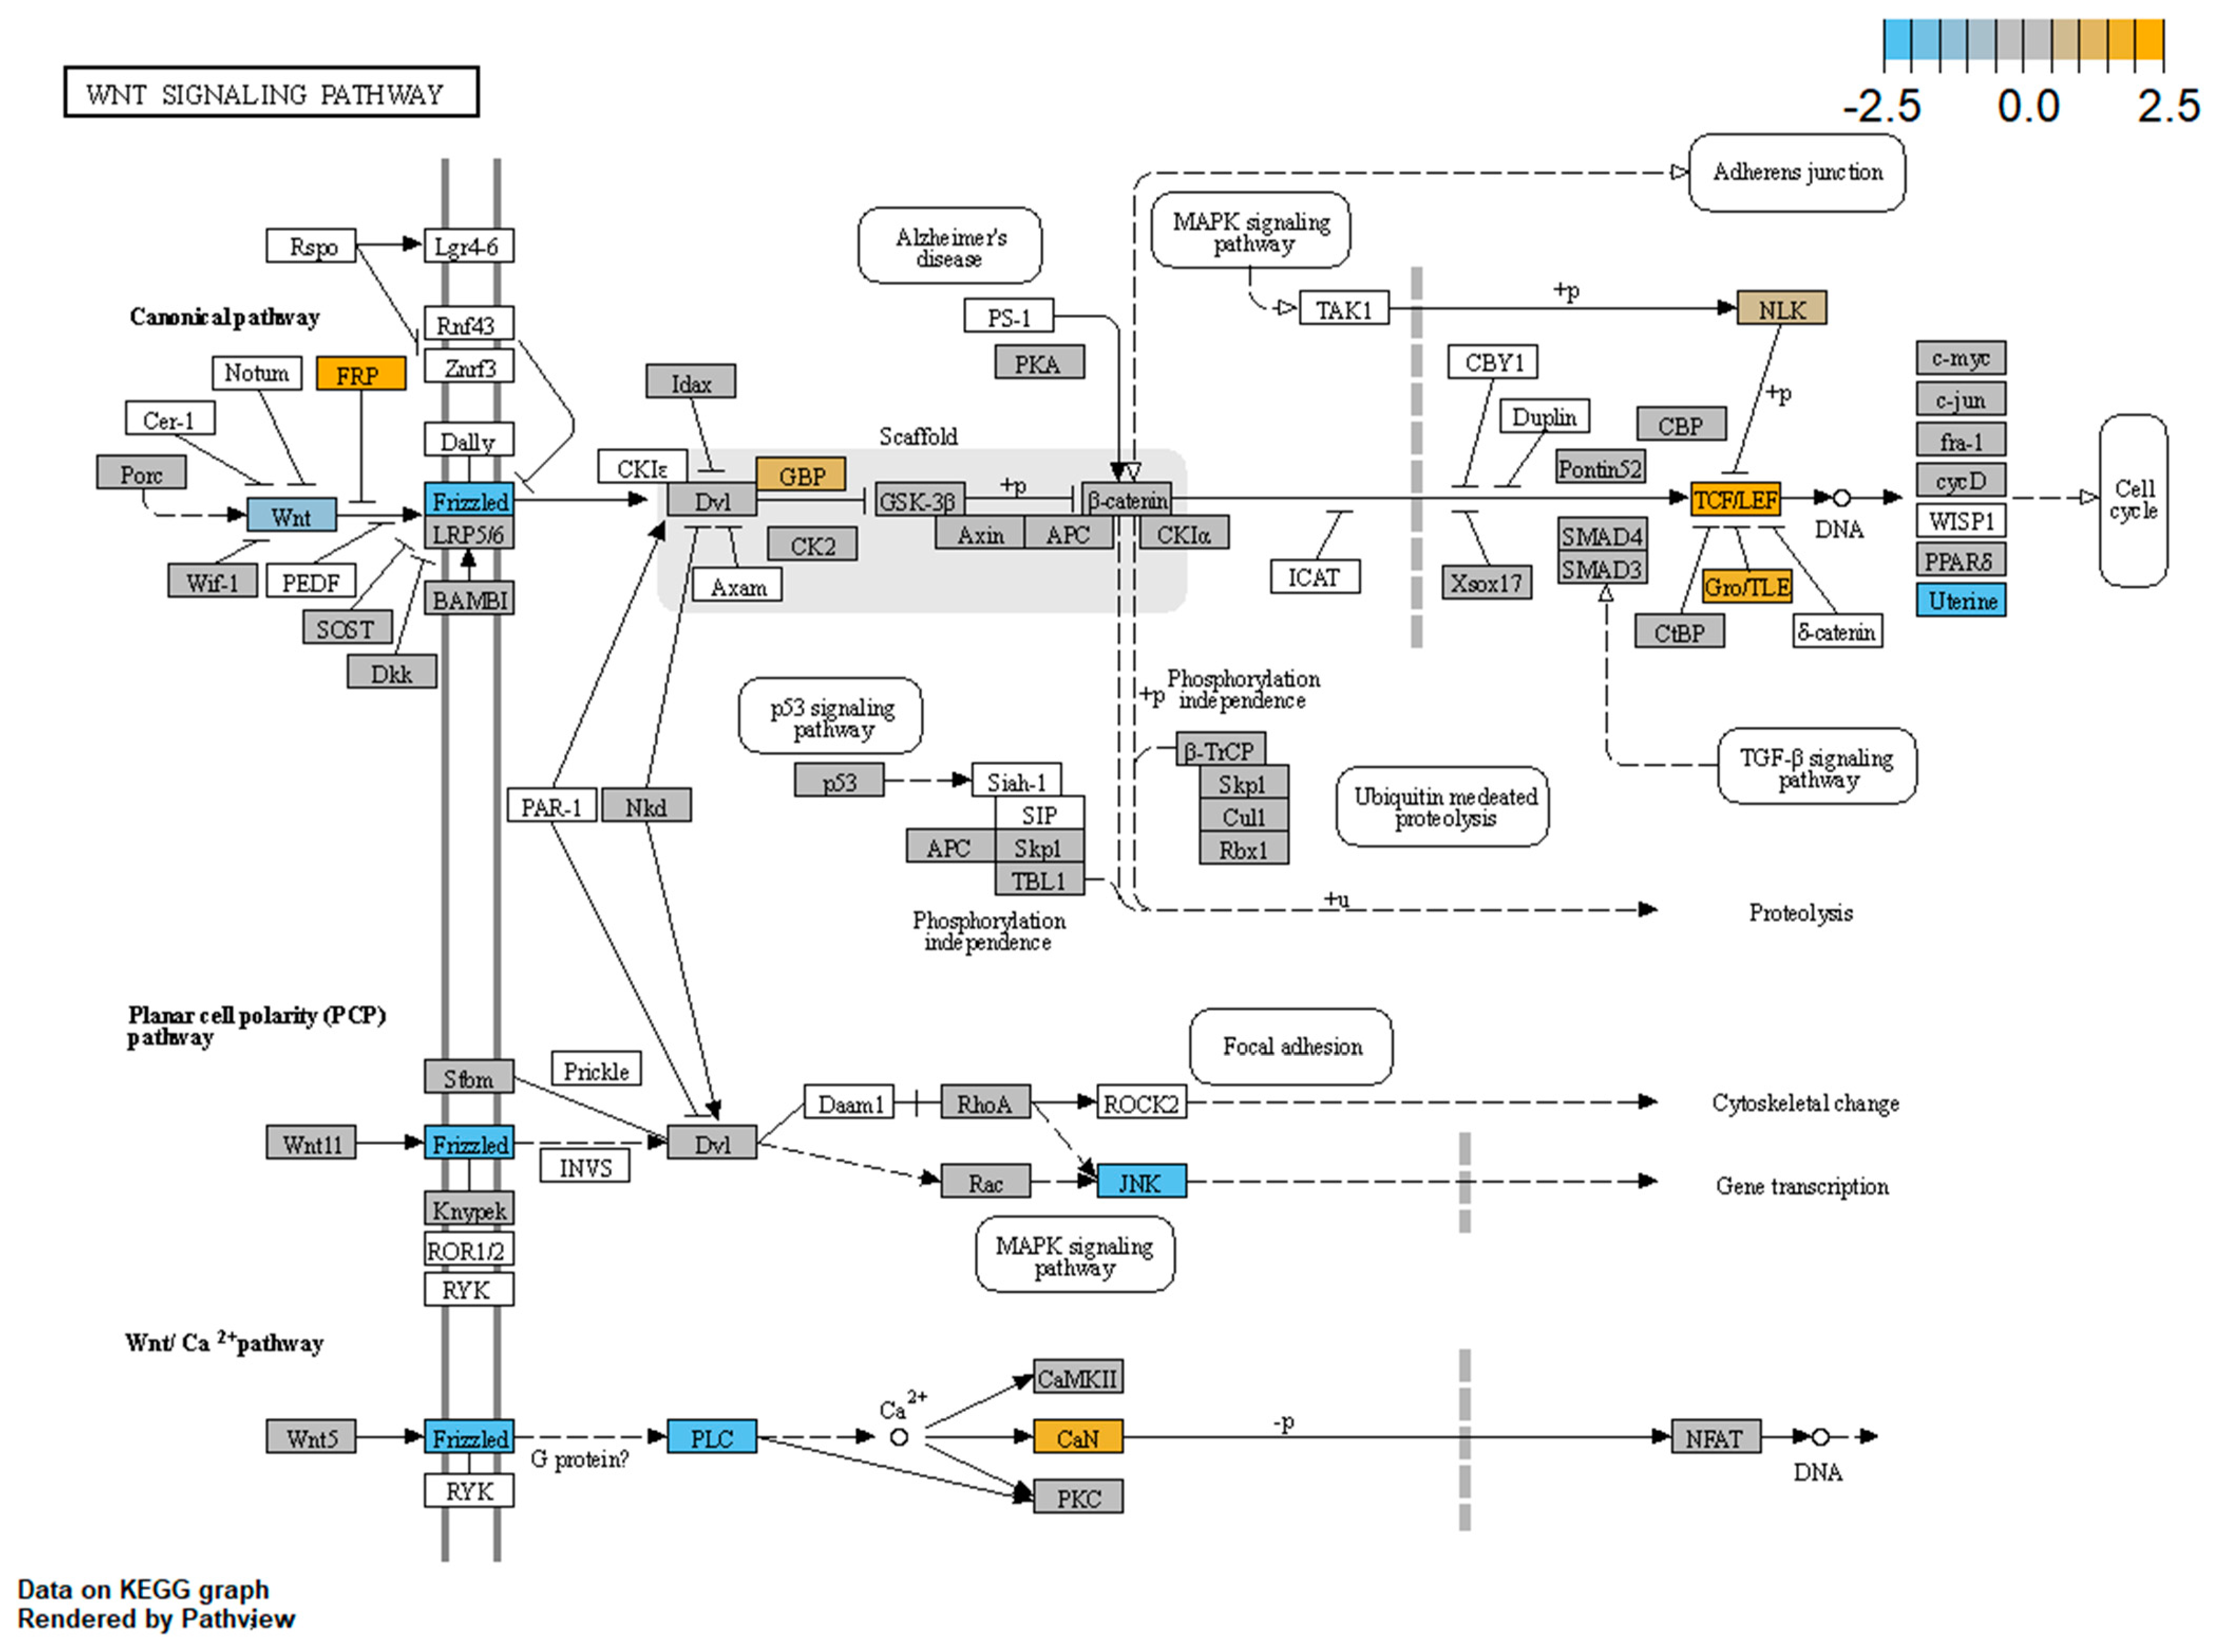
Given that genetic defects in cohesin genes were found to be associated with a general impairment of the 3D chromatin structure of the IGF2/H19 imprinted domain, we investigated the expression profiles in CdLS LCLs in a panel of imprinted genes that are often regulated by a high order of chromatin structure [32,33]. We evaluated the expression levels of 13 imprinted genes and four imprinted-related genes (Table S2a). The analysis of the imprinted genes showed that 7 out 13 were expressed in LCLs (Table 2), and no expression in LCLs was retrieved for IGF2 and H19.
Three out of seven imprinted genes were differentially expressed (DEGs) in patients’ cell lines. In particular, GNAS was upregulated, whereas MEST and PEG10 were downregulated. Furthermore, GNAS-AS1 was downregulated despite being close to the threshold of significance (unadjusted p-value = 0.0058) (Table 2 and Figure 5).
These results indicate that the imprinting network was altered, suggesting an association among cohesin defects, 3D chromatin architecture impairment and imprinting network alteration.

3.4. WNT Panel

Diverse WNT pathways act as master regulators of central nervous system development [35], which is disrupted in CdLS animal models and patient-derived cells lines [35,36,37,50]. Therefore, we next analyzed a panel of 180 genes involved in WNT signaling (Table S2b), of which 163 were expressed in LCLs.
Figure 5. Volcano plot of DEGs CdLS compared to control cell lines. Upregulated genes are highlighted by red dots, while downregulated genes by blue dots. In bold and underlined are reported the DE imprinted genes. FDR < 0.1 (Benjamini–Hochberg adjusted p value) and unadjusted p value < 0.05 are indicated by horizontal lines. The VolcaNoser tool was used for creating volcano plots [51].
Biomolecules 11 01622 g005
Thirty-three differentially expressed (DE) genes were observed in patients’ LCLs (unadjusted p-value < 0.05) compared to controls. Among them, 16 were upregulated and 17 downregulated (Figure 5 and Table 3). Pathway enrichment analysis by the nSolver software indicated that the most significant differences observed in CdLSs cells are in the following subpathways: canonical WNT pathway, cell cycle and WNT signal negative regulation (Figure 6). Among the investigated genes, an altered expression was mainly observed in members of the WNT receptors of the Frizzled gene (FZD) family (FZD5, FZD8 and FZD10 downregulated and FDZ3 upregulated).
Our results confirm alterations of the WNT pathways in LCLs derived from CdLS patients; in particular, we observed the most significant differences in the canonical WNT pathway, cell cycle and WNT signal negative regulation. Figure 7 shows a schematic representation of the expression alterations observed in the three main WNT signaling pathways. The nodes of the pathways that were found to be dysregulated by Pathview (nSolver Advanced Analysis Software 4.0; Figure 7) were: Frizzled (DEGs: FZD3, FZD5, FZD8 and FZD10), Wnt (DEG: WNT10B), FRP (DEG: SFRP1), GBP (DEG: FRAT1), TCF/LEF (DEGs: TCF4, LEF1 and TCF7L1), Gro/TLE (DEG: TLE1), Uterine (DEG: MMP7), JNK (DEG: MAPK10), PLC (DEG: PLCB1), and CaN (DEGs: PPP3CA and PPP3CC).
Finally, we performed three different expression analyses splitting CdLSs samples based on NIPBL and SMC1A involvement, comparing NIPBL-mutated CdLSs vs. CTRLs (Figure S2a), SMC1A-mutated CdLSs vs. CTRLs (Figure S2b) and NIPBL- vs. SMC1A- mutated CdLSs (Figure S2c). Differently to the main cohort (CdLSs vs. CTRLs, Figure 5 and Figure 6), in none of the three subsets, we found differentially expressed genes with Benjamini–Hochberg adjusted p-values <0.1. Some genes reached a significant unadjusted p-value < 0.005. Interestingly, considering the NIPBL-mutated samples, 17 DEGs reached the significant threshold of 0.005, among them nine are shared with the most significant DEGs of the main cohort: SFRP1, TCF4, GNAS, MEST, MAPK10, CDKN2A, PLCB1, RUNX2 and MMP7 (Figure S2a). Similarly, the SMC1A-mutated group showed nine out of the 25 significant DEGs in common with the main cohort: RUNX2, BMP4, MAPK10, GNAS, CDKN2A, TGFB3, TCF4, PEG10 and PLGB1 (Figure S2b). When we consider the NIPBL- vs. SMC1A-mutated CdLSs subset, the number of shared significant DEGs (p-value < 0.005) drops to 2: RUNX2 and MAPK10 (Figure S2c). These findings are in line with the results of Boudaoud et al. that compared the gene expression profiles of LCLs from patients carrying mutations in NIPBL and SMC1A and showed reduced number of differentially expressed genes shared between the two gene groups (n = 126) compared to the totality of genes misregulated in NIPBL-mutated (n = 1431) and SMC1A-mutated (n = 1186) samples [52].

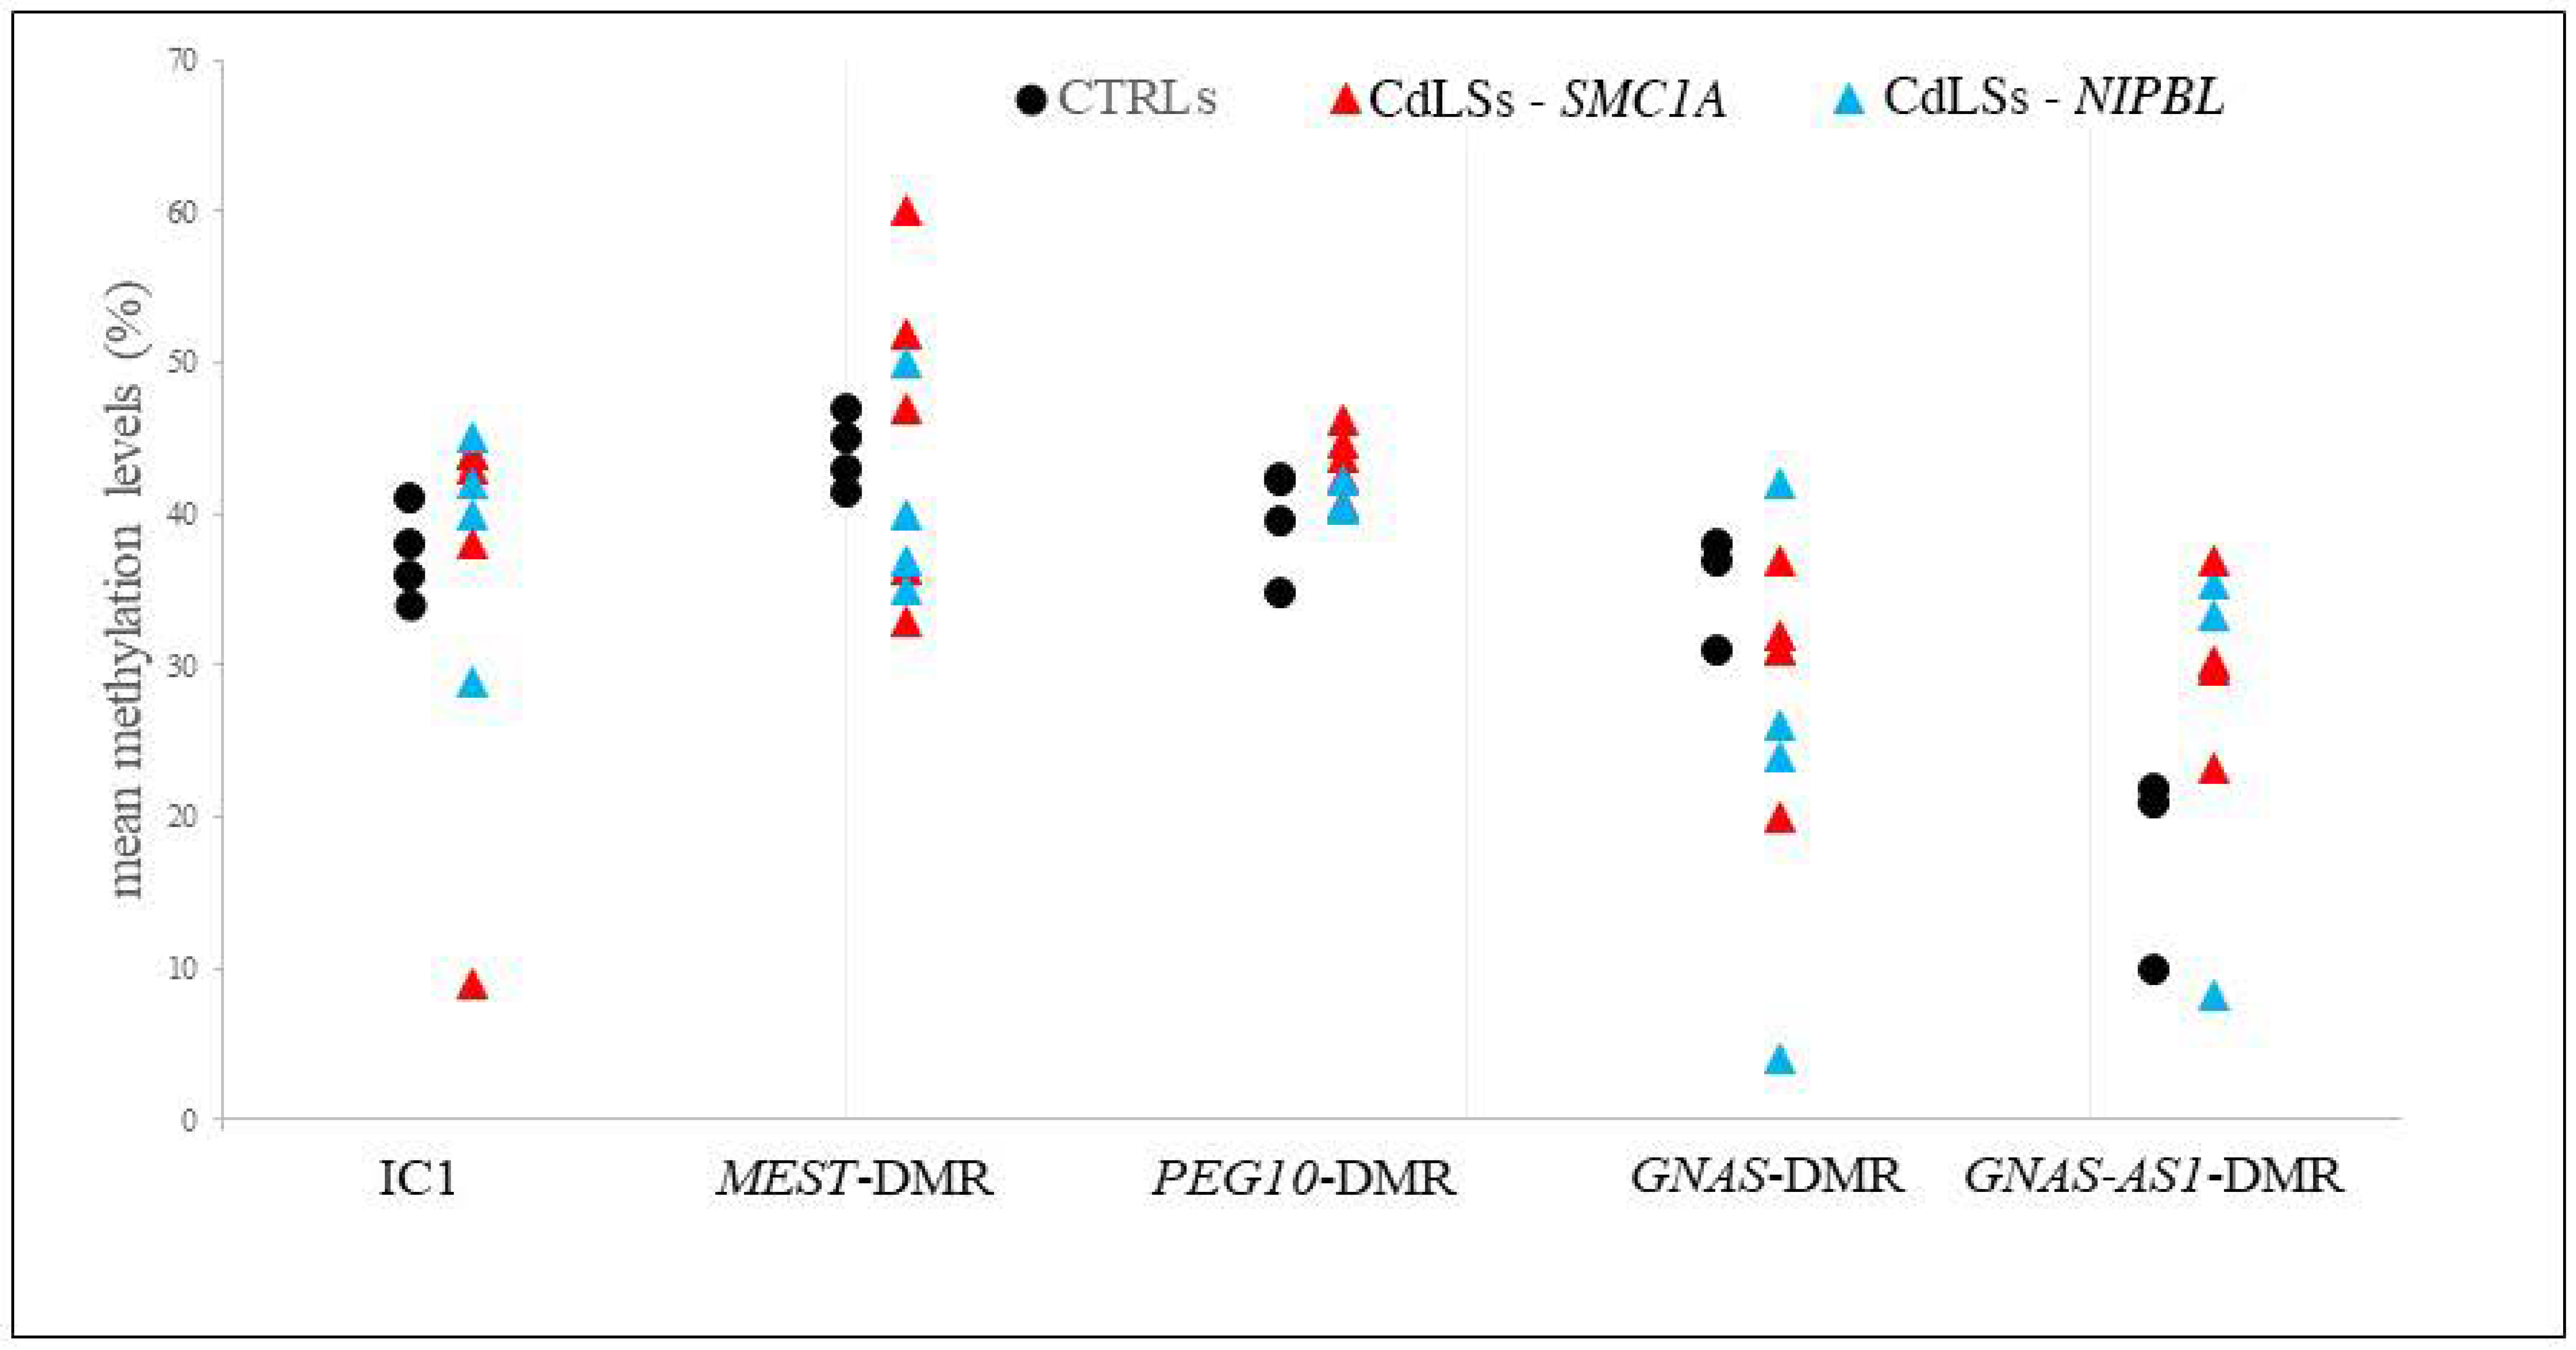
3.5. Methylation Analysis of the Imprinted DMRs

We analyzed the methylation status of the IGF2/H19, MEST, PEG10, GNAS and GNAS-AS1 DMRs by pyrosequencing to evaluate possible correlations between the observed chromatin structure and expression defects and the methylation levels of the regulatory regions of these imprinted genes.
In CdLS LCLs we observed a general instability in the methylation status of the IC1 and MEST-DMR, a trend to hypermethylation of the PEG10 and GNAS-AS1 DMRs and a trend to hypomethylation of the GNAS-DMR compared to CTRLs (Figure 8 and Table S3): IC1 methylation range was 9–45% in CdLSs and 34–41% in controls; MEST-DMR methylation range was 33–60% in CdLSs and 42–47% in controls; PEG10-DMR methylation range was 41–44% in CdLSs and 35–43% in controls; GNAS-DMR methylation range was 4–42% in CdLSs and 31–37% in controls; GNAS-AS1-DMR methylation range was 8–37% in CdLSs and 10–22% in controls. In CdLS cells, hypermethylation of PEG10, MEST and GNAS-AS1 DMRs was in line with the observed low expression, in the same way GNAS-DMR hypomethylation was in line with its overexpression; the alterations in IC1 methylation may be the result of the perturbation in chromatin architecture of the IGF2/H19 imprinted domain. Regarding the specific gene mutated in the CdLS LCLs a more pronounced variation in methylation status is apparent in SMC1A involvement, in particular for MEST, PEG10 and GNAS-AS1 DMRs.

4. Discussion

Cohesin has complex functions in chromosome biology, including gene expression regulation and maintenance of chromatin architecture [53]. Defects in cohesin function are associated with a group of diseases known as cohesinopathies, notably CdLS.
Starting from the evidence that cohesin depletion causes a reduction in the looping interactions in the IGF2/H19 imprinted domain [29], we studied the 3D chromatin structure of this locus in LCLs from CdLS patients with mutations in the SMC1A or NIPBL genes, and evaluated whether constitutive genetic mutations in the cohesin subunit genes can alter chromatin architecture and, consequently, gene expression.
We found a broad perturbation in the chromatin structure of the domain regardless of the CdLS causative gene, and observed a change in the interactions among CTCF-binding sites, regulatory elements and genes of the region. This scenario could be related to the existence in each cell line of a diffuse instability rather than recurrent alterations of specific interactions. It is also conceivable that compromised maintenance of chromatin architecture could lead to heterogeneous defects among cells in the same cell line. The alterations can be due to cohesin malfunction rather than lack of function. The improper sliding of the cohesin complex along the loop could, indeed, cause the observed perturbed chromatin interactions, including new associations.
In addition, we found that the 3D chromatin alterations of the locus were associated with methylation defects of IC1 in some CdLS cell lines. Methylation of this DMR controls the expression of the IGF2 and H19 imprinted genes. In our recent study we reported that, in BWS and SRS imprinting-related disorders, the causative methylation defects at IC1 are associated with alterations in the 3D chromatin architecture of the domain [31]. Differently, in CdLS it is conceivable that the observed methylation instability is related to chromatin structure alterations caused by a malfunction of the cohesin complex.
Imprinting disorders are frequently associated with growth and development abnormalities [54,55]; similarly, prenatal and postnatal growth restriction are observed in CdLS patients [56]. This feature might be also related to an imprinting network perturbation suggested by our data. In particular, we found methylation instability of the DMRs and/or defective expression of loci involved in fetal growth such as PEG10, MEST, GNAS, IGF2 and H19 [55,56,57].
DMRs methylation instability at multiple imprinted loci has already been identified in patients with multilocus imprinting disturbances (MLID), thus demonstrating a fine-tuned network involving regulatory regions of imprinting [58]. Similarly, in CdLS we surmise a broad impairment of the maintenance of the regulatory mechanisms of genomic imprinting, resulting in a general instability of the imprinting marks, which might be related, in this disease, to cohesin defects. These findings strengthen the key role of this complex in transcription regulation.
Based on the pivotal role of cohesin in the dynamics of the transcriptional regulation network, and on the hypothesis that the multiorgan defects in CdLS patients are due to global disruption of the transcriptional regulation network of developmental pathways, including the canonical WNT pathway [59,60,61], we investigated the expression profile of a panel of 180 genes of the WNT pathways. In vertebrates, the WNT signaling pathway regulates crucial aspects of the embryonic development and maintenance of adult tissue homeostasis by regulating cell proliferation, differentiation, migration, genetic stability, and apoptosis, as well as maintenance of adult stem cells in a pluripotent state [62]. These processes are obtained through two principal branches: the canonical pathway that regulates the expression of the key developmental target genes through the frizzled family receptors and, the intracellular transducer Dishevelled, and the noncanonical WNT pathway (β-catenin-independent pathway) that regulates cell polarity and dorsal mesodermal cell movements during development [37,63].
We found 33 genes specifically deregulated in CdLS LCLs, some of which are involved in transcriptional regulation: RUNX2, CDKN2A, TCF4, LEF1, SOX2 and TCF7L1.
RUNX2 gene was the most significantly upregulated; it is a member of the RUNX family of transcription factors, nuclear proteins with a DNA-binding domain. RUNX2 is essential for osteoblastic differentiation and skeletal morphogenesis and acts as a scaffold for other regulatory factors involved in tissue-specific expression of the skeletal. Mutations in this gene have been associated with cleidocranial dysplasia [64,65]. The most strongly downregulated gene was MAPK10, a gene involved in neuronal proliferation, differentiation and survival. Interestingly, RUNX2 and MAPK10 are the only two significant DEGs (unadjusted p-value 0.0462 and 0.0221, respectively) when we consider the NIPBL- vs. SMC1A- mutated CdLSs subset.
Our results confirm alterations of the WNT pathways in LCLs derived from CdLS patients; in particular, we observed the most significant differences in the canonical WNT pathway, cell cycle and WNT signal negative regulation. In addition, we found that several genes belonging to the pathway nodes were deregulated; in particular the key node of the frizzled receptors was repressed, specifically FDZ3, FZD5, FZD8 and FZD10 genes.
Because cohesin represents the primary regulator of 3D genome organization and, consequently, of the gene expression in all cell types, we used LCLs as a model for CdLS; however, we are aware that different expression profiles may be present in cells of other embryological origin.
Our study provides new evidence that the mutations in genes of the cohesin complex may affect chromatin architecture and the epigenetic stability of genes commonly regulated by high order chromatin structures, such as the imprinted loci. Altered imprinted gene expression could, at least in part, explain the growth defects present in CdLS.

Supplementary Materials

The following are available online at https://www.mdpi.com/article/10.3390/biom11111622/s1, Figure S1. Abnormalities in chromatin architecture at the IC1 locus of the CdLS9 cell line (NIPBL mutation). Figure S2. Three different expression profiles of CdLS samples split by NIPBL and SMC1A variations evaluated by nCounter Nanostring technology. A) NIPBL-mutated CdLSs versus CTRLs. B) SMC1A-mutated CdLSs versus CTRLs. C) NIPBL-mutated versus SMC1A -mutated CdLSs. Volcano plots (Top) and panels (Bottom) of significant DEGs. Upregulated and downregulated genes shared with the main cohort (CdLSs compared to CTRLs) are highlighted by red and blue dots, respectively. Unadjusted p-value <0.05 is indicated by horizontal line. Table S1. Customized panel of imprinted and imprinted related genes analyzed by NCounter Nanostring approach. Table S2a. Panel of imprinted genes and imprinted related genes analyzed by NCounter Nanostring approach. Table S2b. Panel of genes of the WNT pathway analyzed by NCounter Nanostring approach. Table S3. Quantitative CpGs methylation results of IGF2/H19 (IC1), MEST, PEG10, GNAS and GNAS-AS1 DMRs in CTRL and CdLS cell lines.

Author Contributions

Conceptualization, S.M.S. conceived and designed the study; D.R. and M.L.V. performed 3C experiments; S.P., P.C., E.A.C., A.M. and L.F. carried out the Nanostring experiments; P.C., L.F. and S.T. performed the methylation analyses; C.G. provided patient samples. S.M.S., S.P., E.A.C., M.M. and L.F. implemented data analysis and interpretation of the results; S.M.S., S.P., M.M. and E.A.C. wrote the manuscript; C.G., G.P. and M.A. revised the manuscript. All authors reviewed the final draft. All authors have read and agreed to the published version of the manuscript.

Funding

This work was supported by Università degli Studi di Milano under Grant PSR2018_DIP_013_LINEA 2_2018_SIRCHIA to S.M.S.

Institutional Review Board Statement

The study was conducted according to the guidelines of the Declaration of Helsinki, and approved by the Ethics Committee of Università degli Studi di Milano (Comitato Etico number 99/20, 17 November 2020).

Informed Consent Statement

Appropriate written informed consent was obtained from parents’ patients.

Data Availability Statement

Not applicable.

Acknowledgments

The “Galliera Genetic Bank”, member of the Telethon Network of Genetic Biobanks (project no. GTB18001), funded by Telethon Italy, provided us with specimens. We also thank Lionel Van Maldergem and Lidia Larizza for kindly providing the CdLS 9 cell line. We thank Aida Freire Valls (Field Application Scientist, NanoString Technologies, Inc.) for her contribution in acquisition and interpretation of NSolver data. The authors acknowledge support from the University of Milan through the APC initiative.

Conflicts of Interest

The authors declare no conflict of interest.

References

  1. Watrin, E.; Kaiser, F.J.; Wendt, K.S. Gene regulation and chromatin organization: Relevance of cohesin mutations to human disease. Curr. Opin. Genet. Dev. 2016, 37, 59–66. [Google Scholar] [CrossRef]
  2. Horsfield, J.A.; Print, C.G.; Mönnich, M. Diverse Developmental Disorders from the One Ring: Distinct Molecular Pathways Underlie the Cohesinopathies. Front. Genet. 2012, 3, 171. [Google Scholar] [CrossRef] [Green Version]
  3. Garcia, P.; Fernandez-Hernandez, R.; Cuadrado, A.; Coca, I.; Gomez, A.; Maqueda, M.; Latorre-Pellicer, A.; Puisac, B.; Ramos, F.J.; Sandoval, J.; et al. Disruption of NIPBL/Scc2 in Cornelia de Lange Syndrome provokes cohesin genome-wide redistribution with an impact in the transcriptome. Nat. Commun. 2021, 12, 4551. [Google Scholar] [CrossRef]
  4. Borrie, M.S.; Campor, J.S.; Joshi, H.; Gartenberg, M.R. Binding, sliding, and function of cohesin during transcriptional activation. Proc. Natl. Acad. Sci. USA 2017, 114, E1062–E1071. [Google Scholar] [CrossRef] [Green Version]
  5. Ciosk, R.; Shirayama, M.; Shevchenko, A.; Tanaka, T.; Toth, A.; Shevchenko, A.; Nasmyth, K. Cohesin’s binding to chromosomes depends on a separate complex consisting of Scc2 and Scc4 proteins. Mol. Cell 2000, 5, 243–254. [Google Scholar] [CrossRef]
  6. Deardorff, M.A.; Bando, M.; Nakato, R.; Watrin, E.; Itoh, T.; Minamino, M.; Saitoh, K.; Komata, M.; Katou, Y.; Clark, D.; et al. HDAC8 mutations in Cornelia de Lange Syndrome affect the cohesin acetylation cycle. Nature 2012, 489, 313–317. [Google Scholar] [CrossRef]
  7. Krantz, I.D. Cohesin embraces new phenotypes. Nat. Genet. 2014, 46, 1157–1158. [Google Scholar] [CrossRef] [Green Version]
  8. Bose, T.; Gerton, J.L. Cohesinopathies, gene expression, and chromatin organization. J. Cell Biol. 2010, 189, 201–210. [Google Scholar] [CrossRef] [Green Version]
  9. Kline, A.D.; Moss, J.F.; Selicorni, A.; Bisgaard, A.M.; Deardorff, M.A.; Gillett, P.M.; Ishman, S.L.; Kerr, L.M.; Levin, A.V.; Mulder, P.A.; et al. Diagnosis and management of Cornelia de Lange Syndrome: First international consensus statement. Nat. Rev. Genet. 2018, 19, 649–666. [Google Scholar] [CrossRef] [Green Version]
  10. Krantz, I.D.; McCallum, J.; DeScipio, C.; Kaur, M.; Gillis, L.A.; Yaeger, D.; Jukofsky, L.; Wasserman, N.; Bottani, A.; Morris, C.A.; et al. Cornelia de Lange Syndrome is caused by mutations in NIPBL, the human homolog of Drosophila melanogaster Nipped-B. Nat. Genet. 2004, 36, 631–635. [Google Scholar] [CrossRef]
  11. Tonkin, E.T.; Wang, T.J.; Lisgo, S.; Bamshad, M.J.; Strachan, T. NIPBL, encoding a homolog of fungal Scc2-type sister chromatid cohesion proteins and fly Nipped-B, is mutated in Cornelia de Lange Syndrome. Nat. Genet. 2004, 36, 636–641. [Google Scholar] [CrossRef] [Green Version]
  12. Gillis, L.A.; McCallum, J.; Kaur, M.; DeScipio, C.; Yaeger, D.; Mariani, A.; Kline, A.D.; Li, H.H.; Devoto, M.; Jackson, L.G.; et al. NIPBL mutational analysis in 120 individuals with Cornelia de Lange Syndrome and evaluation of genotype-phenotype correlations. Am. J. Hum. Genet. 2004, 75, 610–623. [Google Scholar] [CrossRef] [Green Version]
  13. Musio, A.; Selicorni, A.; Focarelli, M.L.; Gervasini, C.; Milani, D.; Russo, S.; Vezzoni, P.; Larizza, L. X linked Cornelia de Lange Syndrome owing to SMC1L1 mutations. Nat. Genet. 2006, 38, 528–530. [Google Scholar] [CrossRef]
  14. Deardorff, M.A.; Kaur, M.; Yaeger, D.; Rampuria, A.; Korolev, S.; Pie, J.; Gil-Rodríguez, C.; Arnedo, M.; Loeys, B.; Kline, A.D.; et al. Mutations in cohesin complex members SMC3 and SMC1A cause a mild variant of cornelia de Lange Syndrome with predominant mental retardation. Am. J. Hum. Genet. 2007, 80, 485–494. [Google Scholar] [CrossRef] [Green Version]
  15. Gil-Rodríguez, M.C.; Deardorff, M.A.; Ansari, M.; Tan, C.A.; Parenti, I.; Baquero-Montoya, C.; Ousager, L.B.; Puisac, B.; Hernández-Marcos, M.; Teresa-Rodrigo, M.E. De novo heterozygous mutations in SMC3 cause a range of Cornelia de Lange Syndrome-overlapping phenotypes. Hum. Mutat. 2015, 36, 454–462. [Google Scholar] [CrossRef] [Green Version]
  16. Liu, J.; Krantz, I.D. Cornelia de Lange Syndrome, cohesin, and beyond. Clin. Genet. 2009, 76, 303–314. [Google Scholar] [CrossRef] [Green Version]
  17. Kline, A.D.; Krantz, I.D.; Bando, M.; Shirahige, K.; Chea, S.; Sakata, T.; Rao, S.; Dorsett, D.; Singh, V.P.; Gerton, J.L.; et al. Cornelia de Lange Syndrome, related disorders, and the Cohesin complex: Abstracts from the 8th biennial scientific and educational symposium 2018. Am. J. Med. Genet. A 2019, 179, 1080–1090. [Google Scholar] [CrossRef]
  18. Göndör, A.; Ohlsson, R. Chromatin insulators and cohesins. EMBO Rep. 2008, 9, 327–329. [Google Scholar] [CrossRef] [Green Version]
  19. Parelho, V.; Hadjur, S.; Spivakov, M.; Leleu, M.; Sauer, S.; Gregson, H.C.; Jarmuz, A.; Canzonetta, C.; Webster, Z.; Nesterova, T.; et al. Cohesins functionally associate with CTCF on mammalian chromosome arms. Cell 2008, 132, 422–433. [Google Scholar] [CrossRef] [Green Version]
  20. Rubio, E.D.; Reiss, D.J.; Welcsh, P.L.; Disteche, C.M.; Filippova, G.N.; Baliga, N.S.; Aebersold, R.; Ranish, J.A.; Krumm, A. CTCF physically links cohesin to chromatin. Proc. Natl. Acad. Sci. USA 2008, 105, 8309–8314. [Google Scholar] [CrossRef] [Green Version]
  21. Wendt, K.S.; Yoshida, K.; Itoh, T.; Bando, M.; Koch, B.; Schirghuber, E.; Tsutsumi, S.; Nagae, G.; Ishihara, K.; Mishiro, T.; et al. Cohesin mediates transcriptional insulation by CCCTC binding factor. Nature 2008, 451, 796–801. [Google Scholar] [CrossRef]
  22. Merkenschlager, M. Cohesin: A Global Player in Chromosome Biology with Local Ties to Gene Regulation. Curr. Opin. Genet. Dev. 2010, 20, 555–561. [Google Scholar] [CrossRef]
  23. Dorsett, D. Cohesin: Genomic Insights into Controlling Gene Transcription and Development. Curr. Opin. Genet. Dev. 2011, 21, 199–206. [Google Scholar] [CrossRef] [Green Version]
  24. Weiss, F.D.; Calderon, L.; Wang, Y.F.; Georgieva, R.; Guo, Y.; Cvetesic, N.; Kaur, M.; Dharmalingam, G.; Krantz, I.D.; Lenhard, B.; et al. Neuronal genes deregulated in Cornelia de Lange Syndrome respond to removal and re-expression of cohesin. Nat. Commun. 2021, 12, 2919. [Google Scholar] [CrossRef]
  25. Murrell, A.; Heeson, S.; Reik, W. Interaction between differentially methylated regions partitions the imprinted genes Igf2 and H19 into parent-specific chromatin loops. Nat. Genet. 2004, 36, 889–893. [Google Scholar] [CrossRef]
  26. Eggermann, K.; Bliek, J.; Brioude, F.; Algar, E.; Buiting, K.; Russo, S.; Tümer, Z.; Monk, D.; Moore, G.; Antoniadi, T.; et al. EMQN best practice guidelines for the molecular genetic testing and reporting of chromosome 11p15 imprinting disorders: Silver-Russell and Beckwith-Wiedemann syndrome. Eur. J. Hum. Genet. 2016, 24, 1377–1387. [Google Scholar] [CrossRef]
  27. Bell, A.C.; Felsenfeld, G. Methylation of a CTCF-dependent boundary controls imprinted expression of the Igf2 gene. Nature 2000, 405, 482–485. [Google Scholar] [CrossRef]
  28. Stedman, W.; Kang, H.; Lin, S.; Kissil, J.L.; Bartolomei, M.S.; Lieberman, P.M. Cohesins localize with CTCF at the KSHV latency control region and at cellular cmyc and H19/Igf2 insulators. EMBO J. 2008, 27, 654–666. [Google Scholar] [CrossRef] [Green Version]
  29. Nativio, R.; Wendt, K.S.; Ito, Y.; Huddleston, J.E.; Uribe-Lewis, S.; Woodfine, K.; Krueger, C.; Reik, W.; Peters, J.M.; Murrell, A. Cohesin is required for higher-order chromatin conformation at the imprinted IGF2-H19 locus. PLoS Genet. 2009, 5, e1000739. [Google Scholar] [CrossRef]
  30. Nativio, R.; Sparago, A.; Ito, Y.; Weksberg, R.; Riccio, A.; Murrell, A. Disruption of genomic neighbourhood at the imprinted IGF2-H19 locus in Beckwith-Wiedemann syndrome and Silver-Russell syndrome. Hum. Mol. Genet. 2011, 20, 1363–1374. [Google Scholar] [CrossRef] [Green Version]
  31. Rovina, D.; La Vecchia, M.; Cortesi, A.; Fontana, L.; Pesant, M.; Maitz, S.; Tabano, S.; Bodega, B.; Miozzo, M.; Sirchia, S.M. Profound alterations of the chromatin architecture at chromosome 11p15.5 in cells from Beckwith-Wiedemann and Silver-Russell syndromes patients. Sci. Rep. 2020, 10, 8275. [Google Scholar] [CrossRef] [PubMed]
  32. Sanchez-Delgado, M.; Riccio, A.; Eggermann, T.; Maher, E.R.; Lapunzina, P.; Mackay, D.; Monk, D. Causes and Consequences of Multi-Locus Imprinting Disturbances in Humans. Trends Genet. 2016, 32, 444–455. [Google Scholar] [CrossRef] [Green Version]
  33. Noordermeer, D.; Feil, R. Differential 3D chromatin organization and gene activity in genomic imprinting. Curr. Opin. Genet. Dev. 2020, 61, 17–24. [Google Scholar] [CrossRef] [PubMed]
  34. Selicorni, A.; Mariani, M.; Lettieri, A.; Massa, V. Cornelia de Lange Syndrome: From a Disease to a Broader Spectrum. Genes (Basel) 2021, 12, 1075. [Google Scholar] [CrossRef] [PubMed]
  35. Avagliano, L.; Grazioli, P.; Mariani, M.; Bulfamante, G.P.; Selicorni, A.; Massa, V. Integrating molecular and structural findings: Wnt as a possible actor in shaping cognitive impairment in Cornelia de Lange Syndrome. Orphanet J. Rare Dis. 2017, 12, 174. [Google Scholar] [CrossRef] [Green Version]
  36. Bottai, D.; Spreafico, M.; Pistocchi, A.; Fazio, G.; Adami, R.; Grazioli, P.; Canu, A.; Bragato, C.; Rigamonti, S.; Parodi, C.; et al. Modeling Cornelia de Lange Syndrome in vitro and in vivo reveals a role for cohesin complex in neuronal survival and differentiation. Hum. Mol. Genet. 2019, 28, 64–73. [Google Scholar] [CrossRef]
  37. Grazioli, P.; Parodi, C.; Mariani, M.; Bottai, D.; Di Fede, E.; Zulueta, A.; Avagliano, L.; Cereda, A.; Tenconi, R.; Wierzba, J.; et al. Lithium as a possible therapeutic strategy for Cornelia de Lange Syndrome. Cell Death Discov. 2021, 7, 34. [Google Scholar] [CrossRef]
  38. Gervasini, C.; Russo, S.; Cereda, A.; Parenti, I.; Masciadri, M.; Azzollini, J.; Melis, D.; Aravena, T.; Doray, B.; Ferrarini, A.; et al. Cornelia de Lange individuals with new and recurrent SMC1A mutations enhance delineation of mutation repertoire and phenotypic spectrum. Am. J. Med. Genet. 2013, 161A, 2909–2919. [Google Scholar] [CrossRef]
  39. Limongelli, G.; Russo, S.; Digilio, M.C.; Masciadri, M.; Pacileo, G.; Fratta, F.; Martone, F.; Maddaloni, V.; D’Alessandro, R.; Calabro, P.; et al. Hypertrophic cardiomyopathy in a girl with Cornelia de Lange Syndrome due to mutation in SMC1A. Am. J. Med. Genet. 2010, 152A, 2127–2129. [Google Scholar] [CrossRef]
  40. Selicorni, A.; Russo, S.; Gervasini, C.; Castronovo, P.; Milani, D.; Cavalleri, F.; Bentivegna, A.; Masciadri, M.; Domi, A.; Divizia, M.T.; et al. Clinical score of 62 Italian patients with Cornelia de Lange Syndrome and correlations with the presence and type of NIPBL mutation. Clin. Genet. 2007, 72, 98–108. [Google Scholar] [CrossRef] [PubMed]
  41. Russo, S.; Masciadri, M.; Gervasini, C.; Azzollini, J.; Cereda, A.; Zampino, G.; Haas, O.; Scarano, G.; Di Rocco, M.; Finelli, P.; et al. Intragenic and large NIPBL rearrangements revealed by MLPA in Cornelia de Lange patients. Eur. J. Hum. Genet. 2012, 20, 734–741. [Google Scholar] [CrossRef] [PubMed] [Green Version]
  42. Holwerda, S.; de Laat, W. Chromatin loops, gene positioning, and gene expression. Front. Genet. 2012, 3, 217. [Google Scholar] [CrossRef] [Green Version]
  43. Ong, C.T.; Corces, V.G. CTCF: An architectural protein bridging genome topology and function. Nat. Rev. Genet. 2014, 15, 234–246. [Google Scholar] [CrossRef] [PubMed] [Green Version]
  44. Dekker, J.; Heard, E. Structural and functional diversity of Topologically Associating Domains. FEBS Lett. 2015, 589, 2877–2884. [Google Scholar] [CrossRef] [Green Version]
  45. Maeda, T.; Higashimoto, K.; Jozaki, K.; Yatsuki, H.; Nakabayashi, K.; Makita, Y.; Tonoki, H.; Okamoto, N.; Takada, F.; Ohashi, H.; et al. Comprehensive and quantitative multilocus methylation analysis reveals the susceptibility of specific imprinted differentially methylated regions to aberrant methylation in Beckwith-Wiedemann syndrome with epimutations. Genet. Med. 2014, 16, 903–912. [Google Scholar] [CrossRef] [PubMed] [Green Version]
  46. Potabattula, R.; Dittrich, M.; Schorsch, M.; Hahn, T.; Haaf, T.; El Hajj, N. Male obesity effects on sperm and next-generation cord blood DNA methylation. PLoS ONE 2019, 14, e0218615. [Google Scholar] [CrossRef]
  47. Veldman-Jones, M.H.; Brant, R.; Rooney, C.; Geh, C.; Emery, H.; Harbron, C.G.; Wappett, M.; Sharpe, A.; Dymond, M.; Barrett, J.C.; et al. Evaluating Robustness and Sensitivity of the NanoString Technologies nCounter Platform to Enable Multiplexed Gene Expression Analysis of Clinical Samples. Cancer Res. 2015, 75, 2587–2593. [Google Scholar] [CrossRef] [Green Version]
  48. Gentien, D.; Piqueret-Stephan, L.; Henry, E.; Albaud, B.; Rapinat, A.; Koscielny, S.; Scoazec, J.Y.; Vielh, P. Digital Multiplexed Gene Expression Analysis of mRNA and miRNA from Routinely Processed and Stained Cytological Smears: A Proof-of-Principle Study. Acta Cytol. 2021, 65, 88–98. [Google Scholar] [CrossRef]
  49. Prokopec, S.D.; Watson, J.D.; Waggott, D.M.; Smith, A.B.; Wu, A.H.; Okey, A.B.; Pohjanvirta, R.; Boutros, P.C. Systematic evaluation of medium-throughput mRNA abundance platforms. RNA 2013, 19, 51–62. [Google Scholar] [CrossRef] [Green Version]
  50. Pistocchi, A.; Fazio, G.; Cereda, A.; Ferrari, L.; Bettini, L.R.; Messina, G.; Cotelli, F.; Biondi, A.; Selicorni, A.; Massa, V. Cornelia de Lange Syndrome: NIPBL haploinsufficiency downregulates canonical Wnt pathway in zebrafish embryos and patients fibroblasts. Cell Death Dis. 2013, 4, e866. [Google Scholar] [CrossRef] [Green Version]
  51. Goedhart, J.; Luijsterburg, M.S. VolcaNoseR is a web app for creating, exploring, labeling and sharing volcano plots. Sci. Rep. 2020, 10, 20560. [Google Scholar] [CrossRef] [PubMed]
  52. Boudaoud, I.; Fournier, É.; Baguette, A.; Vallée, M.; Lamaze, F.C.; Droit, A.; Bilodeau, S. Connected Gene Communities Underlie Transcriptional Changes in Cornelia de Lange Syndrome. Genetics 2017, 207, 139–151. [Google Scholar] [CrossRef]
  53. Avagliano, L.; Parenti, I.; Grazioli, P.; Di Fede, E.; Parodi, C.; Mariani, M.; Kaiser, F.J.; Selicorni, A.; Gervasini, C.; Massa, V. Chromatinopathies: A focus on Cornelia de Lange Syndrome. Clin. Genet. 2020, 97, 3–11. [Google Scholar] [CrossRef] [PubMed] [Green Version]
  54. Lim, D.H.; Maher, E.R. Human imprinting syndromes. Epigenomics 2009, 1, 347–369. [Google Scholar] [CrossRef] [PubMed]
  55. Fontana, L.; Tabano, S.; Maitz, S.; Colapietro, P.; Garzia, E.; Gerli, A.G.; Sirchia, S.M.; Miozzo, M. Clinical and Molecular Diagnosis of Beckwith-Wiedemann Syndrome with Single- or Multi-Locus Imprinting Disturbance. Int. J. Mol. Sci. 2021, 22, 3445. [Google Scholar] [CrossRef]
  56. Turan, S.; Bastepe, M. GNAS Spectrum of Disorders. Curr. Osteoporos. Rep. 2015, 13, 146–158. [Google Scholar] [CrossRef] [PubMed] [Green Version]
  57. Koukoura, O.; Sifakis, S.; Spandidos, D.A. DNA methylation in the human placenta and fetal growth (review). Mol. Med. Rep. 2012, 5, 883–889. [Google Scholar] [CrossRef] [PubMed] [Green Version]
  58. Fontana, L.; Bedeschi, M.F.; Maitz, S.; Cereda, A.; Faré, C.; Motta, S.; Seresini, A.; D’Ursi, P.; Orro, A.; Pecile, V.; et al. Characterization of multi-locus imprinting disturbances and underlying genetic defects in patients with chromosome 11p15.5 related imprinting disorders. Epigenetics 2018, 13, 897–909. [Google Scholar] [CrossRef]
  59. Mehta, G.D.; Kumar, R.; Srivastava, S.; Ghosh, S.K. Cohesin: Functions beyond sister chromatid cohesion. FEBS Lett. 2013, 587, 2299–2312. [Google Scholar] [CrossRef] [Green Version]
  60. Zuin, J.; Franke, V.; van Ijcken, W.F.; van der Sloot, A.; Krantz, I.D.; van der Reijden, M.I.; Nakato, R.; Lenhard, B.; Wendt, K.S. A cohesin-independent role for NIPBL at promoters provides insights in CdLS. PLoS Genet. 2014, 10, e1004153. [Google Scholar] [CrossRef] [PubMed] [Green Version]
  61. Mills, J.A.; Herrera, P.S.; Kaur, M.; Leo, L.; McEldrew, D.; Tintos-Hernandez, J.A.; Rajagopalan, R.; Gagne, A.; Zhang, Z.; Ortiz-Gonzalez, X.R.; et al. NIPBL+/− haploinsufficiency reveals a constellation of transcriptome disruptions in the pluripotent and cardiac states. Sci. Rep. 2018, 8, 1056. [Google Scholar] [CrossRef] [Green Version]
  62. Kahn, M. Can we safely target the WNT pathway? Nat. Rev. Drug Discov. 2014, 13, 513–532. [Google Scholar] [CrossRef] [Green Version]
  63. Miyabayashi, T.; Teo, J.L.; Yamamoto, M.; McMillan, M.; Nguyen, C.; Kahn, M. Wnt/beta-catenin/CBP signaling maintains long-term murine embryonic stem cell pluripotency. Proc. Natl. Acad. Sci. USA 2007, 104, 5668–5673. [Google Scholar] [CrossRef] [Green Version]
  64. Ooki, A.; Onodera, S.; Saito, A.; Oguchi, A.; Murakawa, Y.; Sakamoto, T.; Sueishi, K.; Nishii, Y.; Azuma, T. CAGE-seq analysis of osteoblast derived from cleidocranial dysplasia human induced pluripotent stem cells. Bone 2020, 141, 115582. [Google Scholar] [CrossRef]
  65. Motaei, J.; Salmaninejad, A.; Jamali, E.; Khorsand, I.; Ahmadvand, M.; Shabani, S.; Karimi, F.; Nazari, M.S.; Ketabchi, G.; Naqipour, F. Molecular Genetics of Cleidocranial Dysplasia. Fetal Pediatr. Pathol. 2021, 40, 442–454. [Google Scholar] [CrossRef]
Figure 1. 3C and interactome analyses in control cell lines. (a) Scheme of the IC1 locus under analysis (UCSC Genome Browser map position 1,960,000 to 2,235,000). Areas covered by 3C analysis are highlighted in grey. The locations of genes are indicated in the upper part. Vertical black lines, corresponding to BglII restriction sites, indicate the primers used for 3C analysis. Anchor primers are highlighted in turquoise. Red and green lines indicate clusters of CTCF-binding sites in reverse or forward orientation, respectively. Green bars (EnhA and EnhB) correspond to enhancer regions. CTCF-binding sites: CTCF Up, CCD, IC1, and CTCF Dw. (b) Schematic representation of the IC1 domain interactome in control cell lines. The data for each cell line were derived from two independent 3C experiments. Interactions between different elements of the IC1 region are shown by red triangles; increasing color intensity corresponds to an increase in the number of interactions of the subregion. Mean association frequencies of CTRL1 and CTRL2 are indicated with black circles. Black triangles indicate the anchors used for 3C analysis. A linear representation of the domain is shown below. In accordance with the transcription of genes in the region, panel b was drawn in reverse orientation with respect to the map in panel a. Adapted from [31] following the Creative Commons Attribution 4.0 International License.
Biomolecules 11 01622 g001
Figure 2. Abnormalities in chromatin architecture at the IC1 locus of the CdLS1 cell line (SMC1A mutation). The figure is to scale. (a) Scheme of the statistically significant modifications in the chromatin interactome of the IC1 domain in the CdLS1 cell line compared with the mean of the controls. Interactions between different elements of the IC1 region are shown by red triangles; increasing color intensity corresponds to an increase in the number of interactions of the sub-region. Colored circles represent association frequencies as described in the figure. Black triangles indicate the anchors used for 3C analysis. A linear representation of the IC1 imprinted domain is depicted below the interactome. (b) IC1 locus looping profiles for the indicated anchors in controls (dotted black) and CdLS1 (pink) cell lines. BglII restriction sites are indicated above. Each point in the profile is the mean ± standard deviation of two independent 3C experiments and indicates the association frequency between the anchor and the fragment on the left of the corresponding BglII restriction site. Differences (two-way ANOVA test) are indicated by asterisks. Red dots indicate the points with standard deviation > 0.1.
Biomolecules 11 01622 g002
Figure 3. Abnormalities in chromatin architecture at the IC1 locus of the CdLS2 cell line (SMC1A mutation). The figure is to scale. (a) Scheme of the statistically significant modifications in the chromatin interactome of the IC1 domain in the CdLS2 cell line compared with the mean of the controls. Interactions between different elements of the IC1 region are shown by red triangles; increasing color intensity corresponds to an increase in the number of interactions of the subregion. An interaction lost selectively in the CdLS2 cell line is shown in light grey. Colored circles represent association frequencies as described in the figure. Black triangles indicate the anchors used for 3C analysis. A linear representation of the IC1 imprinted domain is depicted below the interactome. (b) IC1 locus looping profiles for the indicated anchors in controls (dotted black) and CdLS2 (light blue) cell lines. BglII restriction sites are indicated above. Each point in the profile is the mean ± standard deviation of two independent 3C experiments and indicates the association frequency between the anchor and the fragment on the left of the corresponding BglII restriction site. Differences (two-way ANOVA test) are indicated by asterisks. Red dots indicate the points with standard deviation > 0.1.
Biomolecules 11 01622 g003
Figure 4. Abnormalities in chromatin architecture at the IC1 locus of the CdLS6 cell line (NIPBL mutation). The figure is to scale. (a) Scheme of the statistically significant modifications in the chromatin interactome of the IC1 domain in the CdLS6 cell line compared with the mean of the controls. Interactions between different elements of the IC1 region are shown by red triangles; increasing color intensity corresponds to an increase in the number of interactions of the subregion. Colored circles represent association frequencies as described in the figure. Black triangles indicate the anchors used for 3C analysis. A linear representation of the IC1 imprinted domain is depicted below the interactome. (b) IC1 locus looping profiles for the indicated anchors in controls (dotted black) and CdLS6 (green) cell lines. BglII restriction sites are indicated above. Each point in the profile is the mean ± standard deviation of two independent 3C experiments and indicates the association frequency between the anchor and the fragment on the left of the corresponding BglII restriction site. Differences (two-way ANOVA test) are indicated by asterisks.
Biomolecules 11 01622 g004
Figure 6. Trend plot of pathway scores vs. sample types (CTRLs and CdLSs). Pathway enrichment analysis was performed by nSolver software (figure rendered by Pathview, nSolver Advanced Analysis Software 4.0).
Biomolecules 11 01622 g006
Figure 7. Schematic representation of DEGs in the CdLS cell lines belonging to the three main WNT pathways (figure rendered by Pathview, nSolver Advanced Analysis Software 4.0). Pathway nodes shown in white have no genes in the Vantage 3DTM RNA WNT Pathways Panel. Pathway nodes in grey have corresponding genes in the panel, however no significant differential expression is observed. Nodes in blue and orange denote downregulation or upregulation in CdLSs compared to CTRLs. Node Frizzled, DEGs: FZD3, FZD5, FZD8 and FZD10; node Wnt, DEG: WNT10B; node FRP, DEG: SFRP1; node GBP, DEG: FRAT1; node TCF/LEF, DEGs: TCF4, LEF1 and TCF7L1; node Gro/TLE, DEG: TLE1; node Uterine, DEG: MMP7; node JNK, DEG: MAPK10; node PLC, DEG: PLCB1; node CaN, DEGs: PPP3CA and PPP3CC.
Biomolecules 11 01622 g007
Figure 8. Quantitative CpGs methylation analysis of IGF2/H19 (IC1), MEST, PEG10, GNAS and GNAS-AS1 DMRs from CTRL (black circles) and CdLS cell lines (red triangles: SMC1A mutation; light blue triangles: NIPBL mutation). Results are the mean of two independent pyrosequencing experiments.
Biomolecules 11 01622 g008
Table 1. Schematic overview of the experimental design.
Cell LineCausative Genetic AlterationDmr Methylation Analysis3C AssayNcounter Analysis
IC1MEST-DMRPEG10-DMR
CTRL1 +++++
CTRL2 +++++
CTRL3 ++++
CTRL4 ++++
CdLS1SMC1A
c.2351T > C
+++++
CdLS2SMC1A
c.173del16
+++++
CdLS3SMC1A
c.2351T > C
++++
CdLS4SMC1A
c.3497A > C
++++
CdLS5SMC1A
c.2078G > A
++++
CdLS6NIPBL
c.-75_ + 65del
+++++
CdLS7NIPBL
c.4253G > A
++++
CdLS8NIPBL
c.231-1_231-2del
++++
CdLS9NIPBL
t(5;15)
+++++
Both controls and patient-derived LCLs were cultured in RPMI 1640 medium supplemented with 10% fetal bovine serum (EuroClone, Milano, Italy) and antibiotics (antibiotic-antimycotic 100×, EuroClone, Milano, Italy) at 37 °C in 5% CO2.
Table 2. nCounter Nanostring expression profile of the imprinted genes expressed in LCLs.
GeneAccessionLog2 Fold
Change
p-ValueBH p-Value
GNAS *NM_080425.10.4940.001660.0887
MEST *NM_177525.1−3.650.01090.13
EG10 *NM_001040152.1−1.560.01270.131
GNAS-AS1NR_002785.2:1026−0.7090.05780.256
KCNQ1OT1NR_002728.2:31875−0.5350.06430.277
FAM50BNM_012135.1:12720.1970.2890.594
PLAGL1NM_006718.3:18720.2220.4140.698
* The asterisks mark the three differentially expressed imprinted genes. Unadjusted p-values are reported in ‘p-value’ column and values ≤ 0.05 were considered significant. The Benjamini–Hochberg (BH) method was applied to reduce the false discovery rate (FDR), and the adjusted values are reported in the ‘BH p-value’ column.
Table 3. Expression profile of the genes of the WNT pathway evaluated by nCounter Nanostring technology.
GeneAccessionLog2 Fold Changep-ValueBH p-ValuePathway Annotation
RUNX2NM_004348.34.250.001510.0887Development & Differentiation, Transcription Factors
CDKN2ANM_000077.30.9710.001870.0887Cell Cycle, Development & Differentiation, Transcription Factors
MAPK10NM_002753.2−4.760.0020.0887KEGG WNT Annotation
EGFRNM_201282.1−6.040.00280.0919Adhesion, Calcium Binding and Signaling, Cell Cycle, Development & Differentiation, Migration
SFRP1NM_003012.34.410.004110.0919Canonical Wnt Pathway, KEGG WNT Annotation, WNT Signaling Negative Regulation
TCF4NM_003199.10.6610.004810.0919Transcription Factors
BMP4NM_001202.33.430.005240.0919Development & Differentiation
PLCB1NM_182734.1−3.820.005240.0919KEGG WNT Annotation
MMP7NM_002423.3−3.530.005560.0919Calcium Binding and Signaling, KEGG WNT Annotation, Proteolysis, WNT Signaling Target Genes
TGFB3NM_003239.20.9780.005710.0919Development & Differentiation
PTGS2NM_000963.1−3.260.008340.123Calcium Binding and Signaling, Cell Cycle
TLE1NM_005077.31.80.01060.13WNT Signaling Negative Regulation
FZD5NM_003468.2−3.030.0110.13Canonical Wnt Pathway, KEGG WNT Annotation
CXCL12NM_000609.5−3.110.01320.131EMTMetastasis
GDNFNM_000514.2−2.850.01330.131Development & Differentiation, Migration
IRS1NM_005544.21.30.0160.149Migration
FRAT1NM_005479.31.250.01850.164Canonical Wnt Pathway, KEGG WNT Annotation
FZD3NM_017412.20.6990.02110.173Canonical Wnt Pathway, KEGG WNT Annotation
PPP3CCNM_005605.40.5520.02160.173KEGG WNT Annotation
SNAI2NM_003068.3−2.730.02490.191EMTMetastasis
KREMEN1NM_001039570.1−2.520.02680.191WNT Signaling Negative Regulation
FZD10NM_007197.2−2.430.0270.191KEGG WNT Annotation
LEF1NM_016269.31.830.03340.22Canonical Wnt Pathway, KEGG WNT Annotation, Transcription Factors
NLKNM_016231.20.5190.03420.22KEGG WNT Annotation, WNT Signaling Negative Regulation
SOX2NM_003106.2−1.740.03480.22Cell Cycle, Development & Differentiation, Transcription Factors
PPP3CANM_000944.41.060.04010.237KEGG WNT Annotation
CXCR4NM_003467.2−1.630.04180.237EMTMetastasis
BIRC5NM_001168.2−0.4910.04270.237Cell Cycle
WNT10BNM_003394.2−1.260.04420.237KEGG WNT Annotation
SERPINE1NM_001165413.1−2.360.04420.237EMTMetastasis
TCF7L1NM_031283.10.9310.04770.24Canonical Wnt Pathway, KEGG WNT Annotation, Transcription Factors
FZD8NM_031866.1−2.350.04790.24Canonical Wnt Pathway, KEGG WNT Annotation
SMAD2NM_005901.50.1650.04880.24EMTMetastasis, KEGG WNT Annotation
Publisher’s Note: MDPI stays neutral with regard to jurisdictional claims in published maps and institutional affiliations.

