G-Quadruplexes in the Archaea Domain

 ,
,  ,
,  , ,
, ,  , ,
, ,  ,
,
Abstract
1. Introduction
2. Materials and Methods
2.1. Selection of the DNA Sequences
2.2. Process of Analysis
2.3. Analysis of Putative G4 Sequences Around Annotated NCBI Features
2.4. Statistical Analysis
2.5. Quadruplex Formation In Vitro
2.5.1. Samples
2.5.2. Experimental Conditions
2.5.3. Isothermal Spectra
2.5.4. Circular Dichroism
2.6. G-Quadruplex Binding Proteins Prediction
3. Results
3.1. Prediction of G4 Forming Sequences in Archaea
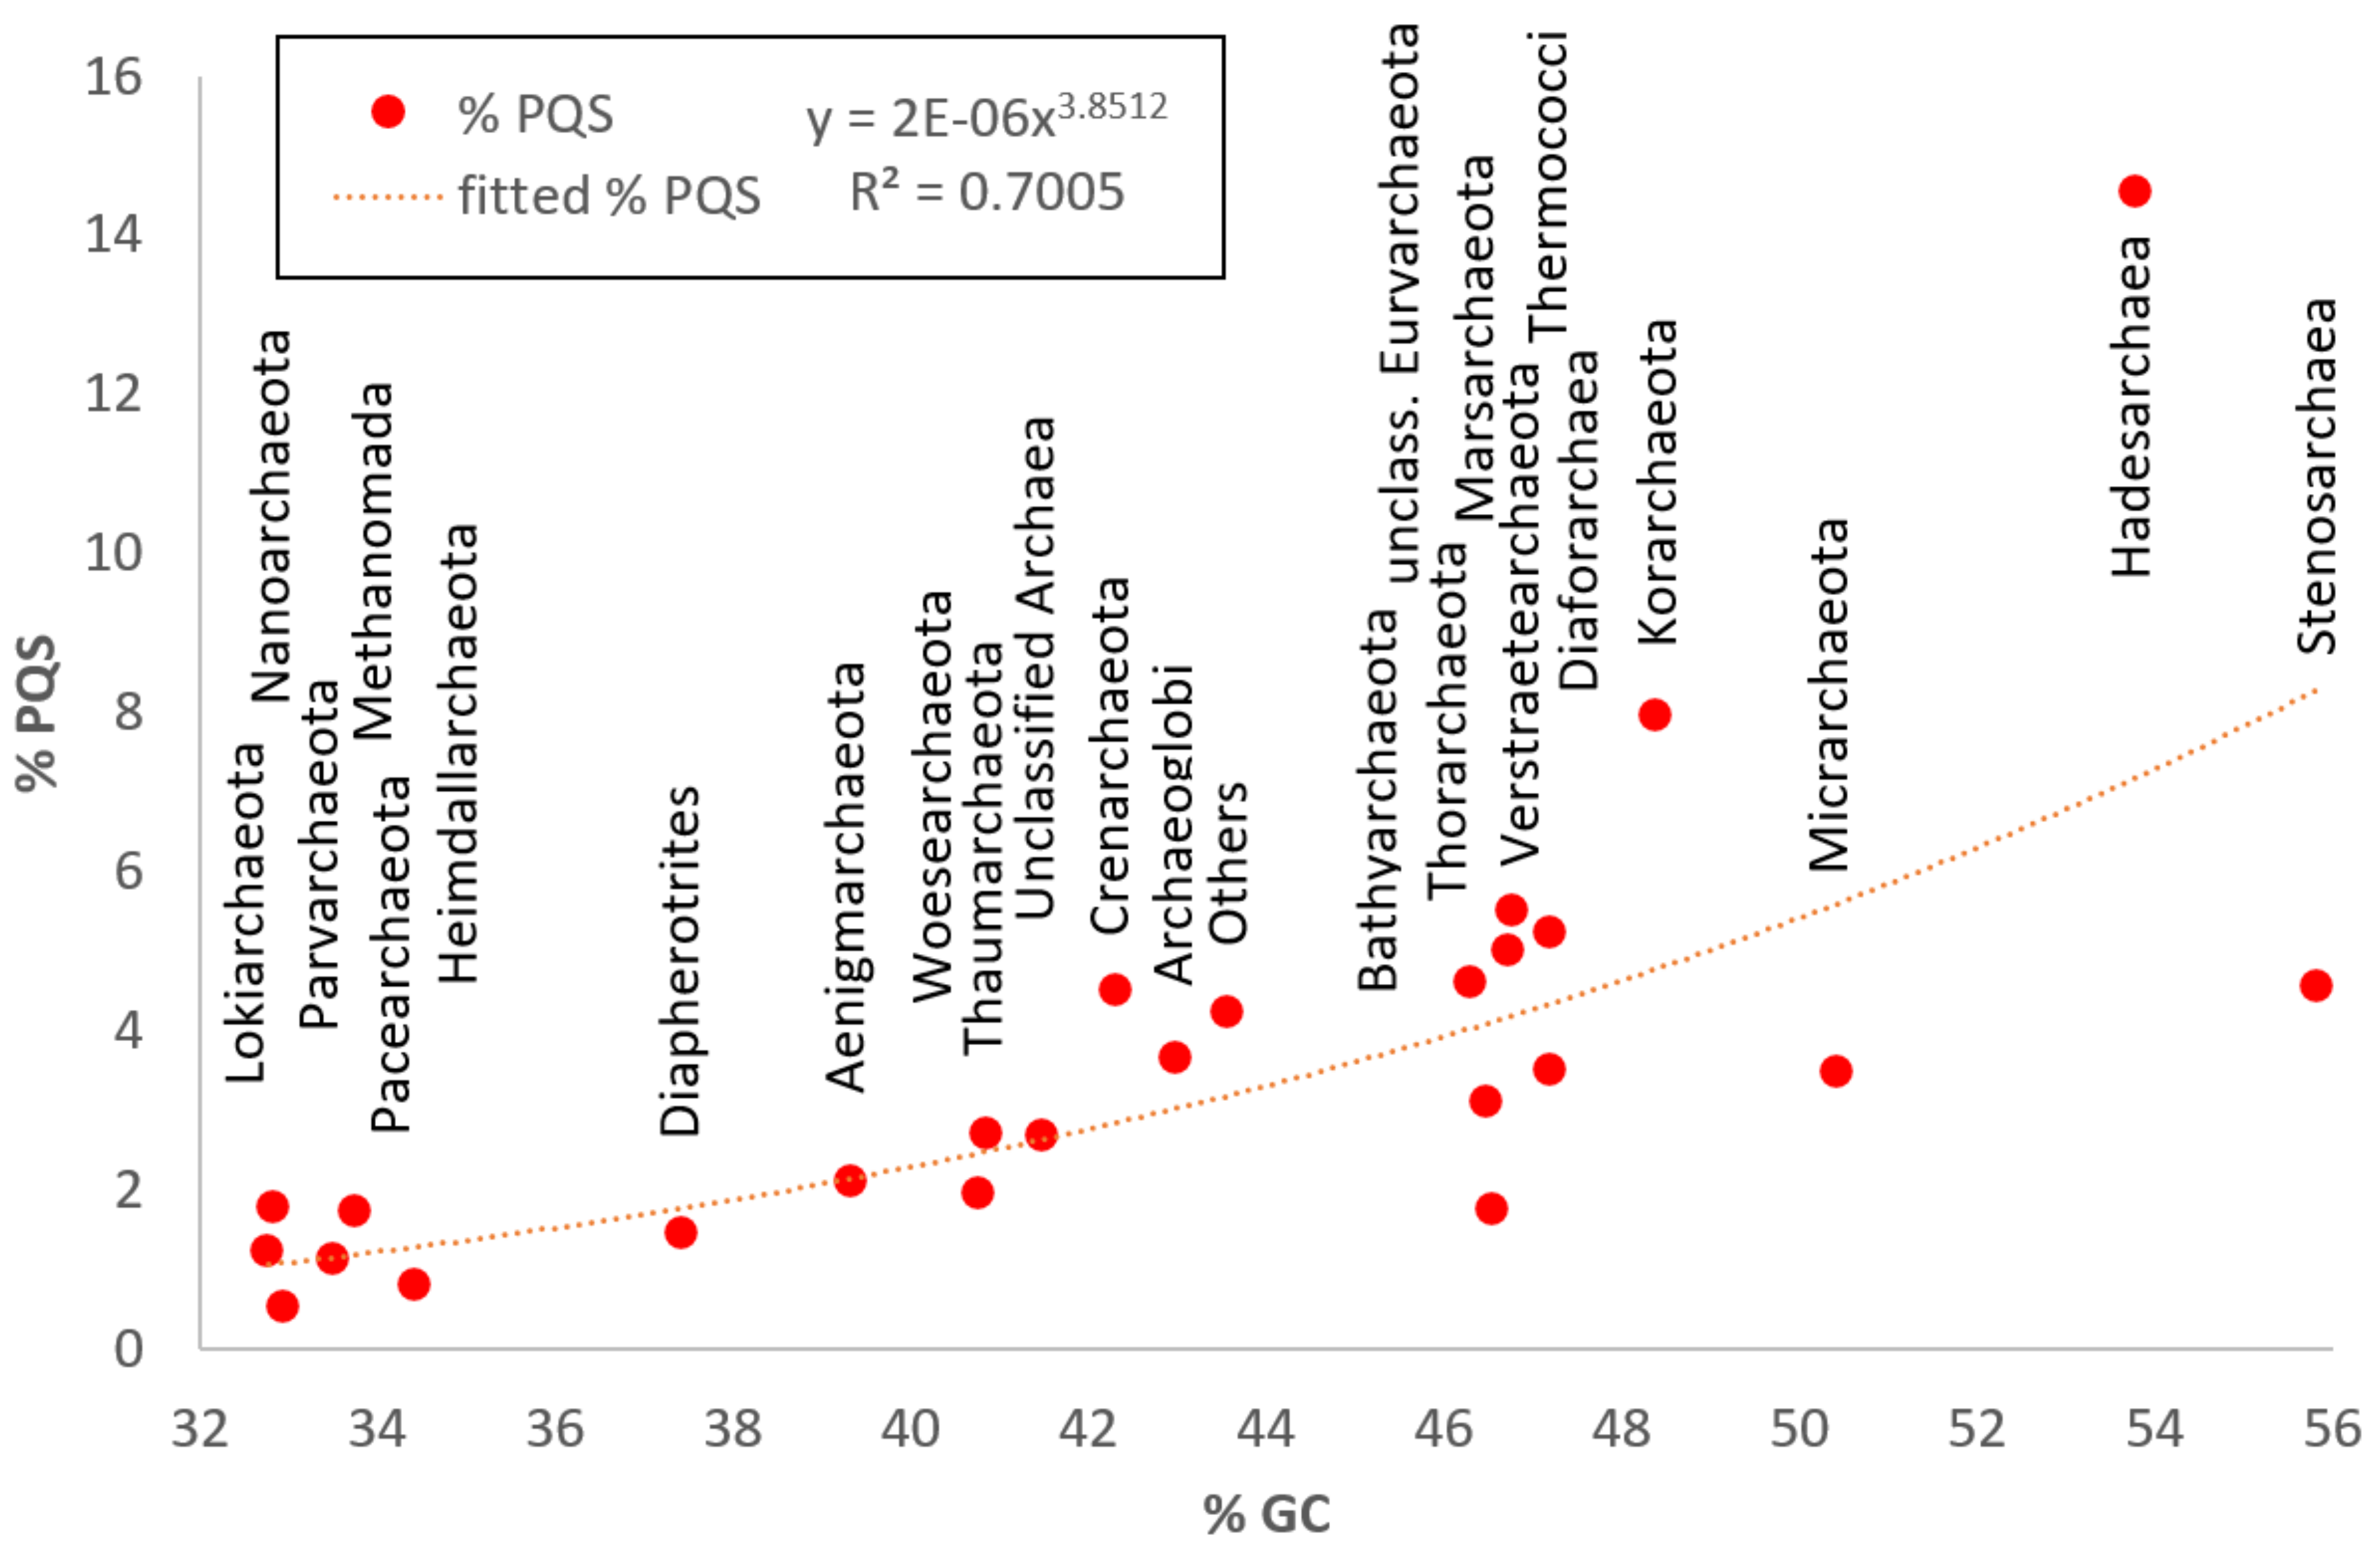
3.2. Variation in Frequency for G4 Forming Sequences in Archaea
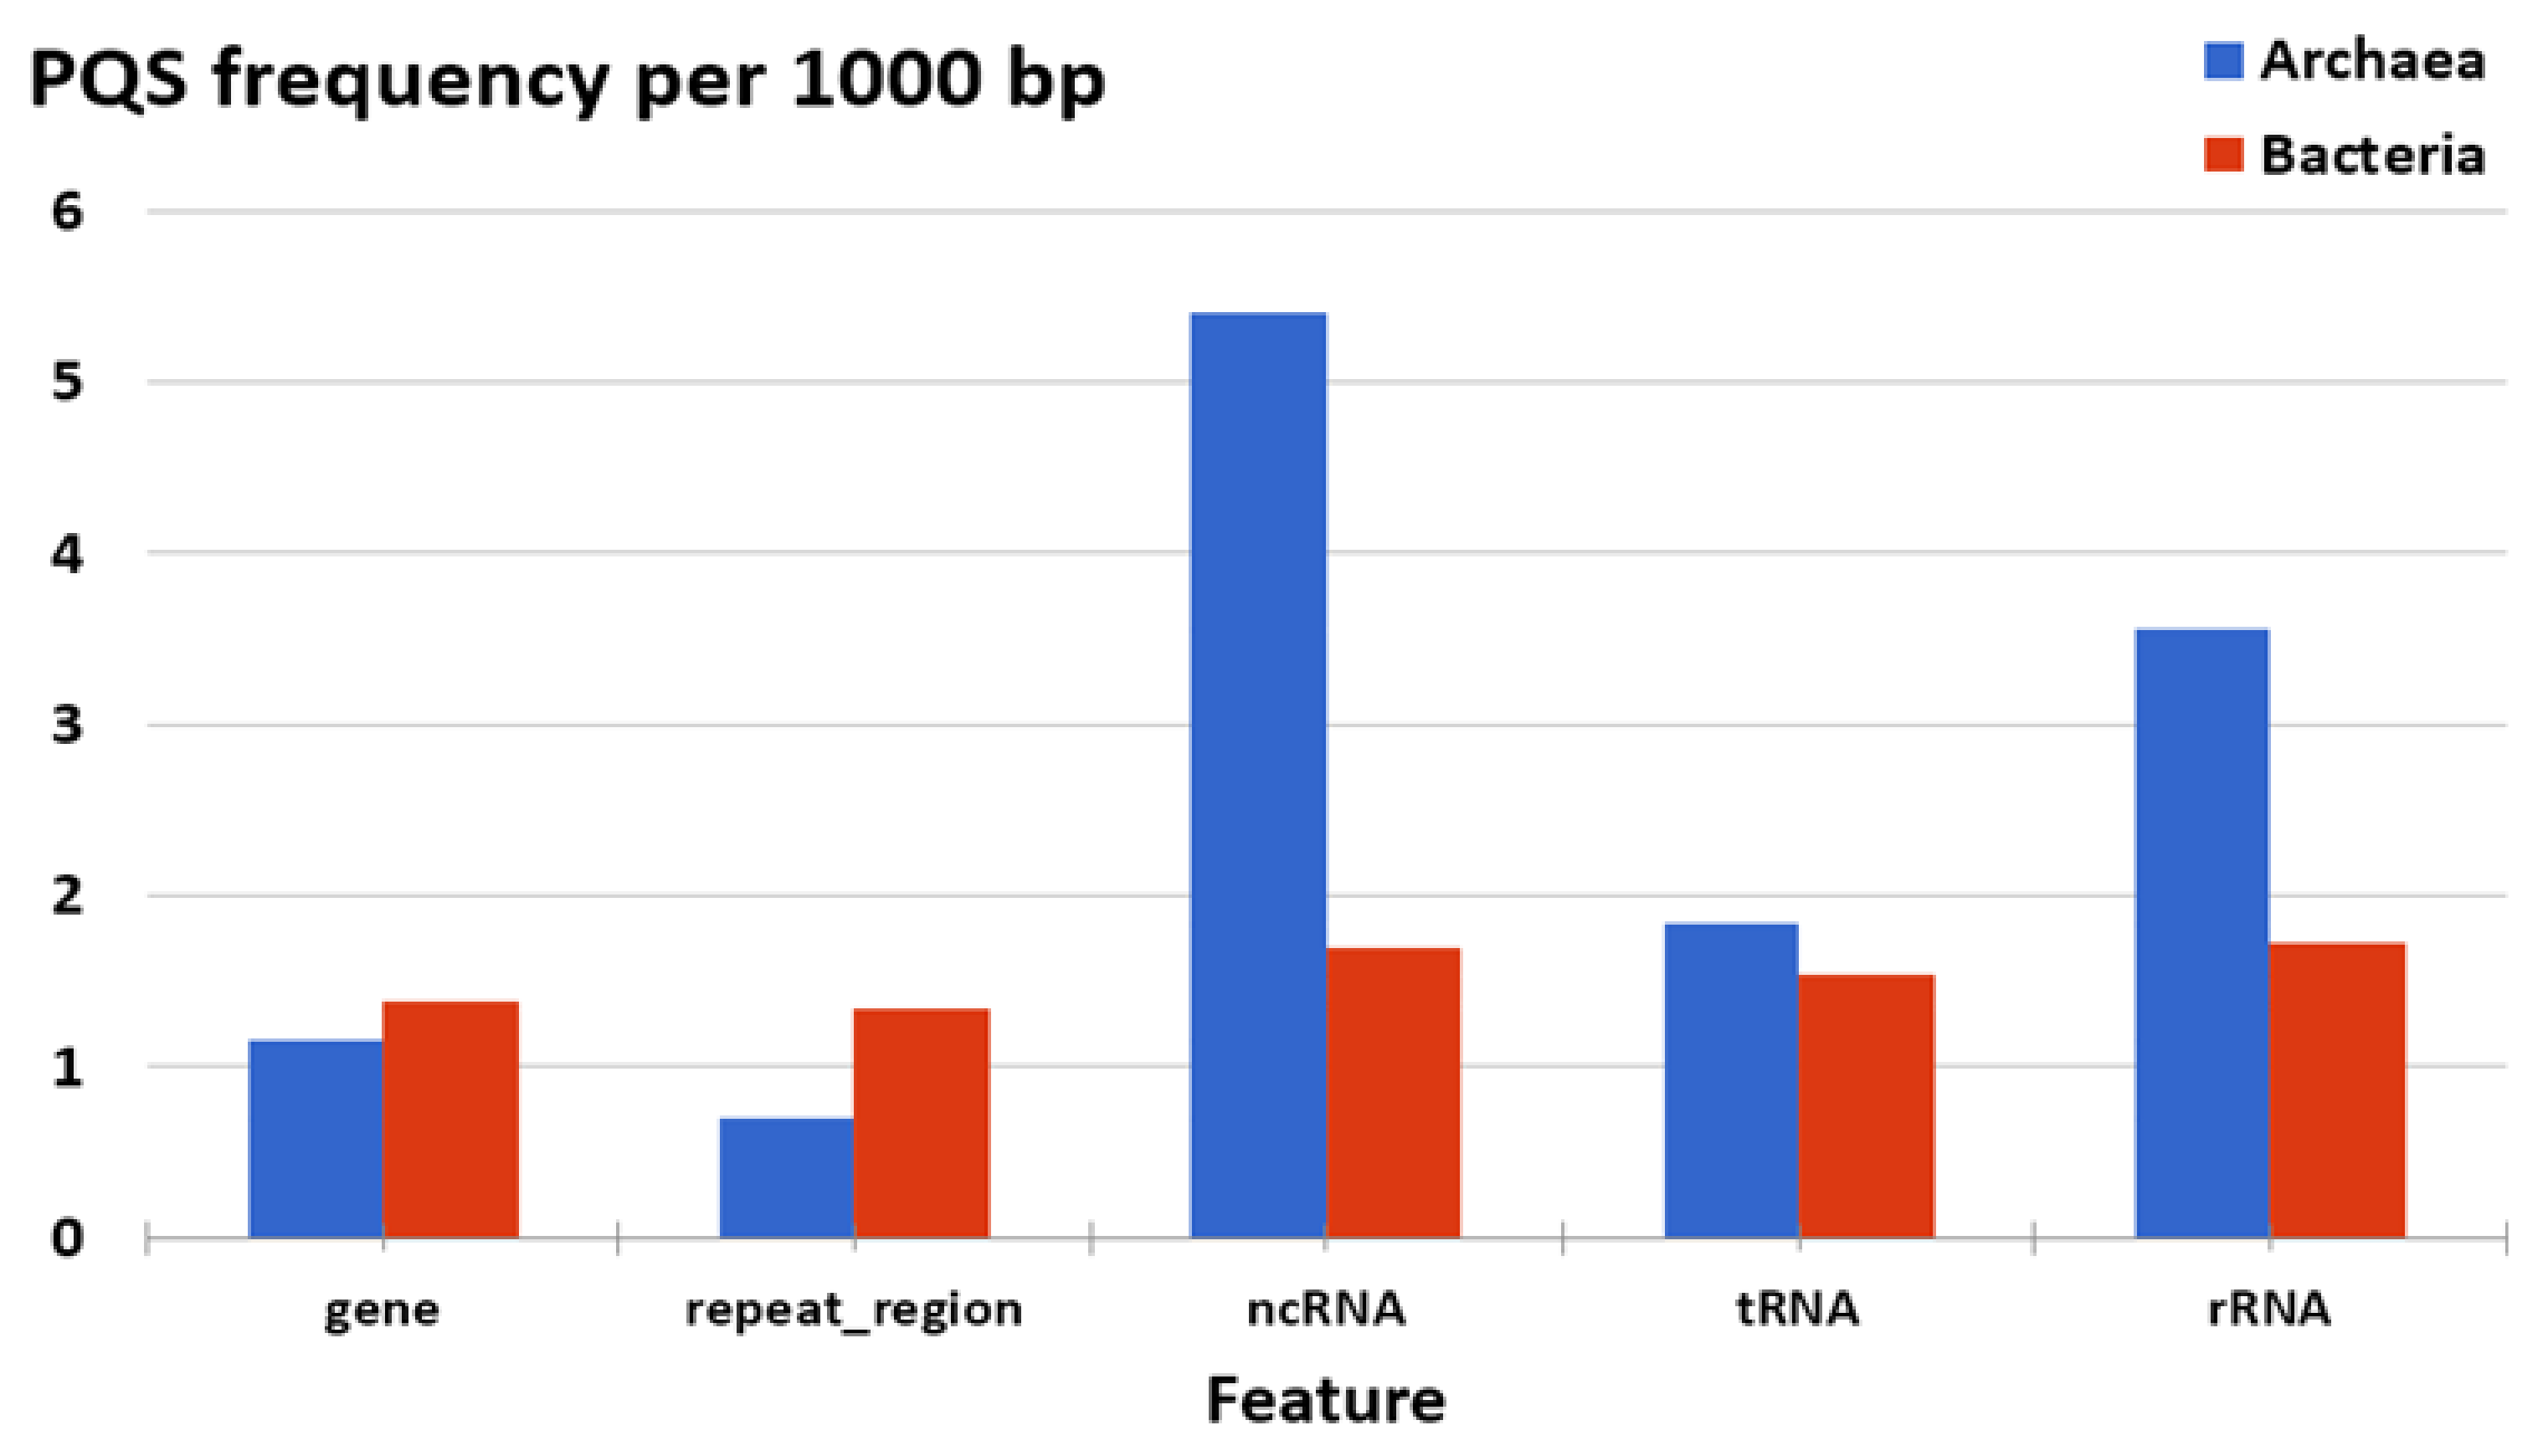
3.3. Localization of PQS in Genomes
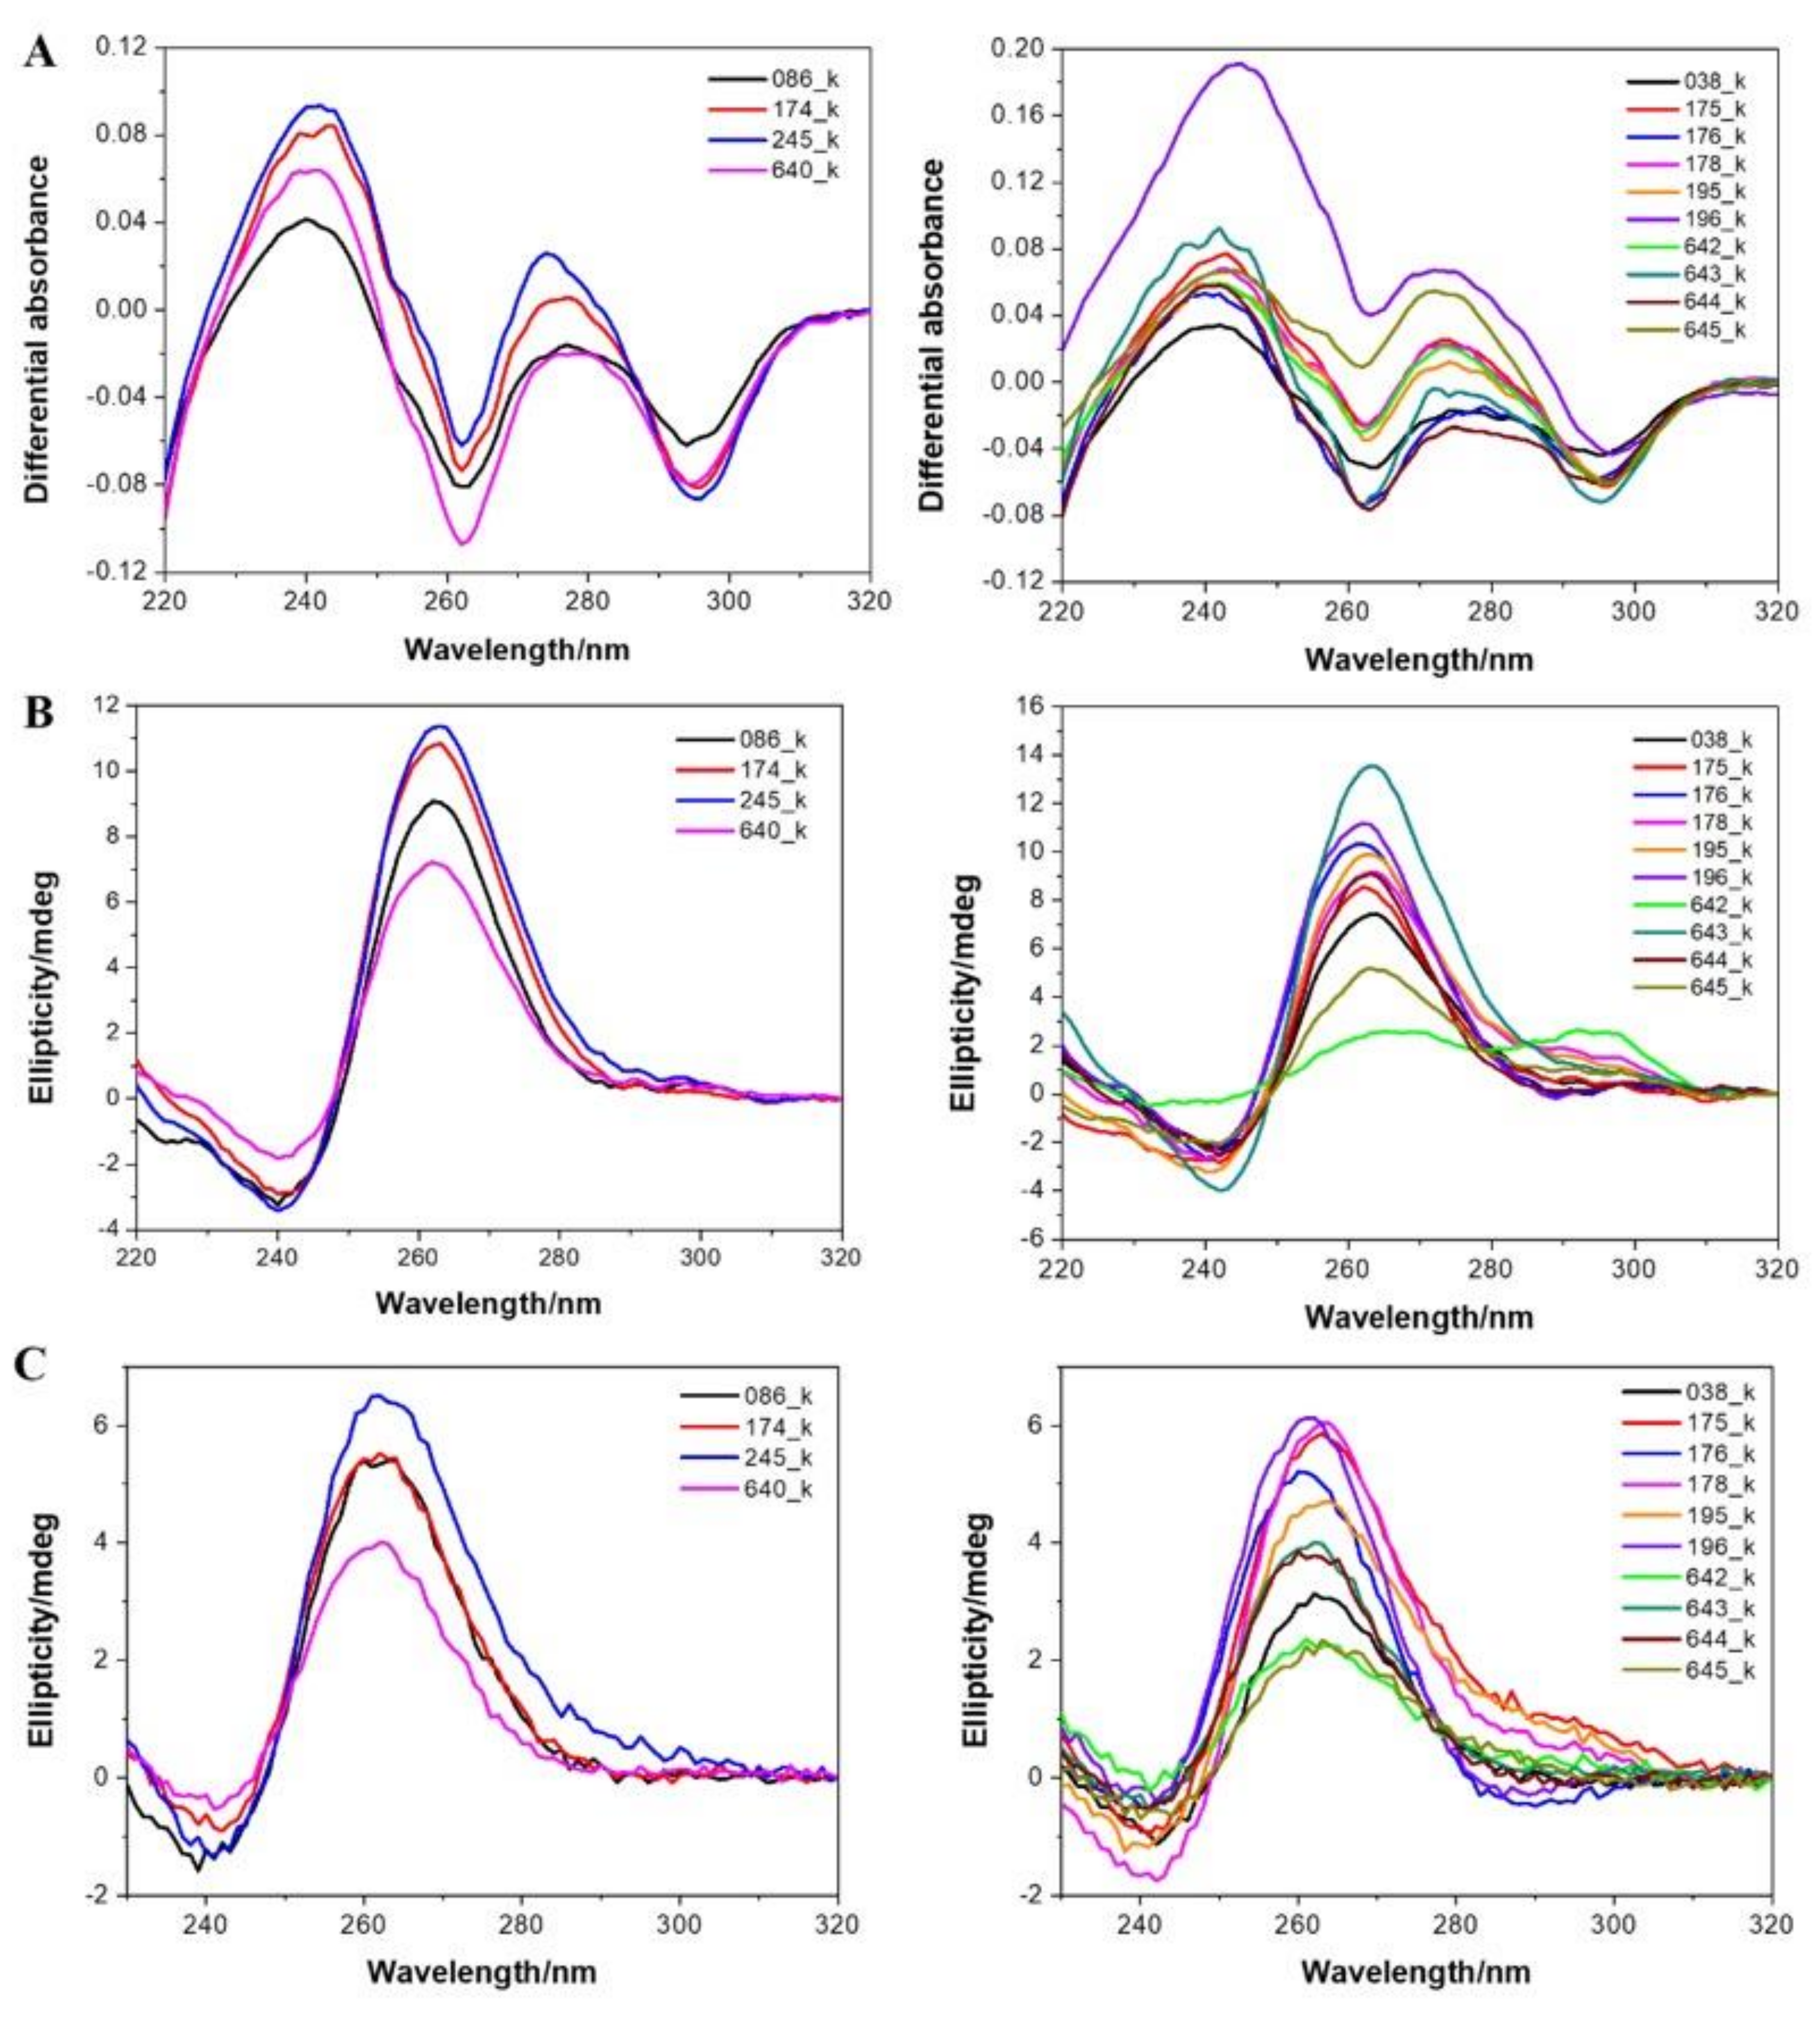
3.4. Experimental Demonstration of Quadruplex Formation In Vitro
3.5. G4-Binding Proteins from Archaea
4. Discussion
5. Conclusions
Supplementary Materials
Author Contributions
Funding
Conflicts of Interest
References
- Woese, C.R.; Fox, G.E. Phylogenetic structure of the prokaryotic domain: The primary kingdoms. Proc. Natl. Sci. Acad. USA 1977, 74, 5088–5090. [Google Scholar] [CrossRef]
- Olsen, G.J.; Woese, C.R. Archaeal genomics: An overview. Cell 1997, 89, 991–994. [Google Scholar] [CrossRef]
- Forterre, P. Archaea: What can we learn from their sequences? Curr. Opin. Genet. Dev. 1997, 7, 764–770. [Google Scholar] [CrossRef]
- Grüber, G.; Manimekalai, M.S.S.; Mayer, F.; Müller, V. ATP synthases from archaea: The beauty of a molecular motor. Biochim. Biophys. Acta 2014, 1837, 940–952. [Google Scholar] [CrossRef]
- Bolhuis, A. The archaeal Sec-dependent protein translocation pathway. Philos. Trans. R. Soc. Lond. B Biol. Sci. 2004, 359, 919–927. [Google Scholar] [CrossRef][Green Version]
- Samson, R.Y.; Dobro, M.J.; Jensen, G.J.; Bell, S.D. The Structure, Function and Roles of the Archaeal ESCRT Apparatus. Subcell. Biochem. 2017, 84, 357–377. [Google Scholar] [CrossRef]
- Spang, A.; Eme, L.; Saw, J.H.; Caceres, E.F.; Zaremba-Niedzwiedzka, K.; Lombard, J.; Guy, L.; Ettema, T.J.G. Asgard archaea are the closest prokaryotic relatives of eukaryotes. PLoS Genet. 2018, 14, e1007080. [Google Scholar] [CrossRef] [PubMed]
- Da Cunha, V.; Gaia, M.; Nasir, A.; Forterre, P. Asgard archaea do not close the debate about the universal tree of life topology. PLoS Genet. 2018, 14, e1007215. [Google Scholar] [CrossRef]
- Adam, P.S.; Borrel, G.; Brochier-Armanet, C.; Gribaldo, S. The growing tree of Archaea: New perspectives on their diversity, evolution and ecology. ISME J. 2017, 11, 2407. [Google Scholar] [CrossRef]
- Spang, A.; Caceres, E.F.; Ettema, T.J.G. Genomic exploration of the diversity, ecology, and evolution of the archaeal domain of life. Science 2017, 357. [Google Scholar] [CrossRef]
- Pennisi, E. Survey of archaea in the body reveals other microbial guests. Science 2017, 358, 983. [Google Scholar] [CrossRef] [PubMed]
- Chaudhary, P.P.; Conway, P.L.; Schlundt, J. Methanogens in humans: Potentially beneficial or harmful for health. Appl. Microbiol. Biotechnol. 2018, 102, 3095–3104. [Google Scholar] [CrossRef]
- Vuillemin, A.; Wankel, S.D.; Coskun, Ö.K.; Magritsch, T.; Vargas, S.; Estes, E.R.; Spivack, A.J.; Smith, D.C.; Pockalny, R.; Murray, R.W. Archaea dominate oxic subseafloor communities over multimillion-year time scales. Sci. Adv. 2019, 5, eaaw4108. [Google Scholar] [CrossRef]
- Jain, S.; Caforio, A.; Driessen, A.J.M. Biosynthesis of archaeal membrane ether lipids. Front. Microbiol. 2014, 5, 641. [Google Scholar] [CrossRef] [PubMed]
- Nobu, M.K.; Narihiro, T.; Kuroda, K.; Mei, R.; Liu, W.-T. Chasing the elusive Euryarchaeota class WSA2: Genomes reveal a uniquely fastidious methyl-reducing methanogen. ISME J. 2016, 10, 2478–2487. [Google Scholar] [CrossRef] [PubMed]
- Aouad, M.; Borrel, G.; Brochier-Armanet, C.; Gribaldo, S. Evolutionary placement of Methanonatronarchaeia. Nat. Microbiol. 2019, 4, 558–559. [Google Scholar] [CrossRef]
- Forterre, P. The universal tree of life: An update. Front. Microbiol. 2015, 6. [Google Scholar] [CrossRef]
- Dombrowski, N.; Lee, J.-H.; Williams, T.A.; Offre, P.; Spang, A. Genomic diversity, lifestyles and evolutionary origins of DPANN archaea. FEMS Microbiol. Lett. 2019, 366, fnz008. [Google Scholar] [CrossRef]
- Gaia, M.; Forterre, P. The Tree of Life. In Molecular Mechanisms of Microbial Evolution (Grand Challenges in Biology and Biotechnology); Rampelotto, P.H., Ed.; Springer: New York, NY, USA, 2018. [Google Scholar]
- Sun, Z.-Y.; Wang, X.-N.; Cheng, S.-Q.; Su, X.-X.; Ou, T.-M. Developing Novel G-Quadruplex Ligands: From Interaction with Nucleic Acids to Interfering with Nucleic Acid–Protein Interaction. Molecules 2019, 24, 396. [Google Scholar] [CrossRef]
- Harkness, R.W.; Mittermaier, A.K. G-quadruplex dynamics. BBA Proteins Proteomics 2017, 1865, 1544–1554. [Google Scholar] [CrossRef]
- Siddiqui-Jain, A.; Grand, C.L.; Bearss, D.J.; Hurley, L.H. Direct evidence for a G-quadruplex in a promoter region and its targeting with a small molecule to repress c-MYC transcription. Proc. Natl. Acad. Sci. USA 2002, 99, 11593–11598. [Google Scholar] [CrossRef] [PubMed]
- Lee, S.C.; Zhang, J.; Strom, J.; Yang, D.; Dinh, T.N.; Kappeler, K.; Chen, Q.M. G-Quadruplex in the NRF2 mRNA 5′ Untranslated Region Regulates De Novo NRF2 Protein Translation under Oxidative Stress. Mol. Cell. Biol. 2016, 37. [Google Scholar] [CrossRef] [PubMed]
- Crenshaw, E.; Leung, B.P.; Kwok, C.K.; Sharoni, M.; Olson, K.; Sebastian, N.P.; Ansaloni, S.; Schweitzer-Stenner, R.; Akins, M.R.; Bevilacqua, P.C.; et al. Amyloid Precursor Protein Translation is Regulated by a 3′UTR Guanine Quadruplex. PLoS ONE 2015, 10. [Google Scholar] [CrossRef] [PubMed]
- Gage, H.L.; Merrick, C.J. Conserved associations between G-quadruplex-forming DNA motifs and virulence gene families in malaria parasites. BMC Genomics 2020, 21, 236. [Google Scholar] [CrossRef]
- Gazanion, E.; Lacroix, L.; Alberti, P.; Gurung, P.; Wein, S.; Cheng, M.; Mergny, J.; Gomes, A.; Lopez-Rubio, J. Genome wide distribution of G-quadruplexes and their impact on gene expression in malaria parasites. PLoS Genetics 2020. [Google Scholar] [CrossRef]
- Cahoon, L.A.; Seifert, H.S. An alternative DNA structure is necessary for pilin antigenic variation in Neisseria gonorrhoeae. Science 2009, 325, 764–767. [Google Scholar] [CrossRef]
- Thakur, R.S.; Desingu, A.; Basavaraju, S.; Subramanya, S.; Rao, D.N.; Nagaraju, G. Mycobacterium tuberculosis DinG is a structure-specific helicase that unwinds G4 DNA implications for targeting g4 dna as a novel therapeutic approach. J. Biol. 2014, 289, 25112–25136. [Google Scholar]
- Mishra, S.K.; Shankar, U.; Jain, N.; Sikri, K.; Tyagi, J.S.; Sharma, T.K.; Mergny, J.-L.; Kumar, A. Characterization of G-Quadruplex Motifs in espB, espK, and cyp51 Genes of Mycobacterium tuberculosis as Potential Drug Targets. Mol. Ther. Nucleic. Acids 2019, 16, 698–706. [Google Scholar] [CrossRef]
- Brazda, V.; Haronikova, L.; Liao, J.C.; Fojta, M. DNA and RNA Quadruplex-Binding Proteins. Int. J. Mol. Sci. 2014, 15, 17493–17517. [Google Scholar] [CrossRef]
- Brázda, V.; Červeň, J.; Bartas, M.; Mikysková, N.; Coufal, J.; Pečinka, P. The Amino Acid Composition of Quadruplex Binding Proteins Reveals a Shared Motif and Predicts New Potential Quadruplex Interactors. Molecules 2018, 23, 2341. [Google Scholar] [CrossRef]
- Ribeyre, C.; Lopes, J.; Boulé, J.-B.; Piazza, A.; Guédin, A.; Zakian, V.A.; Mergny, J.-L.; Nicolas, A. The yeast Pif1 helicase prevents genomic instability caused by G-quadruplex-forming CEB1 sequences in vivo. PLoS Genet. 2009, 5, e1000475. [Google Scholar] [CrossRef]
- Bartas, M.; Čutová, M.; Brázda, V.; Kaura, P.; Šťastný, J.; Kolomazník, J.; Coufal, J.; Goswami, P.; Červeň, J.; Pečinka, P. The Presence and Localization of G-Quadruplex Forming Sequences in the Domain of Bacteria. Molecules 2019, 24, 1711. [Google Scholar] [CrossRef] [PubMed]
- Marguet, E.; Forterre, P. DNA stability at temperatures typical for hyperthermophiles. Nucleic Acids Res. 1994, 22, 1681–1686. [Google Scholar] [CrossRef] [PubMed]
- Ding, Y.; Fleming, A.M.; Burrows, C.J. Case studies on potential G-quadruplex-forming sequences from the bacterial orders Deinococcales and Thermales derived from a survey of published genomes. Sci. Rep. 2018. [Google Scholar] [CrossRef]
- Kota, S.; Dhamodharan, V.; Pradeepkumar, P.I.; Misra, H.S. G-quadruplex forming structural motifs in the genome of Deinococcus radiodurans and their regulatory roles in promoter functions. Appl. Microbiol. Biotechnol. 2015, 99, 9761–9769. [Google Scholar] [CrossRef] [PubMed]
- Mishra, S.; Chaudhary, R.; Singh, S.; Kota, S.; Misra, H.S. Guanine Quadruplex DNA Regulates Gamma Radiation Response of Genome Functions in the Radioresistant Bacterium Deinococcus radiodurans. J. Bacteriol. 2019, 201. [Google Scholar] [CrossRef] [PubMed]
- Todd, A.K.; Johnston, M.; Neidle, S. Highly prevalent putative quadruplex sequence motifs in human DNA. Nucleic Acids Res. 2005, 33, 2901–2907. [Google Scholar] [CrossRef]
- Huppert, J.L.; Balasubramanian, S. Prevalence of quadruplexes in the human genome. Nucleic Acids Res. 2005, 33, 2908–2916. [Google Scholar] [CrossRef]
- Eddy, J.; Maizels, N. Gene function correlates with potential for G4 DNA formation in the human genome. Nucleic Acids Res. 2006, 34, 3887–3896. [Google Scholar] [CrossRef] [PubMed]
- Bedrat, A.; Lacroix, L.; Mergny, J.L. Re-evaluation of G-quadruplex propensity with G4Hunter. Nucleic Acids Res. 2016. [Google Scholar] [CrossRef]
- Brázda, V.; Kolomazník, J.; Lýsek, J.; Bartas, M.; Fojta, M.; Šťastný, J.; Mergny, J.-L. G4Hunter web application: A web server for G-quadruplex prediction. Bioinformatics 2019, 35, 3493–3495. [Google Scholar] [CrossRef] [PubMed]
- Finan, T.M. The divided bacterial genome: Structure, function, and evolution. Microbiol. Mol. Biol. Rev. 2017, 81, e00019-17. [Google Scholar]
- Yadav, V.K.; Abraham, J.K.; Mani, P.; Kulshrestha, R.; Chowdhury, S. QuadBase: Genome-wide database of G4 DNA-occurrence and conservation in human, chimpanzee, mouse and rat promoters and 146 microbes. Nucleic Acids Res. 2008, 36, D381–D385. [Google Scholar] [CrossRef] [PubMed]
- Waller, Z.A.; Pinchbeck, B.J.; Buguth, B.S.; Meadows, T.G.; Richardson, D.J.; Gates, A.J. Control of bacterial nitrate assimilation by stabilization of G-quadruplex DNA. Chem. Commun. 2016, 52, 13511–13514. [Google Scholar] [CrossRef] [PubMed]
- Rawal, P.; Kummarasetti, V.B.R.; Ravindran, J.; Kumar, N.; Halder, K.; Sharma, R.; Mukerji, M.; Das, S.K.; Chowdhury, S. Genome-wide prediction of G4 DNA as regulatory motifs: Role in Escherichia coli global regulation. Genome Res. 2006, 16, 644–655. [Google Scholar] [CrossRef]
- Brázda, V.; Lýsek, J.; Bartas, M.; Fojta, M. Complex Analyses of Short Inverted Repeats in All Sequenced Chloroplast DNAs. BioMed Res. Int. 2018, 2018, 1097018. [Google Scholar] [CrossRef] [PubMed]
- Čechová, J.; Lýsek, J.; Bartas, M.; Brázda, V. Complex analyses of inverted repeats in mitochondrial genomes revealed their importance and variability. Bioinformatics 2018, 34, 1081–1085. [Google Scholar] [CrossRef] [PubMed]
- Cahoon, L.A.; Seifert, H.S. Transcription of a cis-acting, noncoding, small RNA is required for pilin antigenic variation in Neisseria gonorrhoeae. PLoS Pathog. 2013, 9, e1003074. [Google Scholar] [CrossRef] [PubMed]
- Neidle, S. The structures of quadruplex nucleic acids and their drug complexes. Curr. Opin. Struct. Biol. 2009, 19, 239–250. [Google Scholar] [CrossRef]
- Dhapola, P.; Chowdhury, S. QuadBase2: Web server for multiplexed guanine quadruplex mining and visualization. Nucleic Acids Res. 2016, 44, W277–W283. [Google Scholar] [CrossRef][Green Version]
- Sayers, E.W.; Agarwala, R.; Bolton, E.E.; Brister, J.R.; Canese, K.; Clark, K.; Connor, R.; Fiorini, N.; Funk, K.; Hefferon, T.; et al. Database resources of the National Center for Biotechnology Information. Nucleic Acids Res. 2019, 47, D23–D28. [Google Scholar] [CrossRef] [PubMed]
- Brázda, V.; Kolomazník, J.; Lỳsek, J.; Hároníková, L.; Coufal, J.; Št’astnỳ, J. Palindrome analyser—A new web-based server for predicting and evaluating inverted repeats in nucleotide sequences. Biochem. Biophys. Res. Commun. 2016, 478, 1739–1745. [Google Scholar] [CrossRef] [PubMed]
- Computational Tools—Pandas 0.25.1 Documentation. Available online: https://pandas.pydata.org/pandas-docs/stable/user_guide/computation.html (accessed on 16 October 2019).
- Suzuki, R.; Shimodaira, H. Pvclust: An R package for assessing the uncertainty in hierarchical clustering. Bioinformatics 2006, 22, 1540–1542. [Google Scholar] [CrossRef]
- Altschul, S.F.; Gish, W.; Miller, W.; Myers, E.W.; Lipman, D.J. Basic local alignment search tool. J. Mol. Biol. 1990, 215, 403–410. [Google Scholar] [CrossRef]
- Grant, C.E.; Bailey, T.L.; Noble, W.S. FIMO: Scanning for occurrences of a given motif. Bioinformatics 2011, 27, 1017–1018. [Google Scholar] [CrossRef] [PubMed]
- Bailey, T.L.; Boden, M.; Buske, F.A.; Frith, M.; Grant, C.E.; Clementi, L.; Ren, J.; Li, W.W.; Noble, W.S. MEME SUITE: Tools for motif discovery and searching. Nucleic Acids Res. 2009, 37, W202–W208. [Google Scholar] [CrossRef]
- Gertz, E.M.; Yu, Y.-K.; Agarwala, R.; Schäffer, A.A.; Altschul, S.F. Composition-based statistics and translated nucleotide searches: Improving the TBLASTN module of BLAST. BMC Biol. 2006, 4, 41. [Google Scholar] [CrossRef]
- Wernersson, R. Virtual Ribosome—A comprehensive DNA translation tool with support for integration of sequence feature annotation. Nucleic Acids Res. 2006, 34, W385–W388. [Google Scholar] [CrossRef]
- Artimo, P.; Jonnalagedda, M.; Arnold, K.; Baratin, D.; Csardi, G.; De Castro, E.; Duvaud, S.; Flegel, V.; Fortier, A.; Gasteiger, E. ExPASy: SIB bioinformatics resource portal. Nucleic Acids Res. 2012, 40, W597–W603. [Google Scholar] [CrossRef]
- Marchler-Bauer, A.; Derbyshire, M.K.; Gonzales, N.R.; Lu, S.; Chitsaz, F.; Geer, L.Y.; Geer, R.C.; He, J.; Gwadz, M.; Hurwitz, D.I.; et al. CDD: NCBI’s conserved domain database. Nucleic Acids Res. 2015, 43, D222–D226. [Google Scholar] [CrossRef]
- Čutová, M.; Manta, J.; Porubiaková, O.; Kaura, P.; Šťastný, J.; Jagelská, E.B.; Goswami, P.; Bartas, M.; Brázda, V. Divergent distributions of inverted repeats and G-quadruplex forming sequences in Saccharomyces cerevisiae. Genomics 2020, 112, 1897–1901. [Google Scholar] [CrossRef] [PubMed]
- Guo, J.U.; Bartel, D.P. RNA G-quadruplexes are globally unfolded in eukaryotic cells and depleted in bacteria. Science 2016, 353. [Google Scholar] [CrossRef] [PubMed]
- Galtier, N.; Tourasse, N.; Gouy, M. A nonhyperthermophilic common ancestor to extant life forms. Science 1999, 283, 220–221. [Google Scholar] [CrossRef]
- Klein, R.J.; Misulovin, Z.; Eddy, S.R. Noncoding RNA genes identified in AT-rich hyperthermophiles. Proc. Natl. Sci. Acad. USA 2002, 99, 7542–7547. [Google Scholar] [CrossRef] [PubMed]
- Lyons, S.M.; Gudanis, D.; Coyne, S.M.; Gdaniec, Z.; Ivanov, P. Identification of functional tetramolecular RNA G-quadruplexes derived from transfer RNAs. Nat. Commun. 2017, 8, 1127. [Google Scholar] [CrossRef]
- Gebetsberger, J.; Zywicki, M.; Künzi, A.; Polacek, N. tRNA-derived fragments target the ribosome and function as regulatory non-coding RNA in Haloferax volcanii. Archaea 2012, 2012, 260909. [Google Scholar] [CrossRef]
- Magnus, M.; Kappel, K.; Das, R.; Bujnicki, J.M. RNA 3D structure prediction guided by independent folding of homologous sequences. BMC Bioinf. 2019, 20, 512. [Google Scholar] [CrossRef]
- Kamura, T.; Katsuda, Y.; Kitamura, Y.; Ihara, T. G-quadruplexes in mRNA: A key structure for biological function. Biochem. Biophys. Res. Commun. 2020. [Google Scholar] [CrossRef]
- Qu, Z.; Adelson, D.L. Evolutionary conservation and functional roles of ncRNA. Front. Genet. 2012, 3. [Google Scholar] [CrossRef]
- Buddeweg, A.; Daume, M.; Randau, L.; Schmitz, R.A. Noncoding RNAs in Archaea: Genome-Wide Identification and Functional Classification. Meth. Enzymol. 2018, 612, 413–442. [Google Scholar] [CrossRef]
- Luo, H.; Gao, F. DoriC 10.0: An updated database of replication origins in prokaryotic genomes including chromosomes and plasmids. Nucleic Acids Res. 2019, 47, D74–D77. [Google Scholar] [CrossRef] [PubMed]
- Cossu, M.; Da Cunha, V.; Toffano-Nioche, C.; Forterre, P.; Oberto, J. Comparative genomics reveals conserved positioning of essential genomic clusters in highly rearranged Thermococcales chromosomes. Biochimie 2015, 118, 313–321. [Google Scholar] [CrossRef] [PubMed]
- Matsunaga, F.; Forterre, P.; Ishino, Y.; Myllykallio, H. In vivo interactions of archaeal Cdc6/Orc1 and minichromosome maintenance proteins with the replication origin. Proc. Natl. Acad. Sci. USA 2001, 98, 11152–11157. [Google Scholar] [CrossRef] [PubMed]
- Dueber, E.C.; Costa, A.; Corn, J.E.; Bell, S.D.; Berger, J.M. Molecular determinants of origin discrimination by Orc1 initiators in archaea. Nucleic Acids Res. 2011, 39, 3621–3631. [Google Scholar] [CrossRef]
- Norais, C.; Hawkins, M.; Hartman, A.L.; Eisen, J.A.; Myllykallio, H.; Allers, T. Genetic and physical mapping of DNA replication origins in Haloferax volcanii. PLoS Genet. 2007, 3, e77. [Google Scholar] [CrossRef]
- Wu, Z.; Liu, J.; Yang, H.; Liu, H.; Xiang, H. Multiple replication origins with diverse control mechanisms in Haloarcula hispanica. Nucleic Acids Res. 2013, 42, 2282–2294. [Google Scholar] [CrossRef]
- Zhuang, X.; Tang, J.; Hao, Y.; Tan, Z. Fast detection of quadruplex structure in DNA by the intrinsic fluorescence of a single-stranded DNA binding protein. J. Mol. Recognit. 2007, 20, 386–391. [Google Scholar] [CrossRef]
- Mendoza, O.; Bourdoncle, A.; Boulé, J.-B.; Brosh, R.M.; Mergny, J.-L. G-quadruplexes and helicases. Nucleic Acids Res. 2016, 44, 1989–2006. [Google Scholar] [CrossRef]
- Beaume, N.; Pathak, R.; Yadav, V.K.; Kota, S.; Misra, H.S.; Gautam, H.K.; Chowdhury, S. Genome-wide study predicts promoter-G4 DNA motifs regulate selective functions in bacteria: Radioresistance of D. radiodurans involves G4 DNA-mediated regulation. Nucleic Acids Res. 2013, 41, 76–89. [Google Scholar] [CrossRef]
- Gehring, K.; Leroy, J.-L.; Guéron, M. A tetrameric DNA structure with protonated cytosine-cytosine base pairs. Nature 1993, 363, 561–565. [Google Scholar] [CrossRef]
- Barrett, T.; Clark, K.; Gevorgyan, R.; Gorelenkov, V.; Gribov, E.; Karsch-Mizrachi, I.; Kimelman, M.; Pruitt, K.D.; Resenchuk, S.; Tatusova, T.; et al. BioProject and BioSample databases at NCBI: Facilitating capture and organization of metadata. Nucleic Acids Res. 2012, 40, D57–D63. [Google Scholar] [CrossRef] [PubMed]
- Bartas, M.; Brázda, V.; Karlický, V.; Červeň, J.; Pečinka, P. Bioinformatics analyses and in vitro evidence for five and six stacked G-quadruplex forming sequences. Biochimie 2018, 150, 70–75. [Google Scholar] [CrossRef]
- Risitano, A.; Fox, K.R. Stability of Intramolecular DNA Quadruplexes: Comparison with DNA Duplexes. Biochemistry 2003, 42, 6507–6513. [Google Scholar] [CrossRef]
- Couturier, M.; Gadelle, D.; Forterre, P.; Nadal, M.; Garnier, F. The reverse gyrase TopR1 is responsible for the homeostatic control of DNA supercoiling in the hyperthermophilic archaeon Sulfolobus solfataricus. Mol. Microbiol. 2020, 113, 356–368. [Google Scholar] [CrossRef] [PubMed]
- Chambers, V.S.; Marsico, G.; Boutell, J.M.; Di Antonio, M.; Smith, G.P.; Balasubramanian, S. High-throughput sequencing of DNA G-quadruplex structures in the human genome. Nat. Biotechnol. 2015, 33, 877. [Google Scholar] [CrossRef]
- Hänsel-Hertsch, R.; Spiegel, J.; Marsico, G.; Tannahill, D.; Balasubramanian, S. Genome-wide mapping of endogenous G-quadruplex DNA structures by chromatin immunoprecipitation and high-throughput sequencing. Nat. Protoc. 2018, 13, 551. [Google Scholar] [CrossRef] [PubMed]
- Hänsel-Hertsch, R.; Di Antonio, M.; Balasubramanian, S. DNA G-quadruplexes in the human genome: Detection, functions and therapeutic potential. Nat. Rev. Mol. Cell. Biol. 2017, 18, 279. [Google Scholar] [CrossRef]


| Archaea (GC %) | Number of G4 Sequences Found for a Window of: | |||
|---|---|---|---|---|
| 25 nt | 30 nt | 50 nt | 100 nt | |
| Methanococcus maripaludis C7 (33.3%) | 558 | 171 | 3 | 0 |
| Cenarchaeum symbiosum A (57.3%) | 6019 | 3197 | 324 | 5 |
| Halobacterium salinarum NRC (65.9%) | 4738 | 2313 | 262 | 4 |
| G4HS | Number of PQS in Dataset | Fraction of All PQS | PQS Frequency Per kbp |
|---|---|---|---|
| 1.2–1.4 | 4,344,917 | 0.9718 | 1.19 |
| 1.4–1.6 | 119,233 | 0.0267 | 1.8 × 10⁻² |
| 1.6–1.8 | 6357 | 0.00142 | 9.9 × 10⁻⁴ |
| 1.8–2.0 | 174 | 0.0000389 | 2.5 × 10⁻⁵ |
| >2.0 | 132 | 0.0000295 | 2.2 × 10⁻⁵ |
| Total | 4,470,813 | 1 |
| Kingdom | Seq. | Median | Short | Long | GC % | PQS | Mean f | Min f | Max f | % PQS |
|---|---|---|---|---|---|---|---|---|---|---|
| Archeae | 3387 | 1,686,930 | 100,212 | 13,399,915 | 46.51 | 7,927,775 | 1.21 | 0.04 | 15.31 | 3.58 |
| Superphylum | Seq. | Median | Short | Long | GC % | PQS | Mean f | Min f | Max f | % PQS |
| BAT | 320 | 1,180,629 | 164,795 | 3,506,105 | 43.07 | 421,678 | 1.16 | 0.05 | 8.42 | 3.49 |
| Cren | 379 | 1,808,184 | 210,860 | 6,451,204 | 43.05 | 1,009,660 | 1.56 | 0.09 | 9.44 | 4.75 |
| Asgard | 71 | 2,322,715 | 291,515 | 5,684,038 | 38.75 | 74,647 | 0.47 | 0.12 | 1.50 | 1.39 |
| DPANN | 309 | 832,169 | 100,212 | 6,604,953 | 39.22 | 219,058 | 0.70 | 0.08 | 4.20 | 2.18 |
| Eury | 2308 | 1,826,841 | 137,797 | 13,399,915 | 48.77 | 6,202,732 | 1.25 | 0.04 | 15.31 | 3.68 |
| Phylum | Seq. | Median | Short | Long | GC % | PQS | Mean f | Min f | Max f | % PQS |
| Bathyarchaeota | 128 | 1,208,976.5 | 200,493 | 3,506,105 | 46.29 | 245,162 | 1.54 | 0.23 | 8.42 | 3.00 |
| Thaumarchaeota | 192 | 1,173,909.5 | 164,795 | 3,441,569 | 40.93 | 176,516 | 0.91 | 0.05 | 5.32 | 2.73 |
| Thermoproteales | 147 | 1,581,744 | 242,587 | 3,969,448 | 45.86 | 513,053 | 2.07 | 0.11 | 7.38 | 6.31 |
| Sulfolobales | 118 | 2,223,757.5 | 210,860 | 3,034,024 | 38.20 | 200,842 | 0.79 | 0.34 | 4.58 | 2.38 |
| Desulfurococcales | 29 | 1,580,347 | 807,477 | 2,148,448 | 46.99 | 99,211 | 2.29 | 0.40 | 6.37 | 6.95 |
| Verstraetearchaeota | 18 | 1,171,913.5 | 419,172 | 1,937,662 | 46.76 | 40,586 | 1.83 | 0.10 | 3.43 | 5.50 |
| Marsarchaeota | 15 | 1,915,630 | 351,358 | 3,731,392 | 46.72 | 52,853 | 1.64 | 0.47 | 2.94 | 5.01 |
| Geothermarchaeota | 6 | 1,183,145.5 | 803,797 | 1,671,866 | 42.72 | 16,582 | 2.15 | 0.96 | 7.03 | 6.65 |
| Nezhaarchaeota | 2 | 1,332,140.5 | 1,315,707 | 1,348,574 | 43.53 | 2016 | 0.76 | 0.75 | 0.77 | 2.27 |
| Korarchaeota | 18 | 1,542,873 | 834,209 | 2,942,065 | 48.39 | 68,434 | 2.63 | 1.05 | 9.44 | 7.95 |
| Unclassified Crenarchaeota | 27 | 1,203,892 | 301,027 | 6,451,204 | 37.01 | 19,361 | 0.44 | 0.09 | 1.49 | 1.29 |
| Lokiarchaeota | 29 | 1,892,624 | 320,847 | 5,143,417 | 32.77 | 25,479 | 0.41 | 0.21 | 1.50 | 1.24 |
| Odinarchaeota | 1 | 1,460,710 | 1,460,710 | 1,460,710 | 38.05 | 1038 | 0.71 | 0.71 | 0.71 | 2.16 |
| Thorarchaeota | 29 | 2,770,204 | 291,515 | 4,389,059 | 46.55 | 40,006 | 0.60 | 0.24 | 1.18 | 1.76 |
| Heimdallarchaeota | 12 | 2,167,091 | 432,340 | 5,684,038 | 34.42 | 8124 | 0.27 | 0.12 | 0.50 | 0.82 |
| Aenigmarchaeota | 35 | 751,672 | 248,182 | 1,410,470 | 39.33 | 17,990 | 0.71 | 0.11 | 3.78 | 2.12 |
| Nanohaloarchaeota | 17 | 815,638 | 565,289 | 1,480,846 | 44.53 | 8672 | 0.48 | 0.09 | 1.82 | 1.50 |
| Woesearchaeota | 72 | 966,794.5 | 518,295 | 2,944,567 | 40.77 | 57,833 | 0.66 | 0.08 | 3.92 | 1.96 |
| Pacearchaeota | 60 | 719,507 | 279,432 | 6,604,953 | 33.74 | 37,675 | 0.56 | 0.08 | 2.99 | 1.73 |
| Nanoarchaeota | 25 | 577,110 | 204,081 | 1,162,239 | 32.83 | 9940 | 0.59 | 0.13 | 4.20 | 1.70 |
| Micrarchaeota | 39 | 887,931 | 658,716 | 1,333,875 | 50.41 | 42,298 | 1.17 | 0.15 | 2.86 | 3.47 |
| Diapherotrites | 19 | 568,419 | 302,064 | 1,130,899 | 37.42 | 6077 | 0.49 | 0.11 | 2.33 | 1.46 |
| Unclassified DPANN | 40 | 858,043.5 | 100,212 | 3,188,023 | 35.57 | 33,846 | 0.67 | 0.15 | 2.39 | 2.04 |
| Hadesarchaeota | 12 | 857,575 | 451,393 | 1,241,441 | 53.77 | 56,369 | 4.61 | 1.26 | 15.31 | 14.55 |
| Persephonarchaeota | 33 | 637,942 | 137,797 | 1,412,535 | 44.06 | 34,905 | 1.49 | 0.59 | 2.36 | 4.49 |
| Thermococcales | 60 | 1,867,904.5 | 207,909 | 2,388,527 | 46.77 | 191,492 | 1.72 | 0.47 | 7.53 | 5.15 |
| Theinoarchaeota | 2 | 4,165,806 | 3,559,548 | 4,772,064 | 41.57 | 5480 | 0.66 | 0.65 | 0.67 | 1.94 |
| Methanofastidiosa | 96 | 992,372 | 156,656 | 13,399,915 | 40.71 | 141,192 | 0.83 | 0.08 | 3.64 | 2.54 |
| Methanococcales | 24 | 1,717,483 | 1,207,361 | 1,936,387 | 32.01 | 15,065 | 0.39 | 0.20 | 0.86 | 1.19 |
| Methanobacteriales | 224 | 2,001,036 | 1,157,521 | 3,466,370 | 33.62 | 175,191 | 0.39 | 0.04 | 2.32 | 1.14 |
| Methanopyrales | 3 | 1,430,309 | 1,421,621 | 1,694,969 | 58.94 | 10,798 | 2.34 | 1.97 | 3.00 | 6.84 |
| Methanomassilicoccales | 91 | 1,404,109 | 640,223 | 2,641,216 | 56.22 | 257,340 | 1.85 | 0.22 | 4.41 | 5.38 |
| Thermoplasmatales | 135 | 1,621,237 | 593,453 | 2,816,557 | 42.71 | 246,832 | 1.13 | 0.11 | 7.03 | 3.42 |
| Acidoprofondum/DHV2-2 | 11 | 1,731,076 | 519,420 | 2,981,805 | 40.55 | 16,609 | 1.21 | 0.29 | 4.12 | 3.59 |
| Archaeoglobales | 53 | 1,901,943 | 478,535 | 3,408,041 | 42.98 | 117,470 | 1.22 | 0.57 | 3.29 | 3.66 |
| Methanosarcinales | 279 | 2,913,215 | 208,261 | 5,751,492 | 44.99 | 845,394 | 1.19 | 0.15 | 7.52 | 3.54 |
| Methanomicrobiales | 146 | 2,228,967.5 | 622,799 | 3,978,804 | 54.97 | 783,172 | 2.38 | 0.23 | 7.20 | 7.07 |
| Methanocellales | 5 | 2,957,635 | 1,465,272 | 3,243,770 | 50.96 | 16,825 | 1.21 | 0.41 | 1.88 | 3.51 |
| Halobacteriales | 440 | 3,585,981 | 397,623 | 5,605,381 | 63.95 | 2,271,600 | 1.56 | 0.08 | 4.25 | 4.50 |
| Unclassified Diaforarchaea | 97 | 1,460,542 | 233,168 | 2,294,894 | 47.38 | 136,115 | 1.03 | 0.18 | 2.55 | 3.02 |
| Unclassified other | 597 | 1,400,198 | 258,312 | 7,416,915 | 46.88 | 862,962 | 1.02 | 0.07 | 5.16 | 3.00 |
| Name | Sequences (5′ to 3′) | G4 Hunter Score | IDS | CD |
|---|---|---|---|---|
| 038_K | AGGCTGGGGGTGAGGGCGGTGGTGGGGAAGGGAGGGGTGGGGGAGAAAACGAAGGGGGT | 2.07 | G4 | Parallel |
| 086_K | TGGGGAGGAGGGGAGGGGAGGTGGGCTGGGGGGGGCT | 2.57 | G4 | Parallel |
| 174_K | AGGGTGAGGGAGGAGGTGCTGGGGGGAAGGGAGGTGGGGGAGGGGGAGGTGGAGGGGCTGGTGAGGGA | 2.07 | G4 | Parallel |
| 175_K | AGGGGAGGAGGGTGGCCGTGGTGGGGGCGGGGGGAGGGGCGGGGGTGGGGGGGCCTGGGGGGA | 2.54 | G4 | Parallel |
| 176_K | AGGAGGAGGGTGAGGGACCAGGGGAGGAGGGAGGGGAGGGGGGGAAGGAGGAGGGAGAGGAGGAGGGA | 1.93 | G4 | Parallel |
| 178_K | TGGTGGGGGCGGGGGGAGGGGCGGGGGTGGGGGGGCCTGGGGGGA | 2.89 | G4 | Parallel |
| 195_K | AGGGGAGGAGGGTGGCCGTGGTGGGGGCGGGGGGAGGGGCGGGGGTGGCCTCCACGGA | 1.91 | G4 | Parallel |
| 196_K | AGGGGAGGAGGGAGGGGAGGGGGGGAAGGAGGAGGGAGAGGAGGAGGGA | 2.22 | G4 | Parallel |
| 245_K | GGGGTCGTCGGGGGGGAGAGCTGGGGAGGAGGGGAGGGGAGGTGGGCTGGGGGGGGCTGGGGAGGGAGGAGGTGAGGGG | 2.33 | G4 | Parallel |
| 640_K | AGGGAGGTGGGGGAGGGGGAGGTGGAGGGGCT | 2.38 | G4 | Parallel |
| 642_K | TGGTGGGGGCGGGGGGAGGGGCGGGGGT | 2.93 | G4 | Hybrid* |
| 643_K | AGGCTGGGGGTGAGGGCGGTGGTGGGGAAGGGAGGGGTGGGGGAGAAAACGAAGGGGGT | 2.07 | G4 | Parallel |
| 644_K | AGGGCGGTGGTGGGGAAGGGAGGGGTGGGGGA | 2.41 | G4 | Parallel |
| 645_K | GGCGGGGGGGGAGTCCTTCATCCTGGGGTAGGGG | 1.74 | G4 | Parallel |
| Organism Name | GC Content | PQS f | % PQS | Living Environment (Isolated from) |
|---|---|---|---|---|
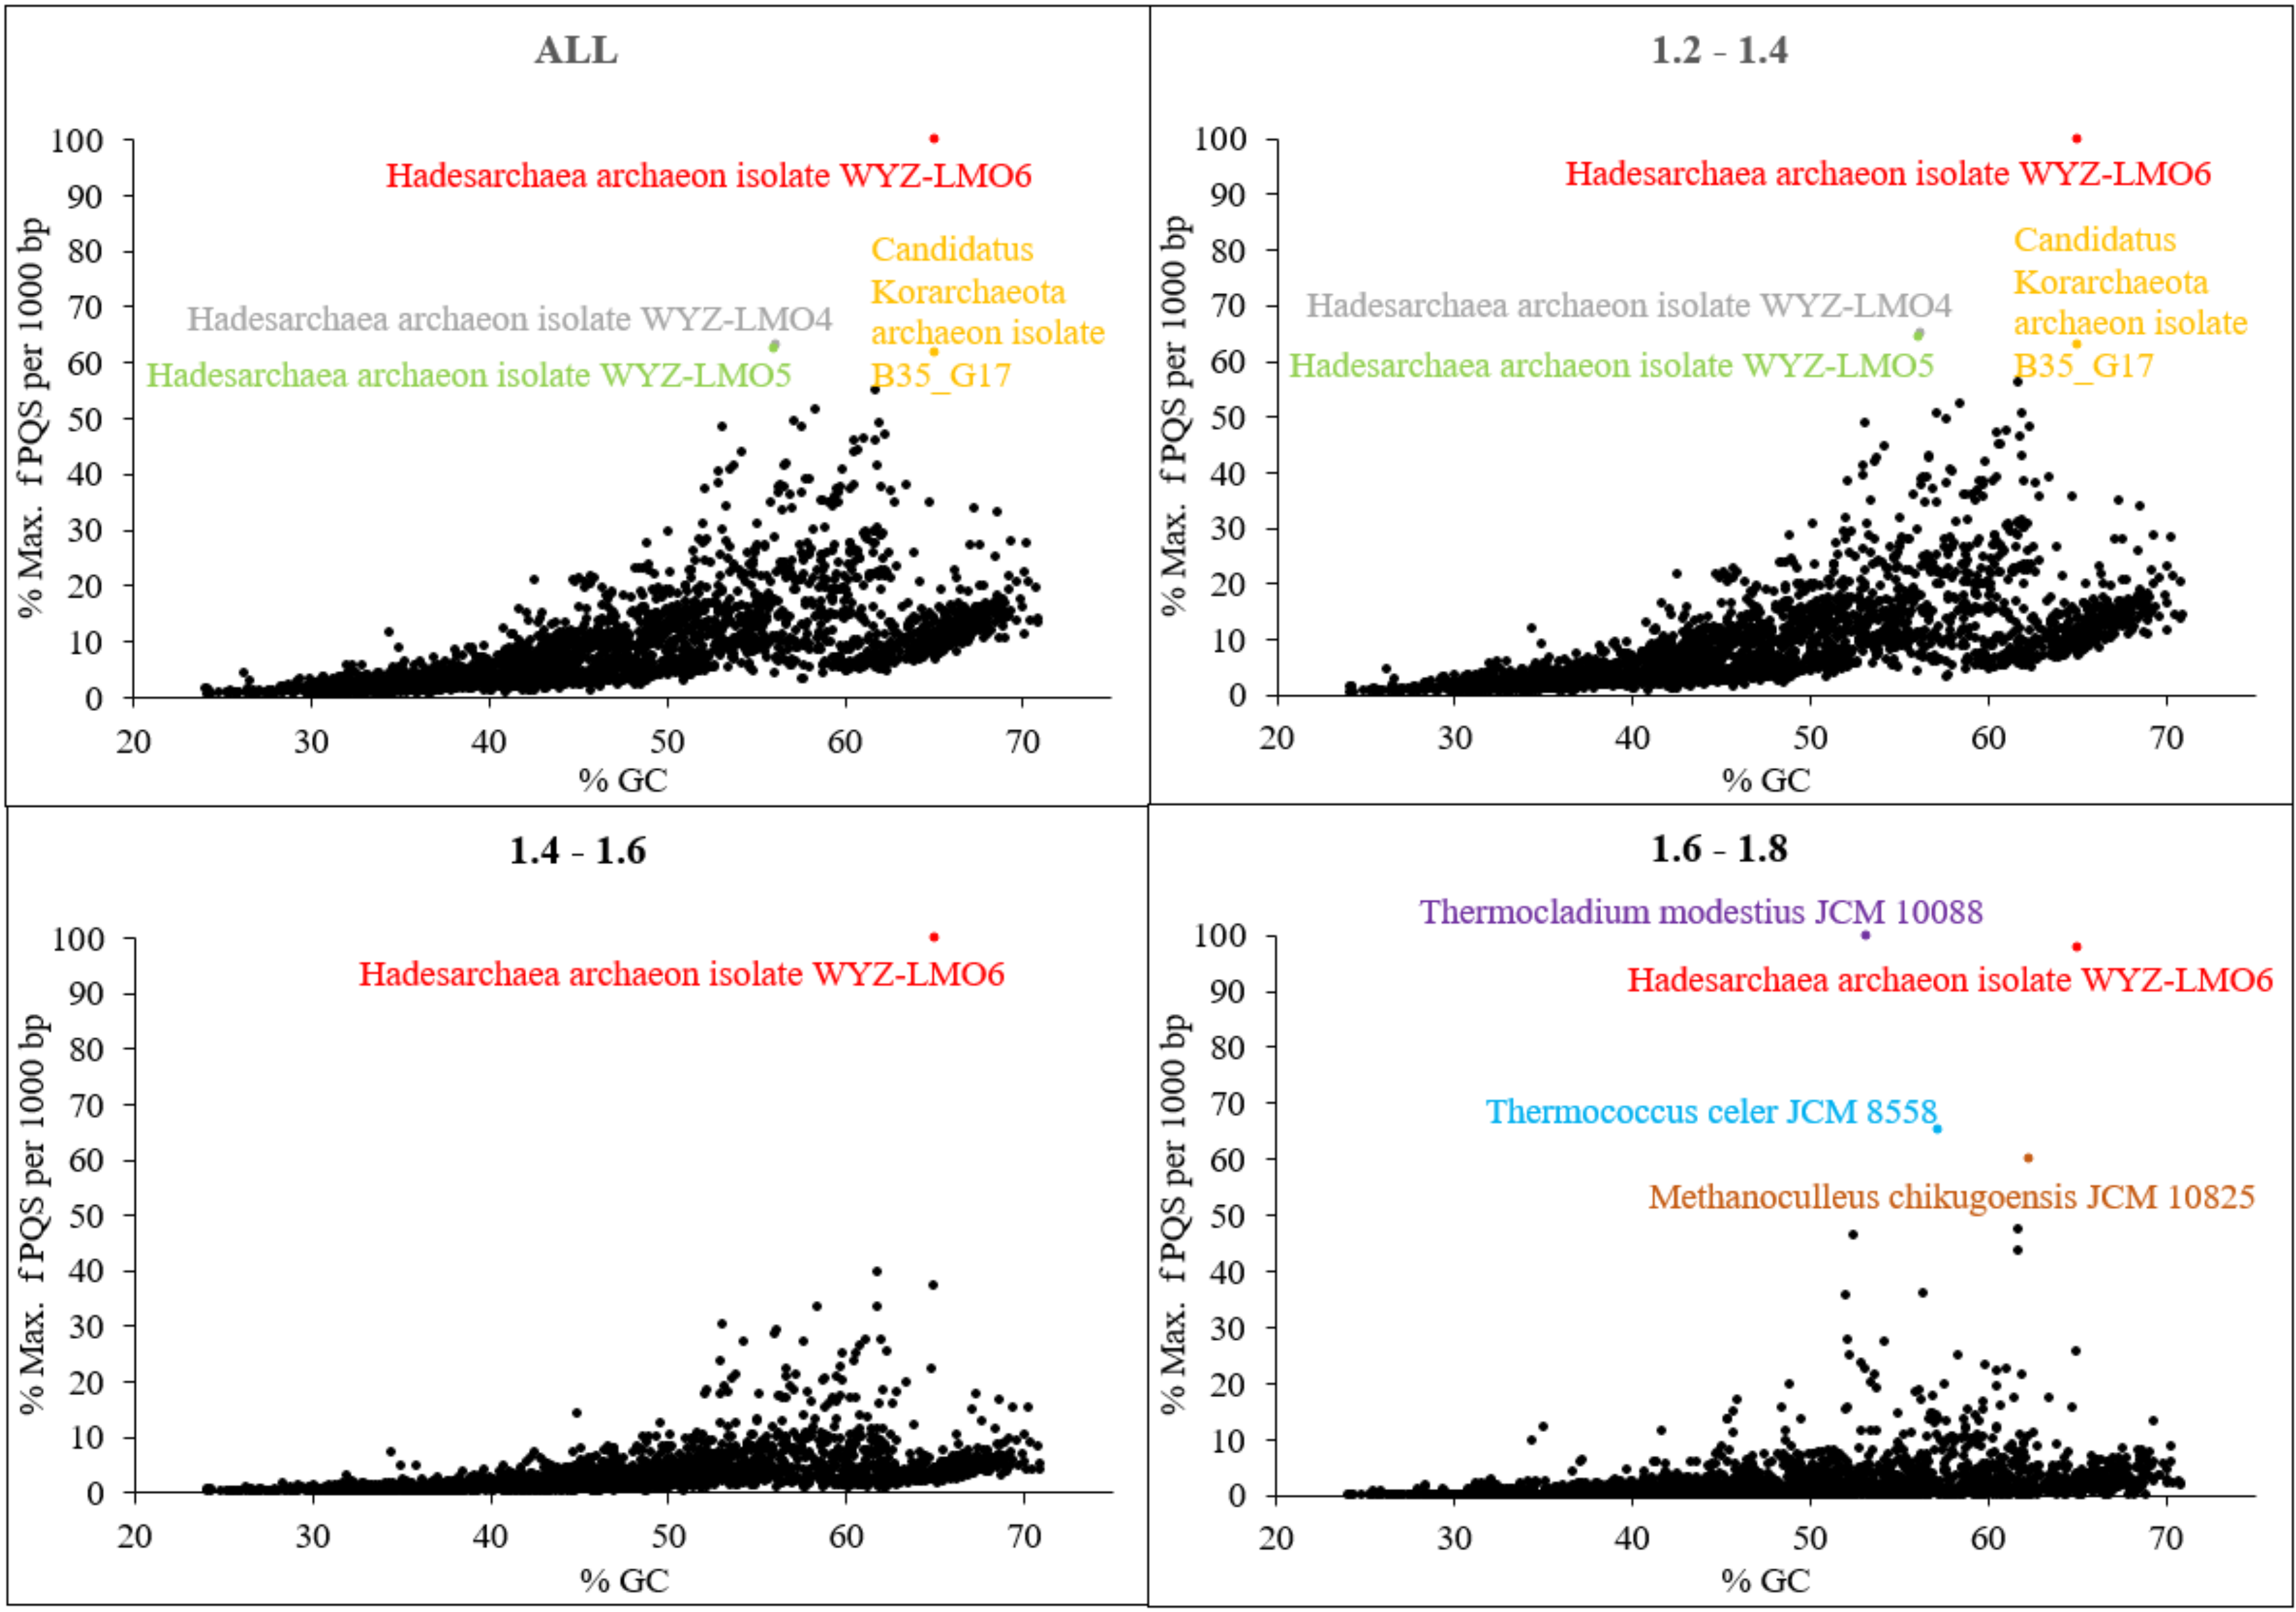
| Hadesarchaea archaeon isolate WYZ-LMO6 | 65.01 | 15.310 | 51.15 | Hot springs sediment, Yellowstone NP, USA |
| Hadesarchaea archaeon isolate WYZ-LMO4 | 56.17 | 9.685 | 31.10 | Hot springs sediment, Jinze hot spring, China |
| Hadesarchaea archaeon isolate WYZ-LMO5 | 56.04 | 9.581 | 30.69 | Hot springs sediment, Jinze hot spring, China |
| Korarchaeota archaeon isolate B35_G17 | 65.01 | 9.445 | 28.80 | Deep-sea hydrothermal vent sediments, Guaymas Basin, Gulf of California, Mexico |
| Bathyarchaeota archaeon B23 | 61.78 | 8.418 | 26.12 | Deep-sea hydrothermal vent sediments, Guaymas Basin, Gulf of California, Mexico |
| Bathyarchaeota archaeon isolate M10_bin139 | 58.42 | 7.858 | 24.55 | Deep-sea hydrothermal vent sediments, Guaymas Basin, Gulf of California, Mexico |
| Thermococcus celer JCM 8558 | 57.21 | 7.534 | 24.52 | Solfataric marine water hole on a beach of Vulcano, Italy |
| Methanosaeta harundinacea isolate UBA152 | 62.01 | 7.518 | 23.12 | Waste water, Suncor tailings pond 6, Canada |
| Bathyarchaeota archaeon isolate B23_G15 | 57.67 | 7.397 | 22.90 | Deep-sea hydrothermal vent sediments, Guaymas Basin, Gulf of California, Mexico |
| Thermocladium modestius JCM 10088 | 53.14 | 7.381 | 25.59 | Mud from a spring pool, Noji-onsen, Fukushima, Japan |
| Methanoculleus chikugoensis JCM 10825 | 62.36 | 7.198 | 22.90 | Paddy field soil, Chikugo, Fukuoka, Japan |
| Methanosaeta harundinacea isolate UBA281 | 61.14 | 7.089 | 21.80 | Wastewater, North Alberta, Canada |
| Geothermarchaeota archaeon ex4572_27 | 60.54 | 7.032 | 22.01 | Deep-sea hydrothermal vent sediments, Guaymas Basin, Gulf of California, Mexico |
| Thermoplasmata archaeon isolate CSSed11_322R1 | 61.82 | 7.028 | 22.57 | Hypersaline soda lake sediment, Kulunda Steppe, Russia |
| Methanosarcinales archaeon Methan_02 | 60.8 | 6.738 | 20.67 | Anaerobic digester metagenome, Australia |
| Methanosaeta harundinacea 6Ac | 60.6 | 6.721 | 20.66 | isolated from an upflow anaerobic sludge blanket reactor treating beer-manufacture wastewater in Beijing, China. (ref PMID:16403877) |
| Thermoplasmatales archaeon ex4484_36 | 54.25 | 6.673 | 21.15 | Deep-sea hydrothermal vent sediments, Guaymas Basin, Gulf of California, Mexico |
| Aeropyrum camini SY1 = JCM 12091 | 56.73 | 6.370 | 19.72 | Deep-sea hydrothermal vent chimney, the Suiyo Seamount in the Izu-Bonin Arc, Japan |
| Bathyarchaeota archaeon isolate B46_G17 | 61.92 | 6.332 | 19.03 | Deep-sea hydrothermal vent sediments, Guaymas Basin, Gulf of California, Mexico |
| Thermoplasmata archaeon isolate B14_G15 | 53.83 | 6.327 | 20.11 | Deep-sea hydrothermal vent sediments, Guaymas Basin, Gulf of California, Mexico |
| Thermoplasmata archaeon isolate B23_G1 | 53.66 | 6.240 | 19.72 | Deep-sea hydrothermal vent sediments, Guaymas Basin, Gulf of California, Mexico |
| Pyrobaculum neutrophilum V24Sta | 59.91 | 6.233 | 19.52 | isolated from a hot spring in Iceland |
| Thermoplasmata archaeon isolate B23_G9 | 52.98 | 6.164 | 19.65 | Deep-sea hydrothermal vent sediments, Guaymas Basin, Gulf of California, Mexico |
© 2020 by the authors. Licensee MDPI, Basel, Switzerland. This article is an open access article distributed under the terms and conditions of the Creative Commons Attribution (CC BY) license (http://creativecommons.org/licenses/by/4.0/).
Share and Cite
Brázda, V.; Luo, Y.; Bartas, M.; Kaura, P.; Porubiaková, O.; Šťastný, J.; Pečinka, P.; Verga, D.; Da Cunha, V.; Takahashi, T.S.; et al. G-Quadruplexes in the Archaea Domain. Biomolecules 2020, 10, 1349. https://doi.org/10.3390/biom10091349
Brázda V, Luo Y, Bartas M, Kaura P, Porubiaková O, Šťastný J, Pečinka P, Verga D, Da Cunha V, Takahashi TS, et al. G-Quadruplexes in the Archaea Domain. Biomolecules. 2020; 10(9):1349. https://doi.org/10.3390/biom10091349
Chicago/Turabian StyleBrázda, Václav, Yu Luo, Martin Bartas, Patrik Kaura, Otilia Porubiaková, Jiří Šťastný, Petr Pečinka, Daniela Verga, Violette Da Cunha, Tomio S. Takahashi, and et al. 2020. "G-Quadruplexes in the Archaea Domain" Biomolecules 10, no. 9: 1349. https://doi.org/10.3390/biom10091349
APA StyleBrázda, V., Luo, Y., Bartas, M., Kaura, P., Porubiaková, O., Šťastný, J., Pečinka, P., Verga, D., Da Cunha, V., Takahashi, T. S., Forterre, P., Myllykallio, H., Fojta, M., & Mergny, J.-L. (2020). G-Quadruplexes in the Archaea Domain. Biomolecules, 10(9), 1349. https://doi.org/10.3390/biom10091349